 Melanie Grotz
 Lieke van Gijzel
 Peter Bitsch3
 Stefania C. Carrara
 Harald Kolmar
 Sakshi Garg
94% of researchers rate our articles as excellent or good
Learn more about the work of our research integrity team to safeguard the quality of each article we publish.
Find out more
ORIGINAL RESEARCH article
Front. Drug Discov. , 26 July 2024
Sec. Technologies and Strategies to Enable Drug Discovery
Volume 4 - 2024 | https://doi.org/10.3389/fddsv.2024.1427407
This article is part of the Research Topic Next Generation Micro-Physiological Systems for Pragmatic Use in Regular Industrial Workflow View all 5 articles
Targeting the tumor microenvironment (TME) is an attractive strategy for cancer therapy, as tumor cells in vivo are surrounded by many different influential cell types, with complex interactions strongly affecting tumor progression and therapeutic outcome. Cancer-associated fibroblasts (CAFs) represent an abundant stromal cell type in the TME that modulate tumor development by exerting an immunosuppressive effect to influence effector immune cell activation. One promising target for TME-directed therapy is the CAF marker fibroblast activation protein-α (FAP). In this study, we employ a multicellular three-dimensional (3D) spheroid model, including tumor cells, fibroblast cells, and naïve T cells and could observe a protective effect of fibroblasts on tumor cells. Subsequently, we demonstrate that fibroblasts express FAP at differing expression levels in two-dimensional (2D) versus 3D cells. Lastly, we show that in a triple-culture of tumor cells, T cells and fibroblasts, the simultaneous assembly of fibroblasts using the high-affinity ligand oncoFAP with an engineered α-CD3-scFv-Fc-dextran-oncoFAP construct resulted in effective T cell activation to augment immunogenicity. Overall, this model can be routinely used for preclinical screening to study the effects of fibroblasts on the TME in vitro.
In vivo, cells develop and grow as three-dimensional (3D) structures that alter cellular behavior through cell-cell and cell-extracellular matrix (ECM) interactions (Baal et al., 2009; Edmondson et al., 2014; Breslin and O Driscoll, 2016). Cell behavior, disease mechanisms, and the efficacy of potential therapeutic molecules are mostly investigated in two-dimensional (2D) monolayer cells (Breslin and O Driscoll, 2013; Kapałczyńska et al., 2016). Culturing cells in 3D affects a variety of morphological and cellular mechanisms, including differentiation, gene expression profile, as well as the responsiveness to therapeutic agents, which is usually more physiological than 2D cultures (Ghosh et al., 2005; Baharvand et al., 2006; Tung et al., 2011; Ma et al., 2012; Breslin and O Driscoll, 2016). Within tumor spheroids, layered structures can arise due to physiochemical gradients caused by diffusion barriers, with a necrotic core surrounded by quiescent cells and an outer proliferating zone (Acker et al., 1987; Alvarez-Pérez et al., 2005; Nath and Devi, 2016).
However, in vivo tumors are additionally surrounded by several distinct cell types that actively influence and promote carcinogenesis (Hanahan and Weinberg, 2011; Anderson and Simon, 2020). The tumor microenvironment (TME) encompasses a heterogeneous assembly of host cells and secreted factors, such as blood vessels, recruited immune cells including immunosuppressive regulatory T cells (Treg), fibroblasts, cancer-associated fibroblasts (CAFs), and the ECM (Place et al., 2011; Anderson and Simon, 2020). The immune cells can either suppress or enhance tumor progression (Anderson and Simon, 2020). Here, interactions between immune cells and tumor cells are often lacking, as T cells are mostly restricted to the stromal matrix-rich area (Salmon et al., 2012).
CAFs are the most represented stromal cell population in the TME, associated with poor clinical prognosis due to their immunosuppressive and tumor-promoting effects and appear to originate from fibroblasts found in wound healing (Rønnov-Jessen et al., 1995; Rønnov-Jessen et al., 1996; Orimo et al., 2005; Yamashita et al., 2012; Augsten et al., 2014). In the TME, CAFs are the main producers of ECM components, affecting crosstalk with immune cells, as well as tumor cells (An et al., 2020; Anderson and Simon, 2020). Furthermore, cytotoxic T cells can be suppressed by CAFs for tumor defense (Lakins et al., 2018). This heterogeneous stromal cell population can be characterized by several markers, such as α-smooth muscle actin (α-SMA), and fibroblast activation protein-α (FAP) (Garin-Chesa et al., 1990; Lazard et al., 1993; Costa et al., 2018). FAP was identified in activated fibroblasts to be involved in wound healing, chronic inflammation, and tumor growth (Garin-Chesa et al., 1990). FAP is a 97 kDa type II transmembrane serine protease and modulates the ECM through its dipeptidyl peptidase and collagenase activity (Scanlan et al., 1994; Goldstein et al., 1997; Piñeiro-Sánchez et al., 1997; Park et al., 1999). It is upregulated in various cancers and low or absent in normal tissues and contributes to immunosuppression (Garin-Chesa et al., 1990; Kraman et al., 2010; Feig et al., 2013; Fitzgerald and Weiner, 2020). Recently, a FAP-targeted oncolytic adenovirus encoding CD3ε reversed the immunosuppressive influence and induced T cell specific tumor and fibroblast targeting (Freedman et al., 2018). Therefore, FAP-positive CAFs are a promising target to abrogate FAP-driven tumor progression and thus improve cancer therapy.
This study aimed to investigate a 3D spheroid multicellular high throughput in vitro model composed of tumor cells, a skin fibroblast cell line and naïve primary T cells to partially mimic the TME. Here, effects of fibroblasts on the immune response associated with cancer were investigated by using small and large immunotherapeutic molecules. The cells were analyzed for the expression of the CAF marker FAP in 2D and 3D cultured cells. Lastly, we studied the impact of FAP-positive fibroblasts on tumor cells and whether the immunosuppressive FAP-driven effect can be used as a potential targeting strategy. We confirm that fibroblasts have a protective effect on tumor cells and that the CAF marker is relevant for targeted immunotherapy to elicit an immune response against cancer cells. This model enables cell-cell interactions between tumor cells and non-tumor cell types to be analyzed in a robust, reproducible, in vivo-like context and allow CAF-directed therapeutic approaches to be investigated in more detail in a high throughput manner.
Increasing interest on the influence of the tumor microenvironment (TME) on tumor progression has led to the use of a multicellular spheroid model to more closely mimic the environment of an in vivo tumor (Hanahan and Weinberg, 2000; Edmondson et al., 2014). For multicellular spheroid formation, the triple-negative breast cancer (TNBC) cell line MDA-MB-231 fluc GFP was detached and 5,000 cells per well were seeded into a 384-ultra-low attachment (ULA) microplate. One day later, the skin fibroblast cell line WS1 was seeded with 15,000 cells. After 24 h, 50,000 naïve T cells were added per well. A ratio of 1:3:10 of tumor to fibroblast to naïve T cells was present at the end (Figure 1A). Various spheroid morphologies could be observed for the different cell types and for their combined culture. Over time, the tumor cell line MDA-MB-231 fluc GFP formed compact and irregular aggregates. Cultures with the fibroblast cell line WS1 formed round, tightly packed spheroids. The naïve T cells surrounded the spheroids in the combined cultures (Figure 1B). On day 3, thus 24 h after naïve T cell addition, only the co-culture of tumor cells with naïve T cells led to a minor, non-significant decrease in tumor cell viability, suggesting that perhaps a longer incubation time is necessary. After 48 h of cultivation with naïve T cells, thus on day 4, a significant decrease in tumor viability could now be observed with only 50% of viable tumor cells detected in the co-culture of tumor cells with naïve T cells. An albeit smaller, yet significant decrease in tumor cell viability was now evident in the triple-culture of tumor cells, fibroblasts, and naïve T cells vs. the triple-culture condition at 24 h timepoint. Taken together these results indicate that the fibroblasts appear to have a protective effect on the tumor cells from the immune cells as there is a significantly weaker effect on tumor cell viability in the presence of fibroblasts (Figure 1C).
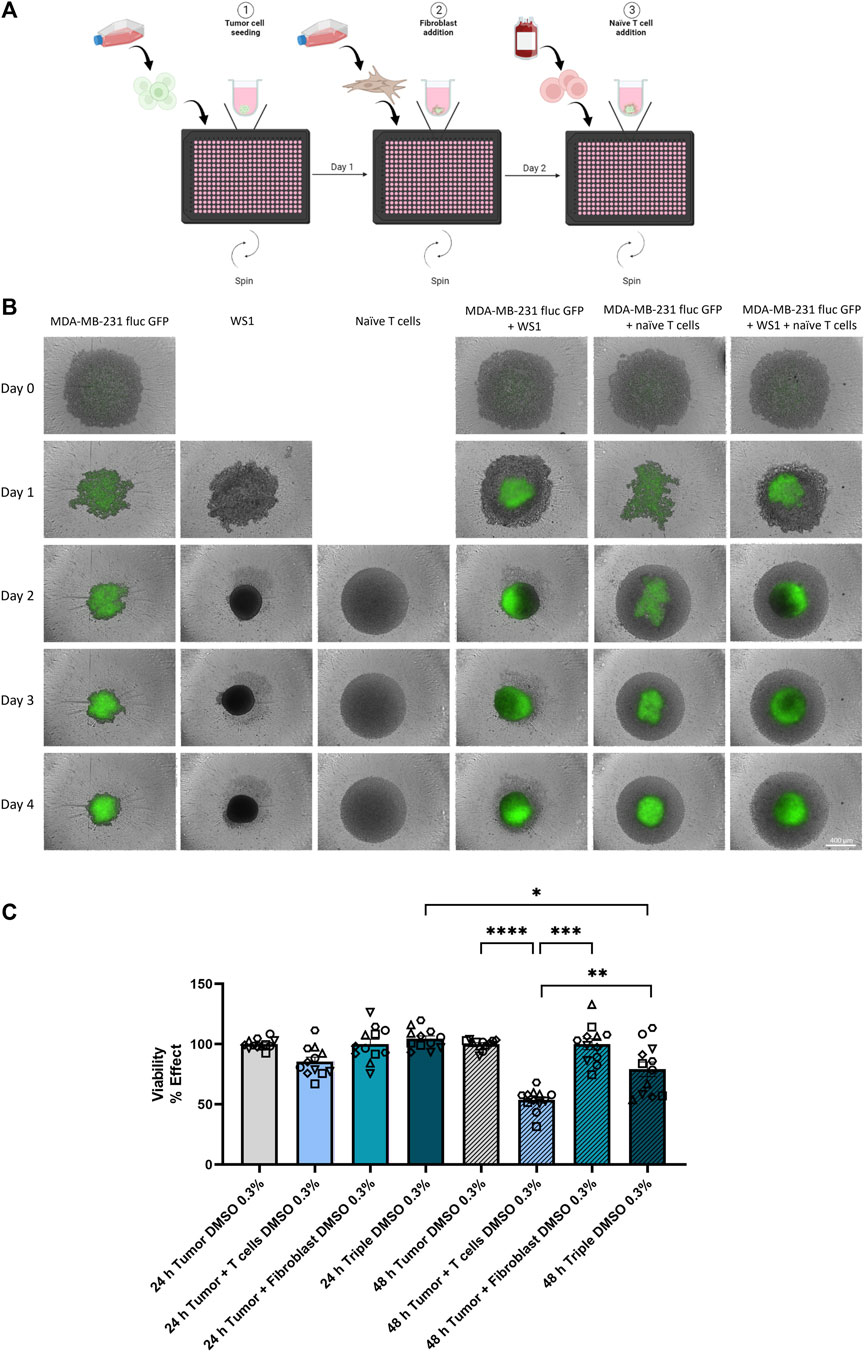
Figure 1. Characterization of multicellular spheroid system. (A) Schematic illustration for the generation of multicellular spheroids with tumor, fibroblast, and naïve T cells. Created with BioRender.com. (B) Morphologies of spheroid formations from mono-, co- and triple-cultures were monitored using the Incucyte® S3 over a period of 5 days. On day 0, the tumor cell line MDA-MB-231 fluc GFP was seeded alone. One day later, the fibroblast cell line WS1 was added to the respective wells. On day 2, the addition of naïve T cells followed according to the culture conditions. Scale bar = 400 µm. (C) Tumor cell viability in the defined culture condition upon addition of 0.3% v/v DMSO was analyzed after 24 h and 48 h of naïve T cell addition. Statistical significance was calculated from 6 different T cell donors in 2 independent experiments by using a Kruskal–Wallis one-way ANOVA or a Wilcoxon test for the 48 h Tumor + T cells vs. 48 h Triple experiments in GraphPad Prism v9.1.2; *p < 0.05; **p < 0.005; ***p < 0.0005; ****p < 0.0001. (mean ± SEM).
Given that the TME can influence the potency and efficacy of therapeutic interventions (Martinez-Outschoorn et al., 2011), the effect of a T cell immune checkpoint inhibitor (from now on called Compound G) was investigated in the co- and triple-culture model described above to increase antitumor immunity. The use of Compound G to inhibit our target of interest, which plays a role in an intracellular signaling pathway with multiple negative feedback loops downstream of the T cell receptor (TCR), could lead to enhancement of T cell immunity against tumors, making it an attractive candidate for small molecule inhibitors. Here, the protective influence of fibroblasts in the spheroid triple-culture with MDA-MB-231 fluc GFP tumor cells and naïve T cells was compared to the co-culture of tumor cells and naïve T cells. On the day of naïve T cell addition, 3 µM of Compound G was added. 24 h after the treatment tumor cell viability using ONE-Glo™ (Figure 2A) and interferon-γ (IFNγ) secretion using homogeneous time-resolved fluorescence (HTRF) (Figure 2B) was measured. Treatment of the co-culture of tumor cells and T cells with Compound G led to a highly significant reduction in tumor cell viability, as anticipated. In the triple-culture, however, tumor cell viability did not decline either in the control condition (as already shown above in Figure 1C) or upon treatment with Compound G (Figure 2A). The treatment with Compound G, however, induced a significant increase in IFNγ concentration in the co-as well as in the triple-culture compared with the respective controls. However, the increase in the IFNγ concentration in the triple-culture vs. its respective control is significantly lower than the increase in the IFNγ levels in the co-culture condition upon treatment with Compound G (Figure 2B). This further solidifies that the fibroblasts constitute an immunosuppressive cell type in this spheroid model.
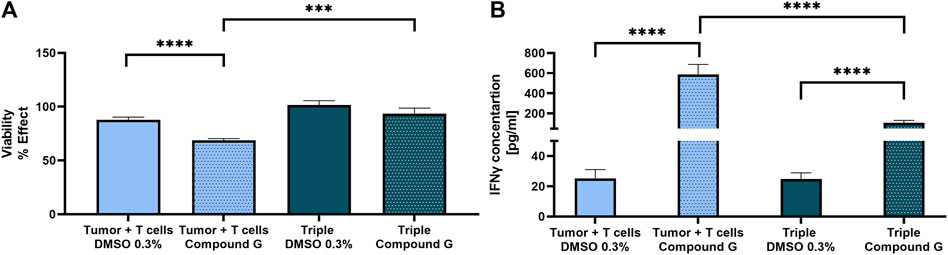
Figure 2. Stronger T cell activation after immune checkpoint inhibition (Compound G) in spheroid co-culture. Compound G was added together with naïve T cells on day 2 for 24 h. As vehicle control 0.3% v/v DMSO was used. (A) Tumor cell viability was analyzed in the co- and triple-culture. Values were normalized to the cultures without T cells. (B) IFNγ concentration [pg/mL] was measured in both co- and triple-culture. Concentrations were calculated using GraphPad Prism v9.1.2 and statistical significance was calculated from 7 different T cell donors in 3 independent experiments by using a Mann-Whitney test; ***p < 0.0005; ****p < 0.0001. (mean ± SEM).
A CD3-bispecific T cell engager (BiTE) that specifically binds to receptors with tyrosine kinase activity serving as a tumor-associated antigen (TAA) expressed on MDA-MB-231 cells (data not shown) was tested to demonstrate the applicability of this model system for testing small and large molecules. Additionally, treatment with a BiTE allowed us to determine if naïve T cells could be activated in the co-culture spheroid model of tumor cells and naïve T cells and induce T cell dependent tumor cell death. Furthermore, the impact of fibroblasts in the triple-culture of tumor cells, fibroblasts and naïve T cells was studied. Here, morphologically, after a treatment period of 5 days with 10 nM BiTE, the T cells in the co-culture with the tumor cells became tighter around the spheroid, the spheroid started to dissolve, and a strong T cell proliferation was detected on day 7 compared to the untreated cells (Figure 3A). The same effect was detected with 16 pM BiTE, but to a lesser extent. In the triple-culture of tumor cells, fibroblasts and naïve T cells, no T cell accumulation was visible over time. However, after 5 days of treatment, a minor T cell increase was detected compared to the untreated triple-culture, but not as clearly as in the co-culture (Figure 3A). As morphological variations in the co-culture were already observed after 48 h of treatment, concentrations of the cytokines IFNγ and interleukin-2 (IL2) were quantified by HTRF. A dose-dependent increase in the concentration of IFNγ was evident in the co-culture of tumor cells and naïve T cells as well as in the triple-culture of tumor cells, fibroblasts, and naïve T cells. The higher the BiTE concentration, the more IFNγ was released, with significantly more IFNγ being secreted in the co-culture than in the triple-culture (Figure 3B). The IC50 values of the two cultures varied 10-fold, with the IC50 of IFNγ release in co-culture being equal to 6.14 pM while in the triple-culture the IC50 was 60.16 pM (Figure 3B). This suggests that in the presence of fibroblasts, a weaker immune response is induced against the tumor cells. In comparison, IL2 was almost undetectable in the triple-culture, while a dose-dependent release of IL2 was detected in the co-culture. Here, an IC50 value of 0.16 pM was determined for the co-culture (Figure 3C). Taken together, this result indicates that WS1 fibroblast cells protect the tumor cells from T cells and in this culture model behave like cancer-associated fibroblasts (CAFs).
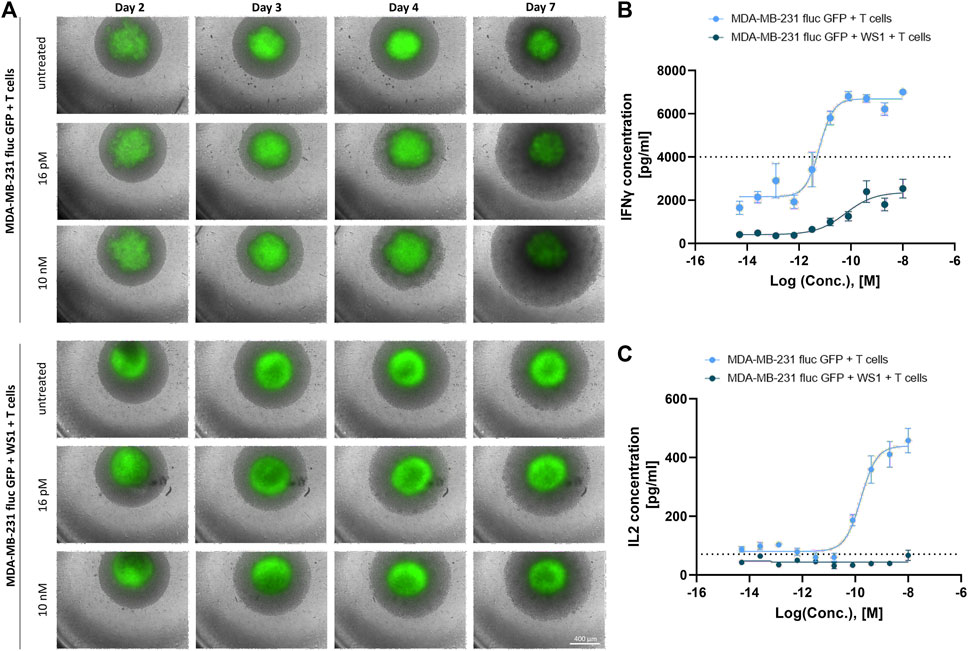
Figure 3. Strong T cell activation by a CD3-bispecific T cell engager in spheroid co-culture. (A) The spheroid morphologies from the co-culture of MDA-MB-231 fluc GFP and naïve T cells and triple-culture including the WS1 cells were monitored using Incucyte® S3 over a treatment period of 5 days where the spheroids were treated with 16 pM or 10 nM BiTE on day 2. Scale bar = 400 µm. (B) IFNγ concentrations [pg/mL] from co- and triple-culture post 48 h BiTE treatment. The dotted line represents the highest standard. (C) IL2 concentrations [pg/mL] from co- and triple-culture post 48 h BiTE treatment. The dotted line represents the lowest standard. The curves were fitted by GraphPad Prism v9.1.2. (mean ± SEM; n = 4 different T cell donors in 2 independent experiments).
Fibroblast activation protein-α (FAP) is a CAF marker that is known to have an immunosuppressive effect in the TME and is therefore an important link to understand the mechanism by which tumors evade the immune system (Garin-Chesa et al., 1990; Kraman et al., 2010). By demonstrating that the fibroblast cell line WS1 appears to have a protective impact on the tumor cells in our spheroid model, we next investigated the expression of FAP in both 2D cultured cells as well as within the 3D spheroids using the Jess capillary electrophoresis Simple Western™ system. First, the FAP expression levels in the tumor cell line MDA-MB-231 fluc GFP were analyzed in a time dependent manner. As expected, no FAP signal could be detected from the tumor cells after 24, 48, or 72 h of culture, in either 2D or 3D cultured cells (Figure 4A). Interestingly, for the mono-culture of WS1 fibroblast cells, a strong band at 128 kDa could be observed at all time points. As the band in the Simple Western™ system was at a higher molecular weight (MW) than expected (FAP protein size is −97 kDa (Scanlan et al., 1994; Piñeiro-Sánchez et al., 1997)), we checked the specificity of the antibody by a traditional Western blot, which resulted in the expected band size, thus confirming the specificity of the FAP antibody (Supplementary Figure S1). The apparent MW of a protein is determined by many parameters, such as the pH of the running buffer, as well as the type of stacking and separation matrix, which vary between traditional Western blot and Simple Western™, resulting in differences in molecular size (Wiesner et al., 2021). For the co-culture of tumor cells and fibroblasts in 2D, a weak band was detectable at all time points. Surprisingly, a more intense band for FAP was detected in both types of 3D spheroids: mono-culture of WS1 as well as co-culture of tumor cells and fibroblasts. The expression levels of FAP also increased over time in both types of spheroid cultures (Figure 4A). For quantification of the FAP expression levels, the area of the peaks from the electropherograms were normalized to the total protein with the integrated Jess feature, thereby removing the necessity for a loading control. Based on the corrected area, the quantification confirmed that the FAP expression was significantly enhanced in the mono-culture of WS1 spheroids in comparison to the 2D monolayer of WS1 fibroblast cells. In the co-culture, the spheroid culturing method also resulted in a significant increase in FAP expression level as compared to the 2D cultured cells. In addition, the FAP expression levels in the spheroids increased significantly with time (Figure 4B). These data are in line with literature that shows that the protein expression is different between monolayers and 3D spheroids (Kumar et al., 2008; Breslin and O Driscoll, 2016). Together, these results highlighted the importance of the culture method we have used to establish a high throughput model for drug discovery that is more physiologically relevant.
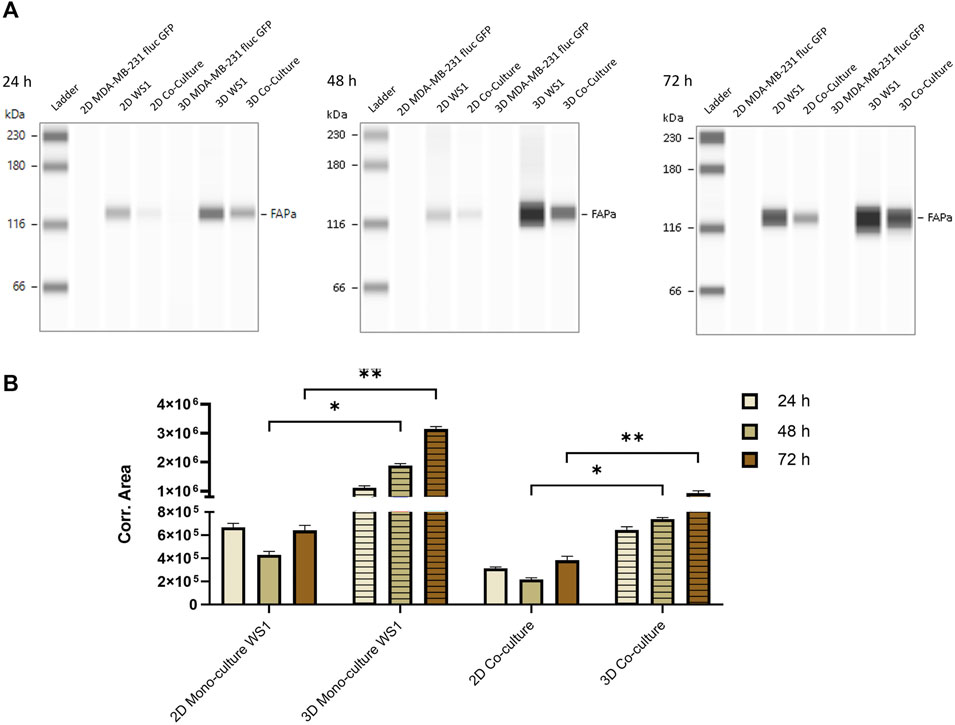
Figure 4. Stronger FAP protein expression in spheroids than in monolayer cells. Capillary electrophoresis was performed with 125 μg/mL protein from the 2D and 3D cultured tumor cells MDA-MB-231 fluc GFP, the fibroblast cells WS1 and the co-culture of both cell lines at different time points. (A) Simple Western™ blots after 24 h, 48 h and 72 h. (B) Quantification of FAP expression in 2D and 3D WS1 mono-culture and co-culture over time. Data are normalized to the total protein level. Statistical significance was calculated using a Mann-Whitney test in GraphPad Prism v9.1.2; *p < 0.05; **p < 0.005. (mean ± SEM, n = 2 24 h, 48 h; n = 3 72 h).
Next, the presence of the cell-surface protein FAP (Rettig et al., 1993) on the surface of the fibroblast cell line WS1 was investigated by flow cytometry. The mono-culture of the tumor cell line MDA-MB-231 fluc GFP, the mono-culture of WS1 cells and the co-culture of both cell lines as 2D and 3D cells were prepared, and the surface expression was examined after 72 h of fibroblast seeding using a PE-conjugated anti-FAP antibody. Cells were additionally stained by a live/dead stain to analyze only the fluorescence signal of viable cells. As expected, in the 2D and 3D cultured tumor cell line MDA-MB-231 fluc GFP, the detected fluorescence intensity was equal to the corresponding negative control suggesting that no FAP expression could be detected in the tumor cell line in either 2D or 3D culture condition. In contrast, for both 2D and spheroid mono-culture of WS1 cells, a concentration-dependent binding of PE-conjugated FAP antibody was detected as observed by the increase of fluorescence intensity. In the co-culture, the two peaks could be distinguished based on the GFP content, since only the tumor cells express GFP. Therefore, upon gating for GFP, it could be confirmed that only the GFP-negative (GFP-) cells displayed a concentration-dependent surface binding of the antibody suggesting that only the fibroblast population of the co-culture express FAP (Figure 5A). Subsequently, the median fluorescence intensity of the viable GFP- stained cells was normalized to the median of the respective viable GFP- unstained cells. The 3D mono-culture of WS1 cells showed a higher increase in the signal for surface binding than in the 2D mono-culture. In the co-culture, surface expression was similar in both conditions (Figure 5B). Overall, this shows that the surface expression is influenced by the 3D spheroid structure as evident by the increased FAP on the surface in mono-culture spheroids, and that the co-culture with tumor cells, led to a reorganization of FAP surface protein levels.
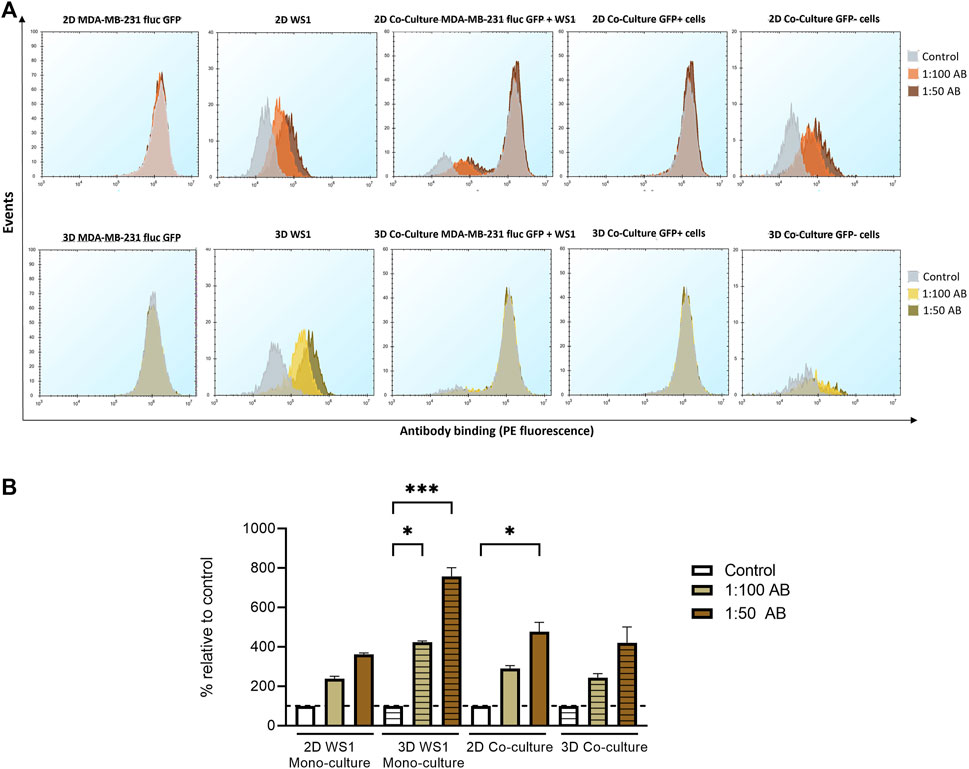
Figure 5. Increase in FAP surface expression in spheroids compared to monolayer culture. For flow cytometry, cells were stained with two dilutions of PE-conjugated FAP antibody and SYTOX™ Red dead cell stain. Measurements with PBS/1% BSA served as a negative control. (A) Surface antibody binding in 2D and 3D mono-culture of MDA-MB-231 fluc GFP cells, mono-culture of WS1 cells, and co-culture of both cell lines after 72 h. Only the viable cells were examined for the event analysis. The cells were separated into GFP-positive (GFP+) and GFP-negative (GFP-) populations. (B) The % fluorescence signal of the median of viable GFP- cells was calculated by normalizing to the respective negative controls. Statistical significance was calculated using a Kruskal–Wallis one-way ANOVA in GraphPad Prism v9.1.2; *p < 0.05; ***p < 0.0005. (mean ± SEM, n = 3; n = 2 2D mono-culture WS1 1:50 AB).
CAFs can improve T cell dysfunction and thereby provide tumor protection (Lakins et al., 2018). Focusing on FAP as a CAF marker could represent a therapeutic strategy to abolish the immunosuppressive effect (Kalluri and Zeisberg, 2006). Therefore, a potential anti-tumor strategy would be to block FAP using either a small molecule or an antibody as well as bring T cells into close proximity to fibroblasts and subsequently induce T cell engagement in the tumor region. Since tumors in vivo also grow in 3D (Breslin and O Driscoll, 2016), for this study only the spheroid model was used. For this, the binding of the high-affinity ligand oncoFAP to FAP on the WS1 cells spheroid was tested as a modular component for prospective fibroblast targeting-application (Millul et al., 2021). For this assay, a dextran-oncoFAP multivalent construct was synthesized, potentially increasing the binding affinity further. For the binding assay, fluorescent TAMRA-NHS was coupled to dextran-oncoFAP (Figure 6A). The binding activity of the TAMRA-dextran-oncoFAP construct was measured by flow cytometry. The viable GFP- fibroblast cells showed concentration-dependent oncoFAP binding on the surface in both mono- and co-culture, allowing oncoFAP to be used as a modular component (Figure 6B). Thus, this modular approach was further modified towards an ADC-like format for T-cell activation. Therefore, α-CD3-scFv-Fc fusion protein (Carrara et al., 2022) was conjugated to a dextran scaffold utilizing microbial transglutaminase (mTG), which was subsequently decorated with multiple oncoFAP molecules (Figure 6C) analogous to the previously published dextramab format (Schneider et al., 2019a). This design should allow the α-CD3-scFv-Fc-dextran-oncoFAP conjugate (abbreviated as construct) to target FAP on CAFs and CD3 on T cells to induce an immune response against the tumor cells. Here, the effect of the construct was investigated in the triple-culture composed of tumor cells, fibroblast cell line WS1, and naïve T cells. In addition, α-CD3-scFv-Fc was used as a control. Treatment with the construct did not lead to IFN-γ release in the co-culture consisting of the fibroblast cell line WS1 and T cells (Supplementary Figure S14). After 48 h of treatment with 2 nM of the construct, the cytotoxicity related IFNγ release was measured. Figure 6D clearly shows that significantly more IFNγ was released when treated with the construct compared to the corresponding α-CD3-scFv-Fc control. Therefore, these data demonstrate that specific simultaneous binding to FAP and CD3 results in targeted T cell dependent IFNγ secretion (Figure 6D).
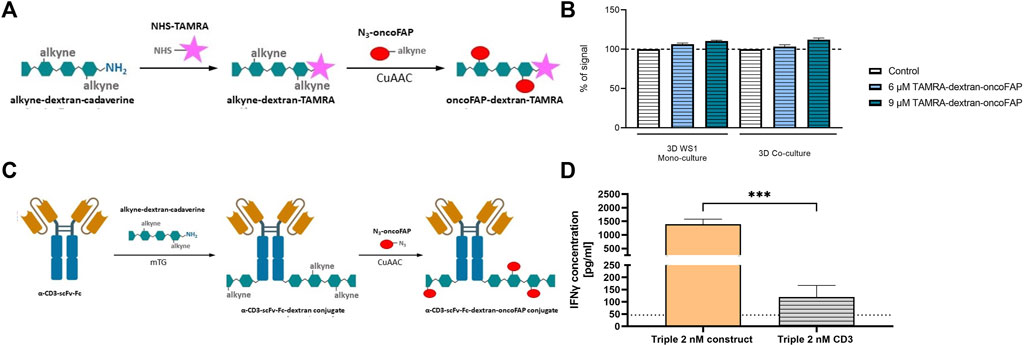
Figure 6. Strong IFNγ release after simultaneous FAP and CD3 binding through oncoFAP-bearing construct. (A) Labeling of alkyne-dextran-cadaverine with NHS-TAMRA and subsequent attachment of multiple oncoFAP moieties via CuAAC. Created with BioRender.com. (B) The % fluorescence signal was calculated by normalizing the median of viable GFP- cells stained with TAMRA-dextran-oncoFAP to the median viable GFP- unstained cells measured by flow cytometry. The graph was created in GraphPad Prism v9.1.2. (mean ± SEM, n = 2). (C) mTG mediated conjugation of α-CD3-scFv-Fc protein and alkyne-dex-cadaverine. Subsequently, oncoFAP was introduced via CuAAC. Created with BioRender.com. (D) The α-CD3-scFv-Fc-dextran-oncoFAP construct (abbreviated as construct) was added together with naïve T cells on day 2. As control α-CD3-scFv-Fc (abbreviated as CD3) alone was tested. IFNγ concentration [pg/mL] was measured in triple-culture after 48 h of treatment. The dotted line represents the lowest standard. Concentrations were calculated with GraphPad Prism v9.1.2 and statistical significance was calculated using a Kruskal–Wallis one-way ANOVA in GraphPad Prism v9.1.2; ***p < 0.001. (mean ± SEM; n = 3 with 8 different T cell donors for α-CD3-scFv-Fc-Dex-oncoFAP, n = 1 with 3 different T cell donors for α-CD3-scFv-Fc).
In this study, we describe a reproducible, robust three-dimensional (3D) multicellular model that is suitable for high throughput since it relies on a 384 well format. To mimic the influential tumor microenvironment (TME) (Hanahan and Weinberg, 2011), a spheroid model cultured in ultra-low attachment (ULA) plates consisting of a triple-negative breast cancer (TNBC) cell line, fibroblast cells, and human primary naïve T cells was characterized. Developing a multicellular 3D spheroid model that partially mimics the TME and is suitable for high throughput has many challenges. These include variability and rigidity in spheroids, impaired imaging due to 3D structure, pathophysiologic drug gradients that influence efficacy (Nath and Devi, 2016) but also the differentiation of the several cell types from each other. The advantage of the tumor cell line MDA-MB-231 fluc GFP is the stable expression of GFP and firefly luciferase (fluc) that permits differentiation of tumor cell viability specifically vs. other cell types based on the luciferase readout as well as morphological differences due to the presence of GFP from the other cell types in this model. Fibroblasts are major producers of extracellular matrix (ECM) components (Anderson and Simon, 2020). To incorporate these major producers, which promote tumor progression, in our model the skin fibroblast cell line WS1 was included (Anderson and Simon, 2020). In addition 3D spheroids are a scaffold free culture system in which cells are known to produce their own ECM (Knight and Przyborski, 2015). Although some studies incorporate additional matrices, such as Matrigel (Badea et al., 2019) or Collagen (Le et al., 2016) in 3D spheroid assays, however, this limits the usability and scalability of the model for high throughput screening. Naïve T cells were incorporated to partially mimic in vivo immune responses, as once T cells evolve in the thymus, the cells initially require activation by the surrounding environment in order to achieve their effector function (Zhan et al., 2017; Van Den Broek et al., 2018). In the anticancer immune response, the physical location of T cells in the environmental stroma influences the treatment (Di Modugno et al., 2019). Using primary immune cells from different donors adds a challenge of its own, such as increased variability due to donor-to-donor differences. Other studies have also reported this issue, namely, that the use of different immune cell donors increases the variability (Dreier et al., 2002; Nazarov et al., 2013; Hoeres et al., 2019). Despite this known source of variability, it is also critical to test multiple donors, as the results can be misinterpreted if only 1 or 2 donors are used. In this study, we used 8 different donors which further solidifies our findings as albeit inter-donor variation, all donors followed the same trend. By using ULA microplates, reproducible spheroids are formed exhibiting similar geometry, thus providing spheroid diffusion barriers and enabling the incorporation of multiple cell types in an easy-to-use, high throughput and automatable setup (Ivascu and Kubbies, 2007; Vinci et al., 2012).
First, to evaluate the efficacy of certain therapeutic molecules, the possibility of naïve T cells to become activated in co-culture of tumor cells and naïve T cells in a 1:10 ratio of tumor to naïve T cells (Wüest et al., 2001), as well as in triple-culture including fibroblasts in a 1:3:10 ratio of tumor to fibroblast to naïve T cells (Navarrete-Bernal et al., 2020; Yakavets et al., 2020) was investigated. Based on 2D imaging using an Incucyte® S3 of a 3D spheroid structure, the naïve T cells did not seem to physically interact with the compact, irregular tumor aggregates (Vinci et al., 2012) in their co-culture. However, a strong decrease was observed in the number of viable tumor cells. This demonstrated that the T cells were activated in the presence of the tumor cell line. The TNBC tumor cell line MDA-MB-231 displays low expression of CD80 and higher expression of CD86 on the surface, allowing to serve as an antigen-presenting cell (APC) to interact with the CD28 co-receptor of T cells (De Charette et al., 2016; Navarrete-Bernal et al., 2020). In the triple-culture, where the fibroblasts were present too, they formed a tightly packed well-organized network around the tumor cells (Dolznig et al., 2011), which acts as a chemical and physical barrier and thus prevented spontaneous infiltration of the T cells (Herter et al., 2017). This was evident by the observed small decrease in tumor cell viability in the triple-culture, leading to the hypothesis that the fibroblast cells have an immunosuppressive effect in our model and therefore protect the tumor cells. In the future, a more in depth morphological characterization of the spheroid, e.g., volumetric imaging would be of great interest to the field to investigate the infiltration, distribution, and interactions of the different cell types with each other within the multicellular spheroid.
As the TME can modulate potency and efficacy of therapeutics (Martinez-Outschoorn et al., 2011), a small immunotherapeutic molecule was tested in our established model. Leach et al. revealed in 1996 that blocking an immune checkpoint can potentiate the immune response against cancer (Leach et al., 1996). Here we investigated not only whether our 3D multicellular model is suitable for testing compounds, but also whether inhibition of a T cell immune checkpoint can abolish the immunosuppressive effect observed in the presence of fibroblasts. A strong decrease of tumor cell viability in the co-culture with T cells alone was measured already after 24 h of treatment with the immune checkpoint inhibitor Compound G, caused by the strong release of the proinflammatory cytokine interferon-γ (IFNγ). In the triple-culture, we also measured an increased cytokine release after treatment with Compound G, however, as anticipated this was significantly lower than in the co-culture, again confirming the protective effect of the fibroblasts on the tumor cells. This led us to conclude that the fibroblast cell line exhibits a cancer-associated fibroblast (CAF) like phenotype in this model, since CAFs can show resistance to immune checkpoint inhibitors (Chen et al., 2017; Wen et al., 2017).
Subsequently, a large molecule, a bispecific T cell engager (BiTE) was screened in this model, whereby the two linked variable single chain fragments (scFvs) bind to T cell specific CD3 and to a tumor-associated antigen (TAA) (Huehls et al., 2015; Goebeler and Bargou, 2020; Zhou et al., 2021). Major morphological differences were evident in the co-culture of tumor cells and naïve T cells after addition of the BiTE. In the case of the co-culture, T cells first accumulated near the tumor cell spheroid and then resulted in the disintegration of the tumor spheroid, a well-established sign of tumor cell killing, and a strong increase in T cell numbers was evident. The closer association of T cells with tumor cells is mediated by the concept of BiTEs, in which effector T cells are physically brought in close proximity to tumor cells and stimulate activation, thereby attacking tumor cells (Huehls et al., 2015; Goebeler and Bargou, 2020). In the presence of fibroblasts, however, minimal morphological effects were apparent after 5 days of treatment with BiTE. These morphological findings were confirmed by T cell specific cytokine data for IFNγ and interleukin-2 (IL2). The co-culture of tumor cells and T cells resulted in a concentration-dependent increase in IFNγ and IL2 release upon treatment with the BiTE. In the presence of fibroblasts, as expected based on the imaging data, only a minor concentration-dependent IFNγ secretion was detectable. Once again, this confirmed our previous findings of the immunosuppressive role of fibroblasts and the related impairment of T cell infiltration in the triple-culture due to the presence of the fibroblasts (Wang et al., 2014). Taken together, we have shown that the characterized spheroid model can be implemented to test small and large immuno-oncology molecules to perform drug screening in a high throughput and robust manner.
To confirm our hypothesis that the WS1 cells behave like CAFs in our established 3D cell culture model, we next determined the total and the surface expression levels of the membrane-bound fibroblast activation protein-α (FAP) in the tumor cells and the WS1 fibroblast cells. FAP is one of several well-known CAF markers and has been shown to have an immunosuppressive effect (Garin-Chesa et al., 1990; Rettig et al., 1993; Piñeiro-Sánchez et al., 1997; Kraman et al., 2010). In addition, we also compared the expression levels of FAP between two-dimensional (2D) and 3D cultures to demonstrate the necessity of implementing a more physiologically relevant 3D cell culture system (Ivascu and Kubbies, 2007). As anticipated, we could demonstrate that no FAP is expressed in the tumor cell line MDA-MB-231 fluc GFP in the total protein and thus also not on the surface, confirming previous studies that have shown that FAP is only expressed in the stroma and not in tumor cells (Fitzgerald and Weiner, 2020; Mori et al., 2023). From the fibroblasts however, much more FAP was detected based on the total protein expression levels, both in 2D and 3D, as well as mono- and co-cultured WS1 cells. In addition, we could observe an increase in the FAP expression levels over time, especially evident in the 3D cell culture. This finding, too, is consistent with the literature where it has previously been shown that gene and protein expression is affected by the 3D architecture compared to monolayer cells (Kumar et al., 2008; Luca et al., 2013; Souza et al., 2018). Contact and interaction of cancer cells with stromal fibroblast cells can lead to CAF differentiation (Strell et al., 2019; Mhaidly and Mechta-Grigoriou, 2020), and thereby FAP expression and its enhancement over time. In spheroids, the cell surface is rearranged, which also alters the localization of proteins, which supports the findings of increased protein expression in the spheroid mono-culture of WS1 cells (Pickl and Ries, 2009). However, in both co-cultures, the signal for FAP surface binding was similar. When cells are arranged in a 3D spheroid, only the outermost layer of cells can proliferate, while in the inner cells undergo necrosis (Alvarez-Pérez et al., 2005; Nath and Devi, 2016). This possibly explains the lower FAP expression levels, since there are more cells present in the spheroid, which potentially leads to less FAP-expressing fibroblast cells to survive or altering gene expression as a result of hypoxia (DelNero et al., 2015). This is confirmed as the WS1 fibroblasts in the co-culture were less viable in flow cytometry, as reported by another study where the authors show that co-culture leads to more apoptotic cells (Metzger et al., 2021). In addition to the geometrical restrictions, in the co-culture set-up, both tumor cells and fibroblast cells share the same nutrients, which in turn can also exacerbate the formation of a necrotic core (Nath and Devi, 2016; Pinto et al., 2020).
By demonstrating that WS1 spheroid culture promoted the expression levels of the immunosuppressive CAF marker FAP (Garin-Chesa et al., 1990; Kraman et al., 2010), a therapeutic approach was investigated to abolish the protective factor of the FAP-positive fibroblasts. In this regard, oncoFAP, a small high-affinity ligand targeting human FAP is a promising molecule (Millul et al., 2021). To use oncoFAP as a modular component, firstly, after successful synthesis of a TAMRA-dextran-oncoFAP construct, the ability of oncoFAP to bind to the WS1 cell line was confirmed. Since T cells can be excluded by the stroma from the tumor localized environment (Di Modugno et al., 2019), the developed oncoFAP approach was then further adapted to produce an α-CD3-scFv-Fc fusion protein for T cell engagement with numerous linked oncoFAP molecules. This construct was designed to physically bridge naïve T cells based on the invariant CD3 molecule (Clevers et al., 1988) and FAP-expressing fibroblast cells through oncoFAP binding to enable immune responses against tumor cells. The α-CD3-scFv-Fc-dextran-oncoFAP construct successfully facilitated increased IFNγ release by simultaneously binding of oncoFAP to the expressed FAP on the WS1 cells as well as to CD3 on T cells in the triple-culture, thereby activating the naïve T cells and abolishing the immunosuppressive effect. The release of IFNγ contributed to the elimination of tumor cells by inhibiting proliferation and inducing apoptosis (Ikeda et al., 2002). Freedman et al., 2018 obtained analogous results, through binding at the same time to FAP and CD3ε, and followed by fibroblast targeting (Freedman et al., 2018). Overall, we could demonstrate that a CD3ε targeting antibody that is endowed with multicopy oncoFAP binds FAP expressed on CAFs as well as brings naïve T cells in the proximity of the tumor cells by CD3 to subsequently induce a significant T cell dependent IFNγ release in the vicinity of the tumor cells, mimicking the potential to drive proinflammatory, cytotoxic T cells to the tumor site in vivo to induce an immune response. In future work, T cell trafficking experiments could be performed in the presence and absence of oncoFAP to confirm the docking of FAP-positive fibroblasts via oncoFAP to the T cells, to show co-interactions of these 2 cell types.
Here we have described a well-characterized 3D spheroid model consisting of tumor cells, a FAP-positive fibroblast cell line, and human naïve T cells that can be used to study the interactions of the different cell types and the influence of CAF-like behavior of fibroblasts on drug screening in a high throughput manner. CAFs represent a promising target in oncology or immuno-oncology potentially augmenting current tumor therapies or enhancing the immune response (Mhaidly and Mechta-Grigoriou, 2020). For the use of CAFs as a treatment strategy, further investigation is required to address the carcinogenic characteristics (Kalluri and Zeisberg, 2006). Using this multicellular model to study the role of CAFs, the next step could involve analyzing whether the used fibroblast cell line represents the complex CAF population or only the population involved in wound healing (Tripathi et al., 2012), since skin wound healing can also trigger FAP expression (Garin-Chesa et al., 1990). To broaden the characterization of the FAP-positive skin fibroblast cell line WS1, other CAF markers such as α-smooth muscle actin (αSMA) or platelet derived growth factor β (PDGFR β) could also be assessed in the future (Kalluri and Zeisberg, 2006; Lindner et al., 2019). Furthermore, this model can be extended by using 1) other tumor cell lines since there is no one universal tumor cell line and each would exhibit differential sensitivity to the presence of fibroblast; 2) primary CAFs to be more representative of in vivo conditions; 3) test the influence of other immune cells of the innate immune system such as NK cells to broaden the applicability of the model.
In summary, this multicellular 3D spheroid model contributes to the investigation of the complexity and dynamics of the underlying interactions in the TME in a more physiological manner. The established oncoFAP-based construct allowed cytotoxic activation of T cells to target fibroblasts in the mimicked TME in-a-dish to restore anti-tumor immunogenicity. This in vitro model allows researchers to evaluate the potency of small and large molecules, the testing of potential microenvironment-targeted strategies, as well as the fundamental mechanisms of compound resistance, in a modular setting in high throughput, automation ready, reproducible, and robust fashion to bridge the gap between monolayer cell culture experiments and animal studies. Application of such a model will contribute to better understanding biology, identification of promising compounds, and thereby increase the efficiency of drug discovery to quickly make the leap from in vitro to in vivo and eventually to clinical settings.
The triple-negative breast cancer (TNBC) cell line MDA-MB-231 (ATCC) fluc GFP was engineered to stably express firefly luciferase (fluc) and GFP and cultured in Dulbecco’s Modified Eagle Medium (DMEM; Cat. No. 41965, Thermo Scientific™) supplemented with 10% fetal bovine serum (FBS; Cat. No. P30-1402, PAN-Biotech) and 1 μg/mL puromycin (Cat. No. P9620, Sigma-Aldrich). The cells were cultivated at 37°C and 10% CO2. The skin fibroblast cell line WS1 (ATCC) was cultivated in Minimum Essential Medium (MEM) Eagle media (Cat. No. M2279, Sigma-Aldrich) supplemented with 10% FBS and 1% GlutaMAX™ (Cat. No. 35050061, Gibco™) at 37°C and 5% CO2. Cells were passaged using Accutase® (Cat. No. A6964, Sigma-Aldrich).
Previously isolated naïve T cells from peripheral blood mononuclear cells (PBMCs) from internal blood donors were stored in DMSO-containing freezing medium in a liquid nitrogen tank. For experimental applications, naïve T cells were quickly thawed at 37°C in a water bath and prepared for seeding in fresh AIM V™ medium (Cat. No. 12055-091, Gibco™).
The monolayer of MDA-MB-231 fluc GFP cells were detached from a T-75 cell culture flask (Cat. No. 658175, Greiner Bio-One) and the defined cell number was adjusted in DMEM medium containing 10% heat-inactivated FBS (hiFBS). The cell suspension was seeded into a 384-ultra-low attachment (ULA) microplate (Cat. No. 3830, Corning) with 5,000 cells/well in 15 µL each. The plate was then centrifuged at 200 g for 4 min, rotated and centrifuged again. For the co- or triple-culture, the same procedure was followed by the addition of further cell types. After 24 h, either the WS1 cells were added for co-culture with 15,000 cells in 15 µL DMEM/10% hiFBS into the 384-well plate per well or only 15 µL medium to the wells to which no further cells were added. One day later, the naïve T cells were seeded with 50,000 cells in 30 µL in the 384-well plate per well with AIM V™ media or again only medium to the wells without addition of cells. Thus, a final volume of 60 µL in the 384-well plate were reached. Spheroid formation was monitored by the Incucyte® S3 Live-Cell Analysis System (Sartorius).
Tumor viability was specifically measured in the multicellular system by ONE-Glo™ Luciferase Assay (Cat. No. E6120, Promega). The assay was conducted according to the manufacturer’s protocol but modified for 3D spheroids. Prior to the measurement, 30 µL supernatant was collected with the VIAFLO 384 (Integra) and frozen at −80°C for further measurements. The ONE-Glo™ reagent was added equally to the cell culture medium volume. The plate was shaken for 30 min in the dark at RT and luminescence was measured on a PerkinElmer EnVision® multilabel reader. The respective mean value of tumor cell viability in mono-culture and the mean value of tumor cells with fibroblasts in culture were calculated to quantify the percentage effect of T cells on tumor cell viability.
Cell treatment with the DMSO-based immune checkpoint inhibitor (in-house molecule, called Compound G) was performed on the day of addition of naïve T cells using the Tecan D300e Digital Dispenser (HP). As a control, 0.3% v/v DMSO was included. BiTE (in-house molecule), α-CD3-scFv-Fc-dextran-oncoFAP or α-CD3-scFv-Fc were added after naïve T cell addition. The dilutions were applied with a manual multichannel pipette.
To investigate the secretion levels of interleukin 2 (IL2) and interferon-γ (IFNγ), the human IL2 (Cat. No. 62HIL02PEH, Cisbio) and human IFNγ (Cat. No. 62HIFN6PEH, Cisbio) HTRF kits were used. The assays were carried out following the supplier’s protocol. The previously frozen cell culture supernatants were thawed at RT. The antibody solution as well as the dilution series of the standard in the assay medium were prepared. Here, 2 µL of the mixed antibody solution was pipetted into a small volume 384-microplate (Cat. No. 784075, Greiner Bio-One) and 8 µL of the supernatant was transferred with the VIAFLO 384 (Integra). Lastly, the standard was pipetted. The plate was sealed and incubated for at least 3 h (IL2) or overnight (IFNγ) at RT. The signal was measured using PHERAstar FSX (BMG LABTECH). The curve fitting was performed using the 4-parameter logistic (4 PL 1/y2) model in GraphPad Prism v9.1.2.
For cell lysis of monolayer cells and spheroids, a previous protocol was followed (Phung et al., 2011). The lysis buffer consisted of 4% sodium dodecyl sulfate (SDS; Cat. No. 05030, Sigma-Aldrich), 1:100 phosphatase inhibitor cocktail II (Cat. No. 524625, Millipore), 1:1000 protease inhibitor cocktail III (Cat. No. 539134, Millipore), 1:10000 benzonase (Cat. No. E1014, Millipore) in RIPA lysis buffer (Cat. No. 786-723, G-biosciences). The monolayer cells were cultured in T-25 flasks (Cat. No. 690175, Greiner Bio-One) and seeded with 300,000 cells MDA-MB-231 fluc GFP or WS1 cells for the mono-cultures or with 75,000 tumor cells and 225,000 fibroblast cells for the co-culture in a ratio of 1:3 of tumor to fibroblast in 5 mL DMEM supplemented with 10% hiFBS. For lysis of spheroids, 49 spheroids of each condition were collected, centrifuged for 5 min at 300 g at RT, and the supernatant was then discarded. The spheroids were washed with 1x DPBS containing 1:100 phosphatase inhibitor cocktail II and 1:1000 protease inhibitor cocktail set III and centrifuged again. During this time, the monolayer cells were detached with Accutase® and centrifuged at 300 g for 5 min. The pellet was dissolved in 1x DPBS containing 1:100 phosphatase inhibitor cocktail II and 1:1000 protease inhibitor cocktail set III and centrifuged again. The supernatant was discarded from both 2D and 3D cultured cells. The monolayer cells were resuspended with 50 µL of prepared lysis buffer and the spheroids were resuspended with 25 µL of lysis buffer and vortexed for 1 min. Next, four cycles of freezing at −80°C for 10 min and thawing at 37°C for 20 min in a water bath followed. Lastly, the lysates were centrifuged at 250 g for 5 min at RT and the supernatant was collected. Afterwards, the lysates were stored at −80°C. Prior to use, the Pierce™ BCA Protein Assay Kit (Cat. No. 23225, Thermo Scientific™) was used to quantify the total protein concentrations of the lysates.
Protein detection was achieved using the capillary-based JESS Simple Western™ instrument (ProteinSimple®, Bio-Techne) with the 12–230 kDa separation module (Cat. No. SM-W004, ProteinSimple®, Bio-Techne) following the manufacturer’s protocol. Lysates were diluted with 5x fluorescent master mix (Cat. No. PS-ST01EZ-8, ProteinSimple®, Bio-Techne) to a final protein concentration of 125 μg/mL. The monoclonal rabbit anti-FAPα antibody (Cat. No. ab207178, abcam) was diluted 1:10 in antibody diluent (Cat. No. 042-203, ProteinSimple®, Bio-Techne) and the anti-rabbit secondary HRP antibody (Cat. No. 042-206, ProteinSimple®, Bio-Techne) was used. The diluted samples and required reagents including the Biotinylated Ladder (Cat. No. PS-ST01EZ, ProteinSimple®, Bio-Techne), substances for total protein detection (Cat. No. DM-TP01, ProteinSimple®, Bio-Techne) and the RePlex™ reagents (Cat. No. RP-001, ProteinSimple®, Bio-Techne) were pipetted into the plate. Then JESS was started to perform all steps automatically (Nguyen et al., 2011). Compass SW software 6.1.0 was used for data analysis.
Samples were prepared with a protein concentration of 30 μg, 1x NuPAGE™ LDS sample buffer (Cat. No. NP0007, Invitrogen™) and 1x NuPAGE™ reducing agent (Cat. No. NP0004, Invitrogen™) and denatured for 2 min at 95°C. The SeeBlue™ Plus2 Prestained Protein Standard (Cat. No. LC5925, Invitrogen™) and samples were loaded onto the NuPAGE™ 4%–12% Bis-Tris Gel (Cat. No. NP0322BOX, Invitrogen™). The SDS-PAGE was performed using NuPAGE™ MES SDS running buffer (Cat. No. NP0002, Invitrogen™) for 35 min at 200 V. After electrophoresis, the gel was blotted with the iBlot™ Transfer Stacks PVDF Mini (Cat. No. IB401002, Invitrogen™) at 200 V for 7 min using the iBlot™ Dry Blotting System (Invitrogen™). The membrane was then incubated with AdvanBlock-PF blocking solution (Cat. No. 541034, Biozym) for 1 h, followed by 1:1000 rabbit anti-FAPα (Cat. No. ab207178, abcam) and 1:1000 rabbit anti-GAPDH (Cat. No. 2118, Cell Signaling) antibody incubation overnight at 4°C rolling. Membrane was washed four times with TBS buffer supplemented with 0.05% Tween®20 (TBS-T; Cat. No. 9005-64-5, Sigma-Aldrich) for 10 min, followed by IRDye® 800CW Donkey anti-rabbit IgG secondary antibody (Cat. No. 926-32213, LI-COR) diluted 1:5000 in AdvanBlock PF blocking solution for 1 h rolling at RT. Membranes were then washed three times with TBS-T for 10 min each and lastly again with 1x TBS. Imaging was performed on Azure c600 Imaging System (Azure Biosystems).
Dextran modification was performed as described by Schneider et al. (Richter et al., 2012; Schneider et al., 2019b) for the first two synthesis steps of reductive amination and carboxyethylation (Schneider et al., 2019a). Instead of an azide linker, an analogous linker bearing an alkyne moiety was introduced subsequently (Section 4.7.2.). Analytical data can be found in Supplementary Figures S5, S6.
2-carboxyethyl-dextran-N-Boc-cadaverine was dissolved in MilliQ-water. 8.5 eq of EEDC per CE moiety were dissolved in acetonitrile and the solution was added to the aqueous solution of dextran to obtain a 40% aqueous solution of acetonitrile. After stirring for 1 h at 30°C, the bifunctional alkyne linker (5 eq per CE unit) was added to the reaction mixture. The mixture was stirred for another 3 h at 30°C. The solution was diluted with water and freeze-dried. The product was dissolved in water and purified, utilizing disposable PD10 desalting columns, following the instruction of the supplier. Freeze-drying resulted in a solid white powder. Product characterization was performed with 1H-NMR spectroscopy.
Subsequently, alkyne-dextran-N-Boc-cadaverine was dissolved in neat TFA and incubated for 1 h at RT to remove the Boc protecting group. The deprotected dextran was precipitated in cold MeOH and washed with 3 x MeOH. After drying, the product was dissolved in water and freeze dried to obtain alkyne-dextran-cadaverine as a white powder. Product characterization was performed with 1H-NMR spectroscopy (Supplementary Figure S7).
Azido-dextran-TAMRA was obtained by dissolving N3-dextran-cadaverine (1.0 eq.), dry DIPEA (25 eq.) and 5-(6)-TAMRA-NHS (10 eq.) in anhydrous DMSO in an overnight reaction at ambient temperature under continuous stirring. Afterwards it was precipitated in methanol, washed 3 times, dissolved in water, isolated on the PD10 column and lyophilized to yield a red-pink solid. Purification was performed by size-exclusion chromatography (SEC). Product formation was monitored via IR-spectroscopy.
The aqueous solution of ascorbic acid (3.2 eq. per azide moiety) and copper sulphate (1.6 eq. per azide moiety) were added to the azido-modified oncoFAP (1.6 eq. per azide moiety) in 30% aq. acetonitrile. To this solution, the 1 eq. of alkyne-dextran-TAMRA (−8.1 alkyne moieties/dextran) was added, and the resulting mixture was stirred for 3 h at 30°C. For the purification, a PD10 column was used following the instructions of the supplier. Freeze-drying gave the product as a pink solid with a yield of >95%.
Cloning of the α-CD3-scFv-Fc molecule began with the assembling of a gene fragment (Twist Biosciences) coding for the α-CD3-scFv derived from the fully human antibody foralumab with SapI overhangs. Using a human Fc framework insert vector, the α-CD3-scFv was inserted N-terminal to a partial hinge region to allow flexibility of the scFvs. To introduce the microbial transglutaminase-specific recognition sequence SPI7G for subsequent conjugation, the tag was inserted at the C-terminal end of the human Fc region using PCR primers. Following specific amplification of the genes of interest, SapI-mediate Golden Gate Assembly was performed as described previously (Carrara et al., 2022).
Antibody production and subsequent purification were performed as previously described (Carrara et al., 2022). In brief, Expi293-F cells were transfected according to the manufacturer’s instructions and harvested for purification 5 days post-transfection. With sterile-filtered cell culture supernatants, an ÄKTA Pure25 (Cytiva Lifesciences) was used for Protein A chromatography. A final step was performed to re-buffer against PBS using a HiTrap desalting column (Cytiva Lifesciences).
A solution of 225 µg of α-CD3-scFv-Fc fusion protein with C-terminal SPI7G tag (Ebenig et al., 2019) (1 eq), 4 mg of alkyne-dextran-cadaverine (150 eq) and 0.1 eq of microbial transglutaminase (mTG) in 1x PBS was incubated for 3 h at 37°C. Product formation was monitored via SDS-PAGE (Supplementary Figure S4). Product purification was performed via His-tag IMAC and subsequent rebuffering utilizing PD10 desalting column following the instructions of the supplier.
To a solution of α-CD3-scFv-Fc-dextran conjugate (1 eq), 50 eq of oncoFAP-N3 50 µM CuSO4 and 100 µM ascorbic acid was added and the reaction mixture was incubated for 3 h at 30°C. Product purification was performed via His-tag IMAC and subsequent rebuffering utilizing PD10 desalting column following the instructions of the supplier.
Cells were seeded in T-75 flasks (Cat. No. 658175, Greiner Bio-One) with 900,000 cells MDA-MB-231 fluc GFP or WS1 cells for the mono-cultures or with 225,000 tumor cells and 675,000 fibroblast cells for the co-culture in a ratio of 1:3 of tumor to fibroblast cells in 15 mL DMEM supplemented with 10% hiFBS. Three days after co-culture was started, the cells were detached with Accutase®. For spheroid dissociation into single cells for flow cytometry, a previous protocol was modified (Metzger et al., 2021) where 196 spheroids from each culture condition were collected after 3 days of co-culture, then centrifuged at 300 g for 5 min at RT, washed with 1x DPBS, and centrifuged again. Spheroids were then incubated for 45 min with Accumax™ (Cat. No. A7089, Sigma-Aldrich) at 37°C shaking with the LSE™ Benchtop Shaking Incubator (Corning). After the incubation time, the cells were resuspended with assay medium and centrifuged again. Then 1 × 10⁵ cells were pipetted per well from the 2D and 3D cultured cells into a 96-V bottom plate (Cat. No. 651101, Greiner Bio-One) and centrifuged for 5 min at 300g and 4°C. Thereafter, cells were washed twice with cold 1x DPBS supplemented with 1% BSA and stained with a PE-labeled anti-human FAPα antibody (Cat. No. FAB3715P, R&D Systems) or with a TAMRA-dextran-oncoFAP construct for 30 min on ice in the dark. The cell pellets were then washed three times with cold 1x DPBS supplemented with 1% BSA and resuspended in 100 µL 1x DPBS with 1% BSA and 5 nM SYTOX™ Red dead cell stain (Cat. No. S34859, Invitrogen™). After 15 min incubation on ice, the signal of duplicates was measured with the IntelliCyt® iQue® 3 Screener Plus system (Sartorius). The data were analyzed using the IntelliCyt® ForeCyt® Enterprise Client Edition 8.0 (R3) software. The gating strategies can be found in Supplementary Figures S2, S3.
All experimental data are expressed as mean ± SEM and details can be found in the figure legends. Statistical analysis was performed using Mann-Whitney test, Wilcoxon test, or Kruskal–Wallis one-way ANOVA in GraphPad Prism v9.1.2 software. p < 0.05 was considered statistically significant.
The original contributions presented in the study are included in the article/Supplementary Material, further inquiries can be directed to the corresponding author.
The studies involving humans were approved by the Ethics completed by the internal blood donor drive at Merck Healthcare KGaA. The studies were conducted in accordance with the local legislation and institutional requirements. The participants provided their written informed consent to participate in this study. Ethical approval was not required for the studies on animals in accordance with the local legislation and institutional requirements because only commercially available established cell lines were used.
MG: Data curation, Formal Analysis, Investigation, Methodology, Validation, Visualization, Writing–original draft, Writing–review and editing. LvG: Data curation, Formal Analysis, Methodology, Writing–review and editing. PB: Data curation, Formal Analysis, Methodology, Writing–review and editing. SC: Data curation, Formal Analysis, Methodology, Writing–review and editing. HK: Conceptualization, Funding acquisition, Resources, Supervision, Validation, Writing–review and editing. SG: Conceptualization, Investigation, Project administration, Resources, Supervision, Validation, Visualization, Writing–original draft, Writing–review and editing.
The author(s) declare that financial support was received for the research, authorship, and/or publication of this article. This research was funded in part by the European Commission (Marie Skłodowska-Curie ITN Magicbullet::Reloaded 861316). The funders had no role in the design of the study; in the collection, analyses, or interpretation of data; in the writing of the manuscript; or in the decision to publish the results.
MG and SG would like to sincerely thank Alessandro Prestipino for sharing his scientific expertise during the course of this study. MG would like to thank Jasmin Hunsrucker for her technical support.
SG is an employee of Merck Healthcare KGaA, Darmstadt. MG was an employee of Merck Healthcare KGaA, Darmstadt at the time of conducting this study as part of her Master’s thesis.
The remaining authors declare that the research was conducted in the absence of any commercial or financial relationships that could be construed as a potential conflict of interest.
All claims expressed in this article are solely those of the authors and do not necessarily represent those of their affiliated organizations, or those of the publisher, the editors and the reviewers. Any product that may be evaluated in this article, or claim that may be made by its manufacturer, is not guaranteed or endorsed by the publisher.
The Supplementary Material for this article can be found online at: https://www.frontiersin.org/articles/10.3389/fddsv.2024.1427407/full#supplementary-material
Acker, H., Carlsson, J., Mueller-Klieser, W., and Sutherland, R. (1987). Comparative pO2 measurements in cell spheroids cultured with different techniques. Br. J. Cancer 56 (3), 325–327. doi:10.1038/bjc.1987.197
Alvarez-Pérez, J., Ballesteros, P., and Cerdán, S. (2005). Microscopic images of intraspheroidal pH by 1H magnetic resonance chemical shift imaging of pH sensitive indicators. Magn. Reson Mater Phys. Biol. Med. 18, 293–301. doi:10.1007/s10334-005-0013-z
An, Y., Liu, F., Chen, Y., and Yang, Q. (2020). Crosstalk between cancer-associated fibroblasts and immune cells in cancer. J. Cell. Mol. Med. 24 (1), 13–24. doi:10.1111/jcmm.14745
Anderson, N. M., and Simon, M. C. (2020). The tumor microenvironment. Curr. Biol. 30 (16), R921-R925–5. doi:10.1016/j.cub.2020.06.081
Augsten, M., Sjöberg, E., Frings, O., Vorrink, S. U., Frijhoff, J., Olsson, E., et al. (2014). Cancer-associated fibroblasts expressing CXCL14 rely upon NOS1-derived nitric oxide signaling for their tumor-supporting properties. Cancer Res. 74 (11), 2999–3010. doi:10.1158/0008-5472.CAN-13-2740
Baal, N., Widmer-Teske, R., McKinnon, T., Preissner, K. T., and Zygmunt, M. T. (2009). In vitro spheroid model of placental vasculogenesis: does it work? Lab. Investig. 89 (2), 152–163. doi:10.1038/labinvest.2008.126
Badea, M. A., Balas, M., Hermenean, A., Ciceu, A., Herman, H., Ionita, D., et al. (2019). Influence of Matrigel on single- and multiple-spheroid cultures in breast cancer research. SLAS Discov. 24 (5), 563–578. doi:10.1177/2472555219834698
Baharvand, H., Hashemi, S. M., Kazemi Ashtiani, S., and Farrokhi, A. (2006). Differentiation of human embryonic stem cells into hepatocytes in 2D and 3D culture systems in vitro. Int. J. Dev. Biol. 50 (7), 645–652. doi:10.1387/ijdb.052072hb
Breslin, S., and O Driscoll, L. (2013). Three-dimensional cell culture: the missing link in drug discovery. Drug Discov. Today 18 (5–6), 240–249. doi:10.1016/j.drudis.2012.10.003
Breslin, S., and O Driscoll, L. (2016). The relevance of using 3D cell cultures, in addition to 2D monolayer cultures, when evaluating breast cancer drug sensitivity and resistance. Oncotarget 7 (29), 45745–45756. doi:10.18632/oncotarget.9935
Carrara, S. C., Harwardt, J., Grzeschik, J., Hock, B., and Kolmar, H. (2022). TriTECM: a tetrafunctional T-cell engaging antibody with built-in risk mitigation of cytokine release syndrome. Front. Immunol. 13, 1051875. doi:10.3389/fimmu.2022.1051875
Chen, L., Qiu, X., Wang, X., and He, J. (2017). FAP positive fibroblasts induce immune checkpoint blockade resistance in colorectal cancer via promoting immunosuppression. Biochem. Biophys. Res. Commun. 487 (1), 8–14. doi:10.1016/j.bbrc.2017.03.039
Clevers, H., Alarcon, B., Wileman, T., and Terhorst, C. (1988). The T cell receptor/CD3 complex: a dynamic protein ensemble. Annu. Rev. Immunol. 6 (1), 629–662. doi:10.1146/annurev.iy.06.040188.003213
Costa, A., Kieffer, Y., Scholer-Dahirel, A., Pelon, F., Bourachot, B., Cardon, M., et al. (2018). Fibroblast heterogeneity and immunosuppressive environment in human breast cancer. Cancer Cell. 33 (3), 463–479. doi:10.1016/j.ccell.2018.01.011
De Charette, M., Marabelle, A., and Houot, R. (2016). Turning tumour cells into antigen presenting cells: the next step to improve cancer immunotherapy? Eur. J. Cancer 68, 134–147. doi:10.1016/j.ejca.2016.09.010
DelNero, P., Lane, M., Verbridge, S. S., Kwee, B., Kermani, P., Hempstead, B., et al. (2015). 3D culture broadly regulates tumor cell hypoxia response and angiogenesis via pro-inflammatory pathways. Biomaterials 55, 110–118. doi:10.1016/j.biomaterials.2015.03.035
Di Modugno, F., Colosi, C., Trono, P., Antonacci, G., Ruocco, G., and Nisticò, P. (2019). 3D models in the new era of immune oncology: focus on T cells, CAF and ECM. J. Exp. Clin. Cancer Res. 38 (1), 117. doi:10.1186/s13046-019-1086-2
Dolznig, H., Rupp, C., Puri, C., Haslinger, C., Schweifer, N., Wieser, E., et al. (2011). Modeling colon adenocarcinomas in vitro: a 3D Co-culture system induces cancer-relevant pathways upon tumor cell and stromal fibroblast interaction. Am. J. Pathol. 179 (1), 487–501. doi:10.1016/j.ajpath.2011.03.015
Dreier, T., Lorenczewski, G., Brandl, C., Hoffmann, P., Syring, U., Hanakam, F., et al. (2002). Extremely potent, rapid and costimulation-independent cytotoxic T-cell response against lymphoma cells catalyzed by a single-chain bispecific antibody. Int. J. Cancer 100 (6), 690–697. doi:10.1002/ijc.10557
Ebenig, A., Juettner, N. E., Deweid, L., Avrutina, O., Fuchsbauer, H. L., and Kolmar, H. (2019). Efficient site-specific antibody–drug conjugation by engineering a nature-derived recognition tag for microbial transglutaminase. ChemBioChem. 20 (18), 2411–2419. doi:10.1002/cbic.201900101
Edmondson, R., Broglie, J. J., Adcock, A. F., and Yang, L. (2014). Three-dimensional cell culture systems and their applications in drug discovery and cell-based biosensors. Assay. Drug Dev. Technol. 12 (4), 207–218. doi:10.1089/adt.2014.573
Feig, C., Jones, J. O., Kraman, M., Wells, R. J. B., Deonarine, A., Chan, D. S., et al. (2013). Targeting CXCL12 from FAP-expressing carcinoma-associated fibroblasts synergizes with anti–PD-L1 immunotherapy in pancreatic cancer. Proc. Natl. Acad. Sci. 110 (50), 20212–20217. doi:10.1073/pnas.1320318110
Fitzgerald, A. A., and Weiner, L. M. (2020). The role of fibroblast activation protein in health and malignancy. Cancer Metastasis Rev. 39 (3), 783–803. doi:10.1007/s10555-020-09909-3
Freedman, J. D., Duffy, M. R., Lei-Rossmann, J., Muntzer, A., Scott, E. M., Hagel, J., et al. (2018). An oncolytic virus expressing a T-cell engager simultaneously targets cancer and immunosuppressive stromal cells. Cancer Res. 78 (24), 6852–6865. doi:10.1158/0008-5472.CAN-18-1750
Garin-Chesa, P., Old, L. J., and Rettig, W. J. (1990). Cell surface glycoprotein of reactive stromal fibroblasts as a potential antibody target in human epithelial cancers. Proc. Natl. Acad. Sci. 87 (18), 7235–7239. doi:10.1073/pnas.87.18.7235
Ghosh, S., Spagnoli, G. C., Martin, I., Ploegert, S., Demougin, P., Heberer, M., et al. (2005). Three-dimensional culture of melanoma cells profoundly affects gene expression profile: a high density oligonucleotide array study. J. Cell. Physiol. 204 (2), 522–531. doi:10.1002/jcp.20320
Goebeler, M. E., and Bargou, R. C. (2020). T cell-engaging therapies — BiTEs and beyond. Nat. Rev. Clin. Oncol. 17 (7), 418–434. doi:10.1038/s41571-020-0347-5
Goldstein, L. A., Ghersi, G., Piñeiro-Sánchez, M. L., Monica, S., Yeh, Y., Flessate, D., et al. (1997). Molecular cloning of seprase: a serine integral membrane protease from human melanoma. Biochim. Biophys. Acta BBA - Mol. Basis Dis. 1361 (1), 11–19. doi:10.1016/s0925-4439(97)00032-x
Hanahan, D., and Weinberg, R. A. (2000). The hallmarks of cancer. Cell. 100 (1), 57–70. doi:10.1016/s0092-8674(00)81683-9
Hanahan, D., and Weinberg, R. A. (2011). Hallmarks of cancer: the next generation. Cell. 144 (5), 646–674. doi:10.1016/j.cell.2011.02.013
Herter, S., Morra, L., Schlenker, R., Sulcova, J., Fahrni, L., Waldhauer, I., et al. (2017). A novel three-dimensional heterotypic spheroid model for the assessment of the activity of cancer immunotherapy agents. Cancer Immunol. Immunother. 66 (1), 129–140. doi:10.1007/s00262-016-1927-1
Hoeres, T., Holzmann, E., Smetak, M., Birkmann, J., and Wilhelm, M. (2019). PD-1 signaling modulates interferon-γ production by Gamma Delta (γδ) T-Cells in response to leukemia. OncoImmunology 8 (3), 1550618. doi:10.1080/2162402X.2018.1550618
Huehls, A. M., Coupet, T. A., and Sentman, C. L. (2015). Bispecific T-cell engagers for cancer immunotherapy. Immunol. Cell. Biol. 93 (3), 290–296. doi:10.1038/icb.2014.93
Ikeda, H., Old, L. J., and Schreiber, R. D. (2002). The roles of IFNγ in protection against tumor development and cancer immunoediting. Cytokine Growth Factor Rev. 13 (2), 95–109. doi:10.1016/s1359-6101(01)00038-7
Ivascu, A., and Kubbies, M. (2007). Diversity of cell-mediated adhesions in breast cancer spheroids. Int. J. Oncol. 31 (6), 1403–1413. doi:10.3892/ijo.31.6.1403
Kalluri, R., and Zeisberg, M. (2006). Fibroblasts in cancer. Nat. Rev. Cancer 6 (5), 392–401. doi:10.1038/nrc1877
Kapałczyńska, M., Kolenda, T., Przybyła, W., Zajączkowska, M., Teresiak, A., Filas, V., et al. (2016). 2D and 3D cell cultures – a comparison of different types of cancer cell cultures. Arch. Med. Sci. 14 (4), 910–919. doi:10.5114/aoms.2016.63743
Knight, E., and Przyborski, S. (2015). Advances in 3D cell culture technologies enabling tissue-like structures to be created in vitro. J. Anat. 227 (6), 746–756. doi:10.1111/joa.12257
Kraman, M., Bambrough, P. J., Arnold, J. N., Roberts, E. W., Magiera, L., Jones, J. O., et al. (2010). Suppression of antitumor immunity by stromal cells expressing fibroblast activation protein-alpha. Science 330 (6005), 827–830. doi:10.1126/science.1195300
Kumar, H. R., Zhong, X., Hoelz, D. J., Rescorla, F. J., Hickey, R. J., Malkas, L. H., et al. (2008). Three-dimensional neuroblastoma cell culture: proteomic analysis between monolayer and multicellular tumor spheroids. Pediatr. Surg. Int. 24 (11), 1229–1234. doi:10.1007/s00383-008-2245-2
Lakins, M. A., Ghorani, E., Munir, H., Martins, C. P., and Shields, J. D. (2018). Cancer-associated fibroblasts induce antigen-specific deletion of CD8 + T Cells to protect tumour cells. Nat. Commun. 9 (1), 948. doi:10.1038/s41467-018-03347-0
Lazard, D., Sastre, X., Frid, M. G., Glukhova, M. A., Thiery, J. P., and Koteliansky, V. E. (1993). Expression of smooth muscle-specific proteins in myoepithelium and stromal myofibroblasts of normal and malignant human breast tissue. Proc. Natl. Acad. Sci. 90 (3), 999–1003. doi:10.1073/pnas.90.3.999
Le, V. M., Lang, M. D., Shi, W. B., and Liu, J. W. (2016). A collagen-based multicellular tumor spheroid model for evaluation of the efficiency of nanoparticle drug delivery. Artif. Cells Nanomedicine Biotechnol. 44 (2), 540–544. doi:10.3109/21691401.2014.968820
Leach, D. R., Krummel, M. F., and Allison, J. P. (1996). Enhancement of antitumor immunity by CTLA-4 blockade. Science 271 (5256), 1734–1736. doi:10.1126/science.271.5256.1734
Lindner, T., Loktev, A., Giesel, F., Kratochwil, C., Altmann, A., and Haberkorn, U. (2019). Targeting of activated fibroblasts for imaging and therapy. EJNMMI Radiopharm. Chem. 4 (1), 16–15. doi:10.1186/s41181-019-0069-0
Luca, A. C., Mersch, S., Deenen, R., Schmidt, S., Messner, I., Schäfer, K. L., et al. (2013). “Impact of the 3D microenvironment on phenotype, gene expression, and EGFR inhibition of colorectal cancer cell lines,”, PLoS ONE. Editor N. Cordes, 8. doi:10.1371/journal.pone.0059689
Ma, H. li, Jiang, Q., Han, S., Wu, Y., Tomshine, J. C., Wang, D., et al. (2012). Multicellular tumor spheroids as an in vivo–Like tumor model for three-dimensional imaging of chemotherapeutic and nano material cellular penetration. Mol. Imaging 11 (6), 7290.2012.00012–98. doi:10.2310/7290.2012.00012
Martinez-Outschoorn, U. E., Goldberg, A. F., Lin, Z., Ko, Y. H., Flomenberg, N., Wang, C., et al. (2011). Anti-estrogen resistance in breast cancer is induced by the tumor microenvironment and can be overcome by inhibiting mitochondrial function in epithelial cancer cells. Cancer Biol. Ther. 12 (10), 924–938. doi:10.4161/cbt.12.10.17780
Metzger, W., Rösch, B., Sossong, D., Bubel, M., and Pohlemann, T. (2021). Flow cytometric quantification of apoptotic and proliferating cells applying an improved method for dissociation of spheroids. Cell. Biol. Int. 45 (8), 1633–1643. doi:10.1002/cbin.11618
Mhaidly, R., and Mechta-Grigoriou, F. (2020). Fibroblast heterogeneity in tumor micro-environment: role in immunosuppression and new therapies. Semin. Immunol. 48, 101417. doi:10.1016/j.smim.2020.101417
Millul, J., Bassi, G., Mock, J., Elsayed, A., Pellegrino, C., Zana, A., et al. (2021). An ultra-high-affinity small organic ligand of fibroblast activation protein for tumor-targeting applications. Proc. Natl. Acad. Sci. 118 (16), e2101852118. doi:10.1073/pnas.2101852118
Mori, N., Jin, J., Krishnamachary, B., Mironchik, Y., Wildes, F., Vesuna, F., et al. (2023). Functional roles of FAP-α in metabolism, migration and invasion of human cancer cells. Front. Oncol. 13, 1068405. doi:10.3389/fonc.2023.1068405
Nath, S., and Devi, G. R. (2016). Three-dimensional culture systems in cancer research: focus on tumor spheroid model. Pharmacol. Ther. 163, 94–108. doi:10.1016/j.pharmthera.2016.03.013
Navarrete-Bernal, M. G. C., Cervantes-Badillo, M. G., Martínez-Herrera, J. F., Lara-Torres, C. O., Gerson-Cwilich, R., Zentella-Dehesa, A., et al. (2020). Biological landscape of triple negative breast cancers expressing CTLA-4. Front. Oncol. 10, 1206. doi:10.3389/fonc.2020.01206
Nazarov, C., Surdo, J. L., Bauer, S. R., and Wei, C. H. (2013). Assessment of immunosuppressive activity of human mesenchymal stem cells using murine antigen specific CD4 and CD8 T cells in vitro. Stem Cell. Res. Ther. 4 (5), 128. doi:10.1186/scrt339
Nguyen, U., Squaglia, N., Boge, A., and Fung, P. A. (2011). The Simple WesternTM: a gel-free, blot-free, hands-free Western blotting reinvention. Nat. Methods 8 (11). doi:10.1038/nmeth.f.353
Orimo, A., Gupta, P. B., Sgroi, D. C., Arenzana-Seisdedos, F., Delaunay, T., Naeem, R., et al. (2005). Stromal fibroblasts present in invasive human breast carcinomas promote tumor growth and angiogenesis through elevated SDF-1/CXCL12 secretion. Cell. 121 (3), 335–348. doi:10.1016/j.cell.2005.02.034
Park, J. E., Lenter, M. C., Zimmermann, R. N., Garin-Chesa, P., Old, L. J., and Rettig, W. J. (1999). Fibroblast activation protein, a dual specificity serine protease expressed in reactive human tumor stromal fibroblasts. J. Biol. Chem. 274 (51), 36505–36512. doi:10.1074/jbc.274.51.36505
Phung, Y. T., Barbone, D., Broaddus, V. C., and Ho, M. (2011). Rapid Generation of in vitro multicellular spheroids for the study of monoclonal antibody therapy. J. Cancer 2, 507–514. doi:10.7150/jca.2.507
Pickl, M., and Ries, C. H. (2009). Comparison of 3D and 2D tumor models reveals enhanced HER2 activation in 3D associated with an increased response to trastuzumab. Oncogene 28 (3), 461–468. doi:10.1038/onc.2008.394
Piñeiro-Sánchez, M. L., Goldstein, L. A., Dodt, J., Howard, L., Yeh, Y., Chen, W. T., et al. (1997). Identification of the 170-kDa melanoma membrane-bound gelatinase (seprase) as a serine integral membrane protease. J. Biol. Chem. 272 (12), 7595–7601. doi:10.1074/jbc.272.12.7595
Pinto, B., Henriques, A. C., Silva, P. M. A., and Bousbaa, H. (2020). Three-dimensional spheroids as in vitro preclinical models for cancer research. Pharmaceutics 12 (12), 1186. doi:10.3390/pharmaceutics12121186
Place, A. E., Jin, H. S., and Polyak, K. (2011). The microenvironment in breast cancer progression: biology and implications for treatment. Breast Cancer Res. 13, 227. doi:10.1186/bcr2912
Rettig, W. J., Garin-Chesa, P., Healey, J. H., Su, S. L., Ozer, H. L., Schwab, M., et al. (1993). Regulation and heteromeric structure of the fibroblast activation protein in normal and transformed cells of mesenchymal and neuroectodermal origin. Cancer Res. 53 (14), 3327–3335.
Richter, M., Chakrabarti, A., Ruttekolk, I. R., Wiesner, B., Beyermann, M., Brock, R., et al. (2012). Multivalent design of apoptosis-inducing bid-bh3 peptide–oligosaccharides boosts the intracellular activity at identical overall peptide concentrations. Chem. Eur. J. 18 (52), 16708–16715. doi:10.1002/chem.201202276
Rønnov-Jessen, L., Petersen, O. W., and Bissell, M. J. (1996). Cellular changes involved in conversion of normal to malignant breast: importance of the stromal reaction. Physiol. Rev. 76 (1), 69–125. doi:10.1152/physrev.1996.76.1.69
Rønnov-Jessen, L., Petersen, O. W., Koteliansky, V. E., and Bissell, M. J. (1995). The origin of the myofibroblasts in breast cancer. Recapitulation of tumor environment in culture unravels diversity and implicates converted fibroblasts and recruited smooth muscle cells. J. Clin. Investig. 95 (2), 859–873. doi:10.1172/JCI117736
Salmon, H., Franciszkiewicz, K., Damotte, D., Dieu-Nosjean, M. C., Validire, P., Trautmann, A., et al. (2012). Matrix architecture defines the preferential localization and migration of T cells into the stroma of human lung tumors. J. Clin. Investig. 122 (3), 899–910. doi:10.1172/JCI45817
Scanlan, M. J., Raj, B. K., Calvo, B., Garin-Chesa, P., Sanz-Moncasi, M. P., Healey, J. H., et al. (1994). Molecular cloning of fibroblast activation protein alpha, a member of the serine protease family selectively expressed in stromal fibroblasts of epithelial cancers. Proc. Natl. Acad. Sci. 91 (12), 5657–5661. doi:10.1073/pnas.91.12.5657
Schneider, H., Deweid, L., Pirzer, T., Yanakieva, D., Englert, S., Becker, B., et al. (2019a). Dextramabs: a novel format of antibody-drug conjugates featuring a multivalent polysaccharide scaffold. ChemistryOpen 8 (3), 354–357. doi:10.1002/open.201900066
Schneider, H., Yanakieva, D., Macarrón, A., Deweid, L., Becker, B., Englert, S., et al. (2019b). TRAIL-inspired multivalent dextran conjugates efficiently induce apoptosis upon DR5 receptor clustering. ChemBioChem. 20 (24), 3006–3012. doi:10.1002/cbic.201900251
Souza, A. G., Silva, I. B. B., Campos-Fernandez, E., Barcelos, L. S., Souza, J. B., Marangoni, K., et al. (2018). Comparative assay of 2D and 3D cell culture models: proliferation, gene expression and anticancer drug response. Curr. Pharm. Des. 24 (15), 1689–1694. doi:10.2174/1381612824666180404152304
Strell, C., Paulsson, J., Jin, S. B., Tobin, N. P., Mezheyeuski, A., Roswall, P., et al. (2019). Impact of epithelial–stromal interactions on peritumoral fibroblasts in ductal carcinoma in situ. JNCI J. Natl. Cancer Inst. 111 (9), 983–995. doi:10.1093/jnci/djy234
Tripathi, M., Billet, S., and Bhowmick, N. A. (2012). Understanding the role of stromal fibroblasts in cancer progression. Cell. Adhes. Migr. 6 (3), 231–235. doi:10.4161/cam.20419
Tung, Y. C., Hsiao, A. Y., Allen, S. G., Torisawa, Y. suke, Ho, M., and Takayama, S. (2011). High-throughput 3D spheroid culture and drug testing using a 384 hanging drop array. Analyst 136 (3), 473–478. doi:10.1039/c0an00609b
Van Den Broek, T., Borghans, J. A. M., and Van Wijk, F. (2018). The full spectrum of human naive T cells. Nat. Rev. Immunol. 18 (6), 363–373. doi:10.1038/s41577-018-0001-y
Vinci, M., Gowan, S., Boxall, F., Patterson, L., Zimmermann, M., Court, W., et al. (2012). Advances in establishment and analysis of three-dimensional tumor spheroid-based functional assays for target validation and drug evaluation. BMC Biol. 10 (1), 29. doi:10.1186/1741-7007-10-29
Wang, L. C. S., Lo, A., Scholler, J., Sun, J., Majumdar, R. S., Kapoor, V., et al. (2014). Targeting fibroblast activation protein in tumor stroma with chimeric antigen receptor T cells can inhibit tumor growth and augment host immunity without severe toxicity. Cancer Immunol. Res. 2 (2), 154–166. doi:10.1158/2326-6066.CIR-13-0027
Wen, X., He, X., Jiao, F., Wang, C., Sun, Y., Ren, X., et al. (2017). Fibroblast activation protein-α-positive fibroblasts promote gastric cancer progression and resistance to immune checkpoint blockade. Oncol. Res. Featur Preclin. Clin. Cancer Ther. 25 (4), 629–640. doi:10.3727/096504016X14768383625385
Wiesner, R., Scheller, C., Krebs, F., Wätzig, H., and Oltmann-Norden, I. (2021). A comparative study of CE-SDS, SDS-PAGE, and Simple Western: influences of sample preparation on molecular weight determination of proteins. Electrophoresis 42 (3), 206–218. doi:10.1002/elps.202000199
Wüest, T., Moosmayer, D., and Pfizenmaier, K. (2001). Construction of a bispecific single chain antibody for recruitment of cytotoxic T cells to the tumour stroma associated antigen fibroblast activation protein. J. Biotechnol. 92 (2), 159–168. doi:10.1016/s0168-1656(01)00355-8
Yakavets, I., Francois, A., Benoit, A., Merlin, J. L., Bezdetnaya, L., and Vogin, G. (2020). Advanced co-culture 3D breast cancer model for investigation of fibrosis induced by external stimuli: optimization study. Sci. Rep. 10 (1), 21273. doi:10.1038/s41598-020-78087-7
Yamashita, M., Ogawa, T., Zhang, X., Hanamura, N., Kashikura, Y., Takamura, M., et al. (2012). Role of stromal myofibroblasts in invasive breast cancer: stromal expression of alpha-smooth muscle actin correlates with worse clinical outcome. Breast Cancer 19, 170–176. doi:10.1007/s12282-010-0234-5
Zhan, Y., Carrington, E. M., Zhang, Y., Heinzel, S., and Lew, A. M. (2017). Life and death of activated T cells: how are they different from naïve T cells? Front. Immunol. 8, 1809. doi:10.3389/fimmu.2017.01809
Zhou, S., Liu, M., Ren, F., Meng, X., and Yu, J. (2021). The landscape of bispecific T cell engager in cancer treatment. Biomark. Res. 9 (1), 38. doi:10.1186/s40364-021-00294-9
Experimental details for the synthesis of the constructs can be found in Appendix A.
Keywords: 3D cell culture, spheroid formation, tumor microenvironment, cancer-associated fibroblasts, fibroblast activation protein-α, T cells, immunosuppressive, in vitro
Citation: Grotz M, van Gijzel L, Bitsch P, Carrara SC, Kolmar H and Garg S (2024) Mimicking the immunosuppressive impact of fibroblasts in a 3D multicellular spheroid model. Front. Drug Discov. 4:1427407. doi: 10.3389/fddsv.2024.1427407
Received: 03 May 2024; Accepted: 05 July 2024;
Published: 26 July 2024.
Edited by:
Wolfgang Moritz, InSphero AG, SwitzerlandReviewed by:
Carmen Blanco Aparicio, Spanish National Cancer Research Center, SpainCopyright © 2024 Grotz, van Gijzel, Bitsch, Carrara, Kolmar and Garg. This is an open-access article distributed under the terms of the Creative Commons Attribution License (CC BY). The use, distribution or reproduction in other forums is permitted, provided the original author(s) and the copyright owner(s) are credited and that the original publication in this journal is cited, in accordance with accepted academic practice. No use, distribution or reproduction is permitted which does not comply with these terms.
*Correspondence: Sakshi Garg, c2Frc2hpLmdhcmdAbWVyY2tncm91cC5jb20=
Disclaimer: All claims expressed in this article are solely those of the authors and do not necessarily represent those of their affiliated organizations, or those of the publisher, the editors and the reviewers. Any product that may be evaluated in this article or claim that may be made by its manufacturer is not guaranteed or endorsed by the publisher.
Research integrity at Frontiers
Learn more about the work of our research integrity team to safeguard the quality of each article we publish.