 Marion T. J. van den Bosch1†
 Bryony J. Telford1†
 Sanaz Yahyanejad1*
 Thijs de Gunst1
 Harm C. den Boer1Rogier M. Vos1
 Chantal L. Duurland1Rianne Biemans2
 Ludwig J. Dubois2Laurens A. H. van Pinxteren1Roel Q. J. Schaapveld1Michel Janicot1
- 1InteRNA Technologies BV, Utrecht, Netherlands
- 2The M-Lab, Department of Precision Medicine, GROW—School for Oncology and Reproduction, Maastricht University, Maastricht, Netherlands
As cancer is a multifactorial disease, the multimodal action of microRNAs makes them an attractive tool for novel therapeutic approaches. The tumor suppressive miR-7-5p has been shown to act on many aspects of oncogenesis, including cell proliferation, migration and angiogenesis, by targeting a spectrum of key genes. We developed a synthetic chemically modified miR-7-5p mimic, 5A2, and performed a comprehensive functional characterization in a panel of human cancer cell lines. 5A2 reduced cell proliferation in most cell lines by inducing cell cycle arrest. To enable systemic delivery of 5A2 to tumors, it was formulated in a novel lipid nanoparticle (INT-5A2) and we demonstrated the anti-tumor activity of INT-5A2 in an experimental human liver tumor-bearing mouse model. Next, RNA-sequencing was used to gain more insight into the molecular mechanism of action of 5A2 and demonstrated a broad repression of target mRNAs. Interestingly, Ingenuity Pathway Analysis revealed a new role for 5A2 in metabolic pathways. Validation experiments in vitro showed that 5A2 reduced the expression of key glycolysis and glutaminolysis enzymes, leading to a decrease in glycolysis, lactate secretion and intracellular glutamate availability. Taken together, these data strongly suggest that miR-7-5p/5A2 is a potent tumor suppressor that targets various key cellular pathways across cancer types. Therefore, 5A2 may represent a promising novel treatment strategy in oncology.
1 Introduction
Cancer development is often not dependent on a single oncogenic event. Uncontrolled cell growth usually results from a series of mutations in proto-oncogenes, causing them to become oncogenes, as well as in tumor suppressor genes, thereby limiting the success of single target drugs. Furthermore, cancer cells have the ability to adapt molecular processes in order to survive (Holohan et al, 2013). Various mechanisms such as drug efflux, target switch, apoptosis inhibition, increased DNA damage repair, and metabolic reprogramming can lead to drug resistance, which is a major challenge in the treatment of cancer (Gottesman, 2002; Chen et al, 2020). Clearly, there is a need for novel multi-targeted approaches that tackle a broad range of cancer drivers while avoiding drug resistance as well as damage to normal cells.
MicroRNAs (miRNAs) are short (∼22 nucleotide) double-stranded RNA molecules that control the expression of hundreds of target genes (Bartel, 2004). They have a unique sequence that fully or partially binds to complementary mRNA sequences leading to post-transcriptional suppression of gene expression. Interestingly, miRNAs do not fully extinguish expression of their target mRNAs, and such a global dampening of biochemical machinery is likely to affect cancer cells, while sparing normal cells (Hydbring et al, 2017). Insights into the roles of miRNAs in development and disease, particularly in cancer, have made miRNAs attractive tools for novel therapeutic approaches (Ling et al, 2013). For example, INT-1B3 is a lipid nanoparticle-formulated mimic of the tumor suppressor miR-193a-3p that was shown to simultaneously address multiple hallmarks of cancer (Telford et al, 2021).
We previously identified miRNA-7 (miR-7) as cytotoxic to melanoma cancer cells in a high-throughput functional lentiviral-based screen of miRNAs (Poell et al, 2012). Subsequent screening using the same lentiviral library highlighted the utility of miR-7 as an angiogenesis inhibitor both in vitro and in vivo (Babae et al, 2014). Reduced levels of miR-7 have been linked to the development of cancer and it has been shown that miR-7 can increase the sensitivity of drug-resistant cancer cells to therapeutics and even inhibit metastasis (Zhao J. et al, 2015). Given the tumor suppressive role of miR-7 in many cancers, we developed 5A2, a synthetic chemically modified miRNA mimic with complete homology to the mature miR-7-5p guide (antisense) strand. Chemical modifications have been incorporated on the passenger strand to improve strand selection and prevent inflammatory pathway activation in vivo.
In this study, to characterize the anti-cancer properties of 5A2, we first analyzed its effect on cell proliferation in vitro. To facilitate systemic delivery of 5A2 to tumors in experimental models, it was formulated in a novel lipid nanoparticle (INT-5A2) which was used to confirm anti-tumor activity in vivo. Next, we performed RNA-sequencing and identified metabolic reprogramming as a novel mode of action of 5A2. We subsequently investigated the effect of 5A2 on different metabolic pathways including glycolysis and glutaminolysis.
2 Results
2.1 5A2 suppresses human cancer cell growth in vitro
To characterize the effect of 5A2 in cell-based assays, 5A2 was transiently transfected in a panel of human tumor cell lines from six different cancer types including colon (HCT116), liver (HEP3B, HUH7, SNU449), non-small cell lung carcinoma (A549, H460, H1299, H1975), skin (A2058, A375), pancreatic (PANC-1), and breast (BT549, BT29, Hs-578T, T47D, HCC38, HCC 1937). These cell lines represent a variety of different genetic backgrounds.
Transfection with 10 nM 5A2 increased the level of cell-associated oligonucleotide by more than 1,000-fold compared to untreated cells (Supplementary Figure S1), demonstrating significant transfection efficiency. Because the sequence of the endogenous miR-7-5p and the synthetic 5A2 are identical, it is not possible to distinguish between the transcripts with the qRT-PCR primers. The endogenous expression (in untransfected cells) was between 10-100 copies per cell, while in transfected cells the expression was increased to 70,000-700,000 copies per cell. Further, transfection with 5A2 reduced the expression of its known targets EGFR and RAF1 by more than 50% relative to mock in all cell lines (Supplementary Figure S2), signifying effective drug activity in vitro.
To determine the effect of 5A2 on proliferation, cells were transfected with 1 or 10 nM 5A2 and cell number determined after 96 h. 10 nM 5A2 reduced cell count by more than 40% compared to mock in 10 of the 17 cell lines (Figure 1A). The strongest effect was observed in HCT116 colon cancer cells with more than 90% reduction in cell number. The breast cancer cell line HCC1937 had the mildest effect with a ∼20% reduction in cell number after 96 h. There was no correlation between cell line mutation status (for example, P53 or KRAS expression) and the strength of response to 5A2 in the tested cell lines. Transfection of cells with 1 nM 5A2 had a much milder effect. In most cell lines, the scrambled miRNA control (3A1) caused minimal or mild reduction (<20%) in cell count, except in A2058 (42% reduction), but the effect of 5A2 was always stronger (Supplementary Figure S3). This is in line with our previous observations that so-called “negative” controls can also have their own sequence-specific effects that lead to changes in key cellular pathways, in a very cell type-dependent and hence unpredictable manner (van den Bosch et al, 2021).
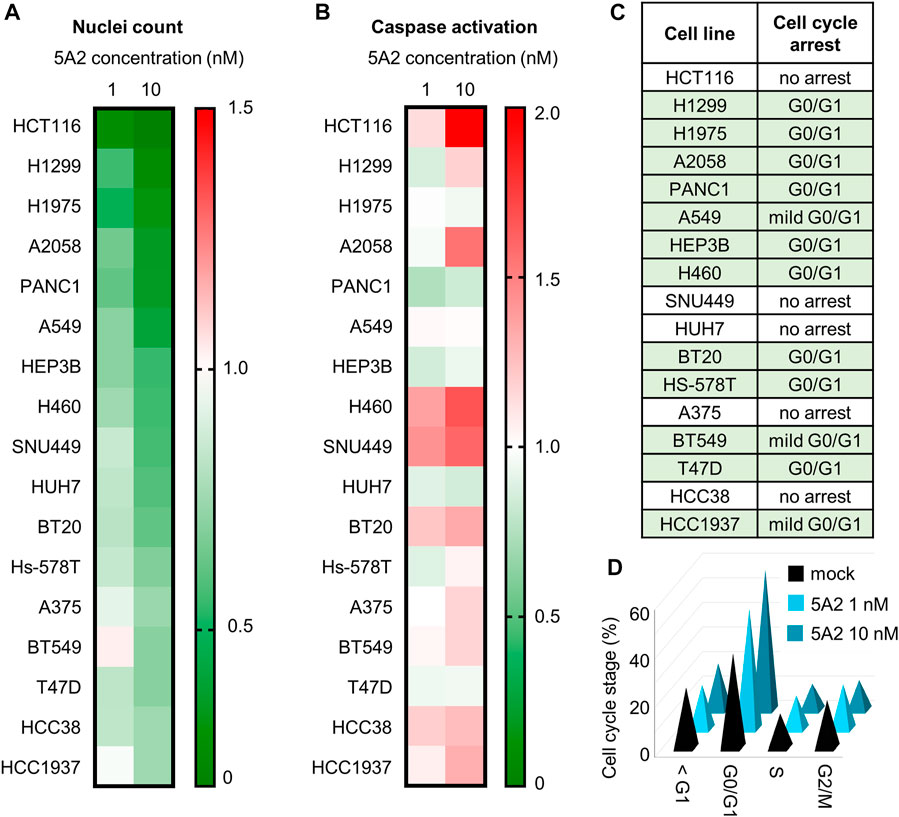
FIGURE 1. Effect of 5A2 on cell proliferation, apoptosis, and cell cycle in a panel of human cancer cell lines. (A) Nuclei count was determined 96 h after transfection with 5A2 by staining with Hoechst-33342 and imaging. Values were normalized to mock and are the mean of at least three independent replicates. (B) Caspase activation was measured at 48 or 72 h after transfection. Values were normalized to mock and are the mean of at least three independent replicates. The timepoint with the highest caspase activation is shown. (C) Cell cycle was assayed at 48, 72 or 96 h after transfection with 10 nM of either 3A1 or 5A2, and image-based DNA content analysis used to determine the proportion in each phase of the cell cycle. (D) Proportion in each cell cycle phase for H1299 at 96 h after transfection with 1 or 10 nM 5A2 or mock. Values are the mean of three independent replicates.
To determine if the reduction in cell proliferation induced by 5A2 is a result of increased caspase activation, cells were transfected with 1 or 10 nM 5A2 and assayed using the Promega caspase 3/7-GLO assay after 48 and 72 h. Despite a robust decrease in cell count in all cell lines, there was no clear pattern of increased caspase activation (Figure 1B). In only four cell lines (HCT116, A2058, H460, and SNU449) 10 nM 5A2 caused a >1.5-fold increase in caspase activity relative to mock, and 1 nM 5A2 had an even milder effect. As with proliferation, the effect of 3A1 on caspase activation was similar to the mock control in most cell lines, though in some cell lines (BT20, Hs-578T and T47D) 3A1 caused more caspase activation than 5A2 (Supplementary Figure S4). This indicates that although 5A2 reduced cell proliferation, the effect is not primarily caused by activation of caspase-mediated apoptosis.
Because apoptosis did not appear to significantly contribute to reduced cell proliferation in most cell lines, we investigated whether 5A2 induced a cell-cycle arrest using DNA content analysis. 12 of the 17 cell lines assayed showed an increase in the G0/G1 phase compared to mock (Figure 1C; Supplementary Table S1). For example, 96 h after transfection with 10 nM 5A2, 59% H1299 cells were in the G0/G1 phase compared to 38% in mock transfected cells (Figure 1D).
Together these data suggest that transfection with 5A2 can reduce cell proliferation through different biological pathways, causing a G0/G1 arrest or mild apoptosis.
2.2 5A2 reduces tumor growth in vivo
The in vivo effect of 5A2 was examined in an orthotopic model of the human HCC cell line HEP3B, grafted into the liver of immune-deficient mice. The level of alpha feto protein (AFP) in plasma served as a surrogate marker of tumor development because it is technically difficult to monitor tumor volume over time in an orthotopic model. AFP levels in serum have been demonstrated to provide good accuracy in human HCC diagnosis (Zhang et al, 2020) and we previously confirmed AFP levels as a sensitive readout for HCC tumor development in the HEP3B mouse model (Telford et al, 2021). 5A2 was formulated in a lipid nanoparticle (LNP), creating the drug INT-5A2. Mice received five consecutive injections in the first week after treatment start, followed by two injections a week for three more weeks (Figure 2A). All injections were intravenous at doses of 1 or 3 mg/kg. The miR-7-5p/5A2 levels were measured in tumors of PBS-treated mice and mice treated with 3 mg/kg INT-5A2. Significant levels of 5A2 were detected in the endpoint tumors, 48 h after the last injection (Figure 2B). These were about 1,700-fold higher than the background/endogenous levels of miR-7-5p in the PBS-treated tumors (p = 0.007).
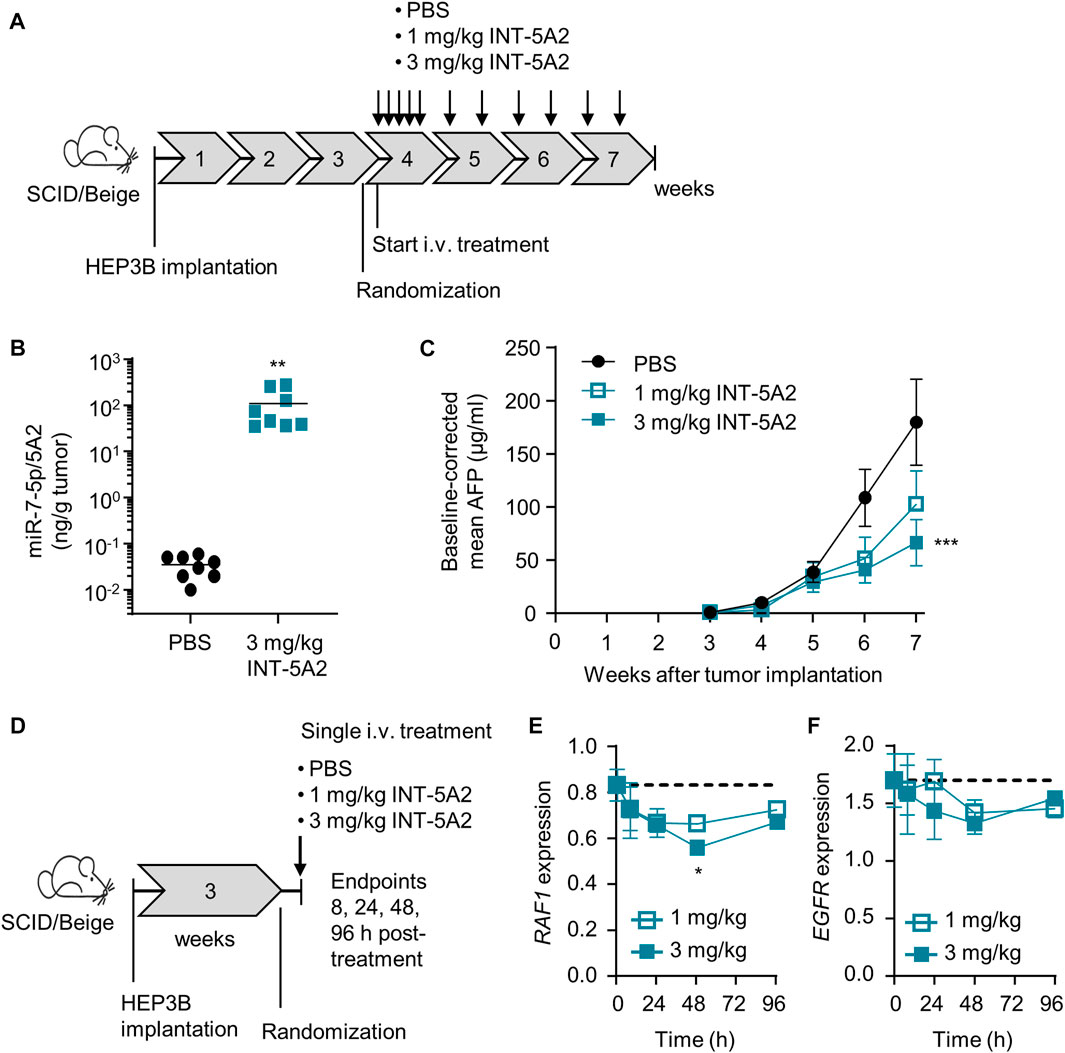
FIGURE 2. In vivo effect of 5A2 in the orthotopic HEP3B model. (A) Diagram showing the design of the therapeutic efficacy study. (B) Levels of miR-7-5p/5A2 in tumor tissue collected at endpoint were measured using stemloop qRT-PCR. Bars represent the group mean (**p < 0.01, n = 8 per group). (C) Alpha Feto Protein (AFP) levels in plasma were measured weekly after tumor implantation using ELISA. Group means were baseline-corrected to the timepoint of randomization (***p < 0.001, ±SEM, n = 16 for PBS group, n = 8 for INT-5A2 groups). (D) Diagram showing the design of the pharmacodymamics study. (E) Expression of RAF1 and EGFR (F) in tumor tissue was measured using qRT-PCR. Group means ± SEM are shown over time post-treatment (*p < 0.05, n = 3 per group). The dotted line represents the mean target expression level in the PBS control group.
Tumor growth inhibition (TGI) was monitored over time by weekly quantification of AFP levels. Mice treated with 3 mg/kg INT-5A2 showed a significant reduction in AFP levels with a ratio of 0.37 (p = 0.0009) as compared to the PBS group at endpoint (Figure 2C). Treatment at 1 mg/kg resulted in a trend towards reduced AFP levels with a ratio of 0.58 as compared to the PBS group at endpoint.
Additionally, a pharmacodynamic study was performed in the same in vivo model. Mice were treated with 1 or 3 mg/kg INT-5A2 as a single dose and tumor samples were collected at various timepoints after the injection (Figure 2D). Using qRT-PCR, mRNA expression levels of selected miR-7-5p predicted targets (RAF1 and EGFR) were measured. At 48 h after a single 3 mg/kg injection, RAF1 mRNA levels were significantly reduced (32% down, p = 0.018) and a trend towards EGFR downregulation was observed compared to PBS control (Figures 2E, F). Treatment with 1 mg/kg INT-5A2 resulted in a trend towards reduced expression of RAF1 and EGFR. Gene levels were almost back to baseline at 96 h. In conclusion, treatment with LNP-formulated 5A2 resulted in reduced HEP3B tumor growth as well as target engagement.
2.3 Transcriptome-wide analysis of 5A2-regulated gene expression
miR-7-5p has been shown to regulate a large number of genes involved in the development and progression of cancer (Kalinowski et al, 2014). Most studies use prediction algorithms to identify targets of interest and limit their validation to a specific cancer type. Hence, a transcriptome-wide analysis of miR-7-5p gene targets across multiple cancer types is lacking. In this study, RNA-sequencing was performed on six different human cancer cell lines, including A549 and H460 (both NSCLC), HUH7 and HEP3B (both HCC), A2058 (melanoma), and BT549 (triple-negative breast cancer), following transfection with 10 nM 5A2 for 24 h. We previously showed that 24 h post-transfection is a suitable timepoint for determining direct miRNA targets as well as initial changes in cell signaling (van den Bosch et al, 2021). The estimated expression level in the 5A2 sample was divided by the estimated expression level in the mock sample to determine if genes were down- or upregulated (ratio <1 or >1, respectively). Lists of differentially expressed (p < 0.05) genes were created for all six cell lines (Supplementary Table S2). Hundreds of genes were affected in each cell line, with overlapping genes showing regulation in the same direction (Figure 3A). There were also genes that were regulated in a cell line-specific manner. Consistent with the expected direct effect of miRNA on target mRNAs, the majority of differentially expressed genes were downregulated. Moreover, more than half of the identified downregulated genes were predicted miR-7-5p targets (Figure 3B; Supplementary Table S2). These included many well-known targets such as RAF1, RELA/NF-κB and EGFR.
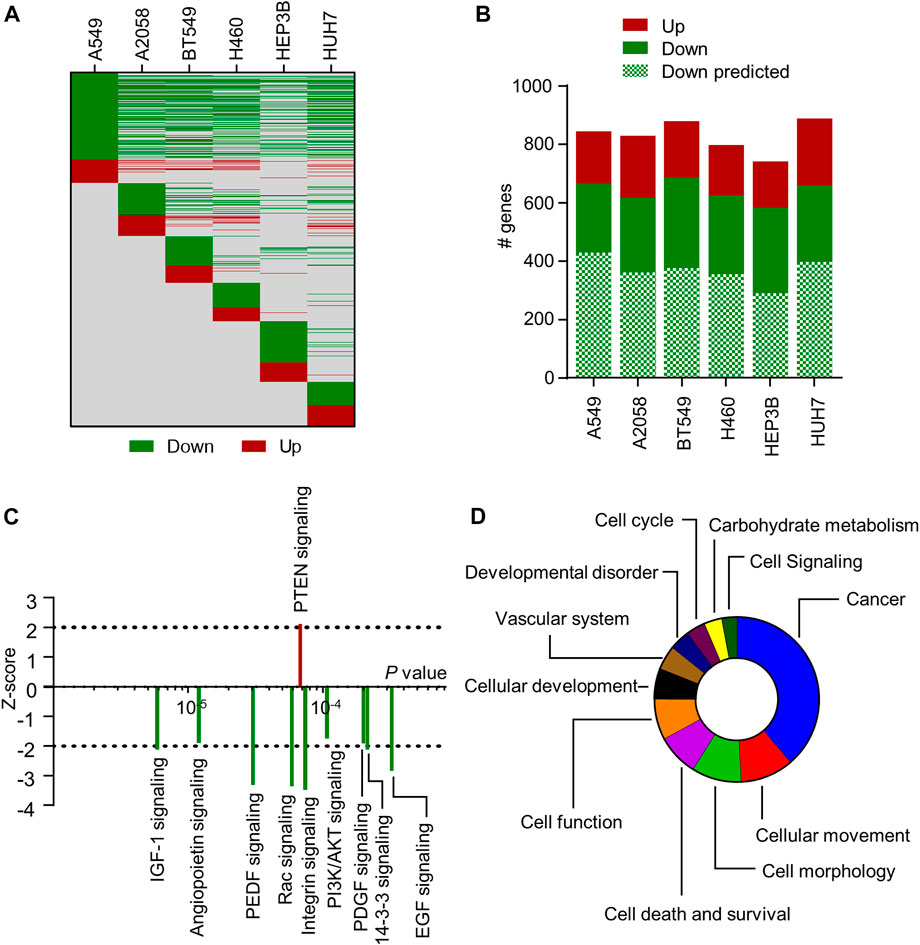
FIGURE 3. Transcriptome-wide analysis of 5A2-transfected cell lines. (A) Heat map showing differential gene expression induced by 10 nM 5A2 at 24 h post-transfection. All differentially expressed genes are on the y-axis and on the same row across all cell lines (due to the long list, gene names are not shown). Green means downregulated (estimated expression 5A2/estimated expression mock <1) and red means upregulated (estimated expression 5A2/estimated expression mock >1). Grey means no observed change in gene expression. (B) Number of differentially expressed genes that are downregulated and upregulated are shown per cell line. The number of downregulated genes that are predicted miR-7-5p targets is also indicated. (C) IPA was performed on genes (p < 0.05) regulated by 5A2 in at least 3 cell lines. Graph shows the top 10 signaling pathways regulated by 5A2 according to IPA’s Canonical Pathway Analysis. Directionality is indicated by z-score (<−2: inhibition; >2: activation). (D) Top categories of 5A2-regulated biological functions from IPA’s Diseases and Bio Function Analysis, ranked based on the number of functions in each category.
To examine how 5A2 regulates cellular pathways across cancer types, differentially expressed genes common to at least 3 cell lines (p < 0.05) were used as input for Ingenuity Pathway Analysis (IPA). 5A2 caused differential expression of 578 genes in at least 3 cell lines; 513 downregulated and 65 upregulated (Supplementary Table S3). In IPA’s Upstream Regulator analysis, miR-7-5p was the top predicted miRNA (p = 7.9 × 10⁻⁷), independently validating 5A2 as a biologically active miR-7-5p mimic. Canonical Pathway analysis showed a broad suppression (z-score < 2) of cellular pathways (Figure 3C; Supplementary Table S4), including IGF-1 signaling (p = 5.89 × 10⁻⁶, z = −2.111) and EGF signaling (p = 3.24 × 10⁻⁴, z = −2.828), which have previously been reported to be regulated by miR-7 (Webster et al, 2009; Jiang et al, 2010). The tumor suppressive PTEN signaling pathway was activated (p = 6.76 × 10⁻⁵, z = 2.111). Interestingly, most of the downregulated signaling pathways play a role in cancer metabolism.
Subsequently, IPA software was used to predict downstream biological effects of the observed gene expression changes induced by 5A2. Significant biological functions that were inhibited by 5A2 (z < −2) were related to cell movement, proliferation, viability, or tumorigenesis, and those that were activated (z > 2) were related to cell death (Supplementary Table S5). Finally, we categorized the biological functions regulated by 5A2 and made a ranking based on the number of functions in each category. Cancer was the top category of biological functions, followed by cellular movement and morphology (Figure 3D). Identified functions involved in vascular system development are in line with the previously described role of miR-7-5p in angiogenesis (Babae et al, 2014). Interestingly, 5A2 was also predicted to regulate many biological functions related to carbohydrate metabolism.
2.4 5A2 inhibits glycolysis and glutaminolysis
Because 5A2 decreased cell proliferation, but did not induce apoptosis, and the observation that 5A2 impacted several cell signaling pathways with a strong involvement in regulation of cell metabolism, we decided to explore the effect of 5A2 on cell metabolism. Tumor cells must expand their metabolic repertoire to survive in a harsh tumor microenvironment, this can include increasing aerobic glycolysis, increasing glutamine consumption, and increasing utilization of lipid metabolizing pathways (Schiliro and Firestein, 2021). Therefore, drugs targeting these processes are of interest for new cancer therapies.
Based on the RNAseq and IPA results, 5A2 is predicted to target several metabolic pathways important for cancer cell proliferation and survival (Figure 4A; Supplementary Table S4). The glycolysis pathway had an abundance of 5A2 targets (Supplementary Table S6), so we selected key enzymes to confirm the role of 5A2 in the glycolysis pathway regulation. 24 h after transfection with 10 nM 5A2, the expression of ALDOA, ALDOC, PKM, and LDHA genes was reduced by at least 25% relative to mock (Supplementary Figure S5). ALDOC and LDHA were also significantly downregulated in at least one cell line in the RNA-sequencing analysis (Supplementary Table S2). Together, these results indicate that 5A2 could reduce glycolysis at several points in the pathway.
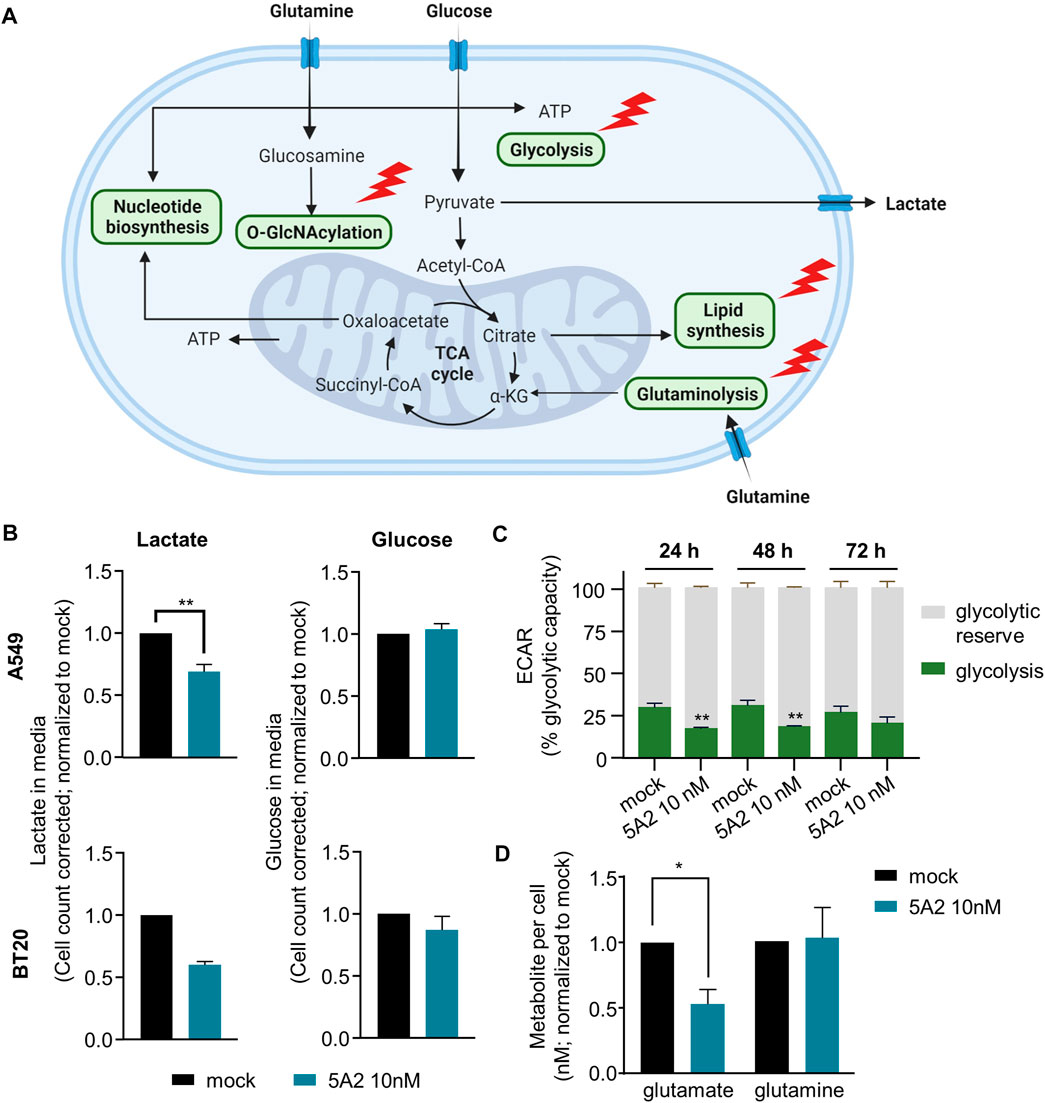
FIGURE 4. Effect of 5A2 on tumor cell metabolism. (A) Diagram showing different metabolic pathways with predicted or validated 5A2 targets. Adapted from “Cancer Metabolism in Nutrient-Replete Conditions,” by BioRender.com (2023). Retrieved from https://app.biorender.com/biorender-templates. (B) Cells transfected with 5A2 or mock were seeded 24 h before the assay. Media was aspirated 24 h later [after 72 h (A549) or 96 h (BT20) transfection] to measure glucose and lactate levels. Cells were then fixed and imaged to count cells. Glucose and lactate levels were corrected for cell proliferation differences using this cell count. Values were normalized to mock-transfected cells. A549 data are the mean of three independent replicates and error bars show standard error of the mean (**p < 0.01). BT20 data are the mean of two independent replicates and error bars show the standard deviation. (C) A549 cells transfected with 5A2 or mock were seeded 24 h before the assay. The extracellular acidification rate (ECAR), an indicator of glycolysis, was measured using the Seahorse FX96 extracellular Flux analyzer. Shown are the mean of three independent replicates and error bars show the standard deviation (**p < 0.01). (D) Cells transfected with 5A2 or mock were seeded 24 h before the assay. 24 h later (72 h after transfection), intracellular glutamine and glutamate levels were measured. Glutamine and glutamate levels were corrected based on cell count. Values were normalized to mock-transfected cells. Values are the mean of three independent experiments and error bars show the standard error of the mean (*p < 0.05).
To examine the effect of 5A2 on glycolysis in more detail we used the Promega Glucose-Glo™ and Lactate-Glo™ kits to measure the amount of glucose and lactate in the media of A549 and BT20 cells transfected with 5A2 and control conditions. Cells were transfected with 5A2 and media was sampled at optimal timepoints of 72 h for A549 and 96 h for BT20. To account for proliferation differences, a correction factor based on cell count was applied (see materials and methods for more information). 5A2 reduced lactate in the media by 31% in A549 cells (p = 0.0070) and by 40% in BT20 cells (two replicates) (Figure 4B). Interestingly, the amount of glucose remaining in the media of 5A2-transfected cells was similar to the mock condition in both cell lines (Figure 4B), indicating that the glucose uptake machinery was not affected by 5A2 transfection. Both lactate and glucose levels for scrambled miRNA control (3A1) and untreated cells were similar to the mock condition (Supplementary Figure S6).
To validate these results we performed the glycolytic capacity test using the Seahorse FX96 extracellular Flux analyzer (Figure 4C). Transfection with 5A2 for 24 h decreased glycolysis, as indicated by the extracellular acidification rate (ECAR), in A549 cells by 43% relative to mock-transfected cells (p < 0.0001). The effect was strongest 24 h after transfection, but still apparent at later time points. The effect of 3A1 was similar to mock, indicating that this is a miRNA sequence-specific effect (Supplementary Figure S7). These results are consistent with the observed effect of 5A2 on lactate and indicate that downregulation of glycolysis pathway genes by 5A2 decreases pathway function.
In addition to targeting glycolysis, several other metabolic pathways have predicted mir-7-5p/5A2 targets, including glutaminolysis. Our RNA-sequencing data showed that 5A2 targets the glutamine uptake transporter gene SLC1A5 as well as the critical glutaminase (GLS) enzyme (Supplementary Table S6). Further investigation confirmed that 5A2 decreased GLS expression in four different cell lines by 60%–80% (Supplementary Figure S8). Therefore, we investigated the effect of 5A2 on glutamine and glutamate levels using the Promega Glutamine/Glutamate-Glo™ Assay (Figure 4D). A549 cells were transfected with 10 nM 5A2 and cells harvested to measure metabolite levels after 72 h 5A2 reduced intracellular glutamate levels by 47%, relative to the mock-transfected condition (p = 0.0129). Conversely, there was no difference in intracellular glutamine levels between treatment conditions. These data suggest that 5A2 does indeed target the glutaminolysis pathway which leads to reduced glutamate availability in the cell.
3 Discussion
Although single-target therapy can benefit cancer patients, combination treatments are often needed for recurrent, metastatic, and drug-resistant disease. Drugs acting through multi-target effects could therefore represent a promising new therapeutic strategy in oncology. Since miRNAs are known to modulate the expression of hundreds of genes, miRNA mimics have the potential to reduce tumor growth by manipulating a broad network of cellular pathways, while minimizing the development of drug resistance. In this study, we examined the mode of action of 5A2, a synthetic mimic of the tumor suppressor miR-7-5p, in vitro and in vivo.
We first showed in cell-based assays that 5A2 decreases cell proliferation of multiple human tumor cell lines mainly through the induction of a G0/G1 cell cycle arrest. In a minority of cell lines, mild apoptosis was observed. These data are in line with the known anti-proliferative effects of mir-7-5p (Zhang et al, 2014; Giles et al, 2016; Hua et al, 2016), though some studies have described a stronger stimulating effect on apoptosis in some cell lines (Fan et al, 2017; Li et al, 2019; Yang et al, 2020). Next, we demonstrated in vivo tumor growth inhibition (as measured by plasma AFP levels) by 5A2, formulated in a lipid nanoparticle, in an orthotopic HCC model. To gain more insight into the mode of action of 5A2, we performed a transcriptome-wide analysis of 5A2-modulated gene expression by RNA-sequencing, which confirmed many known miR-7-5p targets, including EGFR (Webster et al, 2009), RAF1 (Liu et al, 2014) and RELA (Zhao X. Di et al, 2015). Based on IPA analysis, we began an investigation into the newly revealed effect of 5A2 on cancer cell metabolic pathways.
Altered metabolic state is a hallmark of cancer (Hanahan and Weinberg, 2011). Metabolic reprogramming allows cancer cells to proliferate in unfavourable conditions such as low nutrient availability or hypoxia. A common feature of cancer cells is utilizing anaerobic glycolysis, even in the presence of oxygen, to convert pyruvate to lactate rather than directing it through the TCA cycle. This leads to less ATP production, but more carbon intermediates, which can be utilized to construct new cells (Heiden et al, 2009). In this study, we showed that 5A2 targeting of key glycolysis enzymes reduces pathway function, leading to less lactate secretion. This is supported by Wang et al. (2014), who showed using the Seahorse FX assay that miR-7-5p reduced glycolysis in glioblastoma cells. Other studies have also demonstrated that miR-7 impairs glycolysis in gastric cancer cell lines (Jin et al, 2020) and H1299 lung cancer cells (Woo et al, 2020). Reducing glycolysis pathway function may have two benefits for cancer therapy. Firstly, restricting production of energy and building blocks for new cells reduces tumor growth. Secondly, lactate can act as a signalling molecule in the tumor microenvironment (Hirschhaeuser et al, 2011). Increased levels of lactate in the TME broadly suppresses cancer immunity by decreasing cytotoxic T-cell function, increasing M2-like macrophage polarization, and decreasing NK-cell cytotoxicity (Marchiq and Pouysségur, 2016). Since we showed that 5A2 transfection reduces extracellular lactate levels, further investigation into the downstream effects of this on immune cell function is warranted.
Given that 5A2 reduced lactate without affecting glucose consumption, there could be more pyruvate-derived acetyl-CoA available for the TCA, which could reduce the need to metabolize alternative energy sources such as glutamine. Cancer cells often rely on glutamine-derived α-KG for energy production (Jin et al, 2016). Fittingly, cancer cells often overexpress glutaminolysis pathway genes, either by upregulation of GLS (Xiang et al, 2015), or through modulation of the pathway by oncogenes. For example, c-myc transcriptionally binds to the promotor region of glutamine importers, increasing expression and resulting in higher glutamine uptake (Wise et al, 2008). Imported glutamine is converted by GLS into glutamate. We showed that 5A2 led to reduced glutamate availability in cancer cells, which may be in part due to downregulation of GLS. The downstream fate of glutamate depends on the cell state and microenvironment, but includes conversion to α-ketoglutarate (α-KG) which is further metabolized in the TCA cycle. Glutamate-derived α-KG further sustains cancer cell growth by providing building blocks for lipids (via reductive carboxylation), amino acids, and glutathione. α-KG can also act as a signaling molecule in the mTOR pathway, thereby influencing diverse cell functions such as autophagy, migration, and proliferation (Durán et al, 2012). Clearly, glutaminolysis is a promising target for cancer therapy. Further investigation of 5A2 on pathways downstream of glutamate should be investigated.
Besides the demonstrated role of 5A2 in glycolysis and glutaminolysis, other metabolic pathways may be important in its anticancer effect. For example, miR-7-5p/5A2 targets O-GlcNAc Transferase (OGT) (Supplementary Table S6), an important nutrient sensor linking hexosamine biosynthesis to fundamental post-translational protein modification reactions (Woo et al, 2020). Interestingly, our RNA-sequencing data also showed downregulation of predicted miR-7-5p targets that are key in lipid metabolism (Supplementary Table S6), a process often dysregulated in cancer cells (Koundouros and Poulogiannis, 2019), including SREBP-cleavage activating protein (SCAP), acetyl-CoA synthetase 2 (ACSS2) and acyl-CoA synthetase (ACSL). In addition, we observed reduced expression of fatty acid synthase (FASN) and sterol regulatory-element binding proteins (SREBF1 and 2), which are all critical for the generation of fatty acid-derived metabolites (Chen and Li, 2016). Further investigation of these important pathways could shed more light on the multifunctional role of miR-7-5p/5A2 in cancer cell metabolism. By targeting both glycolysis and glutaminolysis, and potentially other metabolic pathways, 5A2 may be able to prevent development of drug resistance.
In conclusion, this study demonstrates a prominent tumor suppressive role of the miR-7-5p mimic 5A2 in cell-based assays as well as in vivo. A broad molecular mode of action was revealed through RNA-sequencing analysis and the novel effect of 5A2 in metabolic pathways was validated in vitro. Therefore, 5A2 represents a promising novel treatment modality in oncology.
4 Materials and methods
4.1 Synthetic miR-7-5p mimic and formulation
The miR-7-5p mimic, 5A2 and the control oligonucleotide 3A1 (unrelated miRNA; based on Thermo Fisher Scientific #4464058) were manufactured by BioSpring GmbH (Frankfurt am Main, Germany). The nucleotide sequences are as follows (with limited 2′-O-methyl nucleotide modifications on the passenger strand; as shown in our patent application file (WO 2019/155094. 2019):
5A2 passenger (sense) strand: (3′)- TTACCUUCUGAUCACUAAAACAA -(5′).
5A2 guide (anti-sense) strand: (5′)- UGGAAGACUAGUGAUUUUGUUGU-(3′).
3A1 passenger (sense) strand: (3′)-TTAAUGCAGCAGCGCAGCAAU-(5′).
3A1 guide (anti-sense) strand: (5′)-UUACGUCGUCGCGUCGUUATT-(3′).
The formulation of 5A2 with lipid nanoparticle (INT-5A2) was created by Axolabs GmbH (Kulmbach, Germany).
4.2 Cell culture and transfection
The human cell lines HEP3B (HCC), SNU449 (HCC), H1299 (NSCLC), H1975 (NSCLC), H460 (NSCLC), A2058 (melanoma), BT549 (TNBC), HCT116 (colon), PANC1 (pancreatic), and A549 (NSCLC), BT20 (TNBC), Hs-578T (TNBC), A375 (melanoma), T47D (breast), HCC38 (TNBC), and HCC 1937 (TNBC) cells were obtained from ATCC. Human HUH7 (HCC) cells were obtained from the Japanese Cancer Resources Bank (JCRB). All cell lines were cultured at 37°C in a 5% CO2 humidified incubator, and in cell culture media recommended by suppliers.
For RNA-sequencing sample generation, cells were seeded at 80% confluency into 6-well cell culture plates 24 h before lipofectamine RNAiMAX (Thermo Fisher Scientific)-assisted transfection with 10 nM 5A2 or mock (transfection reagent only without miRNA mimic). Transfection media were aspirated at 24 h post-transfection and culture plates were stored at −80°C. Three independent replicate transfection experiments were performed for each cell line.
For functional assays, cells were seeded at 80% confluency into 6-well culture plates 4 h before lipofectamine RNAiMAX-assisted transfection with the indicated concentration of 5A2 or 3A1, or mock (transfection reagent only without miRNA mimic). After 16–48 h, transfected cells were dissociated using TrypL-E (Thermo Fisher Scientific) and re-seeded into assay plates. If cells were reseeded more than 24 h after transfection, media was changed 24 h after transfection.
4.3 Nuclei count and high content cell cycle analysis
For cell count and high content imaging, cells were reseeded 16 h after transfection into triplicate wells of black-walled, clear bottom 96-well plates. 48, 72, and 96 h after transfection, media was removed and replaced with 100 µL staining mix containing 0.25% PFA (Sigma-Aldrich), 0.075% saponin (Sigma-Aldrich) and 1 μg/mL Hoechst 33342 (Thermo Fisher Scientific) in PBS. Cell imaging was performed on the Thermo CellInsite Automated Imager using the inbuilt high content screening software to identify cell nuclei. Fifteen images/well using the 386_23 filter were captured at ×10 magnification. High content cell cycle analysis was performed using nuclei intensity information as described previously (Chan et al, 2013).
4.4 Caspase-Glo 3/7 assay
For Caspase-Glo 3/7 assay, cells were seeded into triplicate wells of white-walled, clear-bottom 96-well plates (Greiner) 16 h after transfection at the appropriate cell density to reach confluence 72 h later. The Caspase-Glo 3/7 assay (Promega) was performed 48 and 72 h after transfection, according to the manufacturers’ instructions.
4.5 Animal studies
The in vivo part of this study was performed by Crown Bioscience Inc., (Taicang, China). Female SCID/Beige mice, 7–9 weeks old, were orthotopically implanted with a single 2 mm3 piece of a subcutaneously grown HEP3B tumor into the left liver lobe on day 0. Mice were randomized on day 21. In the therapeutic efficacy study, treatments started on day 22 post-tumor cell implantation and continued for 3 weeks. AFP levels in plasma were measured once a week (determined by Crown Bioscience using ELISA). At the endpoint of the study on day 49 post-tumor cell implantation, tumors were collected and weighed. In the pharmacodynamics study, mice received a single treatment on day 22 post-tumor cell implantation. At various timepoints, mice were sacrificed for the collection of tumor tissue.
4.6 RNA isolation
For extraction of RNA from animal samples, tumor tissues that were stored at −80°C were disrupted using TissueLyser (Qiagen), after which TRIzol reagent (Thermo Fisher Scientific) was added.
For RNA-sequencing sample generation, TRIzol reagent was added onto transfected cells that were stored at −80°C and total RNAs were isolated according to the instructions of the miRNeasy Mini kit (Qiagen). The procedure included on-column DNase treatment.
For RNA isolation from cell culture for gene-qRT-PCR, transfected cells were seeded into 12-well tissue culture plates (TPP) 16 h after transfection. 24 h after transfection, media was aspirated from the 80% confluent cell monolayers, and frozen at −80°C. RNA was extracted using TRIzol according to the manufacturers’ instructions. RNA concentration was measured on NanoDrop One (Thermo Fisher Scientific).
4.7 Gene qRT-PCR
Quantification of gene mRNA expression was performed by quantitative real-time PCR (qRT-PCR) using SYBR Green (Bio-Rad). The sequences of the primers (IDT) used in this study are provided in Supplementary Table S7.
For in vivo samples, GeNorm analysis using the qBase + software was performed to identify the most stably expressed genes in the orthotopic HEP3B tumors that were subsequently used as reference genes for normalization of target gene expression. Target gene expression was calculated using 2-(Cttarget–GEOMEAN(Ctref1;Ctref2;Ctref3)), where ref1, ref2 and ref3 are the reference genes HMBS, UBC, and GUSB. Target expression for the different treatment groups was compared to target expression in the control PBS group.
For in vitro samples, expression values were calculated using 2−ΔΔCT method. ΔCt was calculated by subtracting the geometric mean of the Ct of two reference genes (B2M and UBC) from the Ct of the target genes. Values were normalized to mock to determine target downregulation.
4.8 miRNA qRT-PCR
The detection and quantification of miR-7-5p/5A2 was performed using stemloop qRT-PCR (for in vivo samples) or two-tailed qRT-PCR (for in vitro samples). Isolated RNA was reverse transcribed (RT) using RT primers (IDT) to amplify the miRNA. GrandScript cDNA synthesis Kit was from TATAA Biocenter. Subsequently, quantitative real-time PCR (qRT-PCR) was performed using SYBR Green (Bio-Rad). The primer sequences used in this study are provided in Supplementary Table S7. The forward qPCR primer for the 5A2 guide strand also binds to the endogenous mature miR-7-5p sequence, leading to parallel detection and quantification of both sequences.
For the quantification of miRNAs in vivo, a calibration curve was used to determine the concentration. Raw data for the calibration curves [log (gram/µL RT) and respective Ct-values] and for the tissue samples (Ct-values) were entered into Graphpad Prism to calculate the tissue concentrations expressed as ng/g tissue [Graphpad Prism analyze data settings: “XY analyses,” “Interpolate a standard curve,” model = line, X = log (gram/µL RT), Y = Ct].
For the quantification of miRNAs in vitro, results were similarly interpolated with a calibration curve to determine the amount of 5A2 per cell.
4.9 RNA-sequencing and data analysis
RNA samples from three independent replicate were pooled and subsequently processed by GenomeScan BV (Leiden, Netherlands) for next-generation RNA-Sequencing (Illumina HiSeq 4000/NovaSeq 6000), as previously described (van den Bosch et al, 2021).
Differential gene expression analysis was performed on the short-read dataset by GenomeScan BV. The read counts were loaded into the DESeq package v1.30.0, a statistical package within the R platform v3.4.4. DESeq was specifically developed to find differentially expressed genes between two conditions at the same timepoint (in this study: mock versus transfected with 5A2) for RNA-sequencing data with small sample size and over-dispersion (Anders and Huber, 2010). The DESeq algorithm performs an internal normalization to account for sequencing depth and RNA composition. Because the p-value is related to the estimated gene expression and the ratio of the gene expression in the transfected sample as compared to the gene expression in the mock sample, genes were selected for subsequent analysis based on the arbitrary cut-off p < 0.05. Furthermore, a minority of genes of which expression was absent in mock samples (estimated expression = 0) were excluded from further analyses.
4.10 Target prediction and pathway analysis
For miR-7-5p target prediction, three online tools were used: TargetScan 7.2 (Agarwal et al, 2015), MiRDB (Wong and Wang, 2015), and MicroT-CDS/Diana (Paraskevopoulou et al, 2013). Genes were considered predicted target if they were listed as target in at least one of the databases. For pathway analysis, lists of genes that were differentially expressed in at least three cell lines were uploaded and analyzed using Ingenuity Pathway Analysis (IPA) software (Krämer et al, 2014) (https://www.qiagenbioinformatics.com/products/ingenuitypathway-Analysis, QIAGEN Inc.), which computes two statistical measures. The overlap p-value is calculated using Fisher’s Exact Test and compares the significant differentially expressed genes in the dataset versus those known to be part of a pathway. The z-score provides a prediction of the directional effect. A positive z-score means activation while a negative z-score means inhibition. IPA considers p < 0.01 significant and z > 2 or < −2 indicative of a clear directionality.
4.11 Glucose and lactate detection
For Glucose-Glo and Lactate-Glo assays, cells were seeded 44 h after transfection into duplicate wells of 96-well assay plates (Greiner) at the appropriate density to be 80% confluent 48 h later. Cells were cultured in reduced-nutrient media (DMEM, no glucose, no glutamine, no phenol red, supplemented with 5 mM glucose, 2 mM L-glutamine, and 10% dialyzed FBS). Media was aspirated 72 and 96 h after transfection and diluted 1:10 with PBS before being processed in the Glucose-Glo and Lactate-Glo assay kits (Promega), according to the manufacturers’ instructions. A media-only sample was included to determine the background levels of glucose and lactate in the media. To account for differences in cell proliferation, cells were fixed and stained with Hoechst 33342 and a nuclei count performed as described above. This nuclei count was used to calculate glucose and lactate levels in the media per cell.
4.12 Seahorse FX assay
For the Seahorse FX96 assay 25,000 cells/well were reseeded 16, 40, or 60 h after transfection. Glycolytic capacity was measured using the Seahorse FX96 extracellular Flux analyzer as previously described (van Gisbergen et al, 2020). Extracellular rate of acidification (ECAR) was determined after replacing the growth medium with assay medium, according to manufacturer’s protocol. A glycolysis stress test was performed upon addition of glucose (10 mM), optimized oligomycin (1 µM) and 2-deoxyglucose (2-DG, 0.1 M) (Sigma-Aldrich). Cellular respiration was corrected for total protein content, measured using the Pierce BSA protein assay kit (Thermo Fisher Scientific).
4.13 Glutamine and glutamate detection
For the glutamine/glutamate-Glo assay, cells were seeded 72 h after transfection into duplicate wells of 96-well assay plates (Corning) at the appropriate density to be 80% confluent 24 h later. Cells were cultured in reduced-nutrient media (DMEM, no glucose, no glutamine, no phenol red, supplemented with 5 mM glucose, 2 mM L-glutamine, and 10% dialyzed FBS). 96 h after transfection cells were imaged on the Incucyte S3 (Sartorius) and cell number per well determined using cell by cell analysis. Intracellular levels of glutamine and glutamate were then determined using the glutamine/glutamate-Glo assay (Promega) according to the manufacturer’s instructions. To account for differences in cell proliferation, the cell number determined by the Incucyte was used to calculate the level of metabolite per cell.
4.14 Statistical analyses
Statistical analyses were performed using Graphpad Prism 7. A p-value < 0.05 was considered statistically significant. For the in vivo studies, a two-tailed, non-parametric Mann-Whitney U test was used to calculate differences in AFP levels and in tumor weights. To calculate statistical differences in target gene expression, an unpaired, two-tailed t-test comparing the means was used. In all statistical tests, the effect of the test items was compared to the PBS group. For the in vitro studies, to calculate statistical differences between the 5A2 samples and mock, an unpaired, two-tailed t-test was performed.
Data availability statement
The datasets presented in this study can be found in online repositories. The names of the repository/repositories and accession number(s) can be found below: https://www.ebi.ac.uk/; PRJEB60798.
Ethics statement
The animal study was reviewed and approved by the Institutional Animal Care and Use Committee (IACUC) of Crown Biosciences (Taicang, China).
Author contributions
MB, BT, SY, and MJ designed the study. TG coordinated the in vivo work. RB and LD performed the Seahorse FX assay. MB, BT, HB, and RV analyzed data. MB, BT, SY, CD, and MJ interpreted the data. RS, LP, and MJ supervised the study. MB and BT wrote the original manuscript. All authors contributed to the article and approved the submitted version.
Conflict of interest
MB, SY, CD, LP, RS, and MJ are employees of InteRNA Technologies BV and hold stock options in the company. BT, HB, RV, and TG are former employees of InteRNA Technologies BV.
The authors declare that this study received funding from InteRNA Technologies BV. The funder had the following involvement in the study: study design, data collection and analysis, decision to publish, and preparation of the manuscript.
The remaining authors declare that the research was conducted in the absence of any commercial or financial relationships that could be construed as a potential conflict of interest.
Publisher’s note
All claims expressed in this article are solely those of the authors and do not necessarily represent those of their affiliated organizations, or those of the publisher, the editors and the reviewers. Any product that may be evaluated in this article, or claim that may be made by its manufacturer, is not guaranteed or endorsed by the publisher.
Supplementary material
The Supplementary Material for this article can be found online at: https://www.frontiersin.org/articles/10.3389/fddsv.2023.1181637/full#supplementary-material
References
Agarwal, V., Bell, G. W., Nam, J. W., and Bartel, D. P. (2015). Predicting effective microRNA target sites in mammalian mRNAs. Elife 4, e05005. doi:10.7554/eLife.05005
Anders, S., and Huber, W. (2010). Differential expression analysis for sequence count data. Genome Biol. 11, R106. doi:10.1186/gb-2010-11-10-r106
Babae, N., Bourajjaj, M., Liu, Y., Van Beijnum, J. R., Cerisoli, F., Scaria, P. V., et al. (2014). Systemic miRNA-7 delivery inhibits tumor angiogenesis and growth in murine xenograft glioblastoma. Oncotarget 5, 6687–6700. doi:10.18632/ONCOTARGET.2235
Bartel, D. P. (2004). MicroRNAs: Genomics, biogenesis, mechanism, and function. Cell 116, 281–297. doi:10.1016/S0092-8674(04)00045-5
Chan, G. K. Y., Kleinheinz, T. L., Peterson, D., and Moffat, J. G. (2013). A simple high-content cell cycle assay reveals frequent discrepancies between cell number and ATP and MTS proliferation assays. PLoS One 8, e63583. doi:10.1371/JOURNAL.PONE.0063583
Chen, X., Chen, S., and Yu, D. (2020). Metabolic reprogramming of chemoresistant cancer cells and the potential significance of metabolic regulation in the reversal of cancer chemoresistance. Metabolites 10, 289–315. doi:10.3390/METABO10070289
Chen, Y., and Li, P. (2016). Fatty acid metabolism and cancer development. Sci. Bull. 61, 1473–1479. doi:10.1007/S11434-016-1129-4
Durán, R. V., Oppliger, W., Robitaille, A. M., Heiserich, L., Skendaj, R., Gottlieb, E., et al. (2012). Glutaminolysis activates rag-mTORC1 signaling. Mol. Cell 47, 349–358. doi:10.1016/j.molcel.2012.05.043
Fan, Q., Hu, X., Zhang, H., Wang, S., Zhang, H., You, C., et al. (2017). MiR-193a-3p is an important tumour suppressor in lung cancer and directly targets KRAS. Cell. Physiol. biochem. 44, 1311–1324. doi:10.1159/000485491
Giles, K. M., Brown, R. A. M., Ganda, C., Podgorny, M. J., Candy, P. A., Wintle, L. C., et al. (2016). microRNA-7-5p inhibits melanoma cell proliferation and metastasis by suppressing RelA/NF-κB. Oncotarget 7, 31663–31680. doi:10.18632/ONCOTARGET.9421
Gottesman, M. M. (2002). Mechanisms of cancer drug resistance. Annu. Rev. Med. 53, 615–627. doi:10.1146/ANNUREV.MED.53.082901.103929
Hanahan, D., and Weinberg, R. A. (2011). Hallmarks of cancer: The next generation. Cell 144, 646–674. doi:10.1016/J.CELL.2011.02.013
Heiden, M. G. V., Cantley, L. C., and Thompson, C. B. (2009). Understanding the warburg effect: The metabolic requirements of cell proliferation. Science 324, 1029–1033. doi:10.1126/SCIENCE.1160809
Hirschhaeuser, F., Sattler, U. G. A., and Mueller-Klieser, W. (2011). Lactate: A metabolic key player in cancer. Cancer Res. 71, 6921–6925. doi:10.1158/0008-5472.CAN-11-1457
Holohan, C., Van Schaeybroeck, S., Longley, D. B., and Johnston, P. G. (2013). Cancer drug resistance: An evolving paradigm. Nat. Rev. Cancer 13, 714–726. doi:10.1038/NRC3599
Hua, K., Jin, J., Zhang, H., Zhao, B., Wu, C., Xu, H., et al. (2016). MicroRNA-7 inhibits proliferation, migration and invasion of thyroid papillary cancer cells via targeting CKS2. Int. J. Oncol. 49, 1531–1540. doi:10.3892/IJO.2016.3660
Hydbring, P., Wang, Y., Fassl, A., Li, X., Matia, V., Otto, T., et al. (2017). Cell-cycle-targeting MicroRNAs as therapeutic tools against refractory cancers. Cancer Cell 31, 576–590.e8. doi:10.1016/j.ccell.2017.03.004
Jiang, L., Liu, X., Chen, Z., Jin, Y., Heidbreder, C. E., Kolokythas, A., et al. (2010). MicroRNA-7 targets IGF1R (insulin-like growth factor 1 receptor) in tongue squamous cell carcinoma cells. Biochem. J. 432, 199–205. doi:10.1042/bj20100859
Jin, H. F., Wang, J. F., Shao, M., Zhou, K., Ma, X., and Lv, X. P. (2020). Down-regulation of miR-7 in gastric cancer is associated with elevated LDH-A expression and chemoresistance to cisplatin. Front. Cell Dev. Biol. 8, 889. doi:10.3389/fcell.2020.555937
Jin, L., Alesi, G. N., and Kang, S. (2016). Glutaminolysis as a target for cancer therapy. Oncogene 35, 3619–3625. doi:10.1038/ONC.2015.447
Kalinowski, F. C., Brown, R. A. M., Ganda, C., Giles, K. M., Epis, M. R., Horsham, J., et al. (2014). microRNA-7: a tumor suppressor miRNA with therapeutic potential. Int. J. Biochem. Cell Biol. 54, 312–317. doi:10.1016/J.BIOCEL.2014.05.040
Koundouros, N., and Poulogiannis, G. (2019). Reprogramming of fatty acid metabolism in cancer. Br. J. Cancer 122, 4–22. doi:10.1038/s41416-019-0650-z
Krämer, A., Green, J., Pollard, J., and Tugendreich, S. (2014). Causal analysis approaches in ingenuity pathway analysis. Bioinformatics 30, 523–530. doi:10.1093/bioinformatics/btt703
Li, Q., Wu, X., Guo, L., Shi, J., and Li, J. (2019). MicroRNA-7-5p induces cell growth inhibition, cell cycle arrest and apoptosis by targeting PAK2 in non-small cell lung cancer. FEBS Open Bio 9, 1983–1993. doi:10.1002/2211-5463.12738
Ling, H., Fabbri, M., and Calin, G. A. (2013). MicroRNAs and other non-coding RNAs as targets for anticancer drug development. Nat. Rev. Drug Discov. 12, 847–865. doi:10.1038/nrd4140
Liu, Z., Liu, Y., Li, L., Xu, Z., Bi, B., Wang, Y., et al. (2014). MiR-7-5p is frequently downregulated in glioblastoma microvasculature and inhibits vascular endothelial cell proliferation by targeting RAF1. Tumour Biol. 35, 10177–10184. doi:10.1007/S13277-014-2318-X
Marchiq, I., and Pouysségur, J. (2016). Hypoxia, cancer metabolism and the therapeutic benefit of targeting lactate/H+ symporters. J. Mol. Med. Berl. 94, 155–171. doi:10.1007/S00109-015-1307-X
Paraskevopoulou, M. D., Georgakilas, G., Kostoulas, N., Vlachos, I. S., Vergoulis, T., Reczko, M., et al. (2013). DIANA-microT web server v5.0: Service integration into miRNA functional analysis workflows. Nucleic Acids Res. 41, W169–W173. doi:10.1093/nar/gkt393
Poell, J. B., van Haastert, R. J., de Gunst, T., Schultz, I. J., Gommans, W. M., Verheul, M., et al. (2012). A functional screen identifies specific micrornas capable of inhibiting human melanoma cell viability. PLoS One 7, e43569. doi:10.1371/journal.pone.0043569
Schiliro, C., and Firestein, B. L. (2021). Mechanisms of metabolic reprogramming in cancer cells supporting enhanced growth and proliferation. Cells 10, 1056. doi:10.3390/CELLS10051056
Telford, B. J., Yahyanejad, S., de Gunst, T., den Boer, H. C., Vos, R. M., Stegink, M., et al. (2021). Multi-modal effects of 1B3, a novel synthetic miR-193a-3p mimic, support strong potential for therapeutic intervention in oncology. Oncotarget 12, 422–439. doi:10.18632/ONCOTARGET.27894
van den Bosch, M. T. J., Yahyanejad, S., Alemdehy, M. F., Telford, B. J., de Gunst, T., den Boer, H. C., et al. (2021). Transcriptome-wide analysis reveals insight into tumor suppressor functions of 1B3, a novel synthetic miR-193a-3p mimic. Mol. Ther. - Nucleic Acids 23, 1161–1171. doi:10.1016/j.omtn.2021.01.020
van Gisbergen, M. W., Offermans, K., Voets, A. M., Lieuwes, N. G., Biemans, R., Hoffmann, R. F., et al. (2020). Mitochondrial dysfunction inhibits hypoxia-induced HIF-1α stabilization and expression of its downstream targets. Front. Oncol. 10, 770. doi:10.3389/fonc.2020.00770
Wang, B., Sun, F., Dong, N., Sun, Z., Diao, Y., Zheng, C., et al. (2014). MicroRNA-7 directly targets insulin-like growth factor 1 receptor to inhibit cellular growth and glucose metabolism in gliomas. Diagn. Pathol. 9, 211. doi:10.1186/S13000-014-0211-Y
Webster, R. J., Giles, K. M., Price, K. J., Zhang, P. M., Mattick, J. S., and Leedman, P. J. (2009). Regulation of epidermal growth factor receptor signaling in human cancer cells by MicroRNA-7. J. Biol. Chem. 284, 5731–5741. doi:10.1074/jbc.M804280200
Wise, D. R., Deberardinis, R. J., Mancuso, A., Sayed, N., Zhang, X. Y., Pfeiffer, H. K., et al. (2008). Myc regulates a transcriptional program that stimulates mitochondrial glutaminolysis and leads to glutamine addiction. Proc. Natl. Acad. Sci. U. S. A. 105, 18782–18787. doi:10.1073/PNAS.0810199105
Wong, N., and Wang, X. (2015). miRDB: An online resource for microRNA target prediction and functional annotations. Nucleic Acids Res. 43, D146–D152. doi:10.1093/nar/gku1104
Woo, S. Y., Lee, S. Y., Yu, S. L., Park, S. J., Kang, D., Kim, J. S., et al. (2020). MicroRNA-7-5p′s role in the O-GlcNAcylation and cancer metabolism. Non-coding RNA Res. 5, 201–207. doi:10.1016/J.NCRNA.2020.11.003
Xiang, Y., Stine, Z. E., Xia, J., Lu, Y., O’Connor, R. S., Altman, B. J., et al. (2015). Targeted inhibition of tumor-specific glutaminase diminishes cell-autonomous tumorigenesis. J. Clin. Invest. 125, 2293–2306. doi:10.1172/JCI75836
Yang, L., Kong, D., He, M., Gong, J., Nie, Y., Tai, S., et al. (2020). MiR-7 mediates mitochondrial impairment to trigger apoptosis and necroptosis in Rhabdomyosarcoma. Biochim. Biophys. Acta - Mol. Cell Res. 1867, 118826. doi:10.1016/J.BBAMCR.2020.118826
Zhang, J., Chen, G., Zhang, P., Zhang, J., Li, X., Gan, D., et al. (2020). The threshold of alpha-fetoprotein (AFP) for the diagnosis of hepatocellular carcinoma: A systematic review and meta-analysis. PLoS One 15, e0228857. doi:10.1371/JOURNAL.PONE.0228857
Zhang, X., Hu, S., Zhang, X., Wang, L., Zhang, X., Yan, B., et al. (2014). MicroRNA-7 arrests cell cycle in G1 phase by directly targeting CCNE1 in human hepatocellular carcinoma cells. Biochem. Biophys. Res. Commun. 443, 1078–1084. doi:10.1016/J.BBRC.2013.12.095
Zhao, J., Tao, Y., Zhou, Y., Qin, N., Chen, C., Tian, D., et al. (2015b). MicroRNA-7: A promising new target in cancer therapy. Cancer Cell Int. 15, 103–108. doi:10.1186/s12935-015-0259-0
Keywords: microRNA, RNA-sequencing, cancer metabolism, glycolysis, lipid nanoparticle, tumor suppressor, glutaminolysis
Citation: van den Bosch MTJ, Telford BJ, Yahyanejad S, de Gunst T, den Boer HC, Vos RM, Duurland CL, Biemans R, Dubois LJ, van Pinxteren LAH, Schaapveld RQJ and Janicot M (2023) The tumor suppressor 5A2, a synthetic miR-7-5p mimic, targets oncogenic and metabolic pathways, as revealed by transcriptome-wide analysis. Front. Drug Discov. 3:1181637. doi: 10.3389/fddsv.2023.1181637
Received: 07 March 2023; Accepted: 26 June 2023;
Published: 07 July 2023.
Edited by:
Bin Yu, Zhengzhou University, ChinaReviewed by:
Victor Mayoral-Varo, Camilo José Cela University, SpainXiaoying Luo, Shanghai Cancer Institute, China
Eduardo López-Urrutia, National Autonomous University of Mexico, Mexico
Copyright © 2023 van den Bosch, Telford, Yahyanejad, de Gunst, den Boer, Vos, Duurland, Biemans, Dubois, van Pinxteren, Schaapveld and Janicot. This is an open-access article distributed under the terms of the Creative Commons Attribution License (CC BY). The use, distribution or reproduction in other forums is permitted, provided the original author(s) and the copyright owner(s) are credited and that the original publication in this journal is cited, in accordance with accepted academic practice. No use, distribution or reproduction is permitted which does not comply with these terms.
*Correspondence: Sanaz Yahyanejad, c2FuYXoueWFoQGdtYWlsLmNvbQ==
†These authors have contributed equally to this work and share first authorship