- 1Department of Information Science and Engineering, Nitte Meenakshi Institute of Technology, Bangalore, India
- 2Dubai Business School, University of Dubai, Dubai, United Arab Emirates
- 3Mohammed Bin Rashid School of Government, Dubai, United Arab Emirates
- 4IMC University of Applied Sciences Krems, Krems an der Donau, Lower Austria, Austria
Introduction: Tech-enabled alternative micro-finance promotes income equality in growing BRICS and Austria across financial crises and pandemics. Are financial access and digital skills equally economically valuable? Our study uses inputs: Human Capital, Alternative Micro-finance, Digitization, Governance, and Entrepreneurship, GDP, inflation, population growth, pandemics, and economic crises using the global 2000–2022 to explain income equality using SWIID Gini disposable and market income index as outputs.
Methods: The study uses Principal component analysis for reducing data dimensionality and collinearity. The study uses OLS, Dynamic Mixed Model, and random forest tree, a machine learning technique, as models to model digitally enable micro-finance.
Results: RFT model diagnostics consistently were better than OLS and GMM. Reduced income inequalities resulted from public and private infrastructure investments, government policy interventions to fight pandemics, economic crises, and conflicts, as well as from expansion in GDP.
Discussion: The study concludes that digitally enabled micro-finance plays a crucial role in reducing income inequalities, particularly during times of crisis. Key policy implications include the need for government support in digital infrastructure to enhance financial inclusion. By pooling their resources, the BRICS block can empower micro-finance organizations to ameliorate disruptions from COVID-19 and economic crises.
1 Introduction
Using SDG monitoring, the UN aims to share prosperity and less extreme poverty by 2030. Thus, every nation's greatest asset—human capital—is nurtured and empowered. The poor always have income gaps because they need high-quality human capital to work and study. Youth employment reduces poverty and boosts the economy. Pandemics affect digitalization, financial inclusion, and economic equality; this article examines their relationship.
Previous research has examined income inequality (Consoli et al., 2023; Furceri and Ostry, 2019; Iacono and Ranaldi, 2022; Tassaeva, 2021), but digital technology adoption, alternative finance, and income equality during uncertain pandemics in expanded BRICS is lacking. Alternative finance, artificial intelligence, and digital wallets prioritize these links to minimize income inequality through social welfare, notably during pandemics in the expanded BRICS economies.
Despite significant technical growth, the BRICS countries face income inequality. As most of the world's population lives in these countries, technology influences economic inequities, governance, digitization, human capital, and technical advances, which must be addressed. With the focus on inclusive economic growth, financial incorporation may assist these nations in fostering more equitable development. The BRICS alliance expanded to eleven states with US$30.76 trillion in GDP, 30% of the world economy, and 40% of the global population in October 2023. BRICS members emphasized cooperation to advance the SDGs and reduce poverty, food insecurity, and global recovery. Zeroing poverty, especially extreme poverty, is the biggest global issue and a prerequisite for sustainable development. BRICS growth boosts competitiveness through e-skills and finance. Recently, a study suggested that the enlarged BRICS block that prioritized ICT in Smart Specialization is more varied and inventive (BRICS Summit, 2023).
The COVID pandemic in BRICS, with lockdowns and movement restrictions, hindered economic activity and earnings because most micro-finance recipients labor in informal or semi-formal industries. Liquidity shortages increased micro-finance defaults. In such scenarios, micro-finance providers leveraged digital platforms for loan distribution and collection and reevaluated lending criteria and risk assessment methods.
For human capital mobilization, BRICS uses alternative funding for R&D, education, infrastructure, and skill development. Without skill upgrading, digital technology and finance may widen economic divides (Iammarino et al., 2020). Digitalisation and financial inclusion can help economies catch up and lessen inequity gaps, but pandemics may increase income disparity. Income inequality determinants must be identified to overcome future growth constraints (Iammarino et al., 2019). Digital technologies are skill-biased. Therefore, e-skill development may affect labor demand and wages differently for persons with various education, occupations, and employment (e.g., routine vs. non-routine jobs). E-skills allow copying and altering advanced external and financial data. Innovation and creativity will boost revenues for established organizations in some industries and give startups and SMEs new commercial and technology prospects in others. Talent bias and innovation affect workforce and corporate earnings, affecting income distribution.
Antwi et al. (2024) examine how competition and financial inclusion affect financial stability in 60 developing countries from 2002 to 2019. Using the system GMM estimator, their work highlights financial development as a key driver of financial inclusion and financial stability in developing economies. Their research suggests ways to increase financial inclusion in developing economies to improve financial stability.
Bibi et al. (2024) explore how governance affects social inclusion (SI), ICT, and financial inclusion (FI) in 46 countries from 2010 to 2020. Panel-corrected standard errors, fully modified OLS, and dynamic OLS methods were used. SI negatively affects FI. FI benefits from ICT infrastructure. Governance with good ICT infrastructure and inclusive communities boosts FI.
SWIID (Solt, 2020) Gini index from 2000 to 2022 is used as a measure of income inequality. Human capital, financial inclusion, digitization, governance, and entrepreneurship are independent factors to explain income equality. GDP, inflation, population growth, pandemics, and economic crises operate as controls. The expanded 11 BRICS group (Dummy =1) is contrasted to Austria, the EU country with the lowest economic inequality, highest financial access, and highest digitization. We use OLS, GMM and random forest tree (RFT) methods to model the relationships.
RFT ranks BRICS and Austria factors in decreasing significance. Governance indicator, Human Capital indicator, digitization, and alternative micro-finance (AAMF) reduced income disparities, according to RFT model results. Inequality reduction also involves entrepreneurship. Income equality improves with gross fixed capital production (infrastructure investments), GDP, inflation, pandemics, and economic crises. SDG-2030 targets and early research imply that government initiatives to enhance community growth and wellbeing reduce income disparity, consistent with the findings of Zhang and Ben Naceur (2019).
1.1 Uniqueness
Despite much research on income gaps and technological innovation, few focus on emerging markets. Research is scant, but financial accessibility may help expand the BRICS block to address the income inequality-technical growth gap. In the BRICS block, little is known about how digitization and financial inclusion affect economic inequality. Our research will also further entrepreneurship, governance, human capital, technology, income equality, and financial inclusion research. Policymakers can use our research findings to accomplish SDGs 3-Good Health and WellBeing, 4-Quality Education, 8-Decent Work and Economic Growth, 9-Innovation and Infrastructure, 10-Reduced Inequalities, and 17-Partnerships in BRICS economies by 2030. Despite existing research on income inequality, there is a significant gap in studies exploring the impact of digital finance on income equality within the expanded BRICS block, especially during crises. Our manuscript has these unique qualities.
1.2 Innovation
The study uses AI-based Random Forest Tree (RFT) modeling. It shows its superiority over Dynamic Panel GMM regression and OLS methods used in previous studies. Previous research focused on macroeconomic issues or technical developments, but this study investigates both income disparities.
1.3 Research objectives
The research objectives are: to evaluate knowledge and skills in promoting income equality; to analyze the role of alternative micro-finance in fostering economic equality; to assess the extent of digitization in advancing income equality; to evaluate the effectiveness of digital tools in boosting entrepreneurship and earnings equality; and to analyze government policy interventions in promoting income equality and inclusion among SMEs.
2 Conceptual framework and literature review
2.1 Theoretical framework
2.1.1 Theory of micro-finance
In the research article “Micro-finance: A bibliometric exploration of the knowledge landscape” (Pattnaik et al., 2024) authors explained the key theories such as Economic, Financial Intermediation, Institutional, Information Asymmetry, and Social Capital Theories to model micro-finance. According to these theories, micro-financial institutions (MFIs), sometimes known as “banks for the poor,” provide fundamental financial goods and services at affordable prices to low-income people excluded from the traditional financial system. MFIs provide credit to poor and near-poor borrowers excluded from the traditional banking system, allowing them to become financially included. Accordingly, MFIs can help reduce poverty and boost economic opportunities worldwide. Leveraging innovative contractual structures and organizational forms to lower the risk and expense of small, uncollateralized loans is a priority for the micro-finance movement. Recent studies suggest that digital financial services have the potential to bridge income gaps, yet their impact on the expanded BRICS block remains underexplored.
“The Microfinance Schism” (Morduch, 2000) critiques the “win-win” proposition that microfinance can simultaneously achieve financial sustainability and reduce poverty. He argues that this assumption lacks strong empirical support, especially when it comes to serving the most vulnerable populations. Morduch's insights are crucial when considering how digital microfinance can expand outreach. While digital tools may reduce costs and increase access, there is a risk that the focus on financial sustainability could overshadow social goals, such as promoting income equality for vulnerable groups during crises like the pandemic.
Alternative strategies of for-profit, not-for-profit and state-owned Nepalese microfinance institutions for poverty alleviation and women empowerment (Dhungana et al., 2023) investigates how different types of microfinance institutions (MFIs) in Nepal adopt varied strategies to alleviate poverty and empower women. The study finds that for-profit, not-for-profit, and state-owned MFIs employ distinct approaches, with private MFIs surprisingly reaching poorer populations more effectively than expected. In the context of digital microfinance promoting income equality during crises, such as the pandemic, this research provides valuable insights into how various microfinance strategies target different socioeconomic groups. The lessons from the Nepalese context can inform how digital microfinance, when applied in the BRICS block, can balance financial inclusion with social impacts, particularly for vulnerable populations.
In the research work “How the method for delivering loans impacts on the economic efficiency of micro-finance institutions” (Fernández Sánchez et al., 2024) indicate that village banking and solidarity groups improve MFIs' cost efficiency compared to traditional individual loans. In addition, MFIs with a higher number of rural borrowers are more cost-efficient than those with more urban borrowers since Community financing has an edge over traditional lending in collecting borrower information. MFIs should use cost-efficient lending methods to attain financial self-sufficiency and long-term sustainability.
2.1.2 Collaborative intervention theory of digital financial services
According to Pattnaik et al. (2024), DFS theory states that various stakeholders can achieve income equality. Income equality requires multi-stakeholder collaboration (Yunus et al., 2010). DFS's actions expand digital financial systems by delivering financial services to more customers. Financial institutions, commercial banks, MFIs, government programs, village savings and loan associations (VSLAs), mobile network operators, self-help groups, and technology corporations provide digital financial services. Technology is popular in East Africa and South Asia, while other regions are still catching up (Morduch, 2000). Technology, finance, and telecom industries collaborate to promote economic equality using digital financial solutions. In socially inclusive societies, people use formal financial services more, which improves income equality (Al-Azzam and Charfeddine, 2022).
Mobile platforms improve operational efficiency and bring financial services to remote places, creating a more inclusive digital economy (Zhang et al., 2022). One important topic of research is the adoption of developing technology in micro-finance. How these technologies can connect financial service providers to the financially excluded population offers new growth and service delivery prospects (Vassallo et al., 2019). The problems and effects of integrating digital technologies, including cashless digital payment services, peer lending, crowdfunding, and others, are crucial for researchers, industry stakeholders, and policymakers (Daowd et al., 2021). Technology and data can help MFIs become customer-centric, reduce operational risks, cut costs, and boost efficiency (Wondirad, 2022).
2.1.3 Theory of income inequality
Inequality undermines economic growth and stability. Based on Schumpeterian Growth Theory, Aghion (2002) argues that innovation and technological advancement may initially increase between groups, but they can eventually promote upward mobility and reduce inequality by investing in education and skills. Ahn et al. (2018) showed that income disparity affects consumption spending, and low-income households react slowly to economic shifts, according to their models. These studies show that income disparity affects economic growth and redistribution. Ahmed and Shadmani (2024) show that government transfer lowers female income inequality. While the female income ratio rises, government transfer outlays fall throughout the anticipated horizon.
2.2 Theoretical research gaps
Although previous literature provides significant insights, the dynamic linkages between income inequality, unemployment rates, and government transfer policies are little understood. Risk protection, simple access to health services, sufficient, affordable education and skills, self-learning capacity, and effective governance through policy action need to be researched to reduce Income disparity.
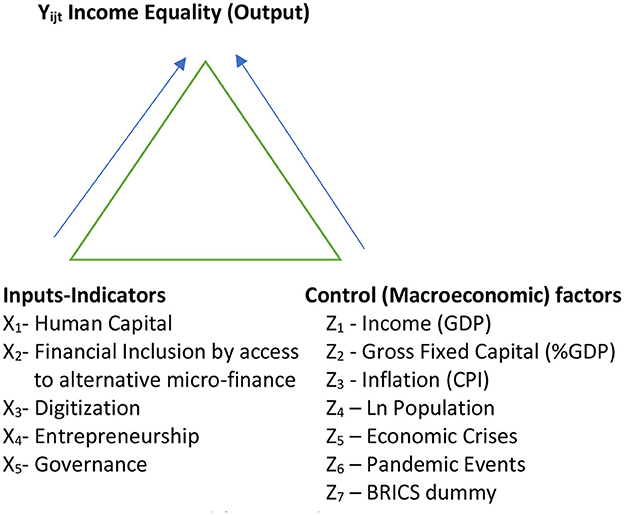
With Austria (EU) serving as the benchmark, our goal is to model income disparity (the output Yit) in the enlarged BRICS block and how different explanatory factors (the inputs Xit and the control factors Zit) impact income equality. Figure 1 illustrates the concept to answer the research objectives. In Figure 1, income equality is conceptually driven by human capital, financial inclusion, digitization, entrepreneurship, governance, and macro-economic factors such as GDP, Inflation, Population, and pandemic events.
Equation 1 shows the empirical formulation of our conceptual framework.
Where:
• αij is the constant term, providing the baseline level of the dependent variable when all independent variables are zero.
• βij measures the effect of the k-lagged dependent variable, Yi − k, jt, capturing the persistence or carry-over effect from the previous period.
• πi − k, j and μi − 1, jt are coefficients for the k-period lagged independent variables Xi − k, jt and control variables Zi − k, jt, respectively. These variables include critical factors such as Human Capital (X1), Financial Inclusion—Access to Alternative Finance (X2), Digitization (X3), Entrepreneurship (X4), and Governance (X5), along with control variables that account for other influencing factors.
• BRICS dummy j (Austria = 0 and BRICS = 1) is included to control for specific effects and the collective influence of being a part of the BRICS consortium.
• εi − k, jt is the error term, accounting for unobserved factors affecting the dependent variable.
We use the Dynamic Panel GMM Model and Machine Learning (ML) methods for estimating the model parameters with k-period lagged output, input, and control factors to allow for gradual adjustment over k year(s). These are discussed in Section 3.
2.3 Interdependence of knowledge-skill competencies and income equality
Human capital affects income equality through knowledge and skills. The human capital index (HCI) measures people's options to live their best lives. In their inaugural Human Development Report (Huang et al., 2023), UNDP identified three important indicators for a decent and sustainable existence: a sensible lifestyle, an education, and a long and healthy life. Due to poorer literacy and unemployment, income inequality diminishes human capital (Le Caous and Huarng, 2020; Alvarado et al., 2021). Weak institutions, unequal financing conditions, population expansion, a loss in human capital investment, a premium on technical know-how, and financial globalization contribute to income disparity in emerging nations, according to Menyelim et al. (2021). When loan markets are weak, starting wealth hinders knowledge and skills investment and increases income inequality (Kunawotor et al., 2020).
2.4 Interdependence of financial inclusion (by access to alternative micro-finance) and income equality
According to Konte and Tetteh (2023) and Shaikh et al. (2023), mobile phone availability and formal financial service use are positively connected in developing nations. Lashitew et al. (2019) and Hasan et al. (2022) studied how technology affects financial inclusion. Digital services like mobile money greatly improved traditional financial services' availability and accessibility. The research also noted how technology may lower financial service prices and expand access for low-income consumers. The World Bank (2022) shows how technology is making emerging countries more financially inclusive. Mobile money services make reaching underserved communities easier. This allows them to acquire financial services and conduct transactions without a bank branch (Kass-Hanna et al., 2022; Kouladoum et al., 2022; Demirgüç-Kunt et al., 2022). Technology diffusion increases financial inclusion and reduces financial inequalities (Jalal et al., 2023). Uneven access to finance in rural and poor communities was caused by high financial service costs (Bekele, 2023). These costs include administrative overhead and branch location investments. Due to rising demand for mobile and digital financial services, these expenses have decreased, making it easier for MFIs to operate in remote areas and help marginalized groups (Coffie and Hongjiang, 2023). Financial institutions can tailor financial solutions for underserved or rural communities using customer spending trends. With a better understanding of local financial behaviors and preferences, financial service providers can build services that better serve this market, increasing industry inclusion (Demir et al., 2022; Chen et al., 2021). According to Bansah and Mohsin (2023), credit and savings alternatives help distribute income evenly. Financial inclusion helps people and households develop wealth and minimize income inequality. Financial inclusion improves socioeconomic indices in emerging economies, according to Kim (2022) and Koomson and Danquah (2021). Financial inclusion improves health and education, which helps distribute money more fairly, according to their research. According to Yin and Choi's (2023) analysis, low-quality goods and services can hurt revenue equality in developing countries' monetary integration. Dependence on uncontrollable borrowing might increase poverty.
2.5 Interdependence of digital skills and income equality
Digitalization is spreading to finance, healthcare, manufacturing, education, defense, retail, and recreation (Consoli et al., 2023). Digitalisation increases information availability, productivity, innovation, and economic growth (Cardona et al., 2013; Brynjolfsson and McAfee, 2014). ICT network effects reduce entrance barriers and rent-seeking, say Antonelli and Gehringer (2017). More countries that invested in ICT infrastructure gained from component to content and application. ICT expansion drastically reduced skill and education return gaps, lowering bottom-end labor market employment prospects in real earnings (OECD, 2015). To master the vast number of digital technologies and applications, the correct understanding of R&D, management, production, consulting, marketing, sales, and ICT system servicing e-skills is needed for growth. According to Poliquin (2020) and Tewathia et al. (2020), digital skill development is cumulative, and some workers may have more opportunities to improve their income.
2.6 Interdependence of entrepreneurship and income equality
As they facilitate innovation, digital skills are equally vital for the effective completion of current activities. To produce new goods and services, these abilities specifically make it easier to acquire, copy, and combine information from other sources. Two different outcomes arise from the creative destruction linked to innovation and digital capabilities. As per Aghion et al. (2019), innovations have the potential to worsen the distributional consequences for workers by strengthening the position of major incumbents and MSMEs and increasing mark-ups. However, by reducing startup costs, closing the opportunity gap between large incumbents and MSMEs, and eventually reducing income disparities among workers, digitization applications can promote entrepreneurship and small enterprises' entry into new markets (Consoli et al., 2023).
2.7 Interdependence of governance and income equality
Tchamyou et al. (2019) examine financial services accessibility, ICT, and inequality in 48 African nations. As digital money increased, wealth disparity decreased.
2.8 Relevance of control variables with income equality
2.8.1 GDP per capita
In our study, this variable is in constant 2015 U.S. dollars and is expressed in natural Log (Ln). The higher the GDP per capita, improves the income equality.
2.8.2 Total population
Whether due to immigration or more births than deaths, population growth can influence social infrastructure and natural resources. Therefore, depending on how mobile the population is, there might be both good and negative effects on reducing economic inequality.
The final control variable is pandemic events (PE) and economic crises (EC). What impact did these events have on income equality is the study question. The following pandemic occurrences are included in PE: SARS in 2002–2004, EBOLA in 2004, Dengue in 2006, Swine Flu (H1N1) in 2010, Zika in 2015–16, and COVID in 2019–21. EC is the sub-mortgage financial (economic) crisis in 2007–09 and uncertain events such as the Ukraine conflict (2022–24) and the Israel conflict (2023–24). The values of the EC-PE dummies are PE = 1, EC = 1, None = 0.
3 Methodology and data indicators
3.1 Principal component analysis
Principal component analysis (PCA) uses an orthogonal transformation to uncorrelated associated variables. PCA dominates exploratory data analysis and predictive model machine learning (ML). An unsupervised PCA learning algorithm investigates variable associations. A dataset's dimensionality is reduced via PCA without harming the target variables while preserving the most important patterns or relationships by identifying a new set of variables that contain most of the sample's information and help with data regression and classification. The following are features of PCA:
• In decreasing order of significance, principal components (PC) are linear combinations of the original variables in the dataset. PC variance captures equal the dataset's variance.
• Tables 2–7 in Section 4 show that the first PC leads in data variation, whereas the second PC has the most variance orthogonal to it.
• PCA has several applications. PCA plots high-dimensional data in two or three dimensions for data visualization and analysis (see Figures 2–6 in Section 4). In feature selection, PCA can identify a dataset's most important variables (Figures 7, 8).
• PCA assumes information is contained in feature variance, with bigger variations containing more information.
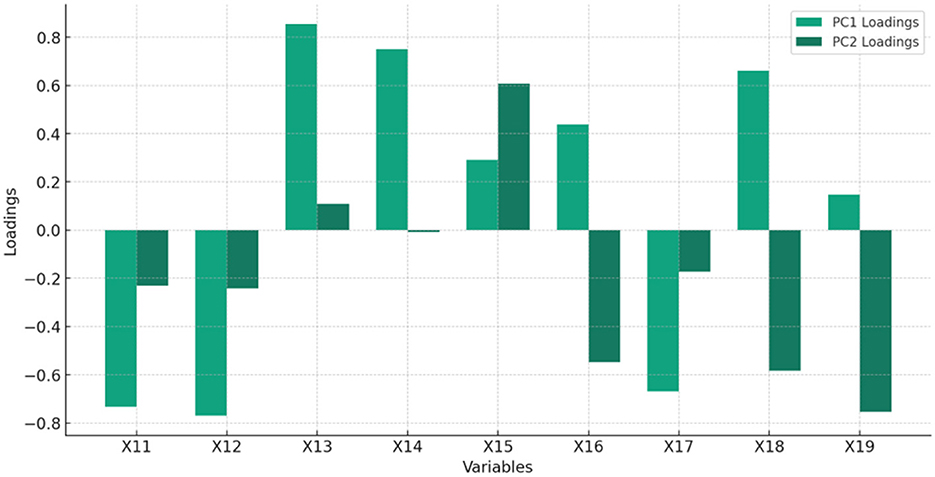
Figure 2. The Percentage of total variance explained by each principal component, highlighting the importance of each component in capturing the dataset's variability related to HUMAN CAPITAL (HC) (these values are detailed in Table 2).
Given the complexity of economic and social linkages, predicting the impact of digitally enabled micro-finance on income equality requires advanced statistical and ML methods. OLS, GMM, and Random Forest are three popular methods for such an analysis, each with their benefits. Our analysis framework estimates the model in Equation 1.
OLS minimizes the sum of squared differences between observed and anticipated values to evaluate the connection between dependent and independent variables. Adjusting for other parameters, OLS can reveal linear relationships between digital financial services availability and use besides various outcomes in digitally enabled micro-finance.
3.2 Gaussian mixture model
Gaussian mixture model (GMM) probabilistic model represents subpopulations in a population without knowing which subpopulation a data point belongs to. GMM is an effective way to study the complicated dynamics of digitally enabled micro-finance and its effects on income equality, particularly in the heterogeneous BRICS block and Austria. GMMs capture the heterogeneity of micro-finance data, which comes from several sources and has multiple patterns or distributions. GMMs also reveal latent variables that deeply affect results. Examples include digital literacy, infrastructure, and micro-finance's ability to promote income equality. Because digitally enabled micro-finance has different effects in different nations, GMMs can accommodate different distribution shapes and sizes. GMMs allow the modeling of a mixture of components with distinct means and variances, providing a nuanced and adaptable framework for analyzing the varied effects of micro-finance initiatives and uncovering strategies for reducing income inequality in BRICS+ economies. GMM effectively handles endogeneity difficulties, which occur when independent factors are connected with the error term. The study of digitally enabled micro-finance can benefit from causal inference using GMM's instrumental variables. It enhances understanding of digital financial inclusion's dynamic effects on economic outcomes.
3.3 Decision tree model
Decision trees can illuminate numerous key characteristics of digitally enabled micro-finance in BRICS+ and Austria. The models' simplicity and interpretability make them accessible to stakeholders with various technical backgrounds. Digitally enabled micro-finance, where understanding the interaction of causes reducing income equality is vital, benefits from this capability. Secondly, decision trees can handle both qualitative and quantitative data, including micro-finance data like digital platforms, regulatory settings, loan payback rates, and income levels. Thirdly, digitally enabled micro-finance involves identifying characteristics like digital service accessibility, regulatory frameworks, and financial literacy that reduce income inequality. Without linear assumptions, decision trees can model complicated non-linear relationships between variables. Understanding how micro-finance affects income disparities in the actual world requires this competence. Fourthly, decision trees allow for scenario analysis flexibility, allowing for a thorough examination of micro-finance implementation techniques. Adjusting model variables and thresholds lets stakeholders predict policy, technological, and market outcomes. Policymakers and analysts using digitally enabled micro-finance initiatives to reduce bloc-wide income inequality benefit from this versatility.
3.4 Random forest tree
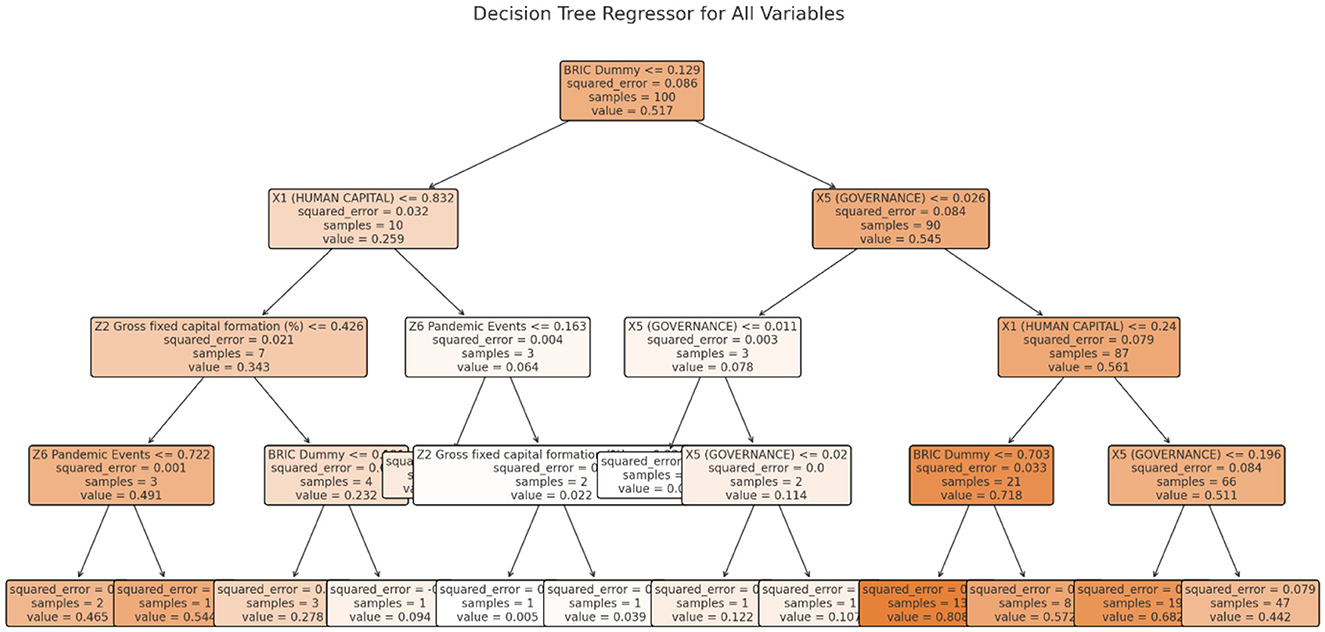
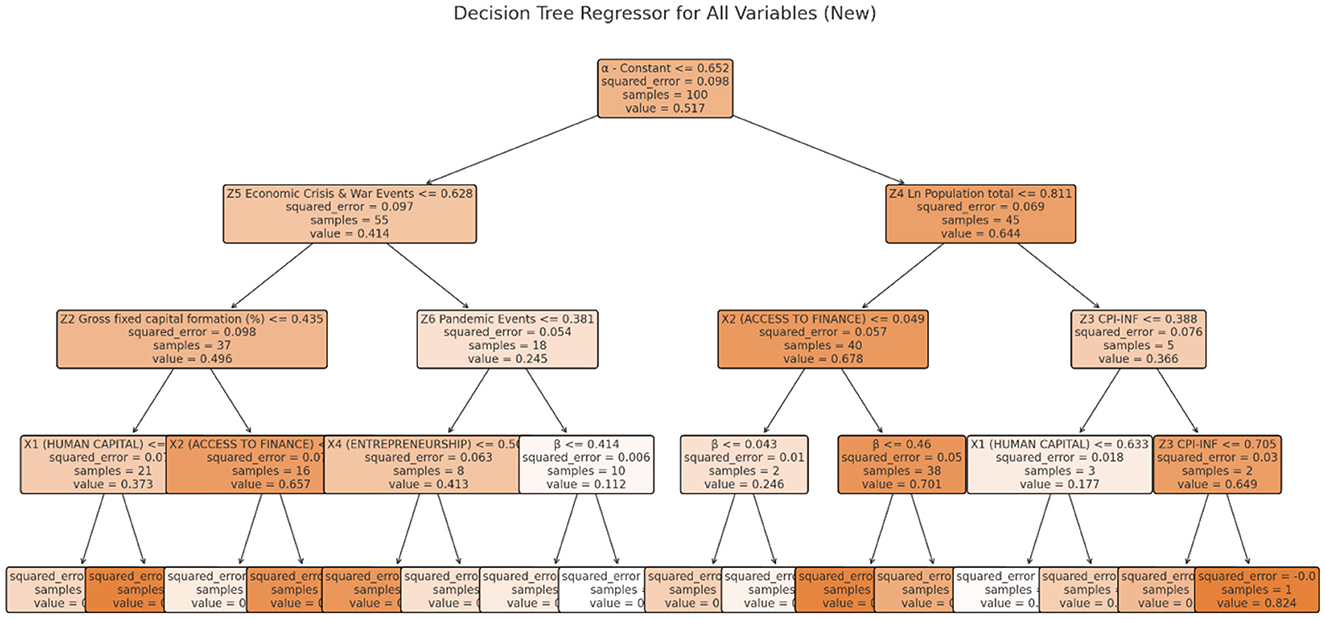
The Random forest tree (RFT) machine learning method integrates multiple decision trees to improve accuracy and reduce overfitting. It excels at handling non-linear connections and variable interactions. For digitally connected micro-finance, Random Forest can reveal complicated patterns and variable importance beyond typical econometric models. For succinctness, Figures 9, 10 show sample RFT decision trees for both dependent variables.
3.5 Data indicators
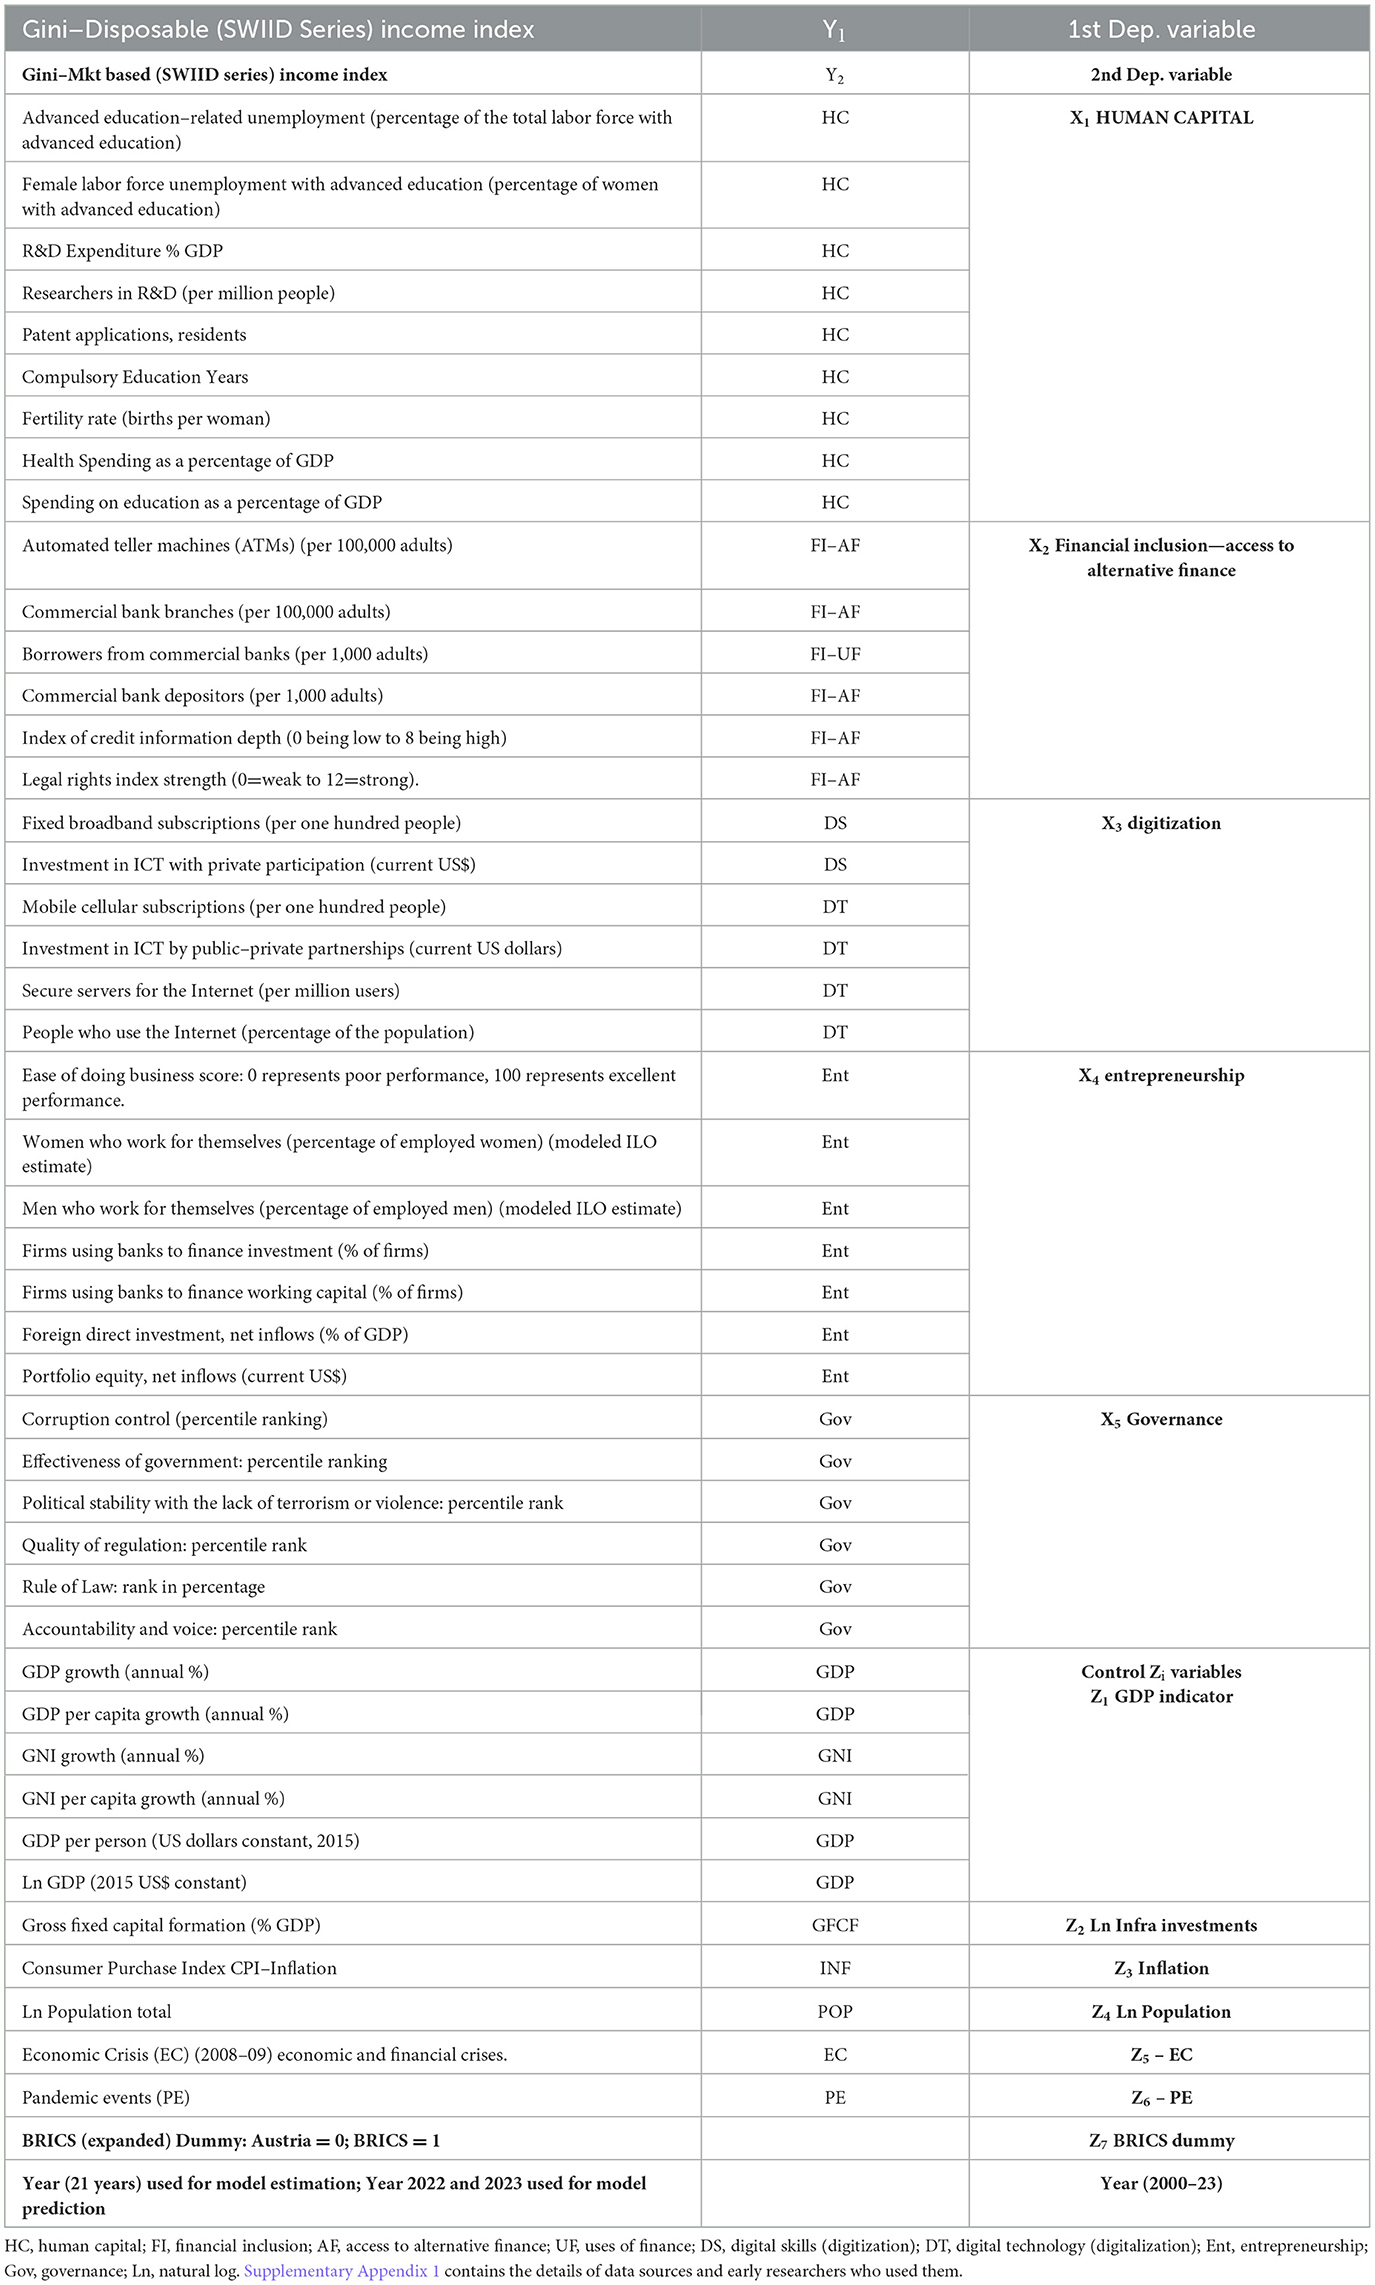
The use of PCA, OLS, GMM, and RFT is grounded in previous research methodologies that effectively analyze complex, multi-dimensional economic relationships. Table 1 shows dependent and independent indicators with sub-variables. The Gini disposable income index, the first dependent variable, shows income concentration or dispersion within the BRICS+ block and Austria. Zero indicates a society with equal income. However, index 1 is a SWIID extreme inequality. Our second dependent variable is the Gini Market Income Index, which includes beneficiary government handouts. For all worldwide economies, SWIID develops both variables. They are alternatives for model robustness testing.
3.6 Independent variables
3.6.1 X1 human capital indicator
Careers change with industry or local needs, employment requirements, and skills (Vona and Consoli, 2015; Consoli et al., 2023). Digitization tools are the trade's instruments; thus, we expect that directly analyzing employees' talents will give a more accurate indicator of their involvement. The following HC indicator's components demonstrate how HC dimensions affect income equality.
• Compulsory education years: At all ages and income levels, knowledge and skills competencies increase. This helps people earn more and minimizes income inequality.
• The R&D expenditure as % GDP: This includes current and capital R&D expenditure by resident enterprises, research institutes, universities, and government laboratories. Domestic enterprises' R&D abroad is excluded. R&D is “creative work undertaken on a systemic basis to increase the stock of knowledge, including knowledge of man, culture, and society, and the use of this stock of knowledge to devise new applications” (OECD, 2015). R&D includes (1) Basic research—Experimental or theoretical study done to learn about the mechanisms behind phenomena and observable facts without any specific application or use in mind. (2) Applied research—is conducted to gain new knowledge, but it is focused on a practical goal. (3) Experimental development—Using research and/or practical experience, experimental development produces new materials, products, devices, processes, systems, and services or improves existing ones. The Revised Fields of Science and Technology Classification of R&D includes natural sciences, engineering and technology, medical and health sciences, agricultural sciences, social sciences, and humanities and the arts. Data are collected from national statistics surveys of business and public R&D performers. In order to have a competitive edge in science and technology, government and private sector R&D spending is vital.
• R&D Researchers (per million): Project managers and creators of new knowledge, items, procedures, techniques, and systems are researchers. Honour's, Master's, and Doctoral students (ISCED 2011 levels 7 or 8, 9 and 10)1 are included.
• Patent application by residents: Patent data contains extensive information on inventive activities and the creative process, including location, individuals, networks, and technical and institutional origin. Furthermore, patent data allows reliable national and time comparisons. Technical advancement and patenting activities can be analyzed utilizing patent data on the internationalization of research, industry-science relationships, corporate patenting strategies, and patent value measures. Patent statistics show nations, regions, and businesses' innovative performance in addition to other innovation dynamics like invention or technological cooperation.
• Health expenditures as a share of GDP: One purpose of SDG target 3.c is to enhance health finance. Health spending data shows strengths, weaknesses, and areas that need investment, such as more healthcare facilities, better health information systems, or better-trained human resources. Health funding is crucial to achieving universal health coverage (UHC) (SDG 3.8). Statistics on out-of-pocket spending are vital for financial protection and UHC. Education and income rise with excellent health and reduce income equality.
• Education expenditure as a share of GDP: increasing this share leads to increased education and skill levels among individuals. This boosts earnings and reduces income inequality.
• Fertility rates, total (births per woman): lower births per woman increase family health, education, and income potential, lowering income disparity. Proper education is needed.
• Unemployment with advanced education male and female: higher indices indicate that educated people are underutilizing their knowledge and abilities. People with a risk-taking mentality can become self-earners by leveraging their knowledge and talents through startups, reducing income inequality in the medium and long run.
The discussion above inspires the following hypothesis that meets our research goals:
• H1: Human capital, through knowledge, skills, and competencies, broadens income equality.
3.6.2 X2: financial inclusion—Access to alternative finance and uses of finance indicators
• ATMs: automatic telling machines to withdraw and deposit funds to the individual's bank account without visiting the bank branch.
• Bank branches (per 100,000 adults): this has the same explanation as ATMs.
• Borrowers from Commercial Banks (CB)/1,000 adults: when borrowers borrow from banks for productive purposes.
• Depositors with CB (per 1,000 adults): when depositors increase their deposits with CB, the bank increases their lending, too.
• Credit information index (0-Low, 8-High information): this index shows whether credit bureau and credit registry databases are accessible to banks and financial institutions online or via system-to-system connections and whether credit scores are offered as an additional service to help banks and financial institutions determine borrowers' creditworthiness.
• Legal rights index (0 = weak to 12 = strong): this variable indicates how bankruptcy, and collateral restrictions protect lenders and borrowers. Higher scores on the 0–12 metric indicate that these laws are better designed to boost loan availability.
From the data indicator discussion, we derive the following hypotheses:
• H2: Financial inclusion in the enlarged BRICS block is positively driven by the spread of technology, as technological advancements make alternative financial services more accessible and easier for underprivileged people to use. This fosters income equality.
3.6.3 X3 digitization indicator
• Fixed broadband internet: E-mobility, e-healthcare, and e-learning reach rural communities especially. Wireless technologies serve low-income and illiterate rural communities because of their portability, simplicity, adaptability, and low and reduced rollout costs. Providing universal telecommunications is vital. After their rapid proliferation, the Internet and mobile phones are becoming crucial development tools. Technology enhances global integration and public sector efficacy, efficiency, and transparency. Electronic trade is a Digitization Indicator subtheme.
• Mobile cellular subscriptions (per 100 people): Same as 1.
• Individuals using the Internet (% population): ICT availability, use, pricing, and quality must be comparable to measure and analyse the sector's impact on development and design policies that stimulate industrial growth.
• Secure internet servers (per million people): same as 1.
The foregoing discussion motivates us to form the following hypothesis:
• H3: A higher degree of Digitization through the use of various applications by the vulnerable sections promotes income equality.
3.6.4 X4 entrepreneurship indicators
• Female self-employed (percentage of modeled ILO estimate female employment): a high ratio of paid and salaried female workers may signal strong economic growth in a nation. A high percentage of self-employed women may indicate a thriving agriculture sector and little formal economic growth. Economic risks vary by status. Women have fewer social safety nets, conventional labor structures, and economic shock protection, and they typically cannot save enough money to offset these shocks.
• Self-employed, male (percentage of total employment) (ILO estimate modeled). Same as the one above but replace the word “male” in place of “female.”
• Ease of Doing Business: the ease of doing business score measures the absolute change in an economy's local entrepreneurial climate over time, while the ranking merely measures regulatory changes relative to other economies.
• Firms using banks to finance investments (# of firms): businesses grow by connecting with lenders and investors in financial markets. Competitive financing is available from financial intermediaries for creditworthy businesses. However, government-caused market distortions and faults sometimes limit loan availability, blocking expansion. Using internal resources too much may indicate poor financial intermediation.
• The number of businesses that use banks to finance working capital: relevance is the same as 4.
• FDI Net inflows (% GDP): private debt and equity finance most development. FDI and portfolio equity are equity flows. Debt is raised by bank loans, supplier credits, and bonds.
• Portfolio equity, net inflows (current US$): Same as in 6.
The foregoing discussion prompts us to formulate the following hypothesis:
• H4: Entrepreneurs' use of digital applications by the vulnerable sections facilitates income equality.
3.6.5 X5 governance indicator
• Government effectiveness: the government effectiveness—percentile rank variable measures public service quality, civil service independence from political pressures, policy formulation and execution, and the government's commitment to public policies. The country's percentile rank from zero to 100 shows its position relative to all other aggregate indicator countries.
• Control of corruption (0-low rank; 100-high rank): opinions on public power misuse, including corruption and “capture” by elites and special interests, are reflected in this variable. Country percentile rank, from 0 to 100, compares to all other countries in the aggregate indicator.
• Political stability and absence of violence/terrorism: the percentage rank of political stability and absence of violence/terrorism measures people's perception of political turmoil and/or terrorism. A country's percentile rank, from 0 to 100, ranks it among the aggregate indicator's nations.
• Regulatory quality- percentile rank: this variable assesses the public perception of the government's ability to establish and enforce policies that promote private sector growth. The country's percentile rank, from 0 to 100, shows its position relative to all other nations covered by the aggregate indicator.
• Rule of law-percentile rank: this variable measures agents' trust and compliance with societal norms, including police, courts, property rights, contract enforcement, and crime and violence. The country's percentile rank, from 0 to 100, shows its position relative to all other nations covered by the aggregate indicator.
• Accountability and voice: this variable shows thoughts on freedom of expression, association, and the media, as well as the degree to which a nation's citizens can pick their government. The country's position relative to all other nations covered by the aggregate indicator is shown by its percentile rank, which ranges from zero for the lowest rank to 100 for the highest rank.
The foregoing discussion prompts us to formulate the following hypothesis:
• H5: Effective Governance by Governments catalyses income equality.
3.7 Zijt control variables
GDP at constant 2015 US dollars determines income per capita. Prices determine inflation. Similar to previous studies on regional income differences, the econometric model includes unemployment and economic progress. In BRICS+ countries, we use CPI to measure inflation. To eliminate statistical and economic endogeneity bias and account for income equality's response delays, we lag the explanatory variables. The wealthy have more financial instruments to combat inflation; thus, rising consumer prices hurt the poor more. The relationship between income equality and per capita income should be negative. Higher per capita income results from lesser poverty (Zhang and Ben Naceur, 2019). Economic crises and pandemics affect income equality, as illustrated in Supplementary Appendix 1 studies. Pandemics and crises affect the economy and raise income inequality for vulnerable populations in the BRICS+ bloc.
4 Model results and analysis
4.1 PCA of independent factors
4.1.1 Human capital (X1)
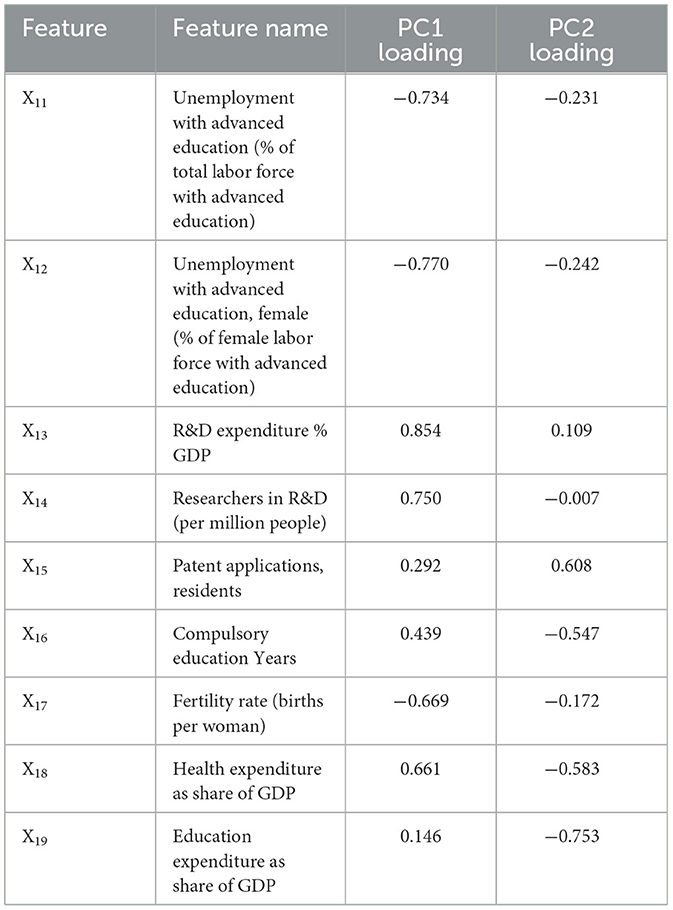
Figure 2 and Table 2 display the feature of the importance of principal components (PC) of HC.
Interpretation of PC1 and PC2 in HC:
• PC1 seems to capture the essence of human capital development and its direct impact on economic output and development, with a focus on employment, fertility, and investment in R&D and health. It suggests that higher human capital, reflected through better education and health outcomes and lower unemployment among the highly educated, is crucial for economic resilience and growth.
• PC2 appears to differentiate more based on innovation and long-term investment in education and health, reflecting an axis from basic needs and immediate concerns to long-term strategic investments in human capital and innovation. The orientation toward patents and R&D expenditures as positive loadings, against the backdrop of education and health spending as negative loadings, might indicate a nuanced view of how strategic investments correlate with different aspects of economic and social development.
4.1.2 Financial inclusion – Access to alternative micro-finance (X2)
Figure 3 and Table 3 display the feature of importance of the principal components of X2.
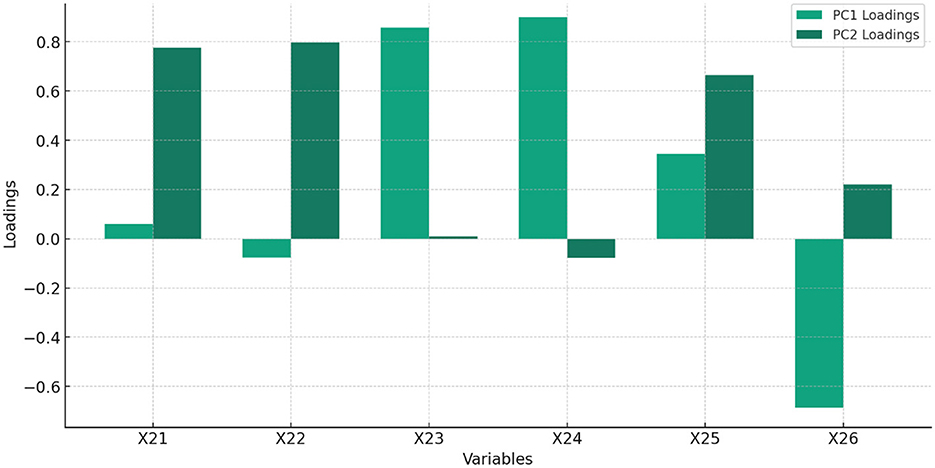
Figure 3. The % of total variance explained by each principal component, highlighting the importance of each component in capturing the dataset's variability related to FI–Access to AAMF.
Interpretation of Table 3:
• PC1: A weighted sum of the original variables with the most significant positive contributions from X23 and X24, indicating these variables have the strongest influence on PC1.
• PC2: Dominated by positive contributions from X22 and X21, showing these variables significantly influence PC2.
4.1.3 Digitization (X3)
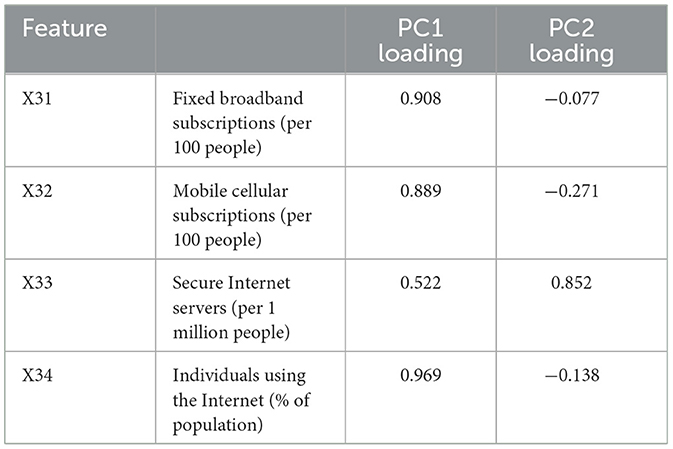
Figure 4 and Table 4 displays the feature of importance of the principal components of Digitization.
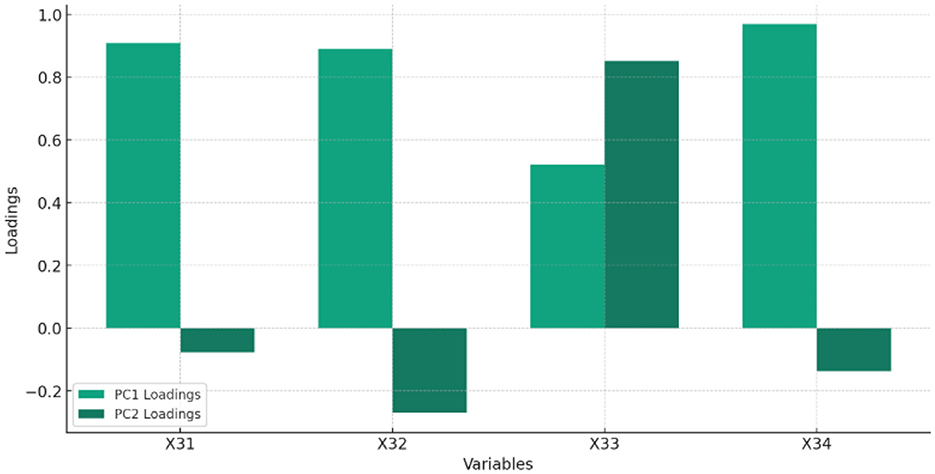
Figure 4. The Percentage of total variance explained by each principal component, highlighting the importance of each component in capturing the dataset's variability related to DIGITIZATION.
Interpretation of Table 4:
• PC1 captures a significant amount of variance, with X34 and X31 being particularly influential, suggesting these variables play a crucial role in the dataset's underlying structure.
• PC2 highlights different aspects of the data, with X33 showing a strong positive contribution, indicating its distinct influence on this component.
4.1.4 Entrepreneurship (X4)
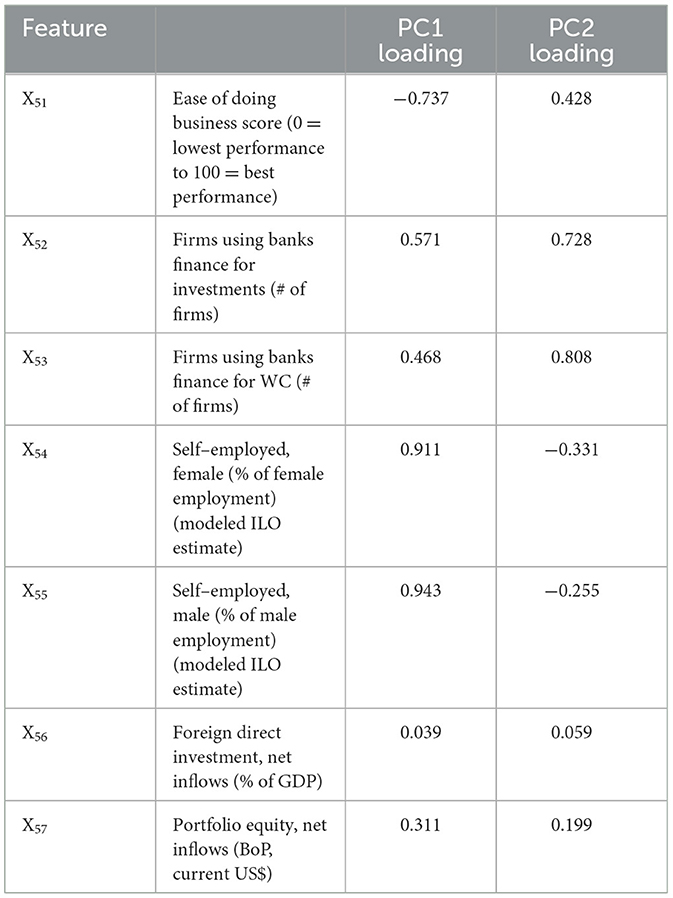
Table 5 and Figure 5 display the feature of importance of principal components of Entrepreneurship.
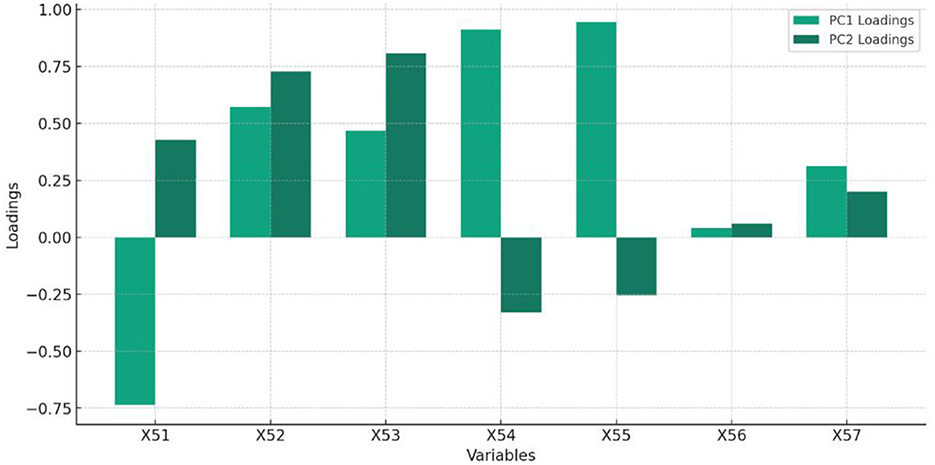
Figure 5. The Percentage of total variance explained by each principal component, highlighting the importance of each component in capturing the dataset's variability related to Entrepreneurship.
Interpretation of Table 5:
• PC1 and PC2 together capture a significant portion of the dataset's variance, with variables like X54 and X55 showing strong positive contributions to PC1, indicating their crucial roles.
• Variables X52 and X53 have strong positive contributions to PC2, suggesting they capture different aspects of the data variance not covered by PC1.
4.1.5 Governance (X5)
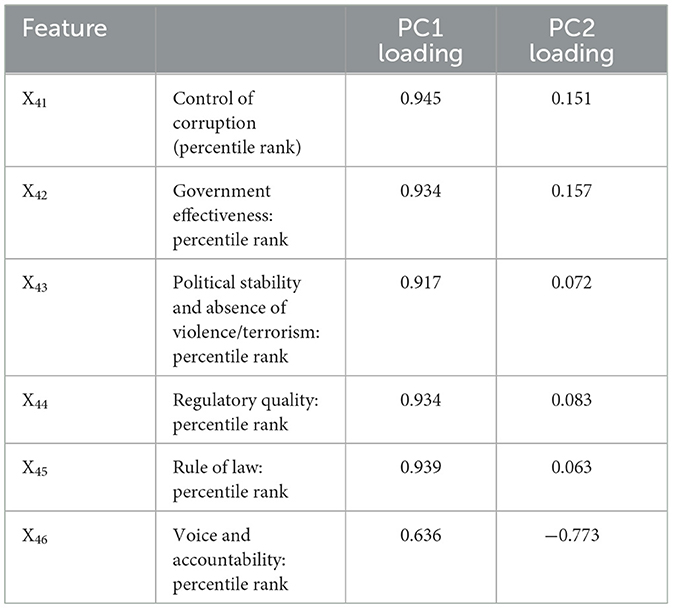
Figure 6 and Table 6 display the feature of importance of the principal components of Governance.
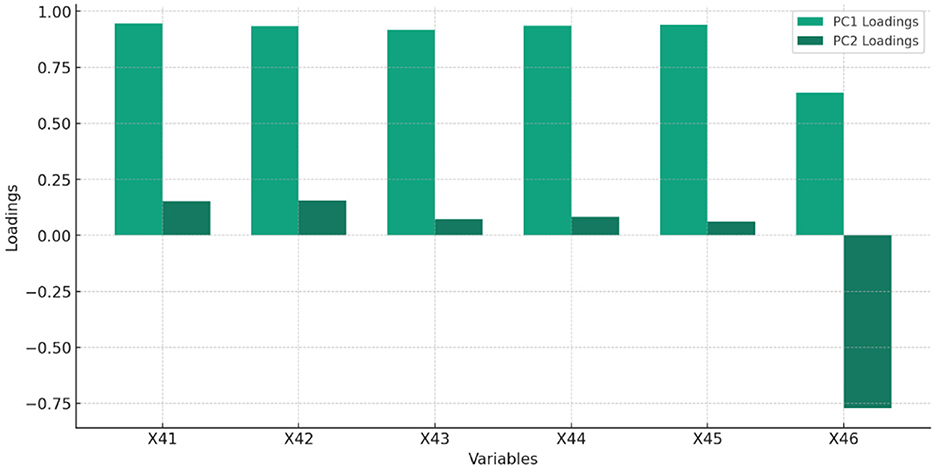
Figure 6. The Percentage of total variance explained by each principal component, highlighting the importance of each component in capturing the dataset's variability related to GOVERNANCE.
Interpretation of PC1 and PC2 in Governance indicator:
• PC1 predominantly captures variance, with X41 and X45 showing the highest loadings, suggesting these variables play crucial roles in the dataset's variance.
• PC2 reveals a distinct aspect of the data, with X46 showing a substantial negative loading, indicating its unique contribution in the opposite direction to PC2.
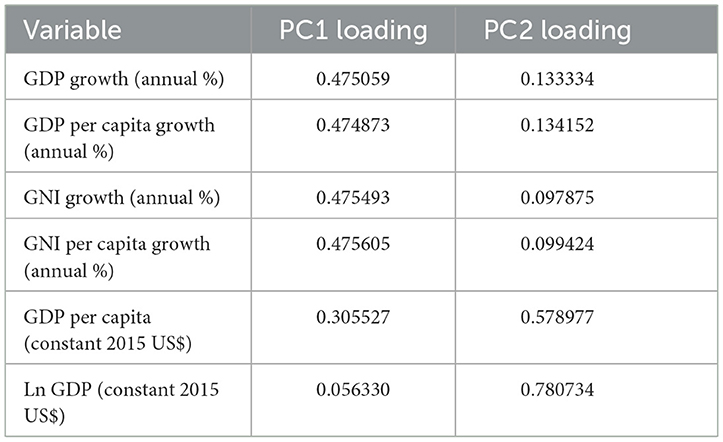
4.1.6 Z1 GDP principal component analysis
Interpretation of PC1 and PC2 in GDP indicator
• PC1 could be seen as representing the economic dynamism or growth aspect of the economies within the BRICS countries, emphasizing how quickly economies are growing or contracting.
• PC2 appears to capture the scale and development level of the economies, differentiating between countries based on their overall economic size and per capita wealth (Table 7).
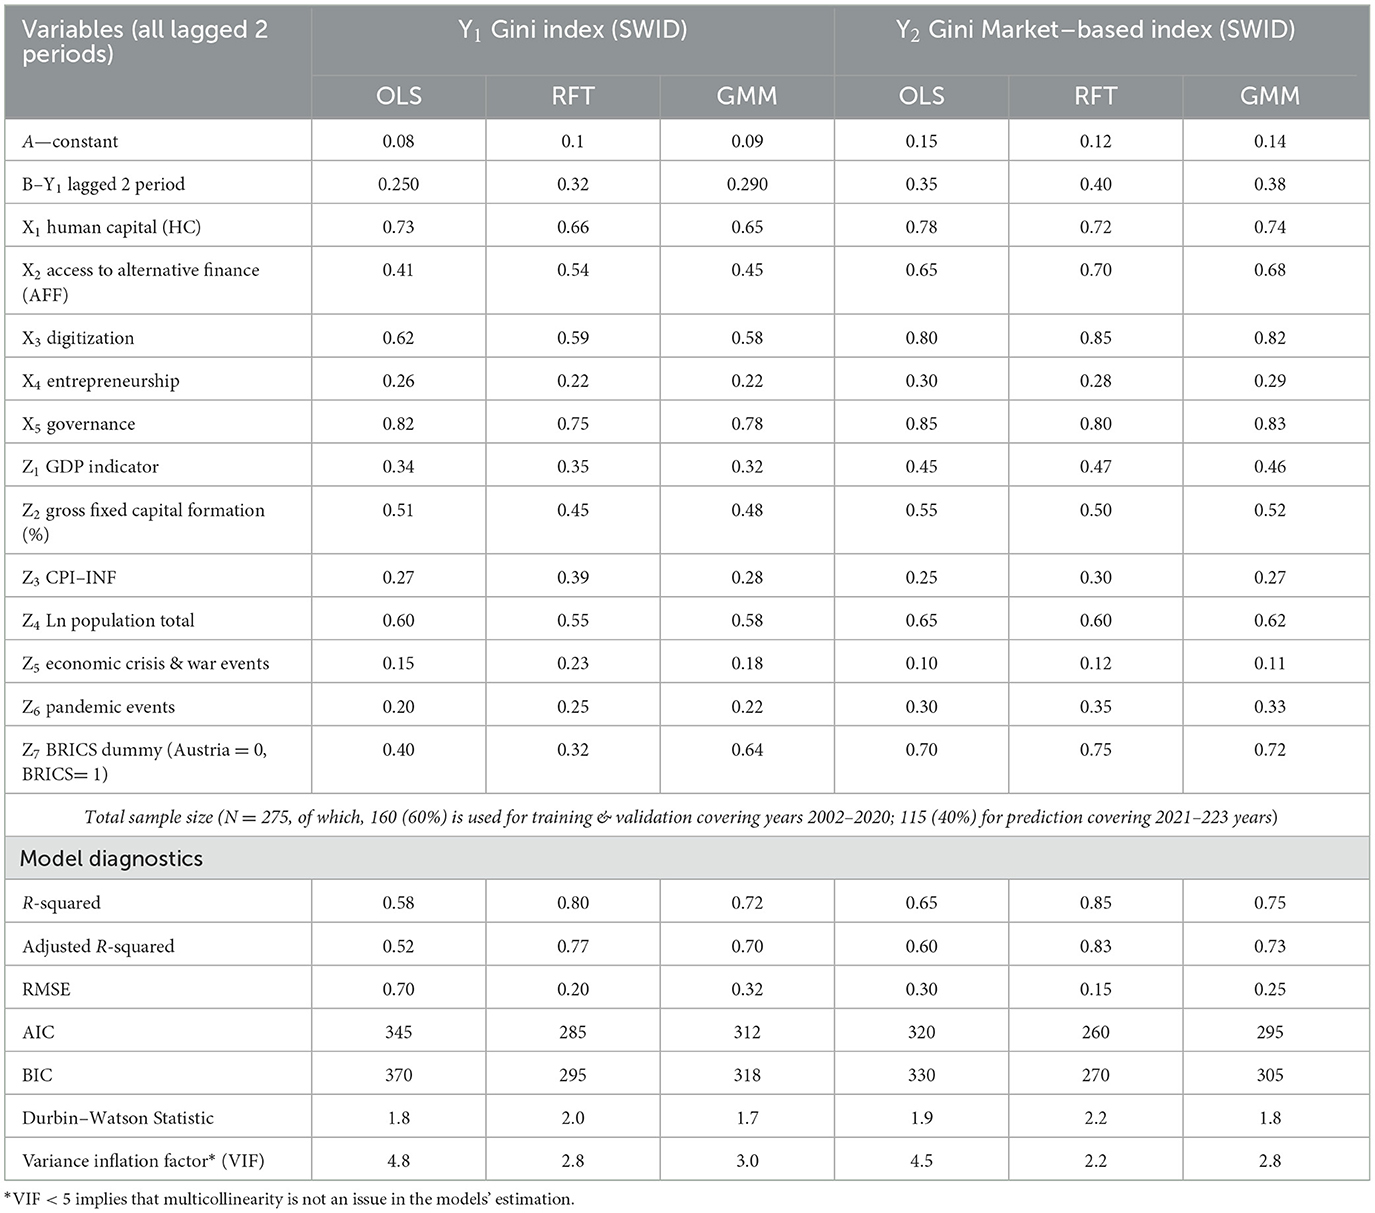
4.2 OLS, GMM and RFT model results
The independent variables for empirical are derived from PCA for reducing dimensionality as well as collinearity among various components as discussed under section 3 PCA. Table 8 displays the coefficients for different variables impacting the Gini index (Y1) and Market-based Gini index (Y2) in OLS, RFT, and GMM. Model diagnostics in both Y1 and Y2 reveal that RFT specification outperforms OLS and GMM specifications, with higher R2, Adjusted R2, lowest root means square error (RMSE), Akaike Information Criteria (AIC), Bayesian Information Criteria (BIC), DW Statistic 2, and VIF 2.8. Further, model coefficients in RFT for Y2 (Market-based Gini index) are consistently higher in magnitude (except Economic crisis and conflicts) than coefficients in RFT for Y1. This shows that the RFT specification is robust. When comparing the model diagnostics between Y1 and Y2 all diagnostics are superior in Y2 compared to Y1 with higher R2 (0.85 vs. 0.8), Adjusted R2 (0.83 vs. 0.77), lowest root mean square error (RMSE 0.15 vs. 0.2), Akaike Information Criteria (AIC 260 vs. 280), Bayesian Information Criteria (BIC 270 vs. 290), DW Statistic (2.2 vs. 2), VIF (2.2 vs. 2.8). This comparison shows that SWIID series indexes are fair representations of income disparity. Hence, we shall use RFT results in our discussion section.
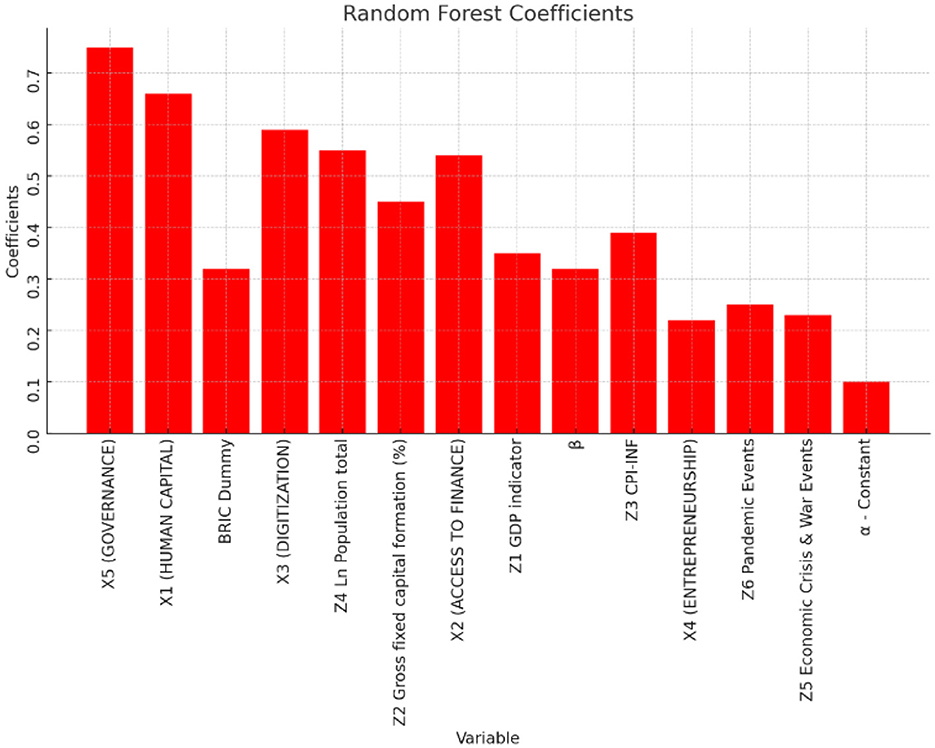
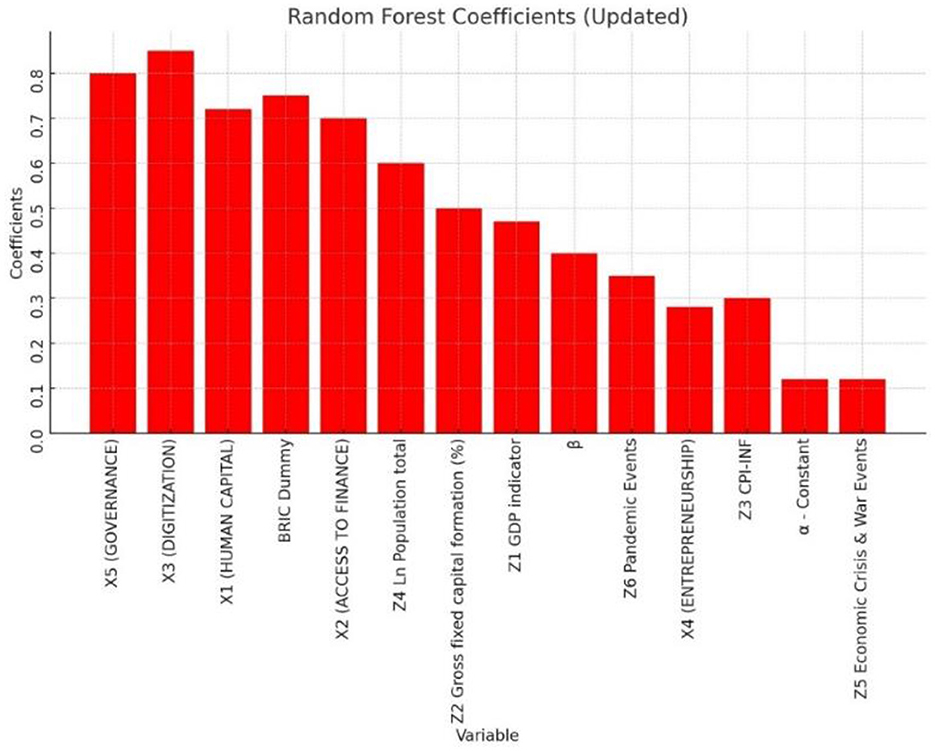
The magnitude of importance of the various features (in decreasing order) is discussed through graphs in Figures 7, 8.
Figure 8 displays the visual representation of the feature importance of Table 8 results for the Y2 market-based Gini index.
5 Results discussion
In Table 8, due to dynamic interrelation between the periods, two-period lagged.
• The Gini index narrows income equality by 0.32–0.4 in the two models (Y1) and (Y2).
• HC broadens income equality by 0.66 to 0.72 in the two models (Y1) and (Y2). This was unexpected and did not support Hypothesis 1.
• AAF fosters income equality by 0.54 to 0.7 in the two models (Y1) and (Y2). This validates Hypothesis 2.
• Digitization widens income disparity by 0.59 to 0.85 in the two models (Y1) and (Y2). This is also unexpected and does not support Hypothesis 3.
• Promoting entrepreneurship with digital tools facilitates income equality by 0.22 to 0.28 in the two models (Y1) and (Y2). This validates Hypothesis 4.
• Effective governance widens income inequality by 0.75 to 0.8 in the two models (Y1) and (Y2). This is unaccepted and implies a high degree of ineffective governance issues among the enlarged BRICs countries and validates Hypothesis-5.
• Higher economic development with higher GDP reduces income inequality by 0.35 to 0.47 in the two models (Y1) and (Y2).
• Higher fixed capital formation through infrastructure investments, reduces income inequality by 0.45 to 0.5 in the two models (Y1) and (Y2).
• Higher inflation implies higher per capita liquidity amongst the population. Higher liquidity in the short term reduces income inequality by 0.39 in model Y1 and by 0.3 in model Y2.
• Higher population growth does not necessarily imply higher productive physical capital unless supplemented by HC and e-skills. Higher population growth widens income inequality by 0.55 to 0.6 in the two models (Y1) and (Y2).
• The prevalence of economic crisis and war-like events in the past triggered fiscal and monetary interventions by the authorities as welfare measures. Higher government interventions during these events improve income inequality by 0.23 units in model Y1 and by 0.122 in model Y2.
• The prevalence of pandemics in the past triggered government interventions by the authorities as welfare measures. Higher these interventions improve income equality by 0.25 to 0.35 in the two models (Y1) and (Y2).
• BRICS block economies incrementally narrowed the income inequality by 0.32 to 0.75 in the two models (Y1) and (Y2) compared to Austria.
Governance independent indicator is the first key feature that widens the income inequality with greater magnitude. This result is consistent with the findings of Anyanwu et al. (2016) who find that one significant factor contributing to the region's high-income disparity is inadequate governance. Ahlerup et al. (2016), Huang et al. (2023), Antwi et al. (2024), Ahmed and Shadmani (2024), and Bibi et al. (2024) also claim that policy interventions to reduce high concentrations of land, capital, both human and physical, structural shifts, labor market distortions, and social stratification all contribute to widening income disparity.
Human Capital indicator is the next independent feature of importance in widening income inequality. This result is plausible since Human capital is lowered by the unequal distribution of income since it lowers the literacy rate and raises unemployment (Le Caous and Huarng, 2020; Alvarado et al., 2021; Bibi et al., 2024).
Digitization is the next independent feature of importance in widening income inequality. This result is plausible since Acemoglu and Restrepo (2020) claim that while ICTs produce benefits for jobs involving non-routine tasks, such as those in ICT-producing industries, they also have a negative impact on the employment demand for workers who perform routine-based tasks due to displacement effect. Thus, ICT-related skill-biased effects encourage income and salary disparities between regular and non-routine workers. These workers suffer from routine-biased technical change, whereas low-skilled workers who perform manual and human communication duties are less vulnerable to substitution. According to Acemoglu and Autor (2014), this causes the demand for middle-skilled workers to rise more slowly than the demand for jobs at the two extremes of the income distribution. These results are also consistent with the analysis by Bibi et al. (2024).
Access to Alternative Micro-finance (AAMF) is the next independent feature of importance. This result is consistent with financial organizations being able to create specialized financial solutions, particularly for underprivileged or rural populations (Demir et al., 2022; Chen et al., 2021). Understanding local financial behaviors and preferences in-depth allows financial service providers to develop services that more effectively satisfy the needs of this market. This will encourage greater inclusivity in the sector. This is also consistent with Jalal et al. (2023), where consumer financial stability has been proven to be improved by digital payments, particularly in poorer nations where cash-based transactions are by nature riskier. This result is also consistent with Bansah and Mohsin (2023) that the expansion of financial access via credit and savings opportunities plays a crucial role in promoting an even allocation of income. Notably, financial inclusion reduces income inequality by enabling people and households to build assets and wealth. Furthermore, Demir et al.'s (2022), Fernández Sánchez et al. (2024), and Bibi et al. (2024) research make the case that financial inclusion helps those with little resources make more money and improve their economic wellbeing by offering accessible financial services.
Entrepreneurship is the next independent feature of importance. This result is consistent with Consoli et al. (2023) and Bibi et al. (2024) that promoting entrepreneurship by reducing startup costs, closing the opportunity gap between large incumbents and MSMEs, and eventually reducing pay disparities among workers, entrepreneurial digitization applications can promote entrepreneurship and small enterprises' entry into new markets and thus improve their earning potential and reduce income inequality.
Other macroeconomic (control) factors that are of importance in improving income equality in decreasing order of importance are Population, Gross fixed capital formation (infrastructure investments), GDP, inflation, Pandemic, and economic crisis events. Interventions from respective Governments in promoting growth and welfare of the community are necessary tools to reduce income inequality, which is supported by earlier studies, including SDG-2030 targets. These are consistent with Zhang and Ben Naceur (2019) and Bibi et al. (2024) that all these macroeconomic factors improve higher GDP, per capita income increases, poverty decreases, and thus results in reduced income inequality.
5.1 Model validation—Using 2021 and 2022 data for RFT models
Table 9 shows the prediction values for Y1 and Y2 and RMSE comparison using RFT for validating RFT model using 40% of the total sample covering periods 2021–22. Compared to actual values, the prediction was 0.57 and 0.43 for Y1 and Y2, and RMSE is marginally higher than those in Table 8. The results imply that the RFT model did perform quite well in validating the test data for prediction.
6 Conclusion, implications, limitations and directions for future research
6.1 Conclusion
With the focus on the UN's SDG 2030 Target by 2030 and the Leave-no-one-behind principle, this research investigated whether and to what degree income dispersion and expanding BRICS block are linked to local e-skills and, financial endowment and income disparity. The research fills the gap of missing information about how digitization is impacting income inequality and how financial inclusion through digitized alternative micro-finance could either contribute to or worsen this issue within the particular setting of the enlarged BRICS block. Five plausible hypotheses were framed to support the research objectives. Principal Component Analysis (PCA) helped to simplify complex datasets and reduce dimensionality and collinearity issues in the data set over 2000–2022. Each of the three methodologies—OLS, GMM, and Random Forest Tree (RFT) brings distinct advantages to the analysis of digitally enabled micro-finance. While OLS offers simplicity and a good starting point for linear relationships, GMM addresses endogeneity in dynamic settings. RFT complemented these by capturing complex, non-linear interactions, and variable (feature) importance, offering a comprehensive toolkit for understanding the multifaceted impacts of digital financial services on income equality.
When viewed from the perspective of Model diagnostics, the AI model RFT proved superior model specification to traditional OLS and GMM models. Interesting study findings for policy implications are:
• Effective governance by the respective governments improved the income equality by 0.75 to 0.8.
• Policies to Promote Human Capital Competencies and e-skills also improved the income equality by 0.66 to 0.72.
• Steps taken by financial providers through financial inclusion by providing digital access to alternative micro-finance to the vulnerable poor improved the income equality by 0.54–0.7.
• Efforts taken to promote Digitization improved the income equality by 0.59–0.85.
• Policy interventions to promote entrepreneurship through MSMEs improved the income equality by 0.22–0.28.
• Other macroeconomic factors like GDP growth, Infrastructure investments by both Public and Private Sectors, Productive increase in the working population, Positive and timely policy interventions implemented by the respective governments to counter the Pandemic, Economic Crisis and Conflicts helped in improving income equality.
• The model predicted Y1 and Y2 quite well in RMSE compared to the actual mean values. Thus, the RFT model is validated for prediction purposes.
• In summary, this study offers a comprehensive perspective on the development and progress of micro-finance as a field of research and development, which has the potential to combat poverty, promote socioeconomic welfare, and improve human development, resulting in a more equitable and sustainable society.
6.1.1 Policy implications
Innovation and economic growth depend on “R&D Expenditure % GDP” and “Researchers in R&D (per million people)” as indices of a country's science and technology commitment. Increased “Patent applications, residents” indicate new ideas and technology from these investments.
“Compulsory Education Years” are a key indicator of a society's investment in its future, affecting literacy and labor force quality.
“Fertility rate (births per woman)” can affect workforce size and dynamics, affecting economic planning and development.
Human capital is made up of health and education, hence, “Health Expenditure as a share of GDP” and “Education Expenditure as a share of GDP” represent a nation's priorities.
These investments boost productivity, innovation, and quality of life, establishing the framework for economic growth.
• Governments must intervene promptly in R&D, Health, and Education to improve income equality with relevant stakeholders.
Key stakeholders: Government agencies, research institutions, healthcare providers, educational institutions, private sector R&D departments.
The previous decade has seen unprecedented technological innovation that has impacted many aspects of human life. Acceleration has largely affected the financial industry due to digital payment methods and financial technologies. Thus, financial inclusiveness—the availability and adoption of affordable alternative financial services for personal and commercial needs—has risen globally.
• The BRICS block can strengthen micro-finance institutions to better withstand global crises and support vulnerable groups by pooling resources and expertise.
Key stakeholders: BRICS governments, central banks, micro-finance institutions, international financial organizations, vulnerable populations.
• Governments should prioritize reducing governance inefficiencies by improving ease of doing business, reducing corruption, and removing barriers to digital tool implementation among vulnerable groups to reduce income disparity.
Key stakeholders: Government agencies, anti-corruption bodies, business associations, technology companies, vulnerable groups.
6.1.2 Societal implications
Collaboration allows BRICKS+ bloc nations to share creative tactics and solutions that have worked in their circumstances. This involves sharing digital banking innovations, pandemic risk assessment methodologies, and financial inclusion policies.
• International collaborative engagement among BRICS block is crucial for exchanging best practices and resources, boosting digital micro-finance effectiveness during pandemics.
Key stakeholders: BRICS governments, central banks, micro-finance institutions, fintech companies, public health organizations.
• Policy interventions promoting MSME sector through infrastructure investments are essential to promote entrepreneurship, enhance earning capacity of women & needy, and minimize income gap.
Key stakeholders: Government agencies, MSMEs, women entrepreneurs, infrastructure development companies, financial institutions.
6.1.3 Data implications
Human capital is the talents, knowledge, and other intangible assets of humans that can create economic value. Factors like “Unemployment with advanced education” show that highly educated workers are underutilized, suggesting education-job market mismatches. Gender differences in workforce involvement, especially for those with advanced degrees, are highlighted in “Unemployment with advanced education, female.”
• Timely Government policies must address data anomalies in HC competency and skill computations.
Key stakeholders: Government statistical agencies, educational institutions, labor departments, research institutions, employers.
• Governments should prioritize reducing governance inefficiencies by improving the ease of doing business, reducing corruption, and removing barriers to digital tool implementation among vulnerable groups to reduce income disparity.
Key stakeholders: Government agencies, anti-corruption bodies, business associations, technology companies, vulnerable groups.
6.1.4 Theoretical implications
The literature review and study results have the following theoretical implications in BRICS+ block:
Theory of Micro-finance:
• Micro-finance institutions (MFIs) can leverage innovative contractual structures and organizational forms to lower the risk and expense of small, uncollateralized loans as a priority for the micro-finance movement.
• MFIs should also use cost-efficient lending methods to attain financial self-sufficiency and long-term sustainability.
Theory of Collaborative Digital Financial Services (DFS):
• To promote DFS, MFIs can collaborate with other MFIs to invest prudently in Technology and Data Analytics to become customer-centric, reduce operational risks, cut costs, and boost efficiency.
Theory of income inequality:
• Innovation and technological advancement can eventually promote upward mobility and reduce inequality by investing in education and skills.
Although these theories imply significant insights, the dynamic linkages between income inequality, unemployment rates, and government transfer policies are little understood. Comprehensive theoretical frameworks are needed to reduce income disparity by providing risk protection, simple access to health services, sufficient, affordable education and skills, self-learning capacity, and effective governance through policy actions.
6.2 Limitations
Some limitations and concerns with the data at the national level must be addressed. For instance, for the newly added seven economies to the existing BRICS block, independent and macroeconomic data from 2000 to 2015 were patchy, requiring careful data interpolation wherever found missing. Improved availability of data from these new economies is very important to identify potential synergies available in the enlarged BRICS block through effectively sharing the resources.
6.3 Directions for future research
As the proliferation of mobile phone technology and digitization continues, future research in the management of micro-finance must, therefore, emphasize further advancements in digital tools and strategies to reach an even broader client base and maximize developmental benefits. Looking ahead, the incorporation of artificial intelligence, and machine learning techniques is expected to gain prominence in micro-finance research, further augmenting the capabilities and impact of MFIs in the years to come.
While the PCA is an effective methodology for reducing dimensionality and collinearity issues, Canton (2021) has an ICT-Productive Capability Index (ICT-PCI), Human Capital PCI to measure HC skills & competencies, and Institutions—PCI to represent Governance. Future studies can use these indices as alternative, independent indicators to check the robustness of current model results.
Secondly, the research work is at the BRICS block level. It would be useful to perform individual countrywide evaluation of the research objectives to provide granularity to the specific policy interventions by the respective governments. It would also be worthwhile to use time dummies to know the trend of income disparities over the study period to determine which countries are faring well.
Data availability statement
The original contributions presented in the study are included in the article/Supplementary material, further inquiries can be directed to the corresponding authors.
Author contributions
MM: Conceptualization, Data curation, Formal analysis, Funding acquisition, Writing – original draft. NA: Investigation, Methodology, Writing – review & editing. IM: Project administration, Resources, Writing – original draft. UB: Project administration, Resources, Writing – original draft. AR: Supervision, Validation, Visualization, Writing – original draft, Writing – review & editing.
Funding
The author(s) declare that no financial support was received for the research, authorship, and/or publication of this article.
Conflict of interest
The authors declare that the research was conducted in the absence of any commercial or financial relationships that could be construed as a potential conflict of interest.
Publisher's note
All claims expressed in this article are solely those of the authors and do not necessarily represent those of their affiliated organizations, or those of the publisher, the editors and the reviewers. Any product that may be evaluated in this article, or claim that may be made by its manufacturer, is not guaranteed or endorsed by the publisher.
Supplementary material
The Supplementary Material for this article can be found online at: https://www.frontiersin.org/articles/10.3389/fdata.2024.1417752/full#supplementary-material
Footnotes
1. ^ISCED is acronym for International Standard Classification of Education. It is a classification system used to organize educational programs and qualifications by field and education level. ISCED is part of the United Nations International Family of Economic and Social Classifications.
2. ^Lower value of Gini indexes are preferred to represent more uniform income distribution.
References
Acemoglu, D., and Autor, D. (2014). “Skills, tasks and technologies: implications for employment and earnings,” in Handbook of Labor Economics, Vol. 4, eds. O. Ashenfelter, and D, Card (Amsterdam: Elsevier), 1043–1171. doi: 10.1016/S0169-7218(11)02410-5
Acemoglu, D., and Restrepo, P. (2020). Robots and jobs: evidence from US labor markets. J. Pol. Econ. 128, 2188–2244. doi: 10.1086/705716
Aghion, P. (2002). Schumpeterian growth theory and the dynamics of income inequality. Econometrica 70, 855–882. doi: 10.1111/1468-0262.00312
Aghion, P., Akcigit, U., Bergeaud, A., Blundell, R., and Hemous, D. (2019). Innovation and top income inequality. Rev. Econ. Stud. 86, 1–45. doi: 10.1093/restud/rdy027
Ahlerup, P., Baskaran, T., and Bigsten, A. (2016). Government impartiality and sustained growth in Sub-Saharan Africa. World Dev. 83, 54–69. doi: 10.1016/j.worlddev.2016.03.006
Ahmed, H. A., and Shadmani, H. (2024). Income inequality, unemployment, and government transfer: what do their dynamics tell us. J. Econ. Dev. 26, 4. doi: 10.1108/JED-10-2023-0195
Ahn, S., Kaplan, G., Moll, B., Winberry, T., and Wolf, C. (2018). When inequality matters for macro and macro matters for inequality. NBER Macroecon. Ann. 32, 1–75. doi: 10.1086/696046
Al-Azzam, M., and Charfeddine, L. (2022). Financing new entrepreneurship: credit or microcredit? Econ. Lett. 216:110634. doi: 10.1016/j.econlet.2022.110634
Alvarado, R., Tillaguango, B., Dagar, V., Ahmad, M., Işik, C., Méndez, P., et al. (2021). Ecological footprint, economic complexity, and natural resources rents in Latin America: empirical evidence using quantile regressions. J. Clean. Prod. 318:128585. doi: 10.1016/j.jclepro.2021.128585
Antonelli, C., and Gehringer, A. (2017). Technological change, rent and income inequalities: a schumpeterian approach. Technol. Forecast. Soc. Change 115, 85–98. doi: 10.1016/j.techfore.2016.09.023
Antwi, F., Kong, Y., and Gyimah, K. N. (2024). Financial inclusion, competition, and financial stability: new evidence from developing economies. Heliyon 10:e33723. doi: 10.1016/j.heliyon.2024.e33723
Anyanwu, J. C., Erhijakpor, A. E., and Obi, E. (2016). Empirical analysis of the key drivers of income inequality in West Africa. Afr. Dev. Rev. 28, 18–38. doi: 10.1111/1467-8268.12164
Bansah, M., and Mohsin, M. (2023). Tackling the shadow economy through inflation and access to credit. J. Int. Trade Econ. Dev. 33, 1–25. doi: 10.1080/09638199.2023.2226239
Bekele, W. D. (2023). Determinants of financial inclusion: a comparative study of Kenya and Ethiopia. J. Afr. Bus. 24, 301–319. doi: 10.1080/15228916.2022.2078938
Bibi, S., Zada, H., Awan, T., Wong, W.-K., and Khan, N. (2024). Evaluating the moderating role of governance on the relationships between social inclusion, ICT infrastructure, and financial inclusion. Heliyon 10:e33711. doi: 10.1016/j.heliyon.2024.e33711
BRICS Summit (2023). Pramod Kumar, Australian Institute of International Affairs, BRICS Summit 2023: Major Outcomes and Relevance. Available at: https://www.internationalaffairs.org.au/australianoutlook/brics-summit-2023-major-outcomes-and-relevance/ (accessed October 12, 2023).
Brynjolfsson, E., and McAfee, A. (2014). The Second Machine Age: Work, Progress, and Prosperity in a Time of Brilliant Technologies. New York, NY: WW Norton and Company.
Canton, H. (2021). “United Nations conference on trade and development- unctad,” in The Europa Directory of International Organizations 2021 (Routledge), 172–176.
Cardona, M., Kretschmer, T., and Strobel, T. (2013). ICT and productivity: conclusions from the empirical literature. Inf. Econ. Pol. 25, 109–125. doi: 10.1016/j.infoecopol.2012.12.002
Chen, Y., Kumara, E. K., and Sivakumar, V. (2021). Investigation of finance industry on risk awareness model and digital economic growth. Ann. Oper. Res. 1–22. doi: 10.1007/s10479-021-04287-7
Coffie, C. P. K., and Hongjiang, Z. (2023). FinTech market development and financial inclusion in Ghana: the role of heterogeneous actors. Technol. Forecast. Soc. Change 186:122127. doi: 10.1016/j.techfore.2022.122127
Consoli, D., Castellacci, F., and Santoalha, A. (2023). E-skills and income inequality within European regions. Ind. Innov. 30, 919–946. doi: 10.1080/13662716.2023.2230222
Daowd, A., Kamal, M. M., Eldabi, T., Hasan, R., Missi, F., Dey, B. L., et al. (2021). The impact of social media on the performance of micro-finance institutions in developing countries: a quantitative approach. Inf. Technol. People 34, 25–49. doi: 10.1108/ITP-03-2018-0135
Demir, A., Pesqué-Cela, V., Altunbas, Y., and Murinde, V. (2022). Fintech, financial inclusion, and income inequality: a quantile regression approach. Eur. J. Finance 28, 86–107. doi: 10.1080/1351847X.2020.1772335
Demirgüç-Kunt, A., Klapper, L., Singer, D., and Ansar, S. (2022). The Global Findex Database 2021: Survey Methodology. Washington, DC: World Bank. Available at: www.worldbank.org (accessed April 25, 2024).
Dhungana, B. R., Chapagain, R., and Ashta, A. (2023). Alternative strategies of for-profit, not-for-profit and state-owned Nepalese microfinance institutions for poverty alleviation and women empowerment. Cogent Econ. Finance 11:2233778. doi: 10.1080/23322039.2023.2233778
Fernández Sánchez, J. L., Odriozola, M. D., and Baraibar-Diez, E. (2024). How the method for delivering loans impacts on the economic efficiency of micro-finance institutions. Glob. Policy 15(Suppl. 1), 92–102. doi: 10.1111/1758-5899.13312
Furceri, D., and Ostry, J. (2019). Robust determinants of income inequality. Oxford Rev. Econ. Policy 35, 490–517. doi: 10.1093/oxrep/grz014
Hasan, M. M., Yajuan, L., and Khan, S. (2022). Promoting China's inclusive finance through digital financial services. Glob. Bus. Rev. 23, 984–1006. doi: 10.1177/0972150919895348
Huang, W., Gu, X., Lin, L., Alharthi, M., and Usman, M. (2023). Do financial inclusion and income inequality matter for human capital? Evidence from sub-Saharan economies. Borsa Istanbul Rev. 23, 22–33. doi: 10.1016/j.bir.2022.09.002
Iacono, R., and Ranaldi, M. (2022). The evolution of income composition inequality in Italy, 1989–2016. Rev. Income Wealth 69, 124–149. doi: 10.1111/roiw.12555
Iammarino, S., Rodríguez-Pose, A., and Storper, M. (2019). Regional inequality in Europe: evidence, theory and policy implications. J. Econ. Geogr. 19, 273–298. doi: 10.1093/jeg/lby021
Iammarino, S., Rodríguez-Pose, A., Storper, M., and Diemer, A. (2020). Falling into the Middle-Income Trap? A Study on the Risks for EU Regions to Be Caught in a Middle-Income Trap. European Commission Report.
Jalal, A., Al Mubarak, M., and Durani, F. (2023). “Financial technology (fintech),” in Artificial Intelligence and Transforming Digital Marketing, eds. A. Hamdan, and E. S. Aldhaen (Cham: Springer Nature Switzerland), 525–536. doi: 10.1007/978-3-031-35828-9_45
Kass-Hanna, J., Lyons, A. C., and Liu, F. (2022). Building financial resilience through financial and digital literacy in South Asia and Sub-Saharan Africa. Emerg. Mark. Rev. 51:100846. doi: 10.1016/j.ememar.2021.100846
Kim, K. (2022). Assessing the impact of mobile money on improving the financial inclusion of Nairobi women. J. Gend. Stud. 31, 306–322. doi: 10.1080/09589236.2021.1884536
Konte, M., and Tetteh, G. K. (2023). Mobile money, traditional financial services, and firm productivity in Africa. Small Bus. Econ. 60, 745–769. doi: 10.1007/s11187-022-00613-w
Koomson, I., and Danquah, M. (2021). Financial inclusion and energy poverty: Empirical evidence from Ghana. Energy Econ. 94:105085. doi: 10.1016/j.eneco.2020.105085
Kouladoum, J.-C, Kindzeka Wirajing, M. A., and Nchofoung, T. N. (2022). Digital technologies and financial inclusion in Sub-Saharan Africa. Telecommun. Policy 46:102387. doi: 10.1016/j.telpol.2022.102387
Kunawotor, M. E., Bokpin, G. A., and Barnor, C. (2020). Drivers of income inequality in Africa: does institutional quality matter? Afr. Dev. Rev. 32, 718–729. doi: 10.1111/1467-8268.12473
Lashitew, A. A., van Tulder, R., and Liasse, Y. (2019). Mobile phones for financial inclusion: what explain the diffusion of mobile money innovations? Res. Policy 48, 1201–1215. doi: 10.1016/j.respol.2018.12.010
Le Caous, E., and Huarng, F. (2020). Economic complexity and the mediating effects of income inequality: reaching sustainable development in developing countries. Sustainability 12:2089. doi: 10.3390/su12052089
Menyelim, C. M., Babajide, A. A., Omankhanlen, A. E., and Ehikioya, B. I. (2021). Financial inclusion, income inequality and sustainable economic growth in sub-Saharan African countries. Sustainability 13:1780. doi: 10.3390/su13041780
Morduch, J. (2000). The micro-finance schism. World Dev. 28, 617–629. doi: 10.1016/S0305-750X(99)00151-5
OECD (2015). “Non-standard work, job polarisation and inequality,” in It Together: Why Less Inequality Benefits All (Paris: OECD Publishing). doi: 10.1787/9789264235120-7-en
Pattnaik, D., Ray, S., and Hassan, M. K. (2024). Micro-finance: a bibliometric exploration of the knowledge landscape. Heliyon 10:e31216. doi: 10.1016/j.heliyon.2024.e31216
Poliquin, C. (2020). The Effect of the Internet on Wages. Working Paper. Los Angeles, CA: University of California.
Shaikh, A. A., Glavee-Geo, R., Karjaluoto, H., and Hinson, R. E. (2023). Mobile money as a driver of digital financial inclusion. Technol. Forecast. Soc. Change 186:122158. doi: 10.1016/j.techfore.2022.122158
Solt, F. (2020). Measuring income inequality across countries and over time: the standardized world income inequality database. Soc. Sci. Q. 101, 1183–1199. doi: 10.1111/ssqu.12795
Tassaeva, I. V. (2021). The changing education distribution and income inequality in great Britain. Rev. Income Wealth 67, 659–683. doi: 10.1111/roiw.12486
Tchamyou, V. S., Asongu, S. A., and Odhiambo, N. M. (2019). The role of ICT in modulating the effect of education and lifelong learning on income inequality and economic growth in Africa. Afri. Dev. Rev. 31, 261–274. doi: 10.1111/1467-8268.12388
Tewathia, N., Kamath, A., and Ilavarasan, P. (2020). Social inequalities, fundamental inequities, and recurring of the digital divide: insights from India. Technol. Soc. 61:61. doi: 10.1016/j.techsoc.2020.101251
Vassallo, J. P., Prabhu, J. C., Banerjee, S., and Voola, R. (2019). The role of hybrid organizations in scaling social innovations in bottom-of-the-pyramid markets: insights from micro-finance in India. J. Prod. Innovat. Manag. 36, 744–763. doi: 10.1111/jpim.12504
Vona, F., and Consoli, D. (2015). Innovation and skill dynamics: a life-cycle approach. Ind. Corp. Change 24, 1393–1415. doi: 10.1093/icc/dtu028
Wondirad, H. A. (2022). Interest rates in micro-finance: what is a fair interest rate when we lend to the poor? Qual. Quantity 56, 4537–4548. doi: 10.1007/s11135-022-01320-0
World Bank (2022). Global financial inclusion (Global Findex) database 2021. Survey ID WLD_2021_FINDEX_v02_M. doi: 10.48529/hhm5-sc56
Yin, Z. H., and Choi, C. H. (2023). Does digitalization contribute to lesser income inequality? Evidence from G20 countries. Inf. Technol. Dev. 29, 61–82. doi: 10.1080/02681102.2022.2123443
Yunus, M., Moingeon, B., and Lehmann-Ortega, L. (2010). Building social business models: lessons from the grameen experience. Long. Range Plan. 43, 308–325. doi: 10.1016/j.lrp.2009.12.005
Zhang, R., and Ben Naceur, S. (2019). Financial development, inequality, and poverty: some international evidence. Int. Rev. Econ. Finance 61, 1–16. doi: 10.1016/j.iref.2018.12.015
Keywords: income equality, human capital, alternative finance, digital micro-finance, digitization, entrepreneurship, governance, SDG 3
Citation: M. V. MK, Almuraqab N, Moonesar IA, Braendle UC and Rao A (2024) How does digitally enabled micro-finance promote income equality for the vulnerable in the expanded BRICS block during the pandemic? Front. Big Data 7:1417752. doi: 10.3389/fdata.2024.1417752
Received: 15 April 2024; Accepted: 11 November 2024;
Published: 02 December 2024.
Edited by:
Ariful Hoque, Murdoch University, AustraliaCopyright © 2024 M. V., Almuraqab, Moonesar, Braendle and Rao. This is an open-access article distributed under the terms of the Creative Commons Attribution License (CC BY). The use, distribution or reproduction in other forums is permitted, provided the original author(s) and the copyright owner(s) are credited and that the original publication in this journal is cited, in accordance with accepted academic practice. No use, distribution or reproduction is permitted which does not comply with these terms.
*Correspondence: Manoj Kumar M. V., bWFub2ptdjI0QGdtYWlsLmNvbQ==; Nasser Almuraqab, bmFzc2VyQHVkLmFjLmFl; Immanuel Azaad Moonesar, aW1tYW51ZWwubW9vbmVzYXJAbWJyc2cuYWMuYWU=; Udo Christian Braendle, dWRvLmJyYWVuZGxlQGZoLWtyZW1zLmFjLmF0; Ananth Rao, YXJhb0B1ZC5hYy5hZQ==
 Manoj Kumar M. V.
 Nasser Almuraqab
 Immanuel Azaad Moonesar
 Udo Christian Braendle
 Ananth Rao