- 1Computer Science Department, University of Illinois at Urbana-Champaign, Urbana, IL, United States
- 2Computer Science Department, George Mason University, Fairfax, VA, United States
- 3Computer Science Department, William and Mary, Williamsburg, VA, United States
The paper extends earlier work on modeling hierarchically polarized groups on social media. An algorithm is described that 1) detects points of agreement and disagreement between groups, and 2) divides them hierarchically to represent nested patterns of agreement and disagreement given a structural guide. For example, two opposing parties might disagree on core issues. Moreover, within a party, despite agreement on fundamentals, disagreement might occur on further details. We call such scenarios hierarchically polarized groups. An (enhanced) unsupervised Non-negative Matrix Factorization (NMF) algorithm is described for computational modeling of hierarchically polarized groups. It is enhanced with a language model, and with a proof of orthogonality of factorized components. We evaluate it on both synthetic and real-world datasets, demonstrating ability to hierarchically decompose overlapping beliefs. In the case where polarization is flat, we compare it to prior art and show that it outperforms state of the art approaches for polarization detection and stance separation. An ablation study further illustrates the value of individual components, including new enhancements.
1 Introduction
Extending a previous conference publication (Yang et al., 2020), this paper solves the problem of unsupervised computational modeling of hierarchically polarized groups. The model can accept, as input, a structural guide to the layout of groups and subgroups. The goal is to uncover the beliefs of each group and subgroup in that layout, divided into points of agreement and disagreement among the underlying communities and sub-communities, given their social media posts on polarizing topics. Most prior work clusters sources or beliefs into flat classes or stances (Küçük and Can, 2020). Instead, we focus on scenarios where the underlying social groups disagree on some issues but agree on others (i.e., their beliefs overlap). Moreover, we consider a (shallow) hierarchical structure, where communities can be further subdivided into subsets with their own agreement and disagreement points.
Our work is motivated, in part, by the increasing polarization on social media (Liu, 2012). Individuals tend to connect with like-minded sources (Bessi et al., 2016), ultimately producing echo-chambers (Bessi et al., 2016) and filter bubbles (Bakshy et al., 2015). Tools that could automatically extract social beliefs, and distinguish points of agreement and disagreement among them, might help generate future technologies (e.g., less biased search engines) that summarize information for consumption in a manner that gives individuals more control over (and better visibility into) the degree of bias in the information they consume.
The basic solution described in this paper is unsupervised. However, it does accept guidance on group/subgroup structure. Furthermore, the solution has an option for enhancement using prior knowledge of language models. By unsupervised, therefore, we mean that the (basic) approach does not need prior training, labeling, or remote supervision. This is in contrast, for example, to deep-learning solutions (Irsoy and Cardie, 2014; Liu et al., 2015; Wang et al., 2017) that usually require labeled data. The structural guidance, in this paper, is not meant to be obtained through training. Rather, it is meant as a mechanism for an analyst familiar with the situation to enter a template to match the inferred groups against. For example, the analyst might have the intuition that the community is divided into two conflicted factions, of which one is further divided into two subgroups with partial disagreement. They might be interested in understanding the current views of each faction/subgroup. The ability to exploit such analyst guidance (on the hierarchy of disagreement) is one of the distinguishing properties of our approach. In the absence of analyst intuitions, it is of course possible to skip structural guidance, as we show later in the paper. The basic algorithm can be configured so that it does not need language-specific prior knowledge (Liu, 2012; Hu Y. et al., 2013), distant-supervision (Srivatsa et al., 2012; Weninger et al., 2012), or prior embedding (Irsoy and Cardie, 2014; Liu et al., 2015), essentially making it language-agnostic. Instead, it relies on tokenization (the ability to separate individual words). Where applicable, however, we can utilize a BERTweet (Nguyen et al., 2020) variant that uses a pre-trained Tweet embedding to generate text features, if higher performance is desired. BERTweet is a specific language model for Tweets with the same structure as in the Bidirectional Encoder Representations from Transformers (BERT) (Devlin et al., 2019). While we test the solution only with English text, we conjecture that the its application can be easily extended to other languages (with the exception of those that do not have spaces between words, such as Chinese and Japanese, because we expect spaces as token separators). An advantage of unsupervised techniques is that they do not need to be retrained for new domains, jargon, or hash-tags.
The work is a significant generalization of approaches for polarization detection (Conover et al., 2011; Demartini et al., 2011; Bessi et al., 2016; Al Amin et al., 2017) that identify opposing positions in a debate but do not explicitly search for points of agreement. The unsupervised problem addressed in this paper is also different from unsupervised techniques for topic modeling (Litou and Kalogeraki, 2017; Ibrahim et al., 2018) and polarity detection (Al Amin et al., 2017; Cheng et al., 2017). Prior solutions to these problems aim to find orthogonal topic components (Cheng et al., 2017) or conflicting stances (Conover et al., 2011). In contrast, we aim to find components that adhere to a given (generic) overlap structure, presented as structural guidance from the user (e.g., from an analyst). Moreover, unlike solutions for hierarchical topic decomposition (Weninger et al., 2012; Zhang et al., 2018), we consider not only message content but also user attitudes towards it (e.g., who forwards it), thus allowing for better separation, because posts that share a specific stance are more likely to overlap in the target community (who end up spreading them).
This paper extends work originally presented at ASONAM 2020 (Yang et al., 2020). The extension augments the original paper in several aspects. First, we provide options for integrating a language model to improve outcomes. In this version, besides tokenization, we use language models that boost performance, compared to a purely lexical overlap-based approach. Second, we derive a new orthogonality property for the factorized components by our model. Finally, we conduct a simulation and new experiments that additionally verify our model in multiple scenarios involving both a flat group structure, and a hierarchical structure with complex sub-structure.
The work is evaluated using both synthetic data as well as real-life datasets, where it is compared to approaches that detect polarity by only considering who posted which claim (Al Amin et al., 2017), approaches that separate messages by content or sentiment analysis (Go et al., 2009), approaches that identify different communities in social hypergraphs (Zhou et al., 2007), and approaches that detect user stance by density-based feature clustering (Darwish et al., 2020). The results of this comparison show that our algorithm outperforms the state of the art. An ablation study further illustrates the impact of different design decisions on accomplishing this improvement.
The rest of the paper is organized as follows. Section 2 formulates the problem and summarizes the solution approach. Section 3 proposes our new belief structured matrix factorization model, and analyzes some model properties. Section 4 proves the property of orthogonality regarding one of the decomposed components. Section 5 and Section 6 present an experimental evaluation based on simulation and real data, respectively. We review the related literature on belief mining and matrix factorization in Section 7. The paper concludes with key observations and a statement on future directions in Section 8.
2 Problem Formulation
Consider an observed data set of posts collected from a social medium, such as Twitter, where each post is associated with a source and with semantic content, called a claim. Let
2.1 Problem Statement
We assume that the set of sources,
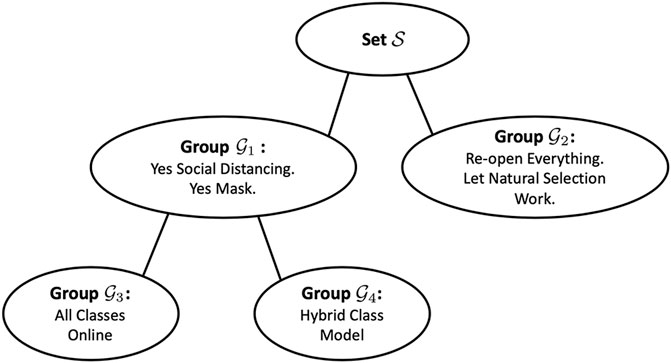
Figure 1 illustrates an example, inspired by the first wave of the COVID-19 pandemic in 2020. In this figure, a hypothetical community is divided on whether to maintain social distancing
2.2 Solution Approach
We use a non-negative matrix factorization algorithm to decompose the “who endorsed what” matrix,
3 Structured Matrix Factorization
The proposed structured matrix factorization algorithms allows the user (e.g., an analyst) to specify matrix, B, to represent the relation between the latent groups,
3.1 An Illustrative Example
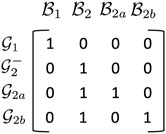
Consider a conflict involving two opposing groups, say, a minority group
For example, the second column indicates that the belief set
An interesting question might be: which sources belong to which group/subgroup? What are the incremental belief sets
3.2 Mathematical Formulation
To formulate the hierarchical overlapping belief estimation problem, we introduce the notion of claim endorsement. A source is said to endorse a claim if the source finds the claim agreeable with their belief. Endorsement, in this paper, represents a state of belief, not a physical act. A source might find a claim agreeable with their belief, even if the source did not explicitly post it. Let the probability that source Si endorses claim Cj be denoted by Pr(SiCj). We further denote the proposition
By definition of the belief structure matrix, B, we say that
where U is a matrix whose elements are uip and M is a matrix whose elements are mjq. Factorizing XG, given B, would directly yield U and M, whose elements are the probabilities we want: elements of matrix U yield the probabilities that a given source Si belongs to a given group
3.3 Estimating XG
Unfortunately, we do not really have matrix XG to do the above factorization. Instead, we have the observed source-claim matrix X that is merely a sampling of what the sources endorse. (It is a sampling because a silent source might be in agreement with a claim even if they did not say so.) Using X directly is suboptimal because it is very sparse. It is desired to estimate that a source endorses a claim even if the source remains silent. We do so on two steps.
3.3.1 Message Interpolation (the M-Module)
First, while source Si might have not posted a specific claim, Cj, it may have posted similar ones. If a source
To compute matrix D, in this work, we provide two configurations. For the language agnostic approach, we first compute a bag-of-words (BOW) vector wj for each claim j, and then normalize it using vector L2 norm,
3.3.2 Social Graph Convolution (S-Module)
To further improve our estimation of matrix XG, we assume that sources generally hold similar beliefs to those in their immediate social neighborhood. Thus, we perform a smoothing of matrix XM by replacing each cell, xij, by a weighted average of itself and the entries pertaining to neighbors of its source, Si, in the social graph. Let matrix A, of dimension
More specifically, from the social dependency matrix A (user-user retweet frequency), we can compute the degree matrix F by summing each row of A. The random walk normalized adjacency is denoted as
where each row of
3.4 Loss and Optimization
Given a belief mixture matrix, B, we now factorize XMS to estimate matrices U and M that decide the belief regions associated with sources and claims, respectively. (e.g., the estimated belief for claim
Regularization. To avoid model overfitting, we include widely used L2 regularization. Also, we enforce the sparsity of U and M by introducing an L1 norm. The overall objective function becomes (defined by the Frobenius-norm),
We rewrite J using matrix trace function tr(⋅)
We minimize J by gradient descent. Since only the non-negative region is of interest, derivatives of the L1 norm are differentiable in this setting. By referring to the gradient of traces of product with constant matrix A, ∇Xtr (AX) = A⊤ and ∇Xtr (XAX⊤) = X (A+ A⊤), the partial derivative of J w.r.t. U and M are calculated as,
The gradient matrix ∇U is of dimension
3.4.1 Run-time Complexity
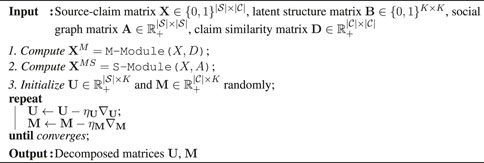
During the estimation, we generalize standard NMF multiplicative update rules (Lee and Seung, 2001) for our tri-factorization,
Note that, K (number of belief groups) is picked according to the dataset, and it typically satisfies
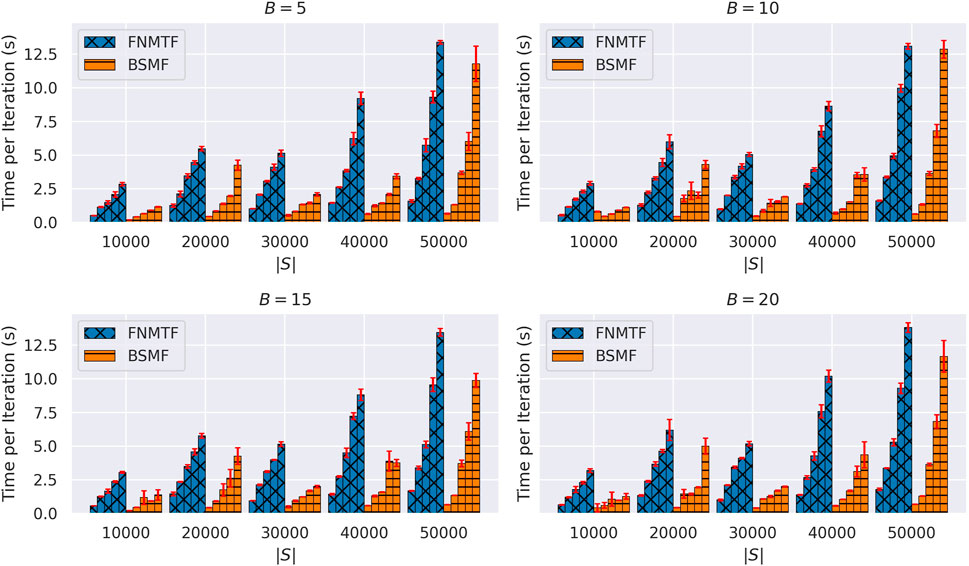
FIGURE 3. Running time under different configurations of dimensions of X and B. For each method, under the same |S|, |C| takes 10000, 20000, 30000, 40000, 50000 respectively. Red bar indicates standard deviation on time measurements.
4 Property of Orthogonality
The basic idea of belief structured matrix factorization (BSMF) is to decompose XMS ≈ UBM⊤. What does that imply regarding the generated rows of decomposition matrices? Below, we show that the rows of matrix U are approximately orthogonal and that the rows of matrix M are also approximately orthogonal. This property suggests a sense of decomposition quality in that the latent factors produced constitute more efficient (non-redundant) encoding bases of the original information.
Theorem 1. After BSMF factorization, {Uk} are approximately orthogonal.
PROOF. We start the analysis by the recapitulation of loss function,
Let us first ignore the L1 and L2 term. Since
The first objective, Eq. 9, is similar to K-means type clustering after expanding the trace function, which maximize within-cluster similarities,
The second objective is to enforce orthogonality approximately. Because UBM⊤ ≈ XMS, let us add L2-norm of U and M now, so that the scale of U, M are constrained Wang and Zhang (2012). Since B is positive and fixed,
By Cauchy’s inequality, we further have,
Thus, the overall second objective is bounded by,
which enforces the orthogonality of rows in set {Uk}.
Corollary 1.1. After BSMF factorization, {Mk} are approximately orthogonal.
PROOF. Similar to the proof above,
Thus, the overall second objective is bounded by,
which enforces the orthogonality of pre-belief bases {Mk}.In other words, the generated groups into which all sources and claims decomposed are maximally diverse and are not redundant in some sense.
5 Illustrative Simulation
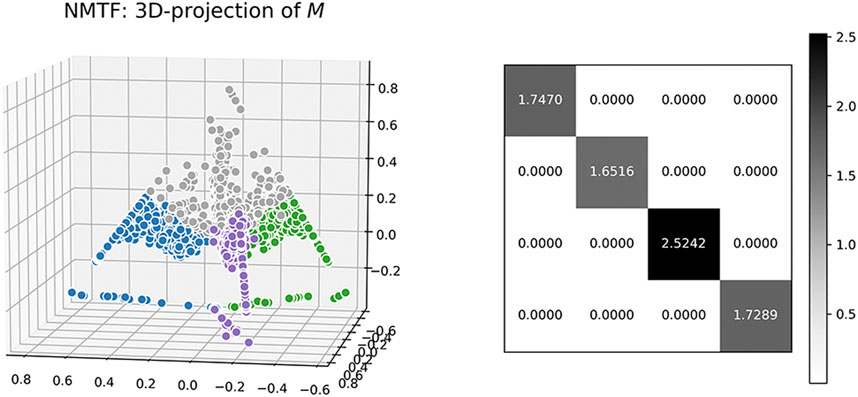
To help visualize the belief structure developed in our approach and offer a concrete example of approximate orthogonality of groups (i.e., pre-belief bases), we created simulations to evaluate our models multiple times against two simpler variants. We also provide 3D visualizations of the factorized components to observe their spatial characteristics.
5.1 Dataset Construction
To offer a simplified and controllable setting in which we can visualize the novel factorization algorithm, we build a synthetic dataset, where two groups of users are created, a minority,
5.2 Method Comparison
The factorization algorithm uses the belief structure matrix in Figure 2. Two simpler variants are introduced: 1) the first variant substitutes B with an identity matrix, and takes a standard NMF formulation XG = UM⊤; 2) the second variant substitutes B with an learnable matrix
5.3 Results of 200 Rounds
We run each model for 200 times and compute the classification accuracy of users and claims for each algorithm in every run, then average them over all runs. We find that BSMF consistently outperforms NMF and NMTF. The average values of accuracy for BSMF, NMF and NMTF are 97.34%, 93.78%, 95.54%, respectively. As might be expected, specifying matrix, B, guides subsequent factorization to a better result compared to both NMF and NMTF.
5.4 Visualization of Results
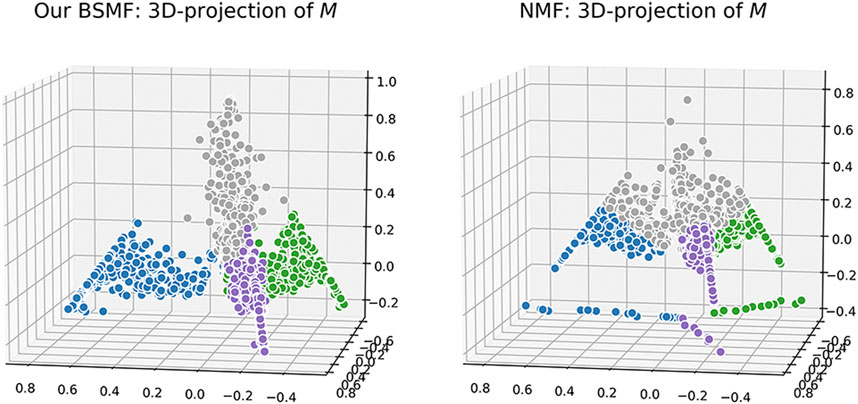
We also visualize the computed matrix, M, for each algorithm. Colors are based on ground-truth labels. In Figure 4 and Figure 5, we project the estimated M into a 3-D space, where each data point represents a message. In each figure, all of the data points seem to lie in a regular tetrahedron (should be regular K-polyhedron for more general K-belief cases). It is interesting that for NMF, different colors are very closely collocated in the latent space (e.g., there is very little separation between the grey color and others). It is obviously difficult to draw a boundary for the crowded mass. NMTF is a little bit better: different colors are visually more separable. We also visualize the learned
The projection result of BSMF are different: different color points are better separated and grouped by colors. We hypothesize that in the four-dimensional space, data points should be perfectly aligned with one of the belief bases/parts, and these four bases are conceivably orthogonal in that space. In a word, the results on synthetic data strongly suggest that our model disentangles the latent manifold leading to a better separation of messages by belief sets.
6 Experiments With Empirical Data
In the section, we evaluate Belief Structured Matrix Factorization (BSMF) using real-world Twitter datasets of different patterns of belief overlap, hierarchy, or disjointedness. Key statistics of these data sets are briefly summarized in Table 1. Our model is compared to (up to) six baselines and five model variants. Each experiment is run 20 times to acquire the mean and the standard deviation for measurements. We elaborate the experimental settings and results below.
6.1 Disjoint Belief Structure: United States Election 2020
We start with a dataset where we posit that agreements are too weak to the point where beliefs of key groups are assumed to be “disjoint” (i.e., share no overlap). Specifically, during the 2020 United States election, messages on social media tended to be very polarized, either supporting the democratic or the republican party, exclusively. The example demonstrates a simplest case of belief factorization for clarity.
6.1.1 Dataset
We use Apollo Social Sensing Toolkit2 to collect the United States Election 2020 dataset. The dataset contains tweets collected during the United States Election in 2020, where the support for candidates was split between former president Donald Trump and president Joe Biden. Basic statistics are reported in Table 1. Overall, the most retweeted 237 tweets from the dataset are manually annotated, which separate into 133 pro-Trump and 104 anti-Trump claims.
In this dataset, the sources are split into two groups
where rows correspond to groups
6.1.2 Baselines
We select six baseline methods that encompass different perspectives on belief separation:
• Random: A trivial baseline that annotates posts randomly, giving equal probability to each label.
• DBSCAN (Darwish et al., 2020): A density-based clustering technique that extracts user-level features and performs DBSCAN for unsupervised user stance detection in Twitter. In this paper, we use DBSCAN and then map the user stance to claim stances with majority voting, as a baseline.
• Sentiment140 (Go et al., 2009): Content-aware solutions based on language or sentiment models. In the implementation, each of the claims is a query through Sentiment140 API, which responds with a polarity score. The API will respond with the same score upon multiple same requests.
• H-NCut (Zhou et al., 2007): The method views the bipartite structure of the source-claim network as a hypergraph, where claims are nodes and sources are hyperedges. The problem is thus seen as a hypergraph community detection problem, where community nodes represent posts. We implement H-NCut, a hypergraph normalized cut algorithm.
• Polarization (Al Amin et al., 2017): A baseline that uses an NMF-based solution for social network belief extraction to separate biased and neutral claims.
• NMTF: A baseline with a learnable mixture matrix. We compare our model with it to demonstrate that pure learning without a prior is not enough to unveil the true belief overlap structure in real-world applications.
• FNMTF (Wang et al., 2011): A baseline for data co-clustering with non-negative matrix tri-factorization. We compare to this model mainly to have a run-time complexity comparison and demonstrate the importance of structural guidance.
Different variants of BSMF are also evaluated to verify the effectiveness of message similarity interpolation (the M-module) and social graph convolution (the S-module). BSMFMS incorporates both modules. Models with only the M-module or the S-module are named BSMFM and BSMFS, respectively. BSMF denotes the model without either module. BSMFMS−BERT and BSMFM−BERT are two variants whose M-modules are configured to use BERTweet (Nguyen et al., 2020) embeddings, while BSMFMS and BSMFM are using lexical overlap enabled by tokenization.
6.1.3 Evaluation Metrics
We evaluate claim separation, since only claim labels are accessible. We use the Python scikit-learn package to help with the evaluation. Multiple metrics are employed. Since we only have two groups in the dataset, we use binary-metrics to calculate precision, recall and f1-score over the classification results, and we also use weighted-metrics to account for class imbalance by computing the average of metrics in which each class score is weighted by its presence in the true data sample. Standard precision, recall and f1-score are considered in both scenarios. Note that weighted averaging may produce an f1 that is not between precision and recall.
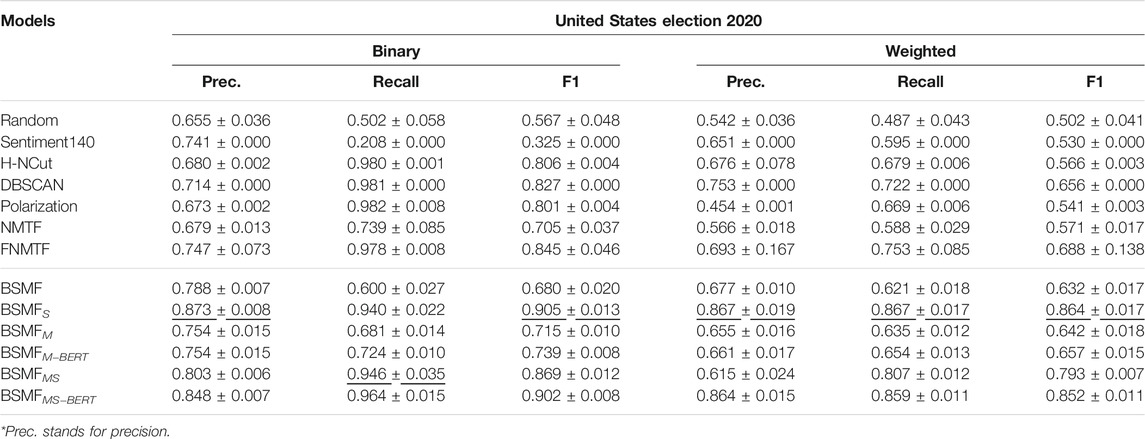
6.1.4 Result of United States Election 2020
The comparison results are shown in Table 2. It is not surprising that all baselines beat Random. Overall, matrix factorization methods work well for this problem. Among other baselines, Sentiment140 work poorly for this task, because 1) they use background language models that are pre-trained on another corpus; and 2) they do not user dependency information, which matters in real-world data. H-NCut and DBSCAN yield acceptable performance, but cannot compare with our BSMF algorithm with S-module, since they ignore the user dependencies. Considering weighted scores, NMTF outperforms the NMF-based algorithm, which is as expected. With the S-module, our BSMF algorithm ranks the top in terms of all metrics. Comparing to other variants, M-module in this dataset does not add benefit, mostly because several important keywords such as “president”, “Trump”, and “election” are shared by both sides. Therefore, variants using content similarity may experience confusion and not perform well. This is especially true of variants that use lexical similarity although variants that use BERTweet embeddings also suffer compared to BSMFS.
For illustrative purposes (to give a feel for the data), Table 3 shows the top 3 tweets from each belief set (
6.2 Star-like Belief Structure: Eurovision2016
Next, we consider a data set where we break sources into two subgroups but assume that they have overlapping beliefs. The example facilitates comparison with the prior state of the art on polarization that addresses a flat belief structure.
6.2.1 Dataset
We use the Eurovision2016 dataset, borrowed from (Al Amin et al., 2017). Eurovision2016 contains tweets about the Ukrainian singer, Jamala, who won the Eurovision (annual) song contest in 2016. Her success was a surprise to many as the expected winner had been from Russia according to pre-competition polls. The song was on a controversial political topic, telling a story about deportation of Crimean Tatars by Soviet Union forces in the 1940s. Tweets related to Jamala were collected within 5 days of the contest. Basic statistics are reported in Table 1. As pre-processed in (Al Amin et al., 2017), the most popular 1,000 claims were manually annotated. They were separated into 600 pro-Jamala, 239 anti-Jamala, and 161 neutral claims.
In the context of the dataset, the entire set of sources is regarded as a big group,
where rows correspond to groups
6.2.2 Baselines
We use the same baselines as in Section 6.1.2. Similarly, we also use all variants of BSMF algorithms.
6.2.3 Evaluation Metrics
In this dataset, we evaluate claim separation using metrics described in Section 6.1.3. Instead of binary-evaluation, we use macro-evaluation because there are three groups in this dataset, as opposed to only two (in the previous subsection). This metric calculates the mean of the metrics, giving equal weight to each class. It is used to highlight model performance of infrequent classes. Still, note that weighted averaging may produce an f1-score that is not between precision and recall.
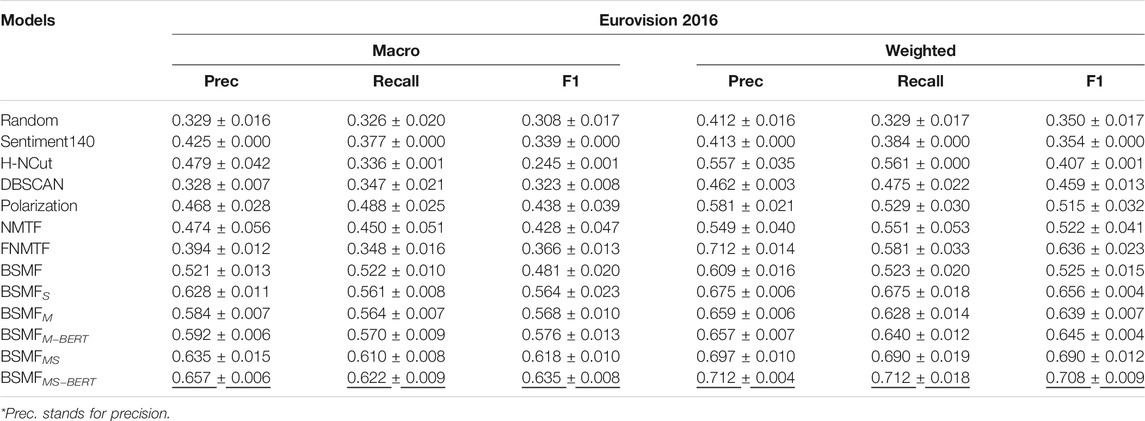
6.2.4 Result of Eurovision2016
The comparison results are shown in Table 4. Similar to the results of United States Election 2020, all baselines beat Random, and matrix factorization methods work okay for this problem, but not as good. Sentiment140 still works poorly for the same reason as before. H-NCut and DBSCAN yield much weaker performance than before, likely because they fail to adequately consider the underlying overlapping belief structure. NMTF outperforms the NMF-based algorithm. The reason may be that its additional freedom allows it to capture the underlying structure better. With both the M-module and S-module, our BSMF algorithm ranks the top in all metrics. Both modules help in this experiment. We believe that it is due to the specific star-like belief structure and the existence of a residual group who beliefs can be better inferred by message interpolation. Further, we see that BERTweet variants perform better than lexical M-modules on several metrics in this case, because BERTweet is more language focused. As before, for illustration and to give a sense of the data, Table 5 shows the top 3 tweets from each belief set (
6.3 Joint Polarity and Topic Separation
Before we test our algorithm on a dataset with a hierarchical belief structure, we test it on something it is not strictly designed to do: namely, joint separation of topic and polarity. This problem may arise in instances where multiple interest groups simultaneously discuss different topics, expressing different opinions on them. We check whether our algorithm can simultaneously separate the different interest groups and their stances on their topics of interest. To do so, we artificially concatenated tweets from Eurovision2016 and the United States Election 2020 datasets. This operation creates a virtual hierarchy where each original topic is viewed as a different interest group. Inside each group, there are sub-structures as introduced before. Accordingly, we apply our algorithm on the following belief structure:
where rows correspond to groups
6.3.1 Evaluation Metrics
We first evaluate the accuracy of the dataset separation by collapsing the label to each 0 and 1 corresponding to two datasets. Then, for each dataset, we employ Macro-f1 score and Weighted-f1 score on Eurovision2016 dataset, Binary-f1 score and Weighted-f1 score on United States Election 2020 dataset.
6.3.2 Result of Separation
The comparison results are shown in Table 6. All BSMF variants, specifically those with M-module and S-module, performed well on separation of two datasets. In addition, comparing the f1-scores to the performance of the same variant in to Table 2 and Table 4, we are pleased to discover the f1-scores have not deteriorated, demonstrating the basic ability of our model to perform hierarchical belief estimation.
6.4 Hierarchical Belief Structure: Global Warming
We consider a real hierarchical scenario in this section, with a majority group,
where rows represent groups
6.4.1 Datasets
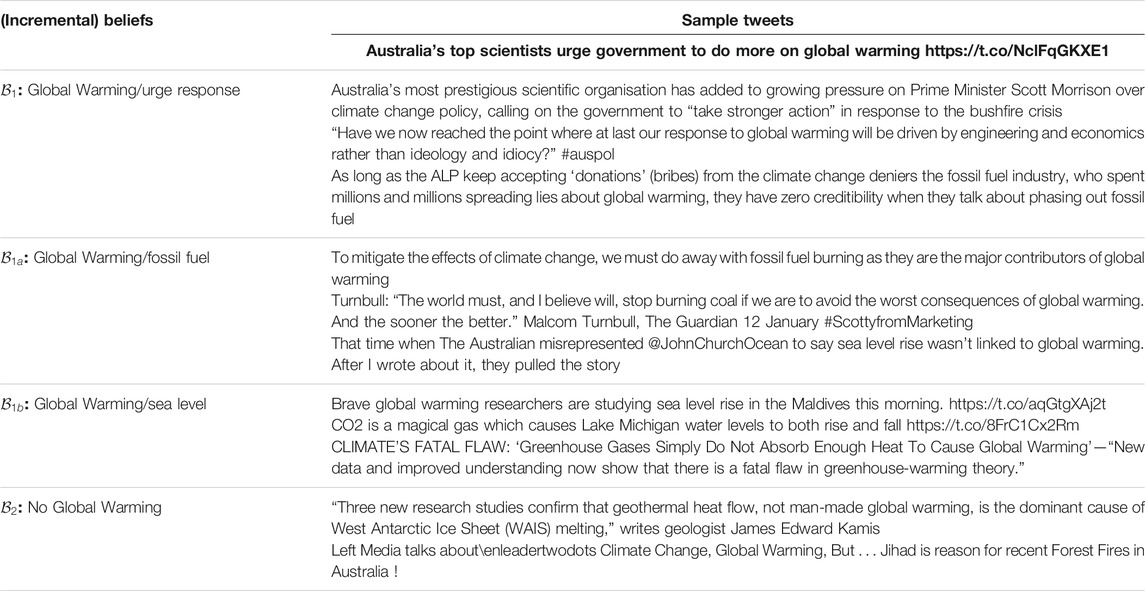
We apply this belief structure to an unlabeled dataset, Global Warming, which is crawled in real time with the Apollo Social Sensing Toolkit. This dataset is about a twitter discussion of global warming in the wake of Australia wildfires that ravaged the continent, in September 2019, where at least 17.9 million acres of forest have burned in the fire. Our goal is to identify and separate posts according to the above abstract belief structure.
Table 7 shows the algorithm’s assignment of claims to belief groups (only the top 3 claims are shown for space limitations). The first column shows the abstract belief categories
6.4.2 Quantitative Measurements
Next, we do a sanity check by measuring user grouping consistency. Specifically, we first identify the belief sets (by claim separation) and then assign belief labels to users by having a user inherit the assigned belief set label for each claim they made. The inherited labels are inconsistent if they belong to different groups according to matrix, B. For example, if the same user has been assigned belief labels
The percentage of coherently labeled users was 96.08%. Note that, we do not conduct comparison in this dataset, since most baselines do not uncover hierarchical group/belief structures, whereas those that do generally break up the hierarchy differently (e.g., by hierarchical topic, not hierarchical stance) thus not offering an apples to apples comparison. In future work, we shall explore more comparison options.
7 Related Work
The problem of modeling social groups has been long researched. For example, the problem of belief mining has been a subject of study for decades (Liu, 2012). Solutions include such diverse approaches as detecting social polarization (Conover et al., 2011; Al Amin et al., 2017), opinion extraction (Srivatsa et al., 2012; Irsoy and Cardie, 2014; Liu et al., 2015), stance detection (Darwish et al., 2020) and sentiment analysis (Hu et al., 2013a,b), to name a few.
Pioneers, like Leman at el (Akoglu, 2014). and Bishan at el. (Yang and Cardie, 2012), had used Bayesian models and other basic classifiers to separate social beliefs. On the linguistic side, many efforts to extract user opinions based on domain-specific phrase chunks (Wu et al., 2018), and temporal expressions (Schulz et al., 2015). With the help of pre-trained embedding, like Glove (Liu et al., 2015) or word2vec (Wang et al., 2017), deep neural networks (e.g., variants of RNN (Irsoy and Cardie, 2014; Liu et al., 2015)) emerged as powerful tools (usually with attention modules (Wang et al., 2017)) for understanding the polarity or sentiment of user messages. In contrast to the above supervised language-specific solutions, we want to provide options and consider the challenge of developing an unsupervised approach that could also be language-agnostic.
In the domain of unsupervised algorithms, our problem is different from the related problems of unsupervised topic detection (Ibrahim et al., 2018; Litou and Kalogeraki, 2017), sentiment analysis (Hu et al., 2013a,b), truth discovery (Shao et al., 2018, 2020), and unsupervised community detection (Fortunato and Hric, 2016). Topic modeling assigns posts to polarities or topic mixtures (Han et al., 2007), independently of actions of users on this content. Hence, they often miss content nuances or context that helps better interpret the stance of the source. Community detection (Yang and Leskovec, 2013), on the other hand, groups nodes by their general interactions, maximizing intra-class links while minimizing inter-class links (Yang and Leskovec, 2013; Fortunato and Hric, 2016), or partitioning (hyper)graphs (Zhou et al., 2007). While different communities may adopt different beliefs, this formulation fails to distinguish regions of belief overlap from regions of disagreement.
The above suggests that belief mining must consider both sources (and forwarding patterns) and content. Prior solutions used a source-claim bipartite graph, and determined disjoint polarities by iterative factorization (Akoglu, 2014; Al Amin et al., 2017). Our work extends a conference publication that first introduced the hierarchical belief separation problem (Yang et al., 2020). This direction is novel in postulating a more generic and realistic view: social beliefs could overlap and can be hierarchically structured. In this context, we developed a new matrix factorization scheme that considers 1) the source-claim graph (Al Amin et al., 2017); 2) message word similarity (Weninger et al., 2012) and 3) user social dependency (Zhang et al., 2013) in a new class of non-negative matrix factorization techniques to solve the hierarchical overlapping belief estimation problem.
The work also contributes to non-negative matrix factorization. NMF was first introduced by Paatero and Tapper (Paatero and Tapper, 1994) as the concept of positive matrix factorization and was popularized by the work of Lee and Seung (Lee and Seung, 2001), who gave an interesting interpretation based on parts-based representation. Since then, NMF has been widely used in various applications, such as pattern recognition (Cichocki et al., 2009) and signal processing (Buciu, 2008).
Two main issues of NMF have been intensively discussed during the development of its theoretical properties: solution uniqueness (Donoho and Stodden, 2004; Klingenberg et al., 2009) and decomposition sparsity (Moussaoui et al., 2005; Laurberg et al., 2008). By only considering the standard formula X ˜ UM⊤, it is usually not difficult to find a non-negative and non-singular matrix V, such that UV and V−1M⊤ could also be a valid solution. Uniqueness will be achieved if U and M are sufficiently sparse or if additional constraints are included (Wang and Zhang, 2012). Special constraints have been proposed in (Hoyer, 2004; Mohammadiha and Leijon, 2009) to improve the sparseness of the final representation.
Non-negative matrix tri-factorization (NMTF) is an extension of conventional NMF (i.e., X ˜ UBM⊤ (Yoo and Choi, 2010)). Unconstrained NMTF is theoretically identical to unconstrained NMF. However, when constrained, NMTF possesses more degrees of freedom (Wang and Zhang, 2012). NMF on a manifold emerges when the data lies in a nonlinear low-dimensional submanifold (Cai et al., 2008). Manifold Regularized Discriminative NMF (Ana et al., 2011; Guan et al., 2011) were proposed with special constraints to preserve local invariance, so as to reflect the multilateral characteristics.
In this work, instead of including constraints to impose structural properties, we adopt a novel belief structured matrix factorization by introducing the mixture matrix B. The structure of B can well reflect the latent belief structure and thus narrows the search space to a good enough region.
8 Conclusion
In this paper, we discuss computational modeling of polarized social groups using a class of NMF, where the structure of parts is already known (or assumed to follow some generic form). Specifically, we use a belief structure matrix B to describe the structure of the latent space and evaluate a novel Belief Structured Matrix Factorization algorithm (BSMF) that separates overlapping, hierarchically structured beliefs from large volumes of user-generated messages. The factorization could be briefly formulated as XMS ≈ UBM⊤, where B is known. The soundness of the model is first tested on a synthetic dataset. A further evaluation is conducted on real Twitter events. The results show that our algorithm consistently outperforms baselines. The paper contributes to a research direction on automatically separating data sets according to arbitrary belief structures to enable more in-depth modeling and understanding of social groups, attitudes, and narratives on social media.
Data Availability Statement
The original contributions presented in the study are included in the article/Supplementary Material, further inquiries can be directed to the corresponding author.
Author Contributions
DS and CY contributed to the formulation of the problem and derivation of the algorithm and the proof. DS and CY performed the simulation experiment. JL, RW, SY, HS, DL, SL, and TW collected and organized datasets, and helped DS and CY performed experiments. DS and CY wrote the draft of the manuscript. All authors contributed to manuscript revision, read, and approved the submitted version.
Conflict of Interest
The authors declare that the research was conducted in the absence of any commercial or financial relationships that could be construed as a potential conflict of interest.
Publisher’s Note
All claims expressed in this article are solely those of the authors and do not necessarily represent those of their affiliated organizations, or those of the publisher, the editors, and the reviewers. Any product that may be evaluated in this article, or claim that may be made by its manufacturer, is not guaranteed or endorsed by the publisher.
Acknowledgments
Research reported in this paper was sponsored in part by DARPA award W911NF-17-C-0099, DARPA award HR001121C0165, Basic Research Office award HQ00342110002, and the Army Research Laboratory under Cooperative Agreement W911NF-17-20196. The views and conclusion contained in this document are those of the authors and should not be interpreted as representing the official policies of the CCDC Army Research Laboratory, DARPA, or the United States government. The United States government is authorized to reproduce and distribute reprints for government purposes notwithstanding any copyright notation hereon.
Footnotes
1In practice, we permute the labels and pick the best matching as a result, since our approach does clustering not classification.
2http://apollo4.cs.illinois.edu/datasets.html
References
Akoglu, L. (2014). Quantifying Political Polarity Based on Bipartite Opinion Networks. Ann Arbor: ICWSM.
Al Amin, M. T., Aggarwal, C., Yao, S., Abdelzaher, T., and Kaplan, L. (2017). “Unveiling Polarization in Social Networks: A Matrix Factorization Approach,” in 2017 - IEEE Conference on Computer Communications, Atlanta (INFOCOM). doi:10.1109/infocom.2017.8056959
Ana, S., Yoob, J., and Choi, S. (2011). Manifold-respecting Discriminant Nonnegative Matrix Factorization [j]. Pattern Recognition Lett. 32 (6), 832–837. doi:10.1016/j.patrec.2011.01.012
Bakshy, E., Messing, S., and Adamic, L. A. (2015). Exposure to Ideologically Diverse News and Opinion on Facebook. Science 348 (6239), 1130–1132. doi:10.1126/science.aaa1160
Bessi, A., Zollo, F., Del Vicario, M., Puliga, M., Scala, A., Caldarelli, G., et al. (2016). Users Polarization on Facebook and Youtube. PloS one 11 (8), e0159641. doi:10.1371/journal.pone.0159641
Buciu, I. (2008). “Non-negative Matrix Factorization, a New Tool for Feature Extraction: Theory and Applications,” in International Journal of Computers, Communications and Control.
Cai, D., He, X., Wu, X., and Han, J. (2008). “Non-negative Matrix Factorization on Manifold,” in ICDM. doi:10.1109/icdm.2008.57
Cheng, K., Li, J., Tang, J., and Liu, H. (2017). “Unsupervised Sentiment Analysis with Signed Social Networks,” in AAAI.
Cichocki, A., Zdunek, R., Phan, A. H., and Amari, S.-i. (2009). Nonnegative Matrix and Tensor Factorizations: Applications to Exploratory Multi-Way Data Analysis and Blind Source Separation. John Wiley & Sons.
Conover, M. D., Ratkiewicz, J., Francisco, M., Gonçalves, B., Menczer, F., and Flammini, A. (2011). “Political Polarization on Twitter,” in ICWSM.
Darwish, K., Stefanov, P., Aupetit, M., and Nakov, P. (2020). “Unsupervised User Stance Detection on Twitter,” in Proceedings of the International AAAI Conference on Web and Social Media, 141–152.14
Demartini, G., Siersdorfer, S., Chelaru, S., and Nejdl, W. (2011). “Analyzing Political Trends in the Blogosphere,” in Fifth International AAAI Conference on Weblogs and Social Media.
Devlin, J., Chang, M.-W., Lee, K., and Toutanova, K. (2019). Bert: Pre-training of Deep Bidirectional Transformers for Language Understanding [Dataset].
Donoho, D., and Stodden, V. (2004). “When Does Non-negative Matrix Factorization Give a Correct Decomposition into Parts,” in NIPS.
Fortunato, S., and Hric, D. (2016). Community Detection in Networks: A User Guide. Phys. Rep. 659. doi:10.1016/j.physrep.2016.09.002
Go, A., Bhayani, R., and Huang, L. (2009). Twitter Sentiment Classification Using Distant Supervision. Processing 150.
Guan, N., Tao, D., Luo, Z., and Yuan, B. (2011). Manifold Regularized Discriminative Nonnegative Matrix Factorization with Fast Gradient Descent. IEEE Trans. Image Process. 20 (7), 2030–2048. doi:10.1109/tip.2011.2105496
Han, J., Cheng, H., Xin, D., and Yan, X. (2007). Frequent Pattern Mining: Current Status and Future Directions. TKDD 15 (1), 55–86. doi:10.1007/s10618-006-0059-1
Hu, X., Tang, J., Gao, H., and Liu, H. (2013a). “Unsupervised Sentiment Analysis with Emotional Signals,” in Proceedings of the 22nd international conference on World Wide Web - WWW. 13. doi:10.1145/2488388.2488442
Hu, Y., Wang, F., and Kamb, S. (2013b). “Listening to the Crowd: Automated Analysis of Events via Aggregated Twitter Sentiment,” in IJCAI.
Ibrahim, R., Elbagoury, A., Kamel, M. S., and Karray, F. (2018). “Tools and Approaches for Topic Detection from Twitter Streams: Survey,” in Knowledge and Information Systems. doi:10.1007/s10115-017-1081-x
Irsoy, O., and Cardie, C. (2014). “Opinion Mining with Deep Recurrent Neural Networks,” in EMNLP. doi:10.3115/v1/d14-1080
Klingenberg, B., Curry, J., and Dougherty, A. (2009). Non-negative Matrix Factorization: Ill-Posedness and a Geometric Algorithm. Pattern Recognition. 42(5):918–928. doi:10.1016/j.patcog.2008.08.026
Laurberg, H., Christensen, M. G., Plumbley, M. D., Hansen, L. K., and Jensen, S. H. (2008). Theorems on Positive Data: On the Uniqueness of Nmf. Computational Intelligence and Neuroscience.
Litou, I., and Kalogeraki, V. (2017). “Pythia: A System for Online Topic Discovery of Social media Posts,” in ICDCS. doi:10.1109/icdcs.2017.289
Liu, B. (2012). “Sentiment Analysis and Opinion Mining,” in Synthesis Lectures on Human Language Technologies.
Liu, P., Joty, S., and Meng, H. (2015). “Fine-grained Opinion Mining with Recurrent Neural Networks and Word Embeddings,” in EMNLP. doi:10.18653/v1/d15-1168
Mohammadiha, N., and Leijon, A. (2009). “Nonnegative Matrix Factorization Using Projected Gradient Algorithms with Sparseness Constraints,” in ISSPIT. doi:10.1109/isspit.2009.5407557
Moussaoui, S., Brie, D., and Idier, J. (2005). “Non-negative Source Separation: Range of Admissible Solutions and Conditions for the Uniqueness of the Solution,” in ICASSP.
Nguyen, D. Q., Vu, T., and Nguyen, A. T. (2020). “BERTweet: A Pre-trained Language Model for English Tweets,” in Proceedings of the 2020 Conference on Empirical Methods in Natural Language Processing: System Demonstrations, 9–14. doi:10.18653/v1/2020.emnlp-demos.2
Paatero, P., and Tapper, U. (1994). Positive Matrix Factorization: A Non-negative Factor Model with Optimal Utilization of Error Estimates of Data Values. Environmetrics 5 (2), 111–126. doi:10.1002/env.3170050203
Schulz, A., Schmidt, B., and Strufe, T. (2015). “Small-scale Incident Detection Based on Microposts,” in Proceedings of the 26th ACM Conference on Hypertext & Social Media. doi:10.1145/2700171.2791038
Shao, H., Sun, D., Yao, S., Su, L., Wang, Z., Liu, D., et al. (2021). Truth Discovery with Multi-Modal Data in Social Sensing. IEEE Trans. Comput. 70, 1325–1337. doi:10.1109/TC.2020.3008561
Shao, H., Yao, S., Zhao, Y., Zhang, C., Han, J., Kaplan, L., et al. (2018). “A Constrained Maximum Likelihood Estimator for Unguided Social Sensing,” in IEEE INFOCOM 2018-IEEE Conference on Computer Communications (IEEE), 2429–2437. doi:10.1109/infocom.2018.8486306
Srivatsa, M., Lee, S., and Abdelzaher, T. (2012). “Mining Diverse Opinions,” in MILCOM 2012-2012 IEEE Military Communications Conference. doi:10.1109/milcom.2012.6415602
Wang, H., Nie, F., Huang, H., and Makedon, F. (2011). “Fast Nonnegative Matrix Tri-factorization for Large-Scale Data Co-clustering,” in Twenty-Second International Joint Conference on Artificial Intelligence.
Wang, W., Pan, S. J., Dahlmeier, D., and Xiao, X. (2017). “Coupled Multi-Layer Attentions for Co-extraction of Aspect and Opinion Terms,” in AAAI.
Wang, Y.-X., and Zhang, Y.-J. (2012). Nonnegative Matrix Factorization: A Comprehensive Review. San Francisco: TKDE.
Weninger, T., Bisk, Y., and Han, J. (2012). “Document-topic Hierarchies from Document Graphs,” in CIKM. doi:10.1145/2396761.2396843
Wu, C., Wu, F., Wu, S., Yuan, Z., and Huang, Y. (2018). A Hybrid Unsupervised Method for Aspect Term and Opinion Target Extraction. Knowledge-Based Syst. 148, 66–73. doi:10.1016/j.knosys.2018.01.019
Yang, B., and Cardie, C. (2012). “Extracting Opinion Expressions with Semi-markov Conditional Random fields,” in EMNLP.
Yang, C., Li, J., Wang, R., Yao, S., Shao, H., Liu, D., et al. (2020). “Hierarchical Overlapping Belief Estimation by Structured Matrix Factorization,” in 2020 IEEE/ACM International Conference on Advances in Social Networks Analysis and Mining (ASONAM), 81–88. doi:10.1109/ASONAM49781.2020.9381477
Yang, J., and Leskovec, J. (2013). “Overlapping Community Detection at Scale: a Nonnegative Matrix Factorization Approach,” in WSDM.
Yoo, J., and Choi, S. (2010). Orthogonal Nonnegative Matrix Tri-factorization for Co-clustering: Multiplicative Updates on Stiefel Manifolds. Elsevier.
Zhang, C., Tao, F., Chen, X., Shen, J., Jiang, M., Sadler, B., et al. (2018). “Taxogen: Unsupervised Topic Taxonomy Construction by Adaptive Term Embedding and Clustering,” in SIGKDD.
Zhang, H., Dinh, T. N., and Thai, M. T. (2013). “Maximizing the Spread of Positive Influence in Online Social Networks,” in ICDCS. doi:10.1109/icdcs.2013.37
Keywords: polarization, belief estimation, hierarchical, matrix factorization, unsupervised
Citation: Sun D, Yang C, Li J, Wang R, Yao S, Shao H, Liu D, Liu S, Wang T and Abdelzaher TF (2021) Computational Modeling of Hierarchically Polarized Groups by Structured Matrix Factorization. Front. Big Data 4:729881. doi: 10.3389/fdata.2021.729881
Received: 24 June 2021; Accepted: 16 November 2021;
Published: 22 December 2021.
Edited by:
Neil Shah, Independent researcher, Santa Monica, CA, United StatesReviewed by:
Tong Zhao, University of Notre Dame, United StatesEkta Gujral, Walmart Labs, United States
Copyright © 2021 Sun, Yang, Li, Wang, Yao, Shao, Liu, Liu, Wang and Abdelzaher. This is an open-access article distributed under the terms of the Creative Commons Attribution License (CC BY). The use, distribution or reproduction in other forums is permitted, provided the original author(s) and the copyright owner(s) are credited and that the original publication in this journal is cited, in accordance with accepted academic practice. No use, distribution or reproduction is permitted which does not comply with these terms.
*Correspondence: Dachun Sun, bWFpbHRvOmRzdW4xOEBpbGxpbm9pcy5lZHU=
†These authors have contributed equally to this work
 Dachun Sun
 Chaoqi Yang1†