 Bin Zhang
 Junxing Lai2,†
94% of researchers rate our articles as excellent or good
Learn more about the work of our research integrity team to safeguard the quality of each article we publish.
Find out more
ORIGINAL RESEARCH article
Front. Cardiovasc. Med., 09 April 2025
Sec. Cardiovascular Epidemiology and Prevention
Volume 12 - 2025 | https://doi.org/10.3389/fcvm.2025.1583614
This article is part of the Research TopicExploring the Interplay Between Nutrition, Trace Elements, and Cardiovascular HealthView all articles
Background: The triglyceride–glucose (TyG) index has been linked to impaired cardiovascular fitness (CVF). However, the available evidence regarding the direct relationship between the TyG index and maximal oxygen uptake (VO2max) is limited. This study aims to investigate the association between the TyG index and VO2max.
Methods: We conducted a retrospective cross-sectional study involving 3,571 participants who completed a CVF examination as part of the National Health and Nutrition Examination Survey (NHANES) 1999–2004. Data on triglycerides, glucose, and VO2max were collected from all participants. The TyG index was calculated using the formula: Ln[triglyceride (TG)(mg/dl) × fasting plasma glucose (FPG)(mg/dl)/2]. Linear regression analysis was utilized to substantiate the research objectives.
Results: The complex sampling design and mobile examination center sample weights were considered. In multivariable linear regression analyses, each 1 unit increase in the TyG index was associated with a decrease in VO2max [β = −1.24, 95% CI (−1.97, −0.51), p = 0.002] when expressed as a continuous variable, independent of confounders. The TyG index was converted into a categorical variable based on four quartiles. Compared with the lowest TyG quintile (Q1: 6.750–7.887), the fully adjusted β for Q4 (8.672–12.481) was −1.91 (95% CI: −3.24, −0.57, p < 0.007). A significant interaction (p = 0.007) between sex and the TyG index for VO2max was found in the population using subgroup analysis. The results of the sensitivity analysis remained stable. Mediation analysis showed the direct effect of the TyG index was −1.467 (−2.019, −0.948), with a total effect of −1.813 (−2.377, −1.286). The mediation effect of diastolic blood pressure (DBP), white blood cell count (WBC), and C-reactive protein (CRP) was −0.389 (−0.526, −0.268), −0.308 (−0.432, −0.177), and −0.252 (−0.453, −0.135), respectively. HGB was found to exert a suppressing effect on the relationship between the TyG index and VO2max, with a value of 1.469 (1.252, 1.702). The p-values for all the above effects were <0.05.
Conclusions: In the US young and middle-aged population, the TyG index was significantly adversely associated with VO2max levels. Females may exert an interaction on TyG. Evidence supported DBP, WBC, and CRP as intervening variables through which the TyG index exerts its influence on VO2max. HGB may overrule the potential inverse association between the TyG index and VO2max.
NCHS IRB/ERB Protocol Number: Protocol #98-12.
Cardiovascular diseases (CVD) are a major cause of death and disability worldwide (1–6). With the intensification of population aging, the burden of cardiovascular disease is also constantly increasing (7–10). According to a report by the American Heart Association (AHA), the number of deaths due to cardiovascular diseases exceeds the combined total number of deaths due to cancer and lower respiratory diseases. The crude prevalence of CVD in 2020 increased by 29.01% compared with 2010 (11). Maximal oxygen uptake (VO2max), also known as aerobic capacity, is the maximum amount of oxygen an individual can utilize during intense exercise and is a definitive indicator of cardiorespiratory fitness. A decline in VO2max is associated with a higher risk of cardiovascular disease and all-cause mortality (12–18). The AHA reports that cardiorespiratory fitness is a better predictor of mortality than many other risk factors, such as smoking, hypertension, or hyperlipidemia. VO2max is influenced by a complex network of cardiorespiratory and metabolic systems, and maintaining good VO2max is critical for preventing cardiovascular diseases and sustaining overall health.
The triglyceride–glucose (TyG) index, a simple and cost-effective biomarker, has gained increasing attention in recent years for its potential role in assessing insulin resistance (IR) and metabolic disorders. Derived from the product of fasting triglycerides and glucose levels, the TyG index provides valuable insights into the underlying metabolic state of an individual, making it a useful tool in clinical settings. Numerous studies have demonstrated that elevated TyG values are closely associated with an increased risk of CVD, such as hypertension, coronary artery disease, and stroke (19–22). The simplicity of its calculation and strong correlation with IR and CVD make the TyG index a promising marker for the early detection and management of metabolic syndrome.
Despite the extensive research on the TyG and VO2max individually, the relationship between the two remains unclear. Therefore, the ultimate goal of this study is to explore the association between the TyG index and VO2max.
The data utilized and analyzed in this study were obtained from the National Health and Nutrition Examination Survey (NHANES) database, covering three cycles from 1999 to 2004. NHANES is a continuous survey that employs a multistage, stratified probability sampling design to select a representative sample of the US population, aiming to assess the health and nutritional status of non-institutionalized Americans. The program has been approved by the National Center for Health Statistics (NCHS) Ethics Review Board. Data collection is supervised by the NCHS and adheres to strict ethical standards with informed consent obtained from all participants. The NHANES data set includes various health indicators such as demographic characteristics, physical examination results, laboratory findings, and dietary habits. The exclusion criteria for this study included (1) incomplete treadmill aerobic exercise for VO2max testing, (2) missing or unavailable fasting glucose data, (3) missing or unavailable fasting triglyceride data, and (4) fasting glucose weight of zero or missing.
Only participants aged 12–49 years were eligible for the cardiovascular fitness (CVF) examination, making the study population representative of the young and middle-aged population in the United States. During the CVF examination, participants were typically instructed to perform aerobic exercise on a treadmill to measure VO2max. NHANES utilized enzymatic assays to measure fasting plasma triglyceride (TG) and fasting plasma glucose (FPG) levels from blood samples analyzed using an automatic analyzer. These samples were collected from individuals who had fasted for at least 8 h but no more than 24 h. The TyG index was calculated using the formula Ln[TG (mg/dl) × FPG (mg/dl)/2] (23).
Various potential covariates were assessed based on clinical practice and literature review (24, 25), including age, sex/gender, race/ethnicity, smoking status, alcohol consumption, hypertension, diabetes, body mass index (BMI), waist circumference, glycated hemoglobin hemoglobin A1c (Ghb), C-reactive protein (CRP), albumin (ALB), creatinine (CR), white blood cell count (WBC), red blood cell count (RBC), hemoglobin (HGB), low-density lipoprotein cholesterol (LDL-C), high-density lipoprotein cholesterol (HDL-C), TG, and total cholesterol (TC). Ethnicity was categorized into non-Hispanic White, non-Hispanic Black, Mexican American, and other races. Smoking status was divided into non-smokers (<100 cigarettes smoked) and smokers (≥100 cigarettes smoked). Alcohol consumption was self-reported and categorized as non-drinkers (<12 drinks in a lifetime) and drinkers (at least 12 drinks in a year or at least 12 drinks in the past year). Hypertension and diabetes were defined based on self-reported diagnosis of the condition.
Age, gender, and ethnicity were acquired from demographic data. BMI, waist circumference, systolic blood pressure (SBP), and diastolic blood pressure (DBP) were acquired from examination data. CRP, HGB, LDL, HDL, TC, Ghb, FPG, and TG were acquired from laboratory data.
Our analysis accounted for the complex sampling design and fasting plasma glucose sample weights. For the combined NHANES 1999–2000 and 2001–2002 datasets, we used the Fasting Subsample 4 Year MEC Weight (WTSAF4YR). For NHANES 2003–2004, we used the Fasting Subsample 2 Year MEC Weight (WTSAF2YR). Sampling weights were calculated as follows: weights were set for the 1999–2002 period at 2/3 × WTSAF4YR and for the 2003–2004 period at 1/3 × WTSAF2YR. Histogram distribution, or Q–Q plot, or the Kolmogorov–Smirnov test was used to determine whether variables were normally distributed. Categorical data are presented as unweighted counts and frequencies (%), while continuous variables are presented as medians and interquartile ranges (IQR) from the 25th to the 75th percentiles. Differences between multiple groups of continuous variables were assessed using the one-way ANOVA test (for normal distribution) or Kruskal–Wallis H test (for skewed distribution) to compare differences among groups. Chi-squared tests were employed to assess significant differences between categorical variables.
A weighted multivariate linear regression analysis was employed to determine the association between the TyG index and VO2max, with results expressed as beta (β) and 95% confidence intervals (CIs). We constructed four models: the unadjusted model; Model 1 adjusted for demographic variables, including age, gender, and ethnicity; Model 2 adjusted for smoking status, alcohol consumption, hypertension, diabetes, BMI, and waist circumference; and Model 3 adjusted for Ghb, CRP, ALB, CR, WBC, RBC, and HGB. In addition to using the TyG index as a continuous variable, we also converted TyG into a categorical variable according to the four quartiles and calculated the p-value for trend to verify the results of the TyG index as a continuous variable and to examine the possibility of non-linearity.
The weighted restricted cubic splines (RCS) with unadjusted and adjusted covariates in Model 3 were employed to further explore the linearity relationship between the TyG index and VO2max. Subgroup and sensitivity analyses were conducted to ensure the robustness of our results. We performed interaction and subgroup analyses using linear regression models stratified by gender, ethnicity, smoking status, alcohol consumption, and obesity. The non-Hispanic White population was utilized for the sensitivity study. Linear regression models and RCS were also performed in sensitivity analyses. Mediation analysis was conducted to investigate whether certain variables acted as mediators in the association between the TyG index and VO2max.
All statistical analyses in this study were performed using R Statistical Software (Version 4.4.1, http://www.R-project.org) and the Free Statistics analysis platform (Version 1.9.2; Beijing, China; http://www.clinicalscientists.cn/freestatistics). Descriptive statistics were computed for all participants, and statistical significance was defined as a two-sided p-value of <0.05.
This study utilized data from three NHANES cycles, 1999–2000, 2001–2002, and 2003–2004, with a total of 31,126 participants completing the survey. We excluded participants with missing or unavailable data on VO2max (n = 22,802), fasting glucose data (n = 4,463), and triglyceride data (n = 48). In addition, participants without data on fasting glucose sample weights (n = 242) were excluded. Consequently, the final sample consisted of 3,571 participants (Figure 1). These participants represent the population aged 12–49 years old in the United States. The study population had a median age of 18 (IQR: 15–30) years, with 1,900 (53.21%) male participants and 1,230 (34.44%) non-Hispanic White participants (Table 1).
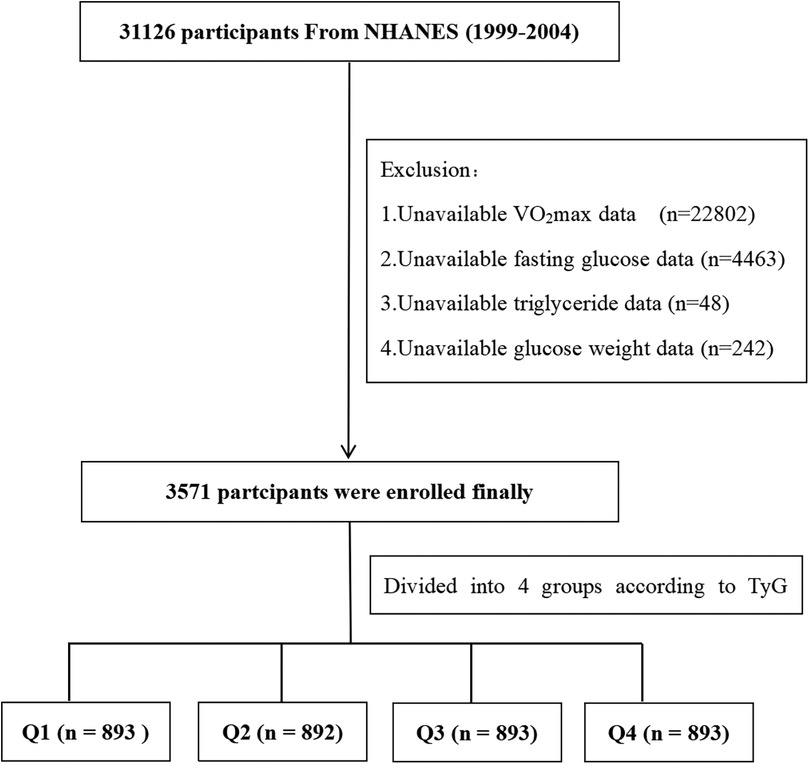
Figure 1. Flow diagram of the screening and enrollment of study participants.

Table 1. Baseline characteristics of the study population according to the quartiles of the TyG index.
Table 1 presents the baseline characteristics of participants by quantiles of the TyG index: Q1 (n = 893, the lowest quartile), 6.750 ≤ TyG index ≤ 7.887; Q2 (n = 892, the second quartile), 7.887 < TyG index ≤ 8.216; Q3 (n = 893, the upper quartile), 8.216 < TyG index ≤ 8.672; and Q4 (n = 893, the highest quartile), 8.672 < TyG index ≤ 12.481). Compared with participants in the Q1 group, those in the Q4 group were generally elderly, predominantly male, more likely to be Mexican American participants, and had higher BMI, waist circumference, SBP, DBP, CRP, HGB, LDL, HDL, C-peptide, FPG, and TG and lower VO2max levels (p < 0.01).
The univariable analysis demonstrated that age, sex, ethnicity, alcohol consumption, hypertension, diabetes, Ghb, CRP, ALB, CR, WBC, RBC, HGB, and TyG were all associated with VO2max (results are shown in Supplementary Table S1).
In weighted multivariable linear regression analyses examining the association between TyG index and VO2max, with adjustment for potential confounders (Table 2, Model 3), the TyG index expressed as a continuous variable (increasing per 1 unit) was associated with decreased VO2max [β = −1.24, 95% CI (−1.97, −0.51), p = 0.002]. An inverse relationship between the TyG index with VO2max was also observed after adjusting for potential confounders when the TyG index was expressed as a four quartile-categorized variable. Compared to Q1, the adjusted βs in Q2, Q3, and Q4 were −0.50 (95% CI:−1.91, 0.90, p = 0.465), −1.59 (95% CI: −2.62, −0.56, p = 0.004), and −1.91 (95% CI: −3.24, −0.57, p < 0.007), respectively (Table 2, Model 3).
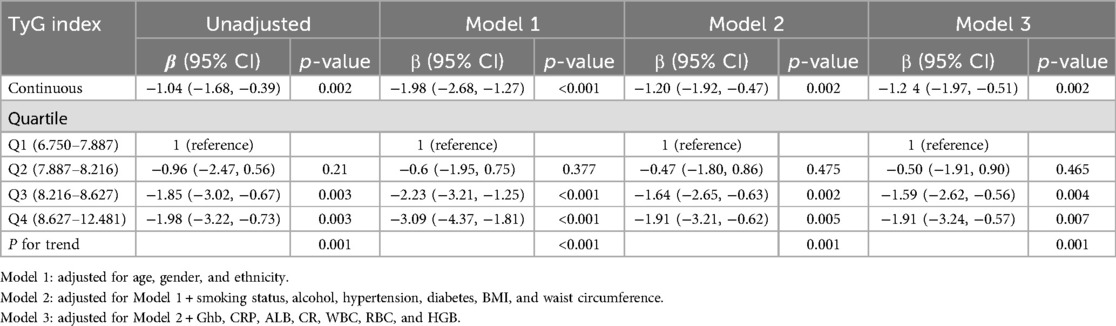
Table 2. Association between the TyG index and VO2max (weighted).
Restricted cubic splines (RCS) with adjusted multivariable suggest a straightforward negative linear relationship between the TyG index and VO2max (Figure 2, p for non-linearity = 0.247.) As the level of the TyG index increases, the value of VO2max shows a downward trend. The solid lines indicate the multivariate-adjusted hazard ratios, and the dashed lines indicate the 95% CIs derived from restricted cubic spline regression. The linear regression was adjusted for age, gender, ethnicity, smoking status, alcohol consumption, hypertension, diabetes, BMI, waist circumference, Ghb, CRP, ALB, CR, WBC, RBC, and HGB.
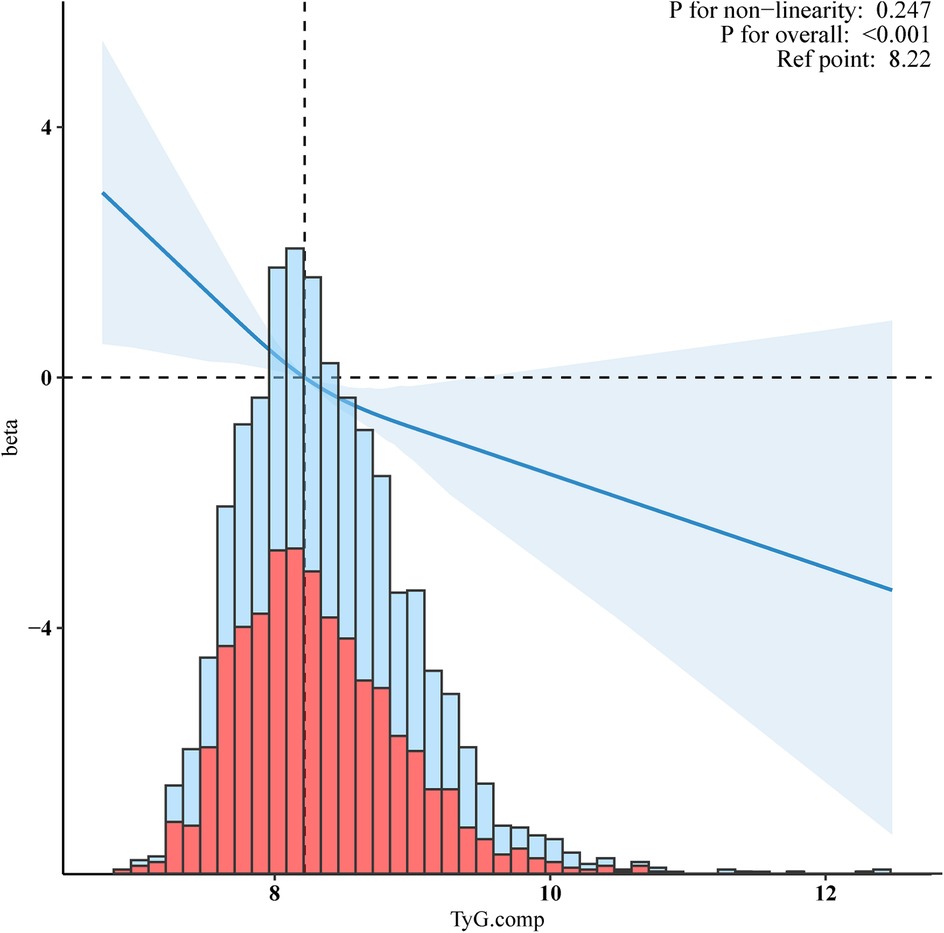
Figure 2. Negative linear relationship between the TyG index and VO2max. Adjusted for age, gender, ethnicity, smoking status, alcohol, hypertension, diabetes, BMI, waist circumference, Ghb, CRP, ALB, CR, WBC, RBC, and HGB.
To further investigate the association between the TyG index and VO2max across a diverse population, we stratified the population based on gender, ethnicity, smoking status, alcohol consumption, and obesity. Due to a limited number of cases of CVD, stroke, chronic kidney disease (CKD), and cancer, these factors were not considered as subgroup criteria. Similarly, since only participants aged 12–49 years were eligible for the CVF examination, making the study population representative of young and middle-aged adults in the United States, age was also not considered as a subgroup criterion. Weighted multivariable linear regression analysis presented no significant interactions between ethnicity, smoking status, alcohol consumption, obesity, and the TyG index for VO2max (all p for interaction ≥ 0.05, Figure 3). while a significant interaction (p = 0.007, Figure 3) between gender and the TyG index for VO2max was noted.
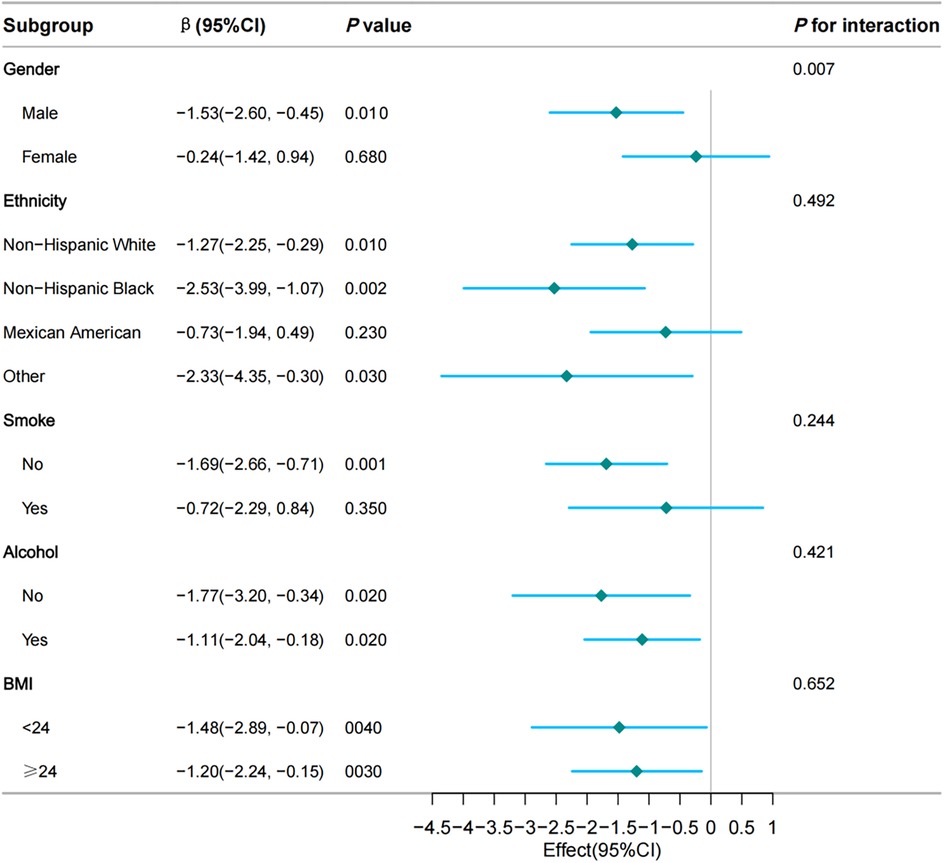
Figure 3. Subgroup and interaction analyses of the TyG index and VO2max. Multivariable weighted logistic model adjusted for hypertension, diabetes, waist circumference, Ghb, CRP, ALB, CR, WBC, RBC, and HGB.
The basic characteristics of the non-Hispanic White population and the results of sensitivity analyses are presented in Table 3. Compared to Q1, the adjusted β in Q4 was −0.77 (95% CI:−1.24, −0.3, p = 0.001). The TyG index, expressed as a continuous variable, was also inversely associated with VO2max (β = −1.44, 95%CI:−2.39, −0.4, p = 0.003). Figure 4 shows the RCS indicating the negative linear relationship between the TyG index and VO2max (p for non-linearity = 0.247).
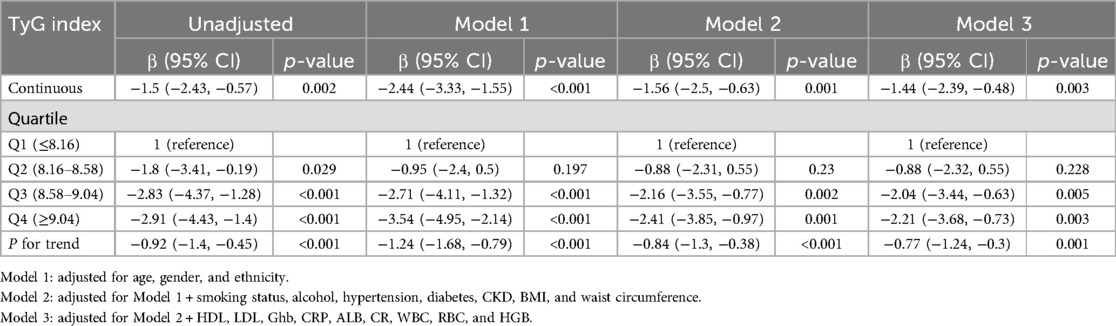
Table 3. Sensitivity analysis of the association between the TyG index and VO2max (unweighted).
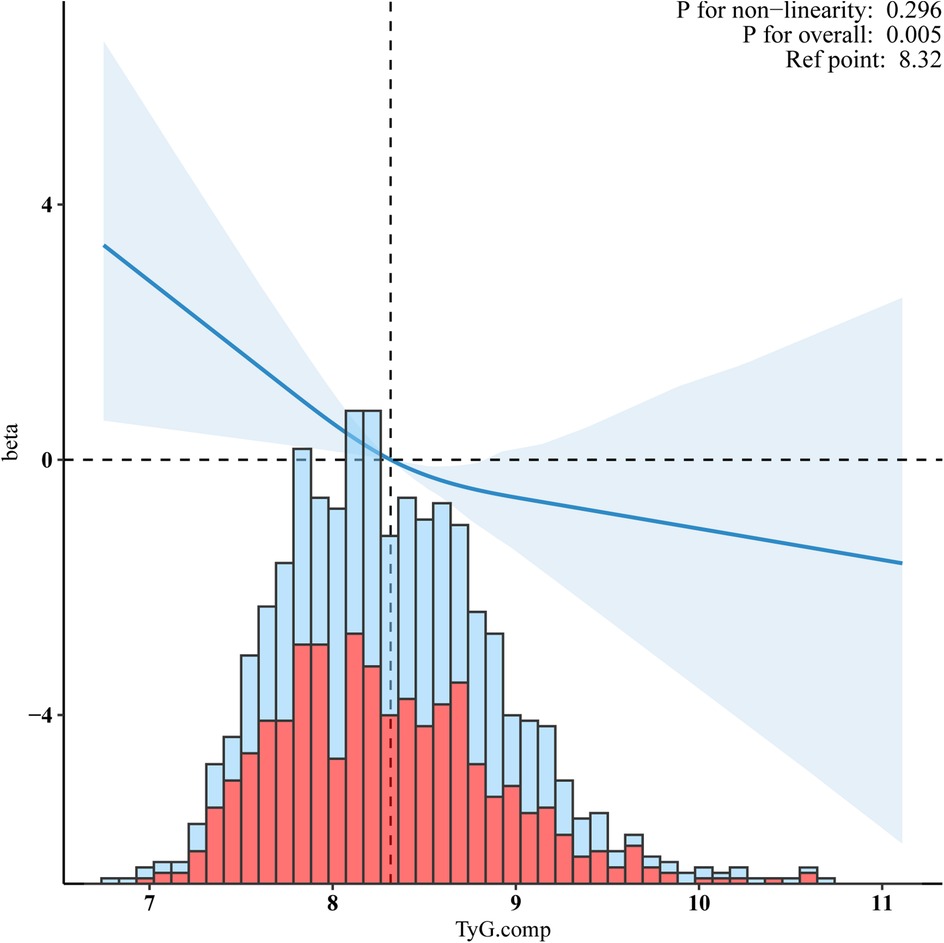
Figure 4. Sensitivity analyses for a negative linear relationship between the TyG index and VO2max in the non-Hispanic white population. Adjusted for age, gender, ethnicity, smoking status, alcohol, hypertension, diabetes, BMI, waist circumference, Ghb, CRP, ALB, CR, WBC, RBC, and HGB.
DBP, WBC, CRP, and HGB were identified as mediating variables to explore their influence on the association between the TyG index and VO2max. The direct effect of the TyG index was −1.467 (−2.019, −0.948), with a total effect of −1.813 (−2.377, −1.286). The mediation effect of DBP, WBC, and CRP was −0.389 (−0.526, −0.268), −0.308 (−0.432, −0.177), and −0.252 (−0.453, −0.135), respectively. HGB was found to exert a suppressing effect on the relationship between the TyG index and VO2max, with a value of 1.469 (1.252, 1.702). The p-values for all the above effects were <0.05 (Figure 5).
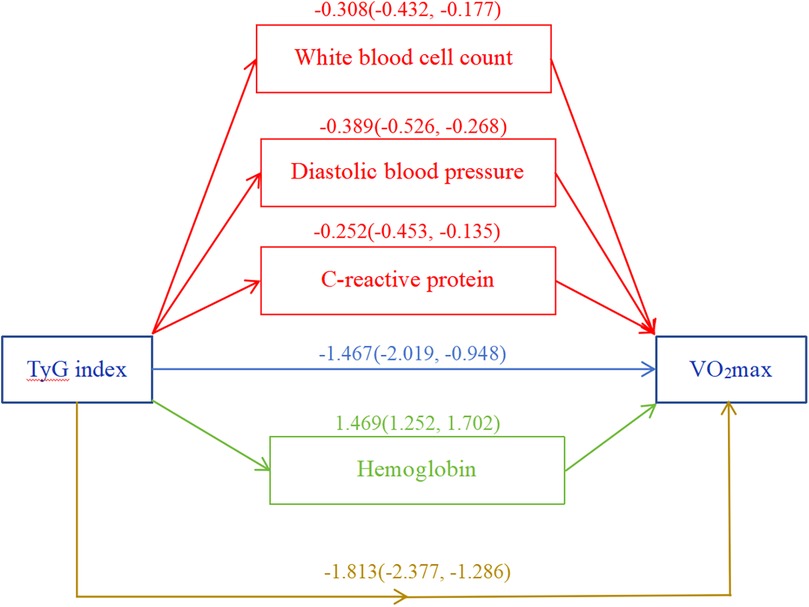
Figure 5. Mediation analysis. White blood cell count, diastolic blood pressure, C-reactive protein, and hemoglobin were included as covariate variables. *p < 0.05.
In this large population-based US retrospective cross-sectional study, we revealed a negative linear association between the TyG index and VO2max in a young and middle-aged population for the first time. Similar patterns of association were observed for subsequent subgroup and sensitivity analyses. Additionally, we found a significant interaction in the relationship between the TyG index and VO2max in females. Notably, DBP, WBC, CRP, and HGB were found to mediate the relationship between TyG index and VO2max.
In this study, we did not find a statistically significant association between the TyG index and all-cause or cardiovascular mortality. This may be due to our study population only consisting primarily of young and middle-aged individuals (aged 12–49 years), as this is the only group that completed the VO2max test, with the majority not having concurrent cardiovascular or other underlying conditions. In addition, it was noteworthy that our study was conducted 20 years ago (1999–2004). Thus, further long-term prospective studies are needed to track the impact of the TyG index on VO2max decline and subsequent cardiovascular events in this population.
Previous studies have shown that the TyG index is associated with coronary artery calcification, subclinical atherosclerosis, and arterial stiffness (20, 21, 26, 27), indicating that the TyG index is closely related to the incidence of CVD. A decline in VO2max is associated with a higher risk of cardiovascular disease and all-cause mortality, which serves as an important indicator for cardiovascular health stratification (13–17). To our knowledge, previous studies have primarily focused on the relationship between TyG and CVF which was defined through VO2max (24), but no studies have directly investigated the correlation between TyG and VO2max. Additionally, most studies on the TyG index and CVD have primarily focused on elderly individuals (19, 20), who have a high prevalence of chronic underlying diseases, rather than on young and middle-aged populations who have a lower prevalence of chronic underlying diseases and are generally healthier. Therefore, we chose to directly explore the relationship between TyG and VO2max in a young and middle-aged population, rather than CVF. Our current study found a significant adverse linear relationship between TyG and VO2max in this population, where individuals with higher TyG index values are more likely to experience a decline in VO2max. The results from both subgroup and sensitivity analyses remained robust and further confirmed the relationship.
A meta-analysis of 87 studies indicated that females with metabolic syndrome have a higher risk of CVD than males (28). Additionally, among individuals with impaired glucose tolerance, females have a higher risk of coronary heart disease than males (29). Consequently, females are generally at a higher risk of CVD compared with males. However, in our study, we found a significant negative linear association between the TyG index and impaired CVF in males. The reason for this difference may be that most females in previous studies were elderly and were in late perimenopause or menopause, whereas our study included younger and middle-aged females who still benefit from the protective effects of estrogen. Estrogens play a vital protective role in the cardiovascular system and metabolic health (30–35). They increase HDL-C levels and decrease LDL-C levels, thereby improving the lipid profile and reducing the risk of CVD. Additionally, estrogens maintain the structural and functional integrity of vascular endothelial cells and promote vasodilation by influencing the synthesis of vasodilatory substances such as nitric oxide (NO), thereby maintaining normal vascular function and improving arterial compliance (35). This is crucial for preventing atherosclerosis and cardiovascular disease. Furthermore, estrogens improve insulin sensitivity through modulation of endothelium-dependent and calcium-dependent processes (35, 36). Through multiple mechanisms, estrogens provide broad protection for the cardiovascular system and have positive effects on metabolic health. Given the age range (12–49 years old) of our study population, females in this age group have suffecient estrogen levels to reduce insulin resistance, which may reduce insulin resistance and explain the differences in our results. This may be the reason for the significant interaction between gender and the TyG index for VO2max in our study.
The results of the intermediary analysis suggested that part of the harmful effects of the TyG index on VO2max were realized through its effects on DBP, WBC, and CRP. Simultaneously, the TyG index enhanced the oxygen transport capacity by increasing HGB, thereby enhancing VO2max. There was a lack of dedicated research exploring the correlation between the TyG index and HGB. However, earlier studies suggested that individuals with structural anomalies in HGB typically exhibited lower insulin resistance compared with those with normal HGB levels (37). This finding might have constituted a supporting element for the outcomes of our intermediary analysis. However, further research is necessary to substantiate the potential relationship between the TyG index and HGB.
Previous studies have revealed the role of the TyG index in the occurrence, development, and prognosis of CVD (38–40). To date, no study has examined VO2max in relation to the TyG index. In our study population, we confirmed the negative correlation between triglyceride–glucose index and VO2max in the context of a population-based cohort on NHANES 1999–2004 even after accounting for confounders. Moreover, these results are generally robust according to subgroups and sensitivity analyses. Although the cross-sectional nature of our study means that conclusions regarding cause–effect relationships require careful interpretation, the results obtained by mediation analysis are consistent with previously reported mechanisms and suggest that the impacts of TyG index on VO2max are, to a significant extent, indirectly mediated by DBP, WBC, and CRP. While HGB may overrule the potential inverse association between the TyG index on VO2max, future studies are needed to confirm this.
There are several limitations in the present study. An important limitation of this study is the failure to adjust for the impact of dietary factors on VO2max. Dietary habits are key factors that affect metabolic health and cardiopulmonary function. Future studies need to incorporate detailed dietary data and use multivariate analysis and mediation analysis to assess the impact of dietary factors on VO2max and metabolic health. Moreover, due to the cross-sectional design of our study, the conclusions drawn need to be validated by prospective studies. Although we performed a correlation analysis involving the TyG index with all-cause and cardiovascular mortality, we did not perform a correlation analysis of the TyG index with adverse cardiovascular events because of limitations in the NHANES database. Furthermore, our patients were all from the United States. Studies from other countries or populations are necessary to confirm our findings. Finally, an observational study is not completely the same as a randomized controlled trial (RCT). Therefore, the obtained findings may differ from the expected results of RCT and should be interpreted as being affected in life activities. Notwithstanding these limitations, our data sufficiently investigate how the TyG index is associated with VO2max, providing additional evidence on this topic.
This analysis of NHANES data has demonstrated that in young and middle-aged populations, the TyG index significantly has a negative linear relationship with VO2max, independent of confounders. Additionally, sex may exert an influence on the TyG index, with males being more susceptible to declined VO2max under similar TyG index conditions. The effect of the TyG index on VO2max was partially transmitted through DBP, WBC, and CRP, suggesting that these factors acted as mediators. While HGB may overrule the potential inverse association between TyG index on VO2max, future studies are needed to confirm this.
The original contributions presented in the study are included in the article/Supplementary Material, further inquiries can be directed to the corresponding author.
The studies involving humans were approved by the Centers for Disease Control and Prevention (CDC). The studies were conducted in accordance with the local legislation and institutional requirements. Written informed consent for participation in this study was provided by the participants' legal guardians/next of kin.
BZ: Conceptualization, Investigation, Supervision, Writing – review & editing, Data curation, Funding acquisition, Software, Writing – original draft. JL: Conceptualization, Data curation, Investigation, Resources, Supervision, Writing – original draft. DaL: Conceptualization, Data curation, Investigation, Resources, Supervision, Writing – original draft, Methodology, Project administration. YL: Data curation, Investigation, Formal analysis, Software, Validation, Writing – review & editing. PW: Data curation, Formal analysis, Investigation, Software, Methodology, Supervision, Writing – review & editing. SC: Data curation, Formal analysis, Methodology, Supervision, Conceptualization, Writing – review & editing. QR: Conceptualization, Supervision, Investigation, Validation, Writing – review & editing. DoL: Conceptualization, Data curation, Investigation, Supervision, Writing – original draft, Resources.
The authors declare that financial support was received for the research and/or publication of this article. The study was supported by the projects of Jiangmen City Science and Technology Plans (Grant No. 2023YL01012) and the China Postdoctoral Science Foundation under Grant Number 2024M761177.
We are grateful to thank all of the participants, the staff, and the other study investigators for their valuable contributions. Additionally, we are obliged to thank the Free Statistics team (Beijing, China) for providing technical assistance and practical data analysis and visualization tools.
The authors declare that the research was conducted in the absence of any commercial or financial relationships that could be construed as a potential conflict of interest.
The author(s) declare that no Generative AI was used in the creation of this manuscript.
All claims expressed in this article are solely those of the authors and do not necessarily represent those of their affiliated organizations, or those of the publisher, the editors and the reviewers. Any product that may be evaluated in this article, or claim that may be made by its manufacturer, is not guaranteed or endorsed by the publisher.
The Supplementary Material for this article can be found online at: https://www.frontiersin.org/articles/10.3389/fcvm.2025.1583614/full#supplementary-material
1. Kaminsky LA, German C, Imboden M, Ozemek C, Peterman JE, Brubaker PH. The importance of healthy lifestyle behaviors in the prevention of cardiovascular disease. Prog Cardiovasc Dis. (2022) 70:8–15. doi: 10.1016/j.pcad.2021.12.001
2. GBD 2017 Causes of Death Collaborators. Global, regional, and national age-sex-specific mortality for 282 causes of death in 195 countries and territories, 1980–2017: a systematic analysis for the Global Burden of Disease Study 2017. Lancet. (2018) 392(10159):1736–88. doi: 10.1016/S0140-6736(18)32203-7
3. Liu S, Li Y, Zeng X, Yin P, Wang L, Liu Y, et al. Burden of cardiovascular diseases in China, 1990–2016: findings from the 2016 Global Burden of Disease Study. JAMA Cardiol. (2019) 4(4):342–52. doi: 10.1001/jamacardio.2019.0295
4. Joseph P, Leong D, McKee M, Anand SS, Schwalm JD, Teo K, et al. Reducing the global burden of cardiovascular disease, part 1: the epidemiology and risk factors. Circ Res. (2017) 121(6):677–94. doi: 10.1161/CIRCRESAHA.117.308903
5. Leong DP, Joseph PG, McKee M, Anand SS, Teo KK, Schwalm JD, Yusuf S. Reducing the global burden of cardiovascular disease, part 2: prevention and treatment of cardiovascular disease. Circ Res. (2017) 121(6):695–710. doi: 10.1161/CIRCRESAHA.117.311849
6. Barquera S, Pedroza-Tobías A, Medina C, Hernández-Barrera L, Bibbins-Domingo K, Lozano R, et al. Global overview of the epidemiology of atherosclerotic cardiovascular disease. Arch Med Res. (2015) 46(5):328–38. doi: 10.1016/j.arcmed.2015.06.006
7. North BJ, Sinclair DA. The intersection between aging and cardiovascular disease. Circ Res. (2012) 110(8):1097–108. doi: 10.1161/CIRCRESAHA.111.246876
8. Paneni F, Diaz Cañestro C, Libby P, Lüscher TF, Camici GG. The aging cardiovascular system: understanding it at the cellular and clinical levels. J Am Coll Cardiol. (2017) 69(15):1952–67. doi: 10.1016/j.jacc.2017.01.064
9. Cai Y, Song W, Li J, Jing Y, Liang C, Zhang L, et al. The landscape of aging. Sci China Life Sci. (2022) 65(12):2354–454. doi: 10.1007/s11427-022-2161-3
10. Prince MJ, Wu F, Guo Y, Gutierrez Robledo LM, O'Donnell M, Sullivan R, et al. The burden of disease in older people and implications for health policy and practice. Lancet. (2015) 385(9967):549–62. doi: 10.1016/S0140-6736(14)61347-7
11. Tsao CW, Aday AW, Almarzooq ZI, Anderson CAM, Arora P, Avery CL, et al. Heart disease and stroke statistics-2023 update: a report from the American Heart Association. Circulation. (2023) 147(8):e93–e621. doi: 10.1161/CIR.0000000000001123
12. Ross R, Blair SN, Arena R, Church TS, Després JP, Franklin BA, et al. Importance of assessing cardiorespiratory fitness in clinical practice: a case for fitness as a clinical vital sign: a scientific statement from the American Heart Association. Circulation. (2016) 134(24):e653–99. doi: 10.1161/CIR.0000000000000461
13. Mandsager K, Harb S, Cremer P, Phelan D, Nissen SE, Jaber W. Association of cardiorespiratory fitness with long-term mortality among adults undergoing exercise treadmill testing. JAMA Netw Open. (2018) 1(6):e183605. doi: 10.1001/jamanetworkopen.2018.3605
14. Harb SC, Wang T, Cremer PC, Wu Y, Cho L, Menon V, et al. Associations between cardiorespiratory fitness, sex and long term mortality amongst adults undergoing exercise treadmill testing. Int J Cardiol. (2021) 342:103–7. doi: 10.1016/j.ijcard.2021.07.063
15. Al-Mallah MH, Sakr S, Al-Qunaibet A. Cardiorespiratory fitness and cardiovascular disease prevention: an update. Curr Atheroscler Rep. (2018) 20(1):1. doi: 10.1007/s11883-018-0711-4
16. Ezzatvar Y, Izquierdo M, Núñez J, Calatayud J, Ramírez-Vélez R, García-Hermoso A. Cardiorespiratory fitness measured with cardiopulmonary exercise testing and mortality in patients with cardiovascular disease: a systematic review and meta-analysis. J Sport Health Sci. (2021) 10(6):609–19. doi: 10.1016/j.jshs.2021.06.004
17. Kodama S, Saito K, Tanaka S, Maki M, Yachi Y, Asumi M, et al. Cardiorespiratory fitness as a quantitative predictor of all-cause mortality and cardiovascular events in healthy men and women: a meta-analysis. JAMA. (2009) 301(19):2024–35. doi: 10.1001/jama.2009.681
18. Mora S, Redberg RF, Cui Y, Whiteman MK, Flaws JA, Sharrett AR, et al. Ability of exercise testing to predict cardiovascular and all-cause death in asymptomatic women: a 20-year follow-up of the lipid research clinics prevalence study. JAMA. (2003) 290(12):1600–7. doi: 10.1001/jama.290.12.1600
19. Liu X, Tan Z, Huang Y, Zhao H, Liu M, Yu P, et al. Relationship between the triglyceride-glucose index and risk of cardiovascular diseases and mortality in the general population: a systematic review and meta-analysis. Cardiovasc Diabetol. (2022) 21(1):124. doi: 10.1186/s12933-022-01546-0
20. Ding X, Wang X, Wu J, Zhang M, Cui M. Triglyceride-glucose index and the incidence of atherosclerotic cardiovascular diseases: a meta-analysis of cohort studies. Cardiovasc Diabetol. (2021) 20(1):76. doi: 10.1186/s12933-021-01268-9
21. Liang S, Wang C, Zhang J, Liu Z, Bai Y, Chen Z, et al. Triglyceride-glucose index and coronary artery disease: a systematic review and meta-analysis of risk, severity, and prognosis. Cardiovasc Diabetol. (2023) 22(1):170. doi: 10.1186/s12933-023-01906-4
22. Tao LC, Xu JN, Wang TT, Hua F, Li JJ. Triglyceride-glucose index as a marker in cardiovascular diseases: landscape and limitations. Cardiovasc Diabetol. (2022) 21(1):68. doi: 10.1186/s12933-022-01511-x
23. Guerrero-Romero F, Simental-Mendía LE, González-Ortiz M, Martínez-Abundis E, Ramos-Zavala MG, Hernández-González SO, et al. The product of triglycerides and glucose, a simple measure of insulin sensitivity. Comparison with the euglycemic-hyperinsulinemic clamp. J Clin Endocrinol Metab. (2010) 95(7):3347–51. doi: 10.1210/jc.2010-0288
24. Guo D, Wu Z, Xue F, Chen S, Ran X, Zhang C, et al. Association between the triglyceride-glucose index and impaired cardiovascular fitness in non-diabetic young population. Cardiovasc Diabetol. (2024) 23(1):39. doi: 10.1186/s12933-023-02089-8
25. Mongraw-Chaffin M, Foster MC, Anderson C, Burke GL, Haq N, Kalyani RR, et al. Metabolically healthy obesity, transition to metabolic syndrome, and cardiovascular risk. J Am Coll Cardiol. (2018) 71(17):1857–65. doi: 10.1016/j.jacc.2018.02.055
26. Park K, Ahn CW, Lee SB, Kang S, Nam JS, Lee BK, et al. Elevated TyG index predicts progression of coronary artery calcification. Diabetes Care. (2019) 42(8):1569–73. doi: 10.2337/dc18-1920
27. Won KB, Park EJ, Han D, Lee JH, Choi SY, Chun EJ, et al. Triglyceride glucose index is an independent predictor for the progression of coronary artery calcification in the absence of heavy coronary artery calcification at baseline. Cardiovasc Diabetol. (2020) 19(1):34. doi: 10.1186/s12933-020-01008-5
28. Mottillo S, Filion KB, Genest J, Joseph L, Pilote L, Poirier P, et al. The metabolic syndrome and cardiovascular risk a systematic review and meta-analysis. J Am Coll Cardiol. (2010) 56(14):1113–32. doi: 10.1016/j.jacc.2010.05.034
29. Levitzky YS, Pencina MJ, D'Agostino RB, Meigs JB, Murabito JM, Vasan RS, et al. Impact of impaired fasting glucose on cardiovascular disease: the Framingham Heart Study. J Am Coll Cardiol. (2008) 51(3):264–70. doi: 10.1016/j.jacc.2007.09.038
30. Arosio B, Corbi G, Davinelli S, Giordano V, Liccardo D, Rapacciuolo A, et al. Sex differences in cardiovascular diseases: a matter of estrogens, ceramides, and sphingosine 1-Phosphate. Int J Mol Sci. (2022) 23(7):4009. doi: 10.3390/ijms23074009
31. Crescioli C. The role of estrogens and vitamin D in cardiomyocyte protection: a female perspective. Biomolecules. (2021) 11(12):1815. doi: 10.3390/biom11121815
32. Shahbazian M, Jafarynezhad F, Yadeghari M, Farhadi Z, Samani SL, Esmailidehaj M, et al. The effects of G protein-coupled receptor 30 (GPR30) on cardiac glucose metabolism in diabetic ovariectomized female rats. J Basic Clin Physiol Pharmacol. (2023) 34(2):205–13. doi: 10.1515/jbcpp-2021-0374
33. Smith PJ, Ornatsky O, Stewart DJ, Picard P, Dawood F, Wen WH, et al. Effects of estrogen replacement on infarct size, cardiac remodeling, and the endothelin system after myocardial infarction in ovariectomized rats. Circulation. (2000) 102(24):2983–9. doi: 10.1161/01.CIR.102.24.2983
34. da Silva JS, Montagnoli TL, Rocha BS, Tacco M, Marinho S, Zapata-Sudo G. Estrogen receptors: therapeutic perspectives for the treatment of cardiac dysfunction after myocardial infarction. Int J Mol Sci. (2021) 22(2):525. doi: 10.3390/ijms22020525
35. Gagliano-Jucá T, Basaria S. Testosterone replacement therapy and cardiovascular risk. Nat Rev Cardiol. (2019) 16(9):555–74. doi: 10.1038/s41569-019-0211-4
36. Tiano JP, Mauvais-Jarvis F. Importance of oestrogen receptors to preserve functional β-cell mass in diabetes. Nat Rev Endocrinol. (2012) 8(6):342–51. doi: 10.1038/nrendo.2011.242
37. Yavropoulou MP, Pikilidou M, Pantelidou D, Tsalikakis DG, Mousiolis A, Chalkia P, et al. Insulin secretion and resistance in normoglycemic patients with sickle cell disease. Hemoglobin. (2017) 41(1):6–11. doi: 10.1080/03630269.2017.1295983
38. Wang L, Cong HL, Zhang JX, Hu YC, Wei A, Zhang YY, et al. Triglyceride-glucose index predicts adverse cardiovascular events in patients with diabetes and acute coronary syndrome. Cardiovasc Diabetol. (2020) 19(1):80. doi: 10.1186/s12933-020-01054-z
39. Wang X, Xu W, Song Q, Zhao Z, Meng X, Xia C, et al. Association between the triglyceride-glucose index and severity of coronary artery disease. Cardiovasc Diabetol. (2022) 21(1):168. doi: 10.1186/s12933-022-01606-5
Keywords: TyG index, VO2max, cross-sectional study, NHANES, adverse
Citation: Zhang B, Lai J, Li D, Li Y, Wang P, Cai S, Ren Q and Li D (2025) Inverse association between triglyceride–glucose index and maximal oxygen uptake in US young and middle-aged population: a cross-sectional study. Front. Cardiovasc. Med. 12:1583614. doi: 10.3389/fcvm.2025.1583614
Received: 26 February 2025; Accepted: 11 March 2025;
Published: 9 April 2025.
Edited by:
Ji Bihl, Marshall University, United StatesReviewed by:
Yixing Huang, Sun Yat-sen University, ChinaCopyright: © 2025 Zhang, Lai, Li, Li, Wang, Cai, Ren and Li. This is an open-access article distributed under the terms of the Creative Commons Attribution License (CC BY). The use, distribution or reproduction in other forums is permitted, provided the original author(s) and the copyright owner(s) are credited and that the original publication in this journal is cited, in accordance with accepted academic practice. No use, distribution or reproduction is permitted which does not comply with these terms.
*Correspondence: Shangan Cai, Y2Fpc2hhbmdhbjIwQDEyNi5jb20=; Qiang Ren, Y3F1bXNxaWFuZ0AxMjYuY29t; Dong Li, eWl6aGl4aWFvZG9uZ0AxNjMuY29t
†These authors have contributed equally to this work
Disclaimer: All claims expressed in this article are solely those of the authors and do not necessarily represent those of their affiliated organizations, or those of the publisher, the editors and the reviewers. Any product that may be evaluated in this article or claim that may be made by its manufacturer is not guaranteed or endorsed by the publisher.
Research integrity at Frontiers
Learn more about the work of our research integrity team to safeguard the quality of each article we publish.