
95% of researchers rate our articles as excellent or good
Learn more about the work of our research integrity team to safeguard the quality of each article we publish.
Find out more
ORIGINAL RESEARCH article
Front. Cardiovasc. Med. , 24 January 2025
Sec. Coronary Artery Disease
Volume 12 - 2025 | https://doi.org/10.3389/fcvm.2025.1444323
 Qingqing Lin1,2,†Wenxiang Zhao2,3,†Hailin Zhang2,3Wenhao Chen4Sheng Lian4Qinyun Ruan1,2Zhaoyang Qu1,2Yimin Lin1,2Dajun Chai2,3,5,6*
 Xiaoyan Lin1,2,5,6*
Background: Early prediction of heart failure (HF) after acute myocardial infarction (AMI) is essential for personalized treatment. We aimed to use interpretable machine learning (ML) methods to develop a risk prediction model for HF in AMI patients.
Methods: We retrospectively included patients initially with AMI who received percutaneous coronary intervention (PCI) in our hospital from November 2016 to February 2020. The primary endpoint was the occurrence of HF within 3 years after operation. For developing a predictive model for HF risk in AMI patients, the least absolute shrinkage and selection operator (LASSO) Regression was used to feature selection, and four ML algorithms including Random Forest (RF), Extreme Gradient Boost (XGBoost), Support Vector Machine (SVM), and Logistic Regression (LR) were employed to develop the model on the training set. The performance evaluation of the prediction model was carried out on the training set and the testing set, utilizing metrics including AUC (Area under the receiver operating characteristic curve), calibration plot, and decision curve analysis (DCA). In addition, we used the Shapley Additive Explanations (SHAP) value to determine the importance of the selected features and interpret the optimal model.
Results: A total of 1220 AMI patients were included and 244 (20%) patients developed HF during follow-up. Among the four evaluated ML models, the XGBoost model exhibited exceptional accuracy, with an AUC value of 0.922. The SHAP method showed that left ventricular ejection fraction (LVEF), left ventricular end-systolic diameter (LVDs) and lactate dehydrogenase (LDH) were identified as the three most important characteristics to predict HF risk in AMI patients. Individual risk assessment was performed using SHAP plots and waterfall plot analysis.
Conclusions: Our research demonstrates the potential of ML methods in the early prediction of HF risk in AMI patients. Furthermore, it enhances the interpretability of the XGBoost model through SHAP analysis to guide clinical decision-making.
Despite the progress in percutaneous coronary intervention (PCI), myocardial infarction remained a critical condition with high mortality and morbidity (1). Heart failure (HF) after acute myocardial infarction (AMI) was the main cause of increased mortality in patients with AMI (2). According to the research report, HF after AMI increased the risk of death of patients by 3–4 times (3). Therefore, early identification of the risk of HF after myocardial infarction and the implementation of personalized treatment can result in a reduction in mortality and an enhancement of quality of life for patients.
Currently, predictive models for evaluating the prognosis of AMI patients were primarily constructed using logistic regression (LR) methods. Commonly risk scoring systems, such as the Thrombolysis in Myocardial Infarction (TIMI) Risk Score (4) and the Global Registry of Acute Coronary Events (GRACE) Risk Score (5), However, these prognostic models had some limitations (6). First, these systems rely only on traditional risk factors, such as age, smoking, hypertension, and diabetes, these systems relied only on traditional risk factors, such as age, smoking, hypertension, and diabetes, and did not include key prognostic indicators such as laboratory data and echocardiographic parameters (7, 8), which might not adequately reflect the multiple and complex pathophysiological processes that lead to the development and progression of AMI (9). Additionally, these models were mainly used to predict mortality, and their accuracy in predicting heart failure was limited.
Machine learning (ML) models have been shown to improve risk prediction in various cardiovascular disease (10, 11) Through simulating human learning activities, ML automatically obtained information from big clinical data for learning (12, 13). In patients with AMI, utilization of data-driven models to determine the risk of HF has been attempted, Li et al. successfully developed an ML model for predicting the risk of HF after AMI (14), but their study was limited to clinical tests and did not include imaging, and other findings. In addition, the inherent “black box” nature of ML algorithms makes their internal prediction process difficult to interpret, limiting practical applications (15). Therefore, our study introduced the Shapley Additive Explanations (SHAP) method, a game theory-based interpretable ML method developed by Lundberg and Le (16). This method can elucidate the complex relationship between features and predictions. Compared to other explanatory methods mentioned in previous literature, SHAP offered significant advantages in interpretability and visualization, thereby enabling a more comprehensive understanding and interpretation of complex models (17).
Therefore, this study aimed to establish and validate an interpretable ML model for predicting the risk of HF in AMI patients, and used the SHAP method to visualize how the ML model makes decisions. This effective computer-assisted approach can assist frontline clinicians in the early identification and intervention of HF occurrences.
We retrospectively included patients diagnosed with AMI who underwent PCI at the First Affiliated Hospital of Fujian Medical University from November 2016 to February 2020. The inclusion criteria for AMI patients were: (a) age >18 years; (b) according to the current diagnostic guidelines for AMI, the first diagnosis on admission included clinical symptoms, typical changes in the electrocardiogram, and elevated cardiac biomarkers (18), (c) without a history of HF. Patients meeting any of the following exclusion criteria were excluded: history of PCI or coronary artery bypass graft surgery; death during follow-up; moderate to severe valvular heart disease; severe immunological disorders; malignant tumors combined with malignant hematological diseases; severe infections; patients with more than 20% missing data or lost to follow-up.
According to relevant studies and clinical availability, we collected 45 variables related to the risk of HF from electronic medical records, including baseline demographics, clinical comorbidities, laboratory tests, echocardiographic parameters, and angiographic findings (Table 1). All variables were collected within 24 h of admission and immediately before PCI. As some patients underwent emergency PCI, the echocardiography records included data both before and after the procedure.
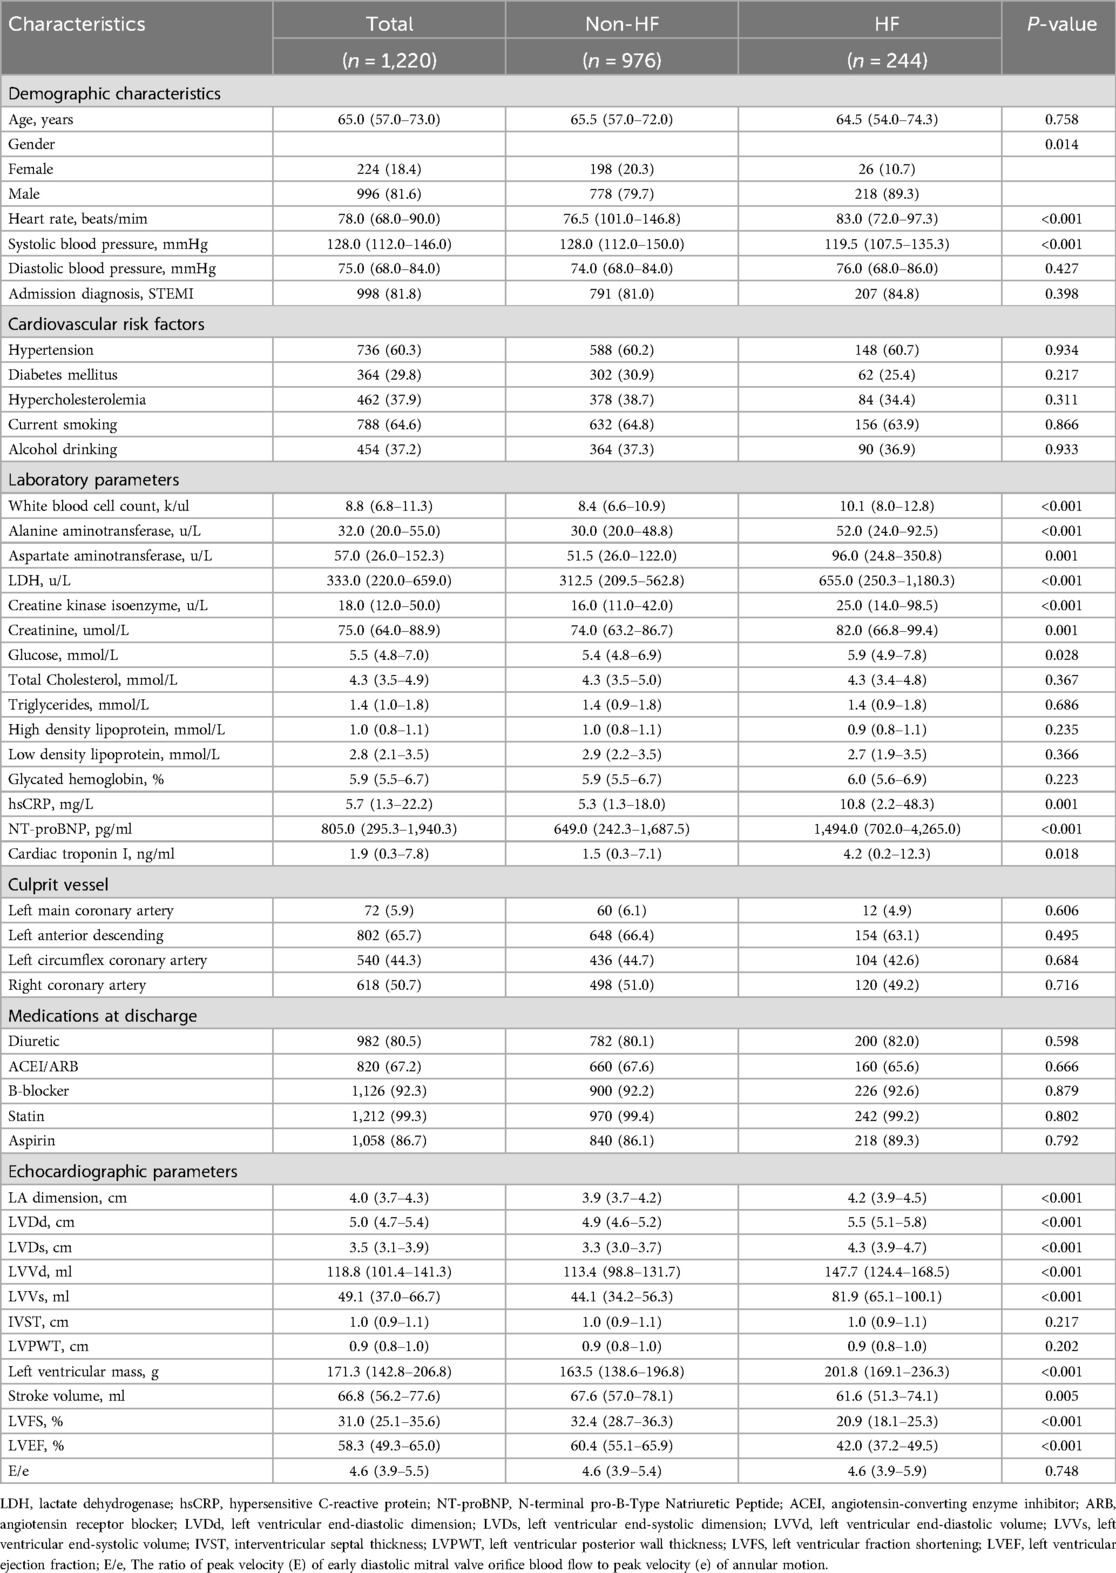
Table 1. Baseline clinical characteristics of the study sample.
The primary endpoint was the development of new HF events (New York Heart Association HF classification from II to IV), including AMI patients who developed HF during hospitalization and within the 3-year follow-up period. Data on each patient were obtained from electronic medical records and then verified through outpatient follow-up and telephone calls. Follow-up ended on 20 March 2023. This study was approved by the Institutional Review Committee of the First Affiliated Hospital of Fujian Medical University [No: MRCTA and ECFAH of FMU (2021)072; March 4, 2021]. Due to the retrospective observational design, the requirement for informed consent was eliminated.
The dataset was randomly divided into a training set (70%, N = 854) and a testing set (30%, N = 366). To enhance prediction accuracy and interpretability, we employed the least absolute shrinkage and selection operator (LASSO) regression to select key features from the training set (19). LASSO is a regression method designed for high-dimensional data. It introduces a penalty term to the least squares method, compressing some regression coefficients to zero, which achieves variable selection and improves the model's generalization capability (20). In this study, we used the “glmnet” package in R to perform LASSO regression and optimal lambda parameters were determined using 10-fold cross-validation, with the Lambda.1se value corresponding to the minimum cross-validation error selected as the model's optimal value. The count of variables with non-zero regression coefficients at this optimal value was conducted.
Four ML models were developed using the training sets, including random forest (RF), extreme gradient boosting (XGBoost), support vector machine (SVM), and LR classifiers. All continuous variables were normalized to a distribution with a mean of 0 and a standard deviation of 1. At the same time, to address the impact of data imbalance, we adopted the Synthetic Minority Over Sampling Technique (SMOTE) to improve the final predictive performance of the model (21).
In addition, we used several evaluation metrics on the testing set to assess the performance of different ML models, including the area under the receiver operating characteristic curve (AUC), accuracy, sensitivity, specificity, precision, recall, and F1 score. Calibration curves were used to evaluate calibration capability, and decision curve analysis (DCA) was used to evaluate clinical applicability.
When applying ML predictive models to clinical decision-making, it is crucial to understand how the model predicts individual risk. Therefore, we utilized the SHAP method to visually interpret the optimal mode (22) and to observe the contribution of features to the model's output at the individual level. By randomly selecting one patient who did not develop HF during follow-up and another who did, we evaluated the contribution of features to individual predictions, providing a tailored risk assessment for each patient.
Statistical R software (version 3.6.3) and Python software (version 3.7.0) were used for data analysis, model development, and validation. Continuous variables were represented as the median (p25, p75), whereas categorical variables were represented as numbers (n) and proportions (%). Baseline characteristics of groups were compared using the Wilcoxon rank-sum test for continuous variables and the chi-square test for categorical variables, considering P < 0.05 as statistically significant.
The screening process is illustrated in Figure 1. According to the inclusion and exclusion criteria, this study included 1,220 patients with AMI. During the follow-up period, a total of 244 patients (20%) developed HF. Differences in baseline characteristics are summarized in Table 1. Compared to the Non-HF group, the HF group had a higher proportion of male patients (P = 0.014), higher heart rates (P < 0.001), and lower systolic blood pressure (P < 0.001). Baseline levels of white blood cell count, alanine aminotransferase, aspartate aminotransferase, lactate dehydrogenase (LDH), creatine kinase isoenzyme (CK-MB), creatinine, glucose, hypersensitive C-reactive protein (hsCRP), N-terminal pro-B-Type Natriuretic Peptide (NT-proBNP), and cardiac troponin I were significantly elevated in the HF group compared to the Non-HF group (P < 0.05). Additionally, the HF group had greater left heart size, left ventricular volume, and left ventricular mass at baseline, whereas stroke volume, left ventricular short-axis shortening rate, left ventricular ejection fraction (LVEF), The ratio of peak velocity (E) of early diastolic mitral valve orifice blood flow to peak velocity (e) of annular motion were lower (P < 0.05). The specific baseline data between the training and testing sets were shown in Table 2, with no significant differences between the two groups (P > 0.05).
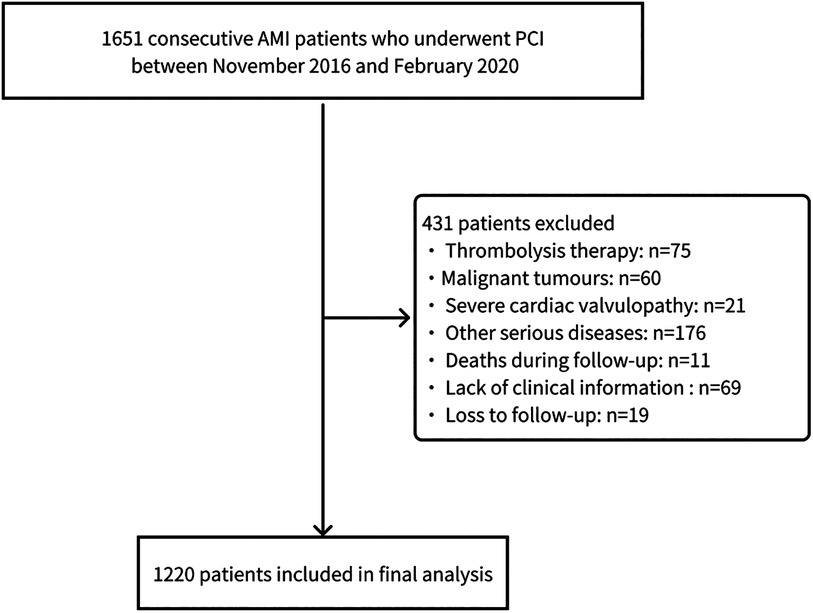
Figure 1. Patient selection flowchart.
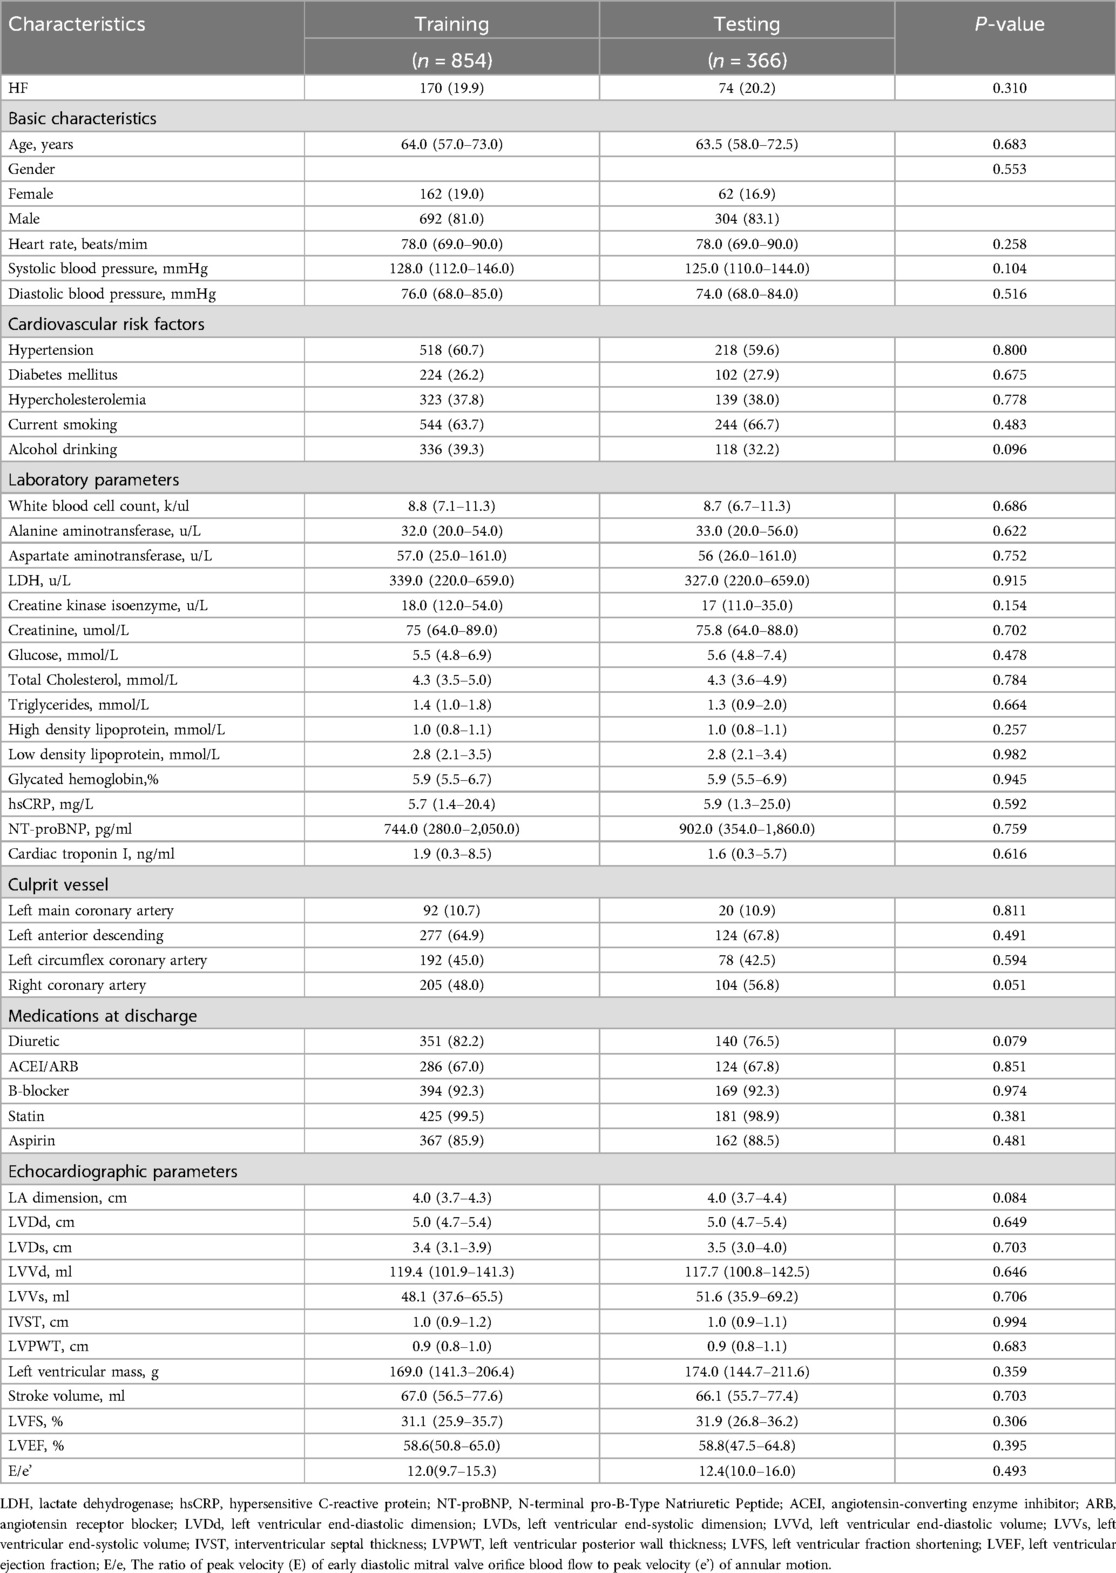
Table 2. Patient characteristics in training and testing sets.
In this study, six features with non-zero regression coefficients were selected to construct predictive models through LASSO feature selection analysis (Figures 2A,B), such as LDH, CK-MB, hsCRP, NT-proBNP, LVEF and left ventricular end-systolic dimension (LVDs). In addition, the correlation between these features was illustrated by a heatmap based on the matrix of correlation coefficients (Figure 2C). All correlation coefficients were below 0.80, indicating that there was no serious collinearity among the features.
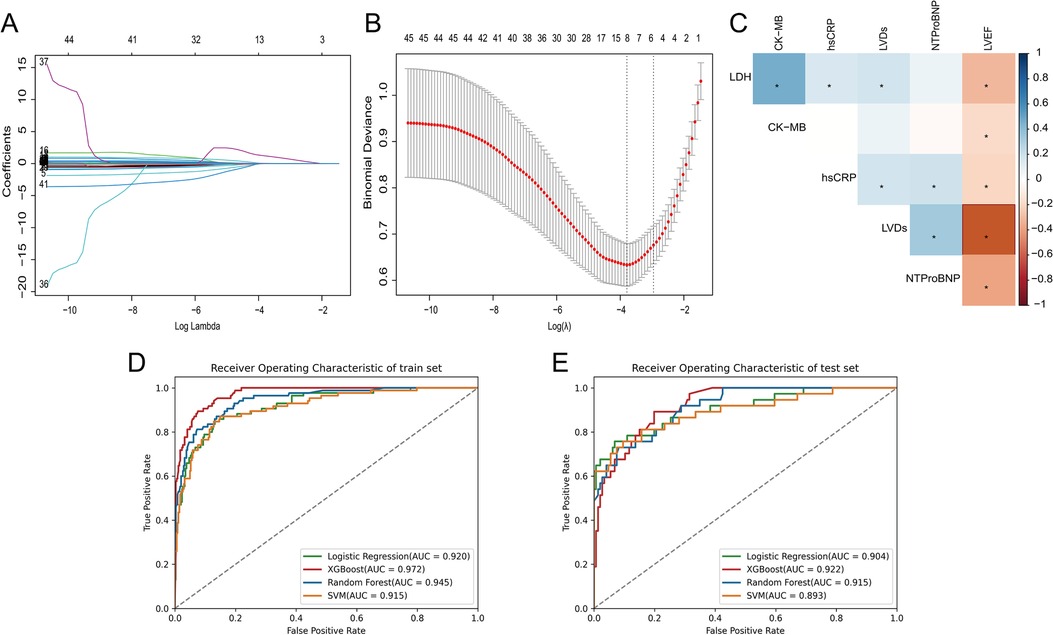
Figure 2. (A) The LASSO coefficient profiles of all variables, (B) selection of appropriate parameters, (C) correlation coefficients between clinical characteristics, (D) ROC curves of ML models in training set, (E) ROC curves of ML models in testing set.
We used four ML models, RF, XGBoost, SVM, and LR, combined with the above six features to predict the risk of HF after AMI. Figures 2D,E and Table 3 describe the performance of these predictive models, with results indicating that the XGBoost model exhibits better discriminative ability. Compared to other ML models, the XGBoost model exhibited the greatest AUC on both the training and testing set. Although the XGBoost model was slightly lower than the LR model in specificity and F1 score in the testing set, it still outperformed the other models in other performance metrics.
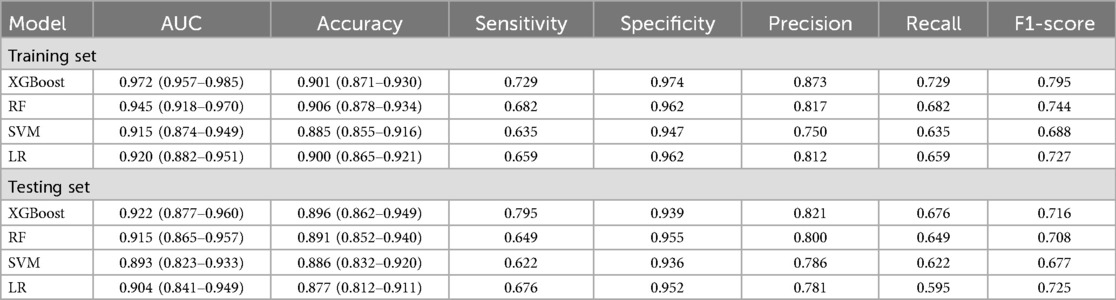
Table 3. Performance comparison of the ML models in training and testing sets.
The discriminative ability of the models in predicting HF after AMI was further analyzed by plotting the density curves (Figures 3A–D). The results showed that the XGBoost model had the smallest overlap and a large discriminative area, followed by LR and RF model, indicating their better discriminative ability. In contrast, SVM model had a relatively large overlap area.
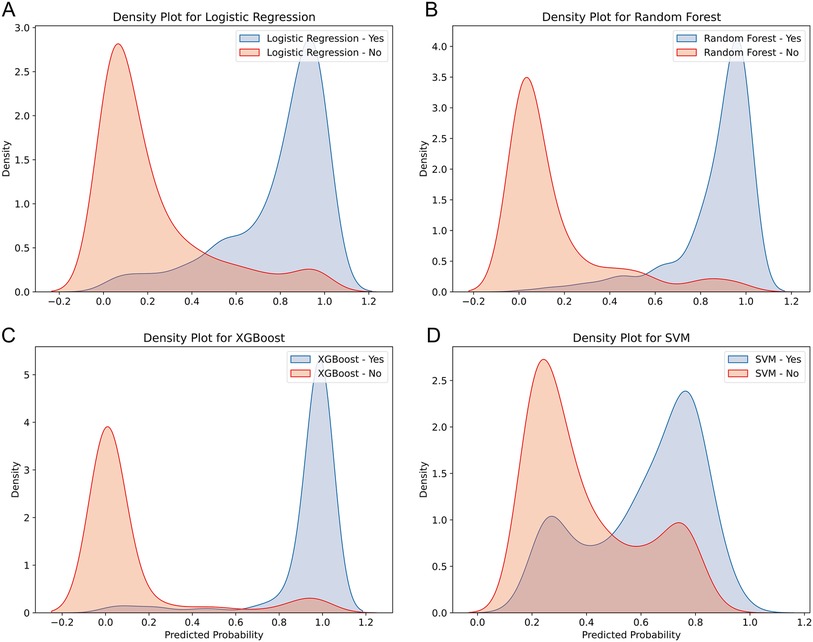
Figure 3. Density curves for all the models. (A) LR model, (B) RF model, (C) XGBoost model, (D) SVM model. The orange indicates patients without HF, and the blue indicates patients with HF. The less overlap between the blue and orange colors, the better the model's ability to discriminate.
Furthermore, XGBoost's calibration curve closely approximated the ideal line (Figure 4A). DCA was shown in Figure 4B, where the XGBoost model had the highest net benefit when the threshold probability was in the range of 0%-95%. Therefore, based on above findings, the XGBoost model was considered the optimal prediction model.
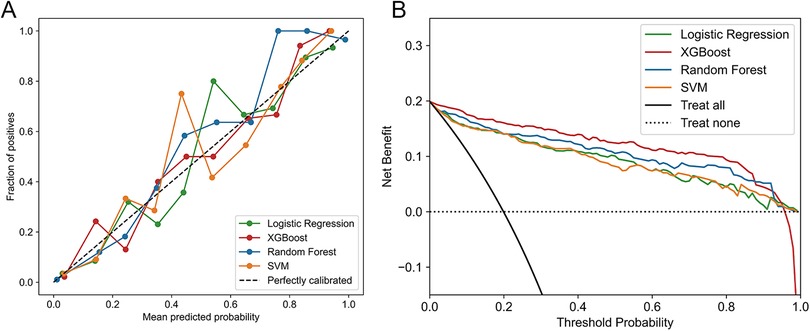
Figure 4. (A) Calibration curves of ML models in testing set. (B) DCA of ML models in Testing set.
To visually interpret the selected features, we used SHAP analysis to interpret the ML model. At the feature level, we used SHAP summary plots to show how these features affected the probability of HF (Figure 5). Figure 5A shows the ranking of feature importance based on Shapley values, which indicated that the three most important features contributing to the prediction model were LVEF, LVDs, and LDH. Figure 5B provided a comprehensive visualization of how the features affected the XGBoost model, where red represented high-risk values and blue represented low-risk values. As seen from the figure, a higher LVEF value (red points) correlated with a lower likelihood of developing HF. Conversely, higher values of LVDs and LDH are associated with higher risk of HF.
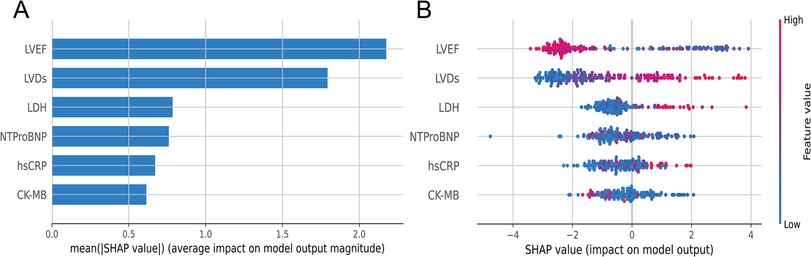
Figure 5. (A) Summary plots of SHAP values. Ranking of variable importance based on the average value. (B) Representation of the influence exerted by each feature on the final model output, assessed via SHAP values distribution. Every individual patient is denoted by a data point within each row. The red dots represent higher feature values, while the blue dots represent lower feature values. A higher SHAP value indicates a higher HF risk.
Meanwhile, to elucidate how each feature impacted the probability of HF in the ML model, we plotted SHAP dependency graphs for three key features: LVEF, LVDs, and LDH. As shown in Figures 6A–C, LVEF was below approximately 50%, LVDs were higher than about 4.0 cm, and LDH levels above nearly 650 u/L were associated with an increased risk of HF.
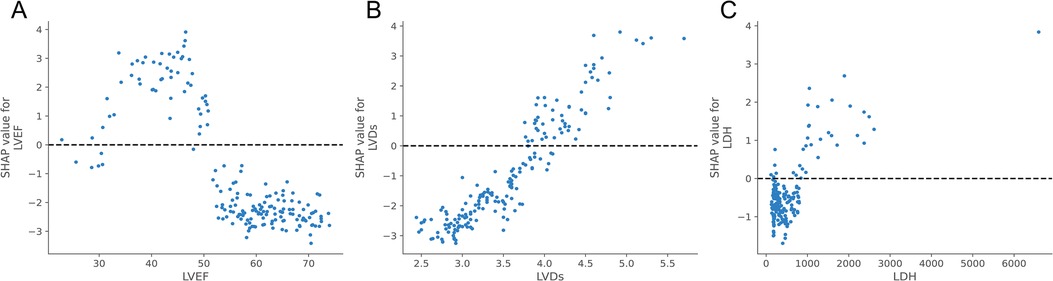
Figure 6. SHAP dependence plot of the XGBoost model. Each dependence plot shows how a single feature affects the output of the prediction model, and each dot represents a single patient.(A) LVEF, (B) LVDs, (C) LDH. The SHAP values for these features exceed zero, representing an increased risk of HF.
Next, at the individual level, we explained the personalized prediction results of two random samples through SHAP plots and waterfall plot analysis. The red and blue bars represented risk factors and protective factors, respectively. The length of each bar corresponded to its feature importance. In Figures 7A,B, we illustrated the case of an AMI patient who did not develop HF during the follow-up period. Notably, the presence of several protective factors, including normal LVEF (59.59%), LVDs (3.2 cm), hsCRP (6.44 mg/L), LDH (287 u/L), and NT-proBNP (395.1 pg/ml), led to the model predicting a relatively low risk (0.3%), consistent with the actual outcome (true negative), although CK-MB was relatively high (327 u/L).
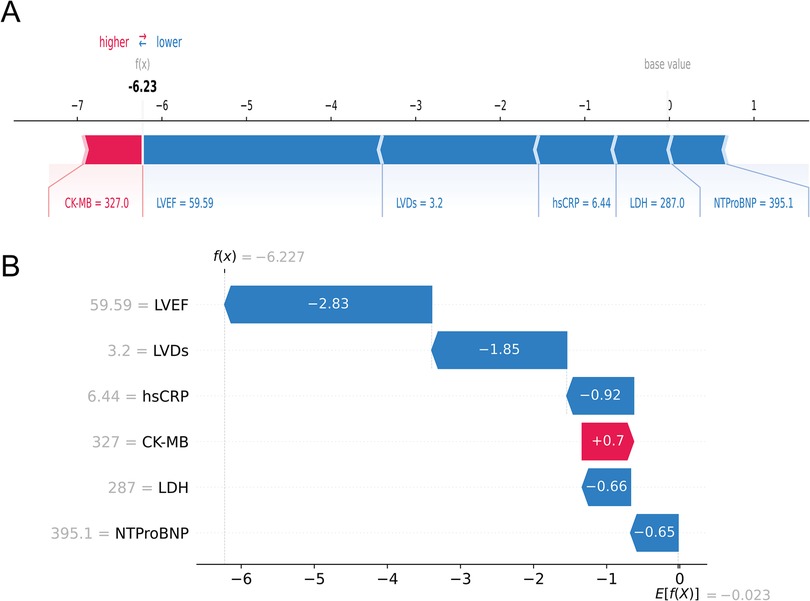
Figure 7. An AMI patient who did not experience HF during follow-up. The forceplot (A) and waterfall plot (B) are used to explain the contribution of features on a certain patient. wherein the red and blue bars signify risk factors and protective factors, respectively.
In contrast, Figures 8A,B depicted a case of an AMI patient who developed HF. Despite the patient's LVEF (56.09%) and LDH (575 u/L) being within normal ranges, the model forecasted a heightened probability of HF (69.3%) owing to the presence of multiple risk factors, notably larger LVDs (4.0 cm), elevated CK-MB (96 u/L), and heightened hsCRP (10.5 mg/L), which was consistent with the actual outcomes (true positive). Collectively, these individual-level elucidations aligned with the feature-level interpretations, offering a potential solution to the “black box” dilemma in medical AI applications.
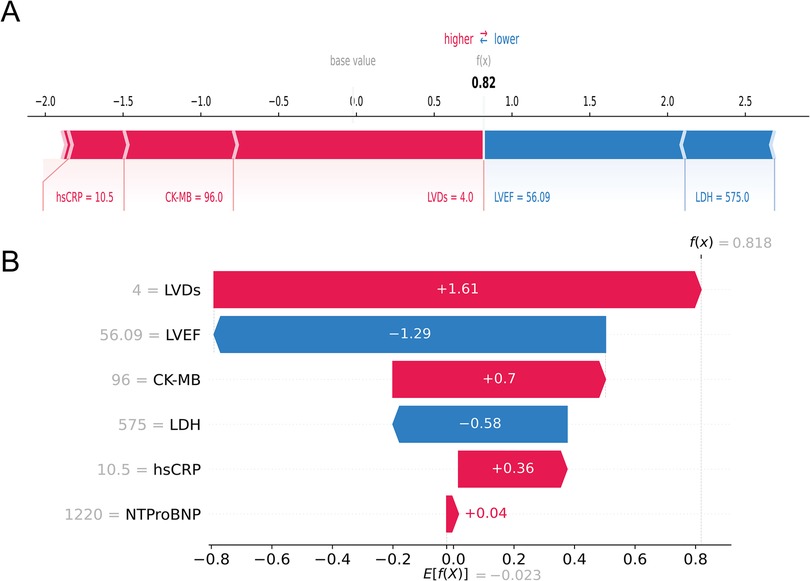
Figure 8. An AMI patient who developed HF during follow-up. The forceplot (A) and waterfall plot (B) are used to explain the contribution of features on a certain patient. wherein the red and blue bars signify risk factors and protective factors, respectively.
HF is a common and serious complication of myocardial infarction, which is closely related to high mortality and morbidity, regardless of the presence of coronary artery obstruction (23). Establishing a feasible prognosis prediction model was helpful for clinicians to distinguish high-risk patients and optimize the management of risk factors. To our knowledge, this study was the first to combine ML and SHAP methods to develop a HF risk prediction model for AMI patients. The main findings were as follows: (1) among the four algorithms tested, the XGBoost model performed optimal predictive power with the best discrimination and calibration; (2) the three most important variables associated with the incidence of HF after AMI included LVEF, LVDs, and LDH; and (3) SHAP method, revealed the roles of various variables in model interpretation and demonstrates the individual level prediction process. Moreover, the model utilized only a few easily accessible predictor variables, which enhances its utility in clinical applications.
ML was widely applied in clinical diagnosis and prognosis prediction (24–26). However, only a few studies used ML to predict HF after AMI. Li et al. employed LASSO, RF, and SVM-RFE algorithms to investigate genetic mechanisms of HF development after AMI, identifying IL1B, TIMP2, IFIT3, and P2RY2 as potential therapeutic targets (27). Additionally, Li et al. employed seven ML algorithms to predict the risk of HF after AMI based on clinical laboratory indicators, and found that XGBoost performed best with nine key indicators, including cTnI, TG, and URBC (14). However, these studies focused on limited factors and did not consider other potentially predictive indicators such as medication history, imaging, and coronary angiography. Therefore, more comprehensive exploration were needed to improve the prediction of HF after AMI.
Compared to previous studies (14, 27), our model encompassed a broader range of features. It used four common ML methods to predict the risk of HF in AMI patients within three years after PCI surgery, considering multiple factors such as demographics, clinical complications, laboratory tests, echocardiography parameters, and angiography results. The results showed that the XGBoost model had the highest discrimination ability, with an AUC of 0.922, an accuracy of 0.896, a sensitivity of 0.795, and a specificity of 0.939. XGBoost was an efficient ML method based on a scalable end-to-end tree boosting system, which processed large-scale data and high-dimensional feature (28, 29). It also used regularization techniques and pruning strategies to reduce the risk of overfitting (30). Additionally, the data source for this study comprised the initial test results of AMI patients upon admission, reflecting their initial health status. Therefore, the predictions had good foresight. This study also utilized hospital data, imposing no additional financial burden on patients, this underscored the potential of ML in clinical decisions.
Another advantage of our study was the introduction of the SHAP method for interpreting the XGBoost model. ML models were often referred to as black-box models because we cannot precisely understand the specific contribution of each feature to clinical decisions. Interpretability of a model can be defined as the extent to which a human can understand the cause of the ML model's prediction (31). The higher the interpretability of the model, the easier it will be for clinicians to understand the model's behavior and trust the model's conclusion, so as to make appropriate clinical decisions in the best interests of the patient (32). Therefore, we introduced the SHAP method to address the black-box problem. Based on game theory, SHAP clearly explained the complex relationships between features and prediction results, offering significant advantages in terms of interpretability and visualization. Additionally, we provided a ranking of characteristics for individual cases through SHAP analysis. Under the comprehensive influence of these variables, we can predict whether a person may suffer from “HF” or “Non-HF”. As shown in Figures 7, 8, with SHAP personalized analysis, the physician can intuitively understand how the ML model makes decisions, and therefore use the model for clinical decision-making.
Our research findings indicated that lower LVEF and larger LVDs predicted a higher risk of HF. LVEF and LVDs were indicators used to evaluate cardiac function and structure. In some patients, left ventricular remodeling caused by left ventricular myocardial repair and functional compensation 24–72 h after AMI aggravated the degree of myocardial injury, which could lead to the decrease of LVEF, left ventricular dilatation and malignant arrhythmia. As the disease progressed, it resulted in HF or even death (33). A multi-ethnic atherosclerosis study (MESA) found that during an average follow-up of 9.4 years, left ventricular remodeling was closely related to HF events. Compared with subjects with normal LV size and preserved LVEF, participants with left ventricular dilation and reduced LVEF had a worse prognosis (34). Furthermore, Michael et al. also demonstrated that subclinical left ventricular dilation and systolic dysfunction were independent predictors of HF (35).
Our research also indicated that elevated levels of LDH, NT-proBNP, and CK-MB are associated with an increased risk of HF in patients with AMI. As specific markers of myocardial injury, the levels of LDH, NT-proBNP, and CK-MB can reflect the severity of myocardial cell damage and deterioration of cardiac function. Numerous previous studies have confirmed that elevated levels of these markers are closely related to poor prognosis (36–40). Similarly, in our prediction model, hsCRP was considered one of the six key predictors for identifying HF risk in AMI patients. Higher levels of hsCRP in these patients may indicate a greater risk of HF, as it reflects immune system damage that can lead to severe complications. As a marker of inflammation severity, hsCRP is closely related to an increased risk of HF (41).
This study had some limitations. Firstly, this was a retrospective study, and there may be some causal inference and selection bias. Secondly, whilst our model was validated on an internal test dataset, external validation on another dataset would be ideal and necessary prior to consideration of widespread use, Future research will conduct large-scale multicenter clinical studies and develop an online prediction system to better support clinical application. Finally, our study mainly extracted the clinical data of AMI patients within 24 h after admission, which may ignore the dynamic changes of these characteristics with time.
This study successfully developed an interpretable machine learning model to predict the risk of HF in AMI patients. This model aids clinicians in tailoring individualized treatment strategies based on each patient's unique prognostic profile, thereby improving patient outcomes.
The raw data supporting the conclusions of this article will be made available by the authors, without undue reservation.
The studies involving humans were approved by the Institutional Review Committee of the First Affiliated Hospital of Fujian Medical University. The studies were conducted in accordance with the local legislation and institutional requirements. The ethics committee/institutional review board waived the requirement of written informed consent for participation from the participants or the participants’ legal guardians/next of kin because because the data involved in this study were recruited from electronic medical records and reported without personal identifiers, the need for informed consent from the patients was waived.
QL: Data curation, Formal Analysis, Writing – original draft. WZ: Formal Analysis, Methodology, Project administration, Validation, Writing – original draft, Writing – review & editing. HZ: Data curation, Formal Analysis, Methodology, Writing – original draft. WC: Data curation, Formal Analysis, Conceptualization, Writing – original draft. SL: Validation, Visualization, Investigation, Writing – review & editing. QR: Formal Analysis, Supervision, Writing – review & editing. ZQ: Formal Analysis, Supervision, Writing – review & editing. YL: Formal Analysis, Data curation, Writing – original draft. DC: Formal Analysis, Supervision, Writing – review & editing. XL: Supervision, Writing – review & editing, Methodology.
The author(s) declare financial support was received for the research, authorship, and/or publication of this article. This study was supported by grants from the Science and Technology Project of Fujian Provincial Health Commission (2022CXB006), Fujian industry Research Joint Innovation Project of Science and Technology (2020Y4016) and the Natural Science Foundation Youth Project of Fujian Province (2023J05117).
The authors declare that the research was conducted in the absence of any commercial or financial relationships that could be construed as a potential conflict of interest.
All claims expressed in this article are solely those of the authors and do not necessarily represent those of their affiliated organizations, or those of the publisher, the editors and the reviewers. Any product that may be evaluated in this article, or claim that may be made by its manufacturer, is not guaranteed or endorsed by the publisher.
1. Ibanez B, James S, Agewall S, Antunes MJ, Bucciarelli-Ducci C, Bueno H, et al. 2017 ESC guidelines for the management of acute myocardial infarction in patients presenting with st-segment elevation: the task force for the management of acute myocardial infarction in patients presenting with st-segment elevation of the European Society of Cardiology (ESC). Eur Heart J. (2018) 39(2):119–77. doi: 10.1093/eurheartj/ehx393
2. Akhtar KH, Khan MS, Baron SJ, Zieroth S, Estep J, Burkhoff D, et al. The spectrum of post-myocardial infarction care: from acute ischemia to heart failure. Prog Cardiovasc Dis. (2024) 82:15–25. doi: 10.1016/j.pcad.2024.01.017
3. Gerber Y, Weston SA, Enriquez-Sarano M, Berardi C, Chamberlain AM, Manemann SM, et al. Mortality associated with heart failure after myocardial infarction: a contemporary community perspective. Circ Heart Fail. (2016) 9(1):e002460. doi: 10.1161/CIRCHEARTFAILURE.115.002460
4. Carvalho PR, Bernardo MC, Carvalho CR, Moreira I, Borges S, Guimarães JP, et al. Age shock index as an early predictor of cardiovascular death in acute coronary syndrome patients. Coron Artery Dis. (2024) 35(4):322–7. doi: 10.1097/mca.0000000000001342
5. Anand A, Cudmore S, Robertson S, Stephen J, Haga K, Weir CJ, et al. Frailty assessment and risk prediction by grace score in older patients with acute myocardial infarction. BMC Geriatr. (2020) 20(1):102. doi: 10.1186/s12877-020-1500-9
6. Kwon JM, Jeon KH, Kim HM, Kim MJ, Lim S, Kim KH, et al. Deep-learning-based risk stratification for mortality of patients with acute myocardial infarction. PLoS One. (2019) 14(10):e0224502. doi: 10.1371/journal.pone.0224502
7. Noringriis I, Modin D, Pedersen SH, Jensen JSBiering-Sørensen T. Prognostic importance of mechanical dyssynchrony in predicting heart failure development after st-segment elevation myocardial infarction. Int J Cardiovasc Imaging. (2019) 35(1):87–97. doi: 10.1007/s10554-018-1443-9
8. Liu R, Gao C. Clinical value of combined plasma brain natriuretic peptide and serum cystatin c measurement on the prediction of heart failure in patients after acute myocardial infarction. Braz J Med Biol Res. (2023) 56:e12910. doi: 10.1590/1414-431X2023e12910
9. Huang L, Zhang J, Huang Q, Cui RChen J. In-hospital major adverse cardiovascular events after primary percutaneous coronary intervention in patients with acute st-segment elevation myocardial infarction: a retrospective study under the China chest pain center (standard center) treatment system. BMC Cardiovasc Disord. (2023) 23(1):198. doi: 10.1186/s12872-023-03214-x
10. Al'Aref SJ, Singh G, van Rosendael AR, Kolli KK, Ma X, Maliakal G, et al. Determinants of in-hospital mortality after percutaneous coronary intervention: a machine learning approach. J Am Heart Assoc. (2019) 8(5):e011160. doi: 10.1161/jaha.118.011160
11. Hernesniemi JA, Mahdiani S, Tynkkynen JA, Lyytikäinen LP, Mishra PP, Lehtimäki T, et al. Extensive phenotype data and machine learning in prediction of mortality in acute coronary syndrome—the maddec study. Ann Med. (2019) 51(2):156–63. doi: 10.1080/07853890.2019.1596302
12. Loring Z, Mehrotra SPiccini JP. Machine learning in ‘big data': handle with care. Europace. (2019) 21(9):1284–5. doi: 10.1093/europace/euz130
13. Beam AL, Kohane IS. Big data and machine learning in health care. Jama. (2018) 319(13):1317–8. doi: 10.1001/jama.2017.18391
14. Li X, Shang C, Xu C, Wang Y, Xu J, Zhou Q. Development and comparison of machine learning-based models for predicting heart failure after acute myocardial infarction. BMC Med Inform Decis Mak. (2023) 23(1):165. doi: 10.1186/s12911-023-02240-1
15. Rudin C. Stop explaining black box machine learning models for high stakes decisions and use interpretable models instead. Nat Mach Intell. (2019) 1(5):206–15. doi: 10.1038/s42256-019-0048-x
16. Lundberg SM, Erion G, Chen H, DeGrave A, Prutkin JM, Nair B, et al. From local explanations to global understanding with explainable ai for trees. Nat Mach Intell. (2020) 2(1):56–67. doi: 10.1038/s42256-019-0138-9
18. Stepinska J, Lettino M, Ahrens I, Bueno H, Garcia-Castrillo L, Khoury A, et al. Diagnosis and risk stratification of chest pain patients in the emergency department: focus on acute coronary syndromes. A position paper of the acute cardiovascular care association. Eur Heart J Acute Cardiovasc Care. (2020) 9(1):76–89. doi: 10.1177/2048872619885346
19. Huang G, Li M, Mao Y, Li Y. Development and internal validation of a risk model for hyperuricemia in diabetic kidney disease patients. Front Public Health. (2022) 10:863064. doi: 10.3389/fpubh.2022.863064
20. Tay JK, Narasimhan B, Hastie T. Elastic net regularization paths for all generalized linear models. J Stat Softw. (2023) 106(1). doi: 10.18637/jss.v106.i01
21. Sun R, Wang X, Jiang H, Yan Y, Dong Y, Yan W, et al. Prediction of 30-day mortality in heart failure patients with hypoxic hepatitis: development and external validation of an interpretable machine learning model. Front Cardiovasc Med. (2022) 9:1035675. doi: 10.3389/fcvm.2022.1035675
22. Liu Z, Luo C, Chen X, Feng Y, Feng J, Zhang R, et al. Noninvasive prediction of perineural invasion in intrahepatic cholangiocarcinoma by clinicoradiological features and computed tomography radiomics based on interpretable machine learning: a multicenter cohort study. Adv Int J Surg. (2024) 110(2):1039–51. doi: 10.1097/js9.0000000000000881
23. Armillotta M, Amicone S, Bergamaschi L, Angeli F, Rinaldi A, Paolisso P, et al. Predictive value of killip classification in minoca patients. Eur J Intern Med. (2023) 117:57–65. doi: 10.1016/j.ejim.2023.08.011
24. Chen J, Yang L, Han J, Wang L, Wu T, Zhao D. Interpretable machine learning models using peripheral immune cells to predict 90-day readmission or mortality in acute heart failure patients. Clin Appl Thromb Hemost. (2024) 30:10760296241259784. doi: 10.1177/10760296241259784
25. Zhang AD, Shi QL, Zhang HT, Duan WH, Li Y, Ruan L, et al. Pairwise machine learning-based automatic diagnostic platform utilizing ct images and clinical information for predicting radiotherapy locoregional recurrence in elderly esophageal cancer patients. Abdom Radiol (NY). (2024) 49(11):4151–61. doi: 10.1007/s00261-024-04377-7
26. Shi Y, Fan H, Li L, Hou Y, Qian F, Zhuang M, et al. The value of machine learning approaches in the diagnosis of early gastric cancer: a systematic review and meta-analysis. World J Surg Oncol. (2024) 22(1):40. doi: 10.1186/s12957-024-03321-9
27. Li Y, Hu Y, Jiang F, Chen H, Xue Y, Yu Y. Combining wgcna and machine learning to identify mechanisms and biomarkers of ischemic heart failure development after acute myocardial infarction. Heliyon. (2024) 10(5):e27165. doi: 10.1016/j.heliyon.2024.e27165
28. Liu J, Wu J, Liu S, Li M, Hu K, Li K. Predicting mortality of patients with acute kidney injury in the icu using xgboost model. PLoS One. (2021) 16(2):e0246306. doi: 10.1371/journal.pone.0246306
29. Xie LF, Xie YL, Wu QS, He J, Lin XF, Qiu ZH, et al. A predictive model for postoperative adverse outcomes following surgical treatment of acute type a aortic dissection based on machine learning. J Clin Hypertens (Greenwich, Conn.). (2024) 26(3):251–61. doi: 10.1111/jch.14774
30. Zhao QY, Liu LP, Luo JC, Luo YW, Wang H, Zhang YJ, et al. A machine-learning approach for dynamic prediction of sepsis-induced coagulopathy in critically ill patients with sepsis. Front Med (Lausanne). (2020) 7:637434. doi: 10.3389/fmed.2020.637434
31. Stiglic G, Kocbek P, Fijacko N, Zitnik M, Verbert K, Cilar L. Interpretability of machine learning-based prediction models in healthcare. WIRES Data Min Knowl Discov. (2020) 10(5). doi: 10.1002/widm.1379
32. Ribeiro MT, Singh S, Guestrin C. “Why should i trust you?”: explaining the predictions of any classifier. In: KDD '16: Proceedings of the 22nd ACM SIGKDD International Conference on Knowledge Discovery and Data Mining. New York, NY: Association for Computing Machinery (2016). p. 1135–44. doi: 10.1145/2939672.2939778
33. Liu Z, Cui K, Wang G, Jin W, Yao Q, Zhang Y. A clinical randomized trial: effects of early application of sacubitril/valsartan on ventricular remodeling and prognosis in acute myocardial infarction patients. Contemp Clin Trials Commun. (2024) 42:101303. doi: 10.1016/j.conctc.2024.101303
34. Yeboah J, Bluemke DA, Hundley WG, Rodriguez CJ, Lima JA, Herrington DM. Left ventricular dilation and incident congestive heart failure in asymptomatic adults without cardiovascular disease: multi-ethnic study of atherosclerosis (mesa). J Card Fail. (2014) 20(12):905–11. doi: 10.1016/j.cardfail.2014.09.002
35. Lauer MS, Evans JCLevy D. Prognostic implications of subclinical left ventricular dilatation and systolic dysfunction in men free of overt cardiovascular disease (the framingham heart study). Am J Cardiol. (1992) 70(13):1180–4. doi: 10.1016/0002-9149(92)90052-Z
36. Dong T, Zhu W, Yang Z, Matos Pires NM, Lin Q, Jing W, et al. Advances in heart failure monitoring: biosensors targeting molecular markers in peripheral bio-fluids. Biosens Bioelectron. (2024) 255:116090. doi: 10.1016/j.bios.2024.116090
37. Sakamoto D, Sotomi Y, Matsuoka Y, Nakatani D, Okada K, Sunaga A, et al. Prognostic utility and cutoff differences of nt-probnp level across subgroups in heart failure with preserved ejection fraction: insights from the pursuit-hfpef registry. J Card Fail. (2024). doi: 10.1016/j.cardfail.2024.10.440
38. Akbas T. Elevated cardiac troponin levels as a predictor of increased mortality risk in non-cardiac critically ill patients admitted to a medical intensive care unit. J Clin Med. (2024) 13(20). doi: 10.3390/jcm13206025
39. Masumoto A, Kitai T, Matsumoto S, Kuroda S, Kohsaka S, Tachikawa R, et al. Impact of serum lactate dehydrogenase on the short-term prognosis of COVID-19 with pre-existing cardiovascular diseases. J Cardiol. (2022) 79(4):501–8. doi: 10.1016/j.jjcc.2021.12.014
40. Chen H, Li X, Marmar T, Xu Q, Tu J, Li T, et al. Cardiac troponin i association with critical illness and death risk in 726 seriously ill COVID-19 patients: a retrospective cohort study. Int J Med Sci. (2021) 18(6):1474–83. doi: 10.7150/ijms.53641
Keywords: acute myocardial infarction, heart failure, machine learning, predict, shapley additive explanations
Citation: Lin Q, Zhao W, Zhang H, Chen W, Lian S, Ruan Q, Qu Z, Lin Y, Chai D and Lin X (2025) Predicting the risk of heart failure after acute myocardial infarction using an interpretable machine learning model. Front. Cardiovasc. Med. 12:1444323. doi: 10.3389/fcvm.2025.1444323
Received: 5 June 2024; Accepted: 6 January 2025;
Published: 24 January 2025.
Edited by:
Yao-Jun Zhang, Xuzhou Medical University, ChinaReviewed by:
Evgeny Ovcharenko, Research Institute for Complex Issues of Cardiovascular Diseases, Russian Academy of Medical Sciences, RussiaCopyright: © 2025 Lin, Zhao, Zhang, Chen, Lian, Ruan, Qu, Lin, Chai and Lin. This is an open-access article distributed under the terms of the Creative Commons Attribution License (CC BY). The use, distribution or reproduction in other forums is permitted, provided the original author(s) and the copyright owner(s) are credited and that the original publication in this journal is cited, in accordance with accepted academic practice. No use, distribution or reproduction is permitted which does not comply with these terms.
*Correspondence: Xiaoyan Lin, Znl5eTE1OTZAMTYzLmNvbQ==; Dajun Chai, ZGFqdW5jaGFpLWZ5QGZqbXUuZWR1LmNu
†These authors have contributed equally to this work
Disclaimer: All claims expressed in this article are solely those of the authors and do not necessarily represent those of their affiliated organizations, or those of the publisher, the editors and the reviewers. Any product that may be evaluated in this article or claim that may be made by its manufacturer is not guaranteed or endorsed by the publisher.
Research integrity at Frontiers
Learn more about the work of our research integrity team to safeguard the quality of each article we publish.