
95% of researchers rate our articles as excellent or good
Learn more about the work of our research integrity team to safeguard the quality of each article we publish.
Find out more
ORIGINAL RESEARCH article
Front. Cardiovasc. Med. , 22 July 2024
Sec. Cardiovascular Epidemiology and Prevention
Volume 11 - 2024 | https://doi.org/10.3389/fcvm.2024.1382702
This article is part of the Research Topic Mendelian Randomization and Cardiovascular Diseases View all 16 articles
 Yaodong Sun1,†
 Dongdong Du1,2,†Jiantao Zhang1,3,4,†Linlin Zhao1Bufan Zhang1Yi Zhang1Tianxu Song1Naishi Wu1*
Background: This Mendelian randomization (MR) study aimed to explore the causal relationship between the genetic predisposition to type 2 diabetes mellitus (T2DM) and aortic dissection (AD), and to assess associations with genetically predicted glycemic traits. The study sought to verify the inverse relationship between T2DM and AD using a more robust and unbiased method, building on the observational studies previously established.
Materials and methods: The study employed a two-sample and multivariable MR approach to analyze genetic data from the DIAbetes Meta-ANalysis of Trans-Ethnic association studies (DIAMANTE) with 74,124 cases and 824,006 controls, and the Meta-Analyses of Glucose and Insulin-Related Traits Consortium (MAGIC) involving up to 196,991 individuals. For AD data, FinnGen Release 10 was used, including 967 cases and 381,977 controls. The research focused on three foundational MR assumptions and controlled for confounders like hypertension. Genetic instruments were selected for their genome-wide significance, and multiple MR methods and sensitivity analyses were conducted.
Results: The study revealed no significant effect of genetic predisposition to T2DM on the risk of AD. Even after adjusting for potential confounders, the results were consistent, indicating no causal relationship. Additionally, glycemic traits such as fasting glucose, fasting insulin, and HbA1c levels did not show a significant impact on AD susceptibility. The findings remained stable across various MR models and sensitivity analyses. In contrast, genetic liability to T2DM and glycemic traits showed a significant association with coronary artery disease (CAD), aligning with the established understanding.
Conclusion: Contrary to previous observational studies, this study concludes that genetic predisposition to T2DM does not confer protection against AD. These findings underscore the imperative for further research, particularly in exploring the preventative potential of T2DM treatments against AD and to facilitate the development of novel therapeutic interventions.
Aortic dissection (AD) stands as the most frequently encountered catastrophic event afflicting the aorta (1). Hospital records of acute aortic syndromes suggest an incidence rate of 3–5 per 100,000 individuals annually, with a spike to 35 per 100,000 in those aged 65–75 (2, 3). AD also imposes a significant economic burden on both the patients’ families and society (4). At present, no pharmacological intervention has been demonstrated to be effective in the prevention of AD.
Controversy surrounds the influence of diabetic conditions on AD. Hypertension is typically difficult to control in diabetic patients, which leads to weakness of the medial layer of the aorta and promotes AD. However, a paradox emerges as studies reveal a reduced prevalence of AD in patients with type 2 diabetes mellitus (T2DM) (5, 6). Meta-analyses corroborate this observation, showcasing a lower AD incidence among T2DM patients (7, 8). Observational studies often struggle to establish causality due to the presence of potential confounders and biases. This is in contrast to randomized controlled trials. As a result, the findings and interpretations of the relationship between T2DM and AD in observational studies may be skewed. Moreover, the exact mechanisms underlying this inverse relationship remain unclear. Current hypotheses fluctuate between the protective role of glycated crosslinks in aortic tissue and the beneficial effects of certain T2DM treatments (9, 10). The pivotal question of T2DM's intrinsic protective propensity against AD remains unresolved.
Mendelian randomization (MR) analysis is an epidemiological design that can strengthen causal inference by using genetic variants as instrumental variables (IVs) for an exposure (11). The MR design, characterized by its immunity to confounding biases and reverse causality, owes its robustness to the random assortment of genetic alleles at conception and their insusceptibility to modification by diseases (12). Previous MR studies have shown that genetic predisposition to T2DM did not play a causal role in abdominal aortic aneurysm (AAA) but decreases the risk of thoracic aortic aneurysm (TAA) (13, 14). Our MR study aims to delineate the causal relationship between T2DM genetic predisposition and AD while examining associations with genetically predicted glycemic traits as supplementary analyses.
This two-sample and multivariable MR study was designed to explore the causal effect of T2DM and glycemic traits on the risk of AD. The ethics committee at each institutional review board review board authorized all participants’ written informed consent in separate studies. Further ethical approval or consent was deemed unnecessary. Our MR study was predicated on three foundational assumptions: (1) the IVs are related to exposures of interest; (2) the IVs are not related to the confounders of the exposure-outcome relation; (3) the IVs’ links with the outcome are only via the exposure of interest (15). To eliminate potential confounding factors, specifically the impact of hypertension, two types of secondary analyses were conducted. To address potential confounders, particularly hypertension's influence, we conducted two secondary analyses. First, a two-sample MR study was used to exclude Single Nucleotide Polymorphisms (SNPs) linked to hypertension. Then, drawing upon epidemiological information on T2DM and AD, we conducted two-sample MR analysis to explore factors that may influence the onset of these two diseases. In this context, we examined factors such as blood pressure, lipids, diet, sleep, physical activity, smoking, alcohol, socioeconomic elements, and stress. Factors related to both T2DM and AD were deemed confounders and included in further multivariate MR studies to assess T2DM's independent role. We used coronary artery disease (CAD) as a positive control to ensure IVs showed expected associations with a common disease, reducing selection bias risk (16). Additionally, the UK Biobank's AD database served as a validation set. Subsequent sections detail the data sources, genetic instrument selection, and statistical analyses (Figure 1; Table 1; Supplementary Table S1).
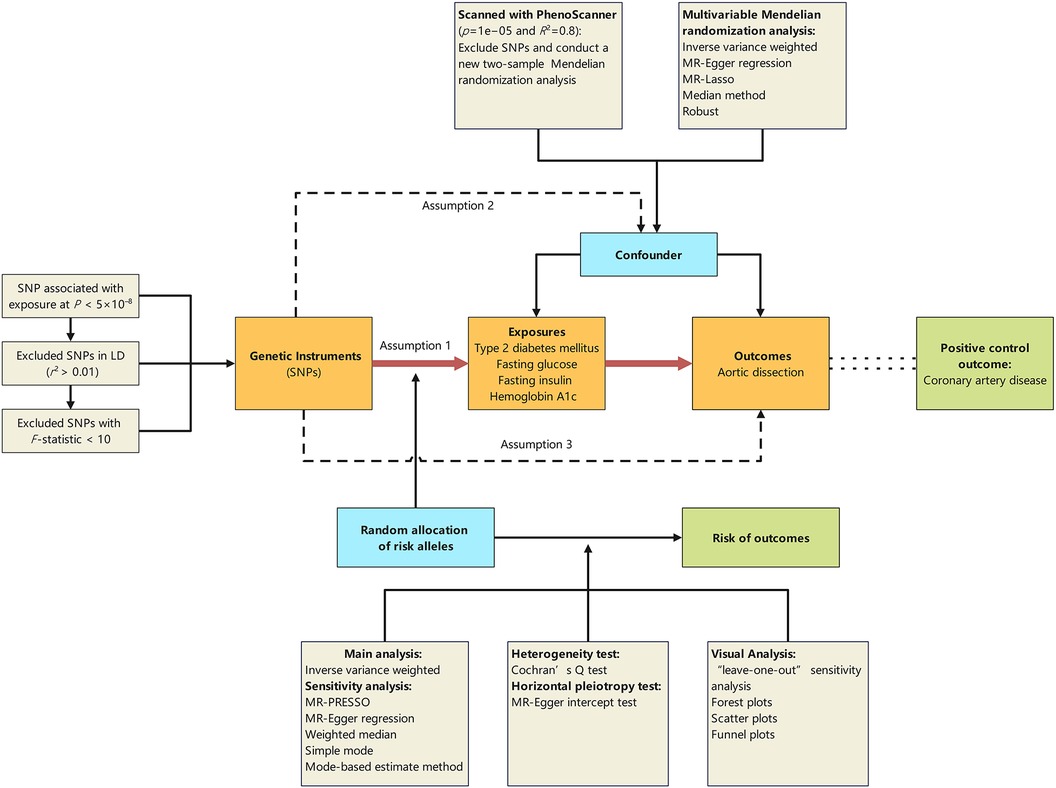
Figure 1 Schematic representation of the Mendelian randomisation design. The traditional assumptions of Mendelian randomisation are that the genetic instrumental variable is associated with the risk factor (assumption 1); the variants should not be associated with confounders (assumption 2); and that the variants should influence the outcome only through effects on the risk factor under investigation (assumption 3). SNP, single nucleotide polymorphism; LD, linkage disequilibrium; p, probability value; r2, coefficient of determination.
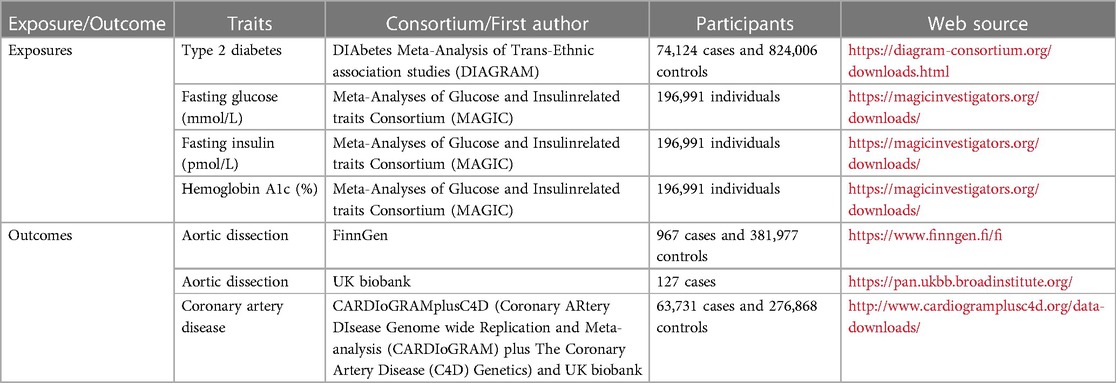
Table 1 Information of included studies and consortia.
We sourced genetic data for T2DM from the DIAbetes Meta-ANalysis of Trans-Ethnic association studies (DIAMANTE) consortium's GWAS meta-analysis, encompassing 74,124 cases and 824,006 controls, all of European ancestry (17). T2DM in the original GWAS was defined by diagnostic fasting glucose (FG), fasting insulin (FI), 2 h plasma glucose or hemoglobin A1c (HbA1c) levels; use of glucose-lowering medication (by Anatomical Therapeutic Chemical code or self-report); or T2DM history from electronic medical records, self-report and varying combinations of each, depending on the contributing cohort.
For glycemic traits like FI, FG, and HbA1c, we referred to the Meta-Analyses of Glucose and Insulin-Related Traits Consortium (MAGIC) data, which includes information from up to 196,991 European participants.
To confirm potential confounding factors, we included variables such as Systolic Blood Pressure (SBP), Diastolic Blood Pressure (DBP), Pulse Pressure (PP), High-Density Lipoprotein cholesterol (HDL-C) (18), Low-Density Lipoprotein cholesterol (LDL-C) (18), Total Cholesterol (TC) (18), Triglycerides (TG) (18), dietary intakes (protein, fat, sugar, carbohydrates) (19), socioeconomic factors [educational level (20), annual household income, Townsend Deprivation Index (TDI)], lifestyle factors (skipping breakfast (21), napping (22), daytime sleepiness (23), sleep duration (24), insomnia (25), leisure screen time (26), moderate-to-vigorous intensity physical activity during leisure time (MVPA) (26), sedentary behavior at work (26), environmental stress and adversity (27), smoking (smoking initiation, daily smoking, smoking cessation, smoking initiation) (28), drinking (weekly alcohol consumption data (28), alcohol abuse (29). Detailed database sources for each variable are provided in Supplementary Table S2.
We included SNPs correlating with the selected traits at a genome-wide significance threshold (p < 5 × 10⁻⁸). We ensured the avoidance of weak instrument bias by prioritizing SNPs with F-statistics exceeding 10 (30). The absence of rsid in the DIAMANTE's T2DM database necessitated its determination via SNP-nexus (https://www.snp-nexus.org/v4/) and the National Library of Medicine (https://www.ncbi.nlm.nih.gov/snp/?term=), reliant on chromosome and position data. In the presence of linkage disequilibrium (LD) (r2 > 0.001), preference was given to the SNP boasting the strongest association, thereby safeguarding the independence assumption. This yielded 150 SNPs for T2DM, 38 for FI, 70 for FG, and 75 for HbA1c collectively termed as primitive groups. The proportion of variance in the exposure factors explained by the instrumental variables for T2DM, FG, FI, and HbA1c are 7.32%, 4.32%, 1.42%, and 5.76%, respectively (Supplementary Table S1).
Each SNP was scanned with PhenoScanner to identify and mitigate potential pleiotropic effects. SNPs correlating with established risk factors of AD, including hypertension within the European population, were filtered out utilizing a threshold of p = 1 × 10⁻⁵ and R2 = 0.8. Consequently, 17 SNPs of T2DM, 7 SNPs of FI, 11 SNPs of FG, and 6 SNPs of HbA1c were excluded (Supplementary Table S3). The remaining SNPs constituted the adjustment groups.
GWAS summary statistics for AD were obtained from FinnGen Release 10, a project mapping genotype-phenotype correlations using Finnish biobank data. This included genome and health data from 1,069 AD individuals and 377,277 controls, characterized by 473,681 genotyped SNPs. Aortic dissection diagnosis was based on hospital records, using ICD-10 codes I71.00, I71.01, I71.09, and ICD-9 code 4410. Endpoint and control definitions are available at https://www.finngen.fi/en/researchers/clinical-endpoints. The UK Biobank database, with 127 cases, served as a validation set (http://www.nealelab.is/uk-biobank).
The genetic data for coronary artery disease were obtained from a meta-analysis of UK Biobank SOFT CAD GWAS (interim release) with CARDIoGRAMplusC4D (Coronary ARtery DIsease Genome wide Replication and Meta-analysis (CARDIoGRAM) plus The Coronary Artery Disease (C4D) Genetics) 1,000 Genomes-based GWAS and the Myocardial Infarction Genetics and CARDIoGRAM Exome (31).
Statistical significance was set at a two-sided 0.05 level, if the p-value is less than the Bonferroni-corrected threshold of 1.11 × 10⁻³, we consider it indicative of a strong correlation. The selection of instrumental variables (IVs) is detailed in the “Exposure” section. For the primary analysis, we combine Wald ratio together in fixed effect meta-analysis, where the weight of each ratio is the inverse of the variance of the SNP-outcome association. The IVW method provides the most precise and robust estimates when three pivotal assumptions regarding instrumental variables are satisfied (32). MR-Presso, MR-Egger, weighted median, simple mode, and Mode based estimate method were used for sensitivity analysis. Heterogeneity in our analysis was assessed using the Cochran Q test, with a p-value of less than 0.05 deemed significant. A Q value substantially exceeding its degrees of freedom indicates evidence of heterogeneity and suggests the presence of invalid instruments (33). MR-Egger regression was utilized to analyze potential unbalanced horizontal pleiotropy, combining the Wald ratio into a meta-regression with an intercept and slope parameter. This approach estimates the causal effect while adjusting for any directional pleiotropy (34). Leave-one-out analyses were used to verify result reliability. Multivariable MR analyses also utilized five methods (IVW, MR-Egger, MR-Lasso, median, and robust), which used to learn about the causal effect of two or more exposures on an outcome (35, 36). Statistical analyses were performed using R software (version 4.3.1) and packages including TwoSampleMR (37), vroom, MVMR (38), MRPRESSO (39), and others.
Standard IVW analysis showed no convincing effect of genetic predisposition to T2DM on AD, with an odds ratio (OR) of 0.92 [95% confidence interval (CI), 0.80–1.04; p = 0.186]. The MR-Egger and weighted median models, which are more robust to directional pleiotropy, showed similar findings (MR-Egger OR = 0.90; 95%CI, 0.67–1.19; p = 0.448; weighted median OR = 0.91, 95%CI, 0.75–1.11; p = 0.359) compared with the IVW model. This consistency in outcomes was maintained even in the adjustment group (IVW OR = 0.87; 95%CI, 0.75–1.00; p = 0.055). The outcomes in the UK Biobank database were similarly concluded (IVW p = 0.290; MR-Egger p = 0.295; weighted median p = 0.412). The results are tabulated for further review (Figures 2, 3; Supplementary Tables S4, S7).
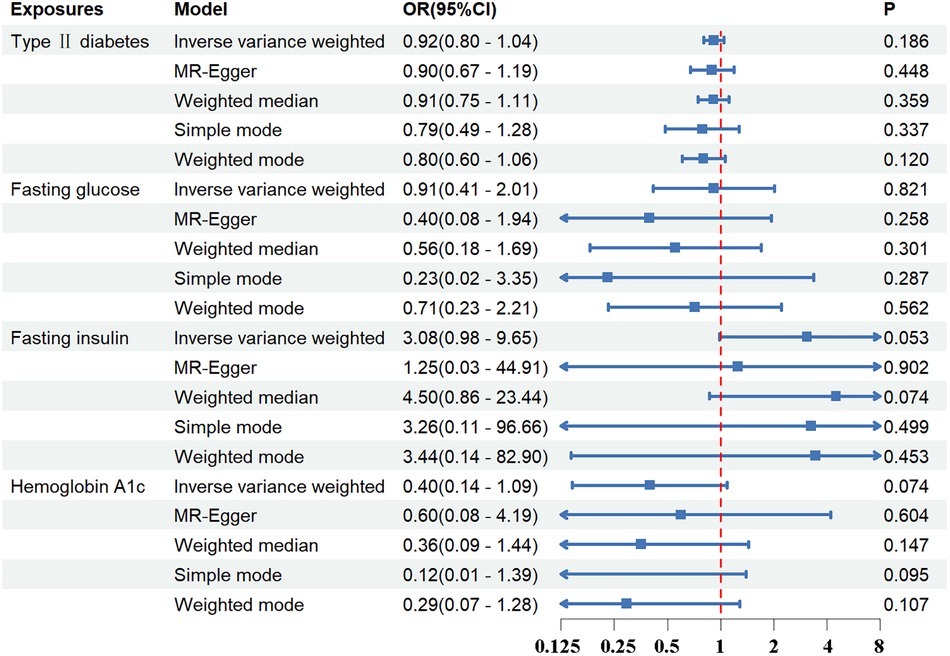
Figure 2 The association between exposures and aortic dissection using the inverse variance weighted, MR-egger, weighted median, simple mode, weighted mode method. OR, odds ratio; CI, confidence interval; p, probability value.
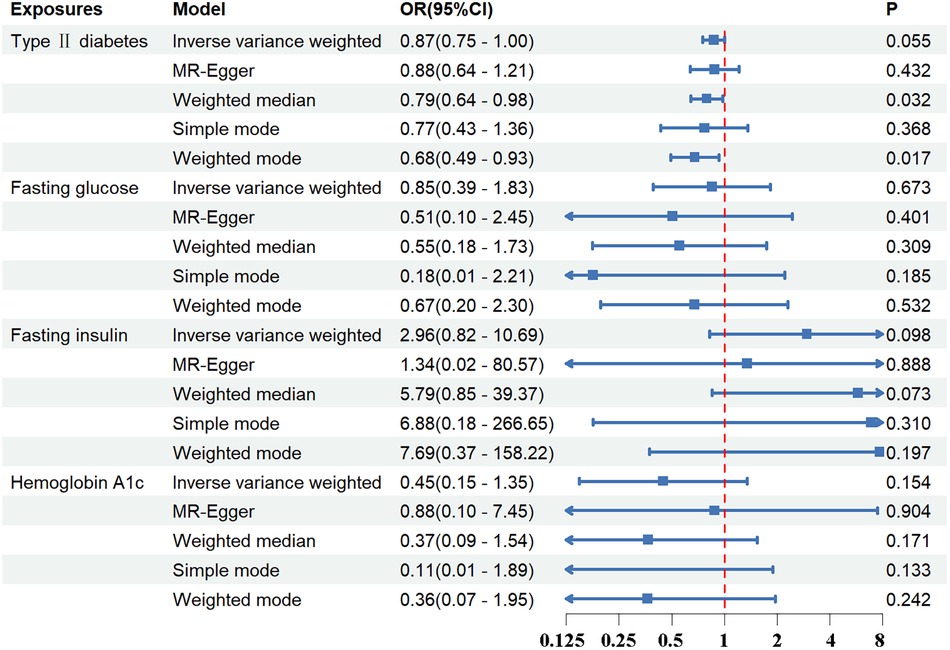
Figure 3 The association between exposures adjustment groups and aortic dissection using the inverse variance weighted, MR-egger, weighted median, simple mode, weighted mode method. OR, odds ratio; CI, confidence interval; p, probability value.
Through Cochran Q test, it was found that there was no significant heterogeneity among SNPs (Supplementary Table S5). Through MR-Egger regression analysis, it is confirmed that there is no significant horizontal pleiotropy in the above analysis data (Supplementary Table S6). A comprehensive sensitivity analysis, facilitated by the leave-one-out method, affirmed the stability of the results, indicating that the exclusion of any individual SNP would not materially influence the overall conclusion (Supplementary Figure S2). For an enhanced visual representation and interpretation of the data, scatter and funnel plots have been provided (Supplementary Figure S1), and the forest plots were presented in Supplementary Figure S2.
Regarding FG, FI, and HbA1c levels, the standard IVW analysis did not reveal a significant impact on AD susceptibility (FG: OR = 0.91; 95%CI, 0.41–2.01; p = 0.821; FI: OR = 3.08; 95%CI, 0.98–9.65; p = 0.053; HbA1c: OR = 0.40; 95%CI, 0.14–1.09; p = 0.074) (Figures 2, 3; Supplementary Tables S4, S7).
The Cochran Q test revealed significant heterogeneity within HbA1c and the primitive group of FG, while other SNP groups displayed no notable heterogeneity (Supplementary Table S5). Additionally, the data analysis did not indicate significant horizontal pleiotropy (Supplementary Table S6). Sensitivity analysis, conducted via the leave-one-out method, suggested the overall conclusion remained stable when any given SNP was omitted from the study (Supplementary Figures S4, S6, S8). Comprehensive visualizations of the study's findings, including scatter plots and funnel plots, are depicted in Supplementary Figures S3, S5, S7, while detailed forest plots are illustrated in Supplementary Figures S4, S6, S8.
A comprehensive two-sample MR study was conducted to identify confounding factors and it was found that SBP, DBP, PP, TG, insomnia, napping, daytime sleepiness, leisure screen time, and smoking initiation were positively correlated with T2DM. Conversely, HDL-C, LDL-C, TC, educational level, annual household income, and the TDI were negatively correlated with T2DM. SBP, DBP, age of smoking initiation, smoking cessation, and environmental stress and adversity were positively correlated with AD, whereas PP and MVPA were negatively correlated with AD (Figure 4; Supplementary Tables S4, S8).
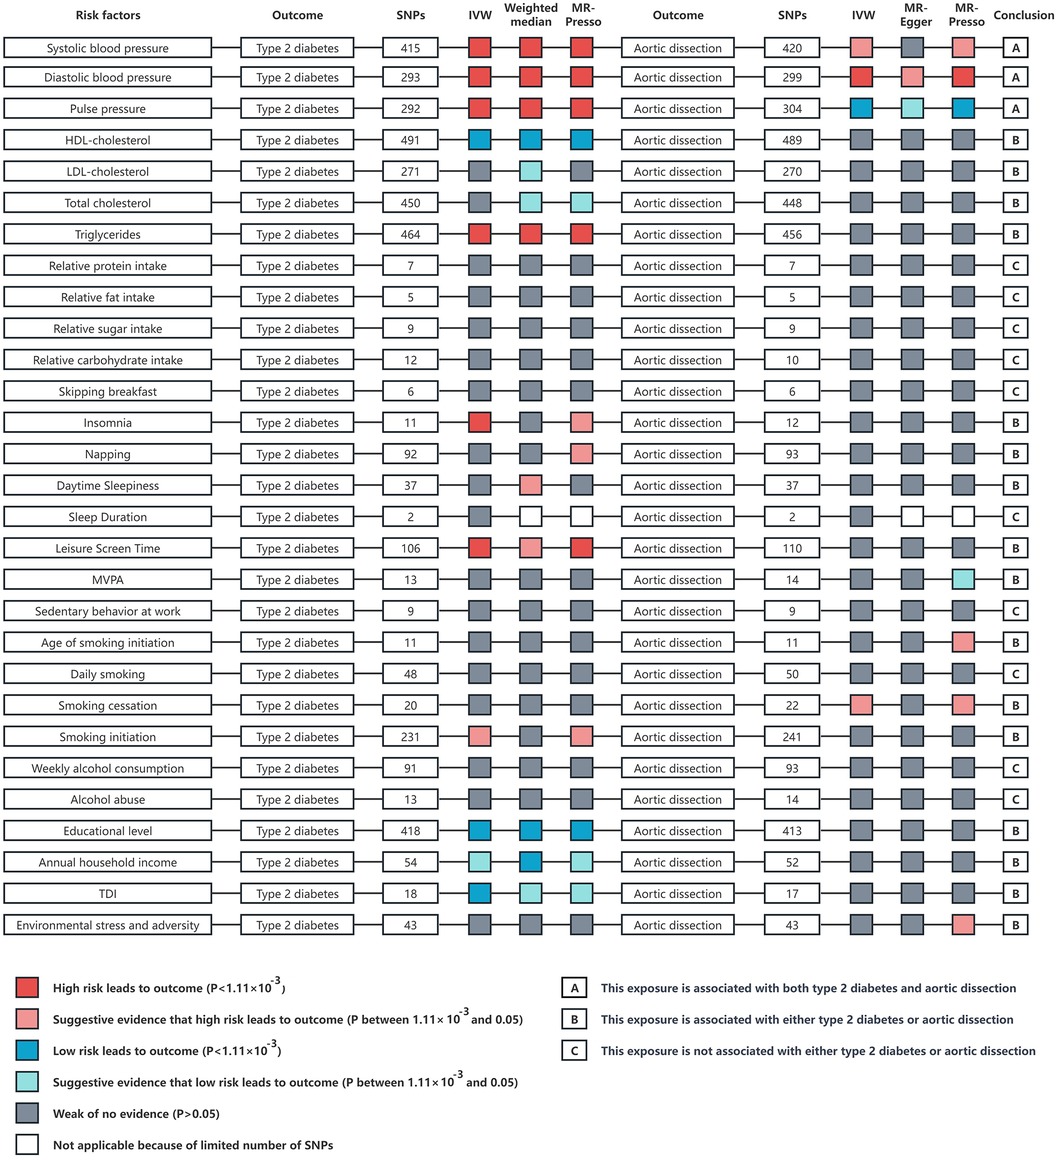
Figure 4 An overview of the Mendelian randomization study results on risk factors such as blood pressure, blood lipids, diet, sleep, physical activity, smoking, alcohol consumption, socioeconomic factors, and environmental stress in relation to type 2 diabetes and aortic dissection. The analysis methods include inverse variance weighted, weighted median, and MR-PRESSO analysis. IVW, inverse variance weighted; p, probability value; HDL, high density lipoprotein; LDL, low density lipoprotein; MVPA, moderate to vigorous intensity physical activity during leisure time; TDI, townsend deprivation index.
In light of the aforementioned findings, we conducted multivariate MR analysis using SBP, DBP, and PP as confounding factors alongside the exposure variables. Considering that PP is essentially determined by both SBP and DBP, we repeated the multivariate MR analysis using only SBP and DBP as confounding factors with the exposure variables. This approach was adopted to prevent the introduction of bias.
The results demonstrated that T2DM, FG, FI, and HbA1c did not exhibit a significant correlation with AD in both instances of the multivariate MR studies (Figure 5; Supplementary Table S8).
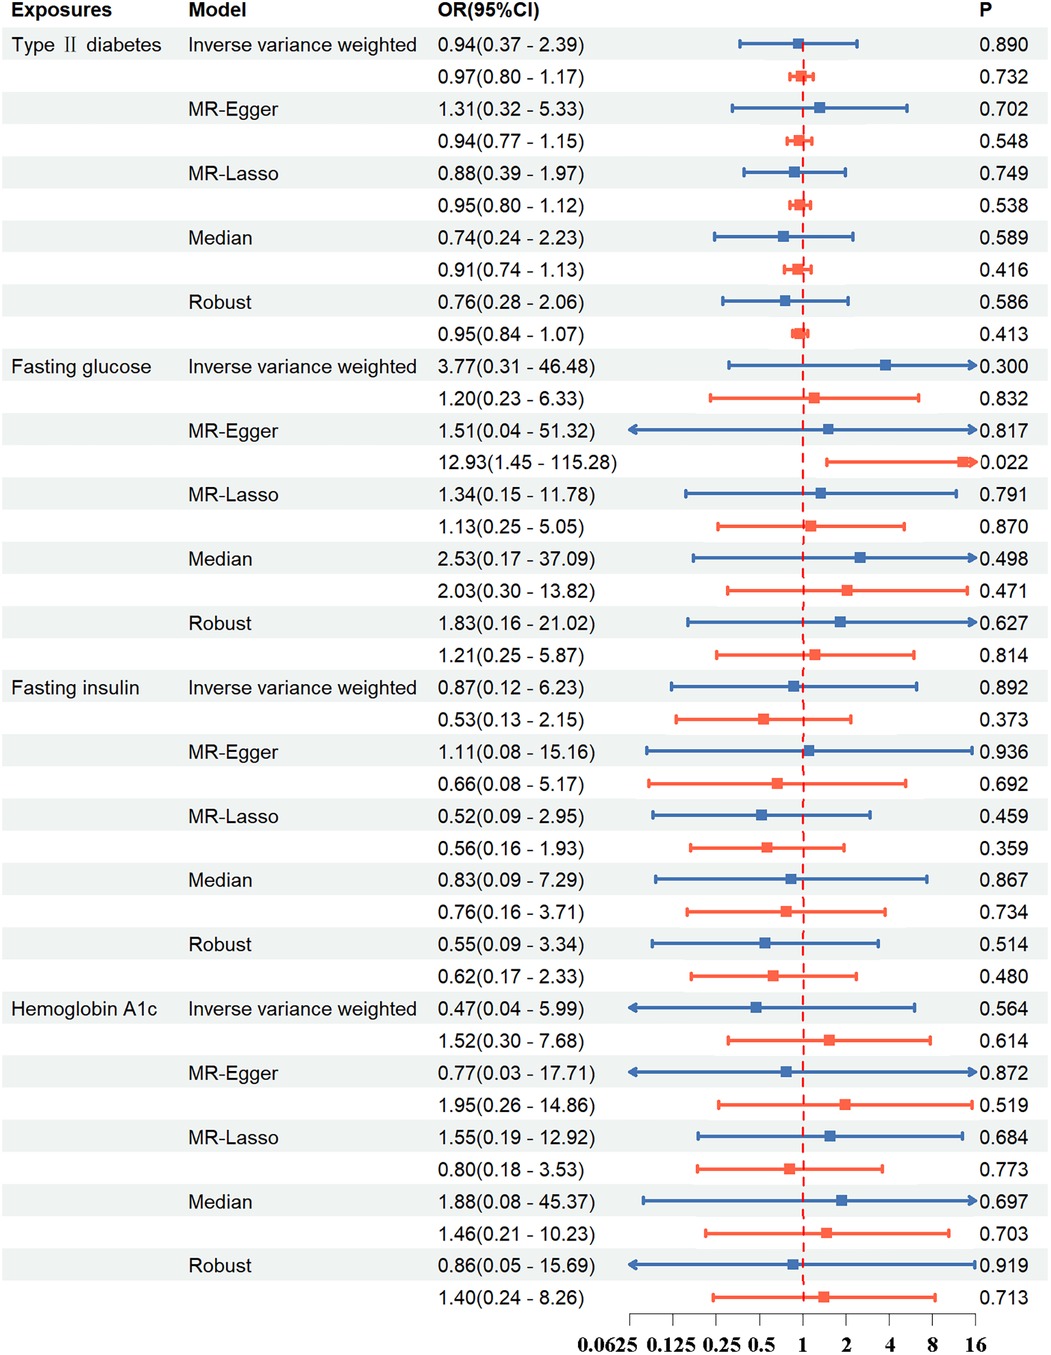
Figure 5 In the multivariable MR study, the association between exposure and aortic dissection was investigated using methods such as inverse variance weighted, MR-egger, MR-lasso, median, and robust. Blue line: Exposures include type 2 diabetes, systolic blood pressure, diastolic blood pressure, pulse pressure; Red line: Exposures include type 2 diabetes, systolic blood pressure, diastolic blood pressure. OR, odds ratio; CI, confidence interval; p, probability value.
The robustness of the IVs was further assessed against CAD to confirm whether it yielded significant positive associations as previously established. Genetic liability to T2DM and glycemic traits was significantly associated with CAD under IVW models (T2DM: OR = 1.12; 95%CI, 1.08–1.16; p < 0.001; FG: OR = 1.26; 95%CI, 1.04–1.53; p = 0.018; FI: OR = 1.91; 95%CI, 1.31–2.79; p < 0.001; HbA1c: OR = 1.44; 95%CI, 1.09–1.90; p = 0.010) (Supplementary Table S4). Comprehensive visualizations of the study's findings, including scatter plots and funnel plots, are depicted in Supplementary Figures S9, S10.
Our MR study suggests that there is no significant association between the genetic predisposition to T2DM and AD. Even after adjusting for potential confounders, such as hypertension, the results were steadfast, underscoring the robustness of our conclusions. In the realm of FG, FI, and HbA1c levels, our study did not identify any causal relationships with AD incidence. These findings present a stark contrast to previous observational studies, which have consistently indicated a substantial negative correlation between T2DM and AD.
T2DM, known for increasing the risk of peripheral, coronary, and cerebrovascular diseases, has paradoxically been linked with a lower risk of aortic aneurysm and dissection. The first evidence of this inverse relationship appeared in 1997, showing fewer cases of AAA in diabetic individuals (40). Despite differences between thoracic and abdominal aortic diseases, this finding sparked interest in the diabetes-aortic disease link. Prakash's analysis of the Nationwide Inpatient Sample (NIS) data confirmed diabetes's association with reduced AD hospitalizations (41), a conclusion echoed by recent studies (5, 6, 42–44). However, these studies often rely on self-reported T2DM data and focus predominantly on hospitalized patients, which may introduce selection bias and obscure the true prevalence of T2DM in AD patients. The inherent limitations in observational studies, like residual confounders, challenge establishing a clear causal link between these diseases. This highlights the value of MR studies in delineating the causal relationships between T2DM and aortic diseases.
Aortic disease is distinctly divided at the ligamentum arteriosum. Above this, the aorta in aneurysm disease typically shows a smooth, non-calcified surface with a strong genetic predisposition. Below it, the aorta often presents an irregular, calcified, arteriosclerotic profile, influenced by traditional risk factors (45). Atherosclerosis and hypertension are key factors in descending thoracic aortic aneurysm and AAA development (46, 47). Conversely, ascending thoracic aortic aneurysm and dissection are frequently linked to genetic factors like Marfan's syndrome (45), as well as Ehlers-Danlos syndrome, Loeys-Dietz syndrome, bicuspid aortic valve, and familial AD (48). Given these distinctions, it's crucial to recognize that aortic diseases are heterogeneous. Thoracic, descending, and abdominal aortic diseases each have unique physiological and genetic characteristics. Therefore, applying mechanisms of T2DM's influence on abdominal aortic lesions to AD may not be accurate. A nuanced, comprehensive approach is needed to understand the complex interactions and causal relationships in these varied aortic conditions.
Previous clinical and basic research suggest that diabetes may affect the occurrence and progression of AD through several mechanisms. T2DM may modify the aortic wall's biological structure, as hyperglycemia promotes collagen cross-linking in the aortic media, enhancing resistance to proteolysis and reducing matrix metalloproteinases (MMPs) secretion, key factors in aortic aneurysm development. Additionally, T2DM's inhibition of plasmin, an MMP activator, could lessen aortic wall degradation (49), aligning with observations of thicker aortic walls in diabetics (46). However, some studies report increased MMP activity, particularly MMP-1, MMP-2, and MMP-9, with higher blood glucose levels, which could counteract any protective effect of diabetes against AD (50). Advanced glycation end products (AGEs) accumulation, another consequence of high glucose levels, leads to cross-linking in the extracellular matrix, stiffening the aortic wall, which could be protective against AD (9, 51–53). On the other hand, increased AGEs and their receptors (RAGEs) may promote inflammation, contributing to aortic disease (54). In complex pathophysiological environments such as lesioned aortic walls, not all data can be expected to be consistently concordant.
Beyond diabetes-induced hyperglycemia, other factors may affect AD occurrence. Diabetes medications, like thiazolidinediones and metformin, could protect against AD due to their role in reducing MMP expression in the aortic wall (55, 56). Insulin resistance (IR) is another potential risk factor. Clinical studies, mouse models, and cellular research indicate that IR triggers vascular smooth muscle cells to switch from contractile to synthetic phenotypes, contributing to AD development (57). In older adults without diabetes, IR has been linked to aortic stiffness, a condition that might alter hemodynamics and promote AD (58). Furthermore, diabetic patients often are subject to heightened attention to blood pressure management and other secondary preventive strategies. Each of the above factors has the potential to influence the occurrence of AD independently.
We note that Weizong Zhang et al. conducted a MR study on the association between T2DM and AD (59). This study utilized 26 diabetes datasets to confirm that there is no causal relationship between the genetic susceptibility to T2DM and AD. Compared to the aforementioned study, our research has the following advantages: Given the significant racial differences in genetic characteristics, our data set consists exclusively of individuals of European ancestry, with a sample size larger than that in the previous study. For outcome data, we validated our findings using the UK Biobank data of non-Finnish individuals and used coronary heart disease data from CARDIoGRAMplusC4D as a positive control to verify the reliability of our instrumental variables. Furthermore, to enhance the comprehensiveness of our analysis, we also included important biomarkers such as FG, FI, and HbA1c as exposures to analyze their impact on aortic dissection. It is important to note that even in MR studies, it is challenging to avoid confounding factors. Therefore, we analyzed 29 variables, including hypertension, which could introduce confounding bias, and conducted multivariable Mendelian randomization to exclude potential interferences. However, the study also faces limitations. Privacy concerns and the lack of detailed data in public GWAS databases impeded our ability to differentiate AD patients by gender, type, or syndromic status. Additionally, the relative rarity of AD limits the categorization of these factors in public GWAS databases, impacting our analysis. A key limitation is our reliance on genetic data, posing challenges in discerning specific impacts of late-onset exposures and their compensatory effects. Assessing the impact of diabetes metabolic products and hypoglycemic treatment on AD is difficult. While MR reduces confounding effects, unidentified physiological pathways in AD's complex pathology could introduce biases. The robustness of MR depends on large sample sizes and comprehensive genetic data, yet the infrequency of AD in the general population limits data availability. Moreover, as our study is based on a European demographic, the findings might not be universally applicable.
In summary, this MR study indicates that the genetic susceptibility to T2DM does not confer a protective effect against AD. These findings contrast with previous observational evidences, which suggest a protective effect of T2DM. This discrepancy underscores the need for further comprehensive research, particularly focused on exploring the potential preventative role of common T2DM treatment modalities in AD. Unraveling the intricate relationships between T2DM and AD is a crucial step that not only enriches our understanding of AD's complex pathobiology but also paves the way for innovative therapeutic interventions for this elusive disease.
The datasets presented in this study can be found in online repositories. The names of the repository/repositories and accession number(s) can be found in the article/supplementary Material.
Ethical approval was not required for the study involving humans in accordance with the local legislation and institutional requirements. Written informed consent to participate in this study was not required from the participants or the participants’ legal guardians/next of kin in accordance with the national legislation and the institutional requirements.
YS: Conceptualization, Data curation, Formal Analysis, Methodology, Software, Validation, Visualization, Writing – original draft, Writing – review & editing. DD: Methodology, Supervision, Visualization, Writing – original draft. JZ: Formal Analysis, Methodology, Software, Writing – original draft, Writing – review & editing. LZ: Methodology, Supervision, Writing – original draft. BZ: Supervision, Writing – original draft. YZ: Formal Analysis, Writing – original draft. TS: Validation, Writing – original draft. NW: Supervision, Writing – review & editing.
The author(s) declare financial support was received for the research, authorship, and/or publication of this article. The article is supported by the Tianjin Natural Science Foundation (Project No.: 21JCYBJC00900).
We extend our gratitude to the FinnGen, DIAMANTE, MAGIC, UK Biobank databases, and the Pan-UKB team for providing access to their publicly available data.
The authors declare that the research was conducted in the absence of any commercial or financial relationships that could be construed as a potential conflict of interest.
All claims expressed in this article are solely those of the authors and do not necessarily represent those of their affiliated organizations, or those of the publisher, the editors and the reviewers. Any product that may be evaluated in this article, or claim that may be made by its manufacturer, is not guaranteed or endorsed by the publisher.
The Supplementary Material for this article can be found online at: https://www.frontiersin.org/articles/10.3389/fcvm.2024.1382702/full#supplementary-material
1. Clouse WD, Hallett JJ, Schaff HV, Spittell PC, Rowland CM, Ilstrup DM, et al. Acute aortic dissection: population-based incidence compared with degenerative aortic aneurysm rupture. Mayo Clin Proc. (2004) 79:176–80. doi: 10.4065/79.2.176
2. Olsson C, Thelin S, Stahle E, Ekbom A, Granath F. Thoracic aortic aneurysm and dissection: increasing prevalence and improved outcomes reported in a nationwide population-based study of more than 14,000 cases from 1987 to 2002. Circulation. (2006) 114:2611–8. doi: 10.1161/CIRCULATIONAHA.106.630400
3. Howard DP, Banerjee A, Fairhead JF, Perkins J, Silver LE, Rothwell PM. Population-based study of incidence and outcome of acute aortic dissection and premorbid risk factor control: 10-year results from the Oxford vascular study. Circulation. (2013) 127:2031–7. doi: 10.1161/CIRCULATIONAHA.112.000483
4. McClure RS, Brogly SB, Lajkosz K, McClintock C, Payne D, Smith HN, et al. Economic burden and healthcare resource use for thoracic aortic dissections and thoracic aortic aneurysms-a population-based cost-of-illness analysis. J Am Heart Assoc. (2020) 9:e14981. doi: 10.1161/JAHA.119.014981
5. Theivacumar NS, Stephenson MA, Mistry H, Valenti D. Diabetics are less likely to develop thoracic aortic dissection: a 10-year single-center analysis. Ann Vasc Surg. (2014) 28:427–32. doi: 10.1016/j.avsg.2013.03.024
6. Avdic T, Franzen S, Zarrouk M, Acosta S, Nilsson P, Gottsater A, et al. Reduced long-term risk of aortic aneurysm and aortic dissection among individuals with type 2 diabetes mellitus: a nationwide observational study. J Am Heart Assoc. (2018) 7:e007618. doi: 10.1161/JAHA.117.007618
7. Takagi H, Umemoto T. Negative association of diabetes with thoracic aortic dissection and aneurysm. Angiology. (2017) 68:216–24. doi: 10.1177/0003319716647626
8. Li S, Zhang L, Zhu G, Feng R, Zhou J, Jing Z. Diabetes mellitus lowers the risk of aortic dissection: a systematic review and meta-analysis. Ann Vasc Surg. (2021) 74:209–19. doi: 10.1016/j.avsg.2020.12.016
9. Golledge J, Karan M, Moran CS, Muller J, Clancy P, Dear AE, et al. Reduced expansion rate of abdominal aortic aneurysms in patients with diabetes may be related to aberrant monocyte-matrix interactions. Eur Heart J. (2008) 29:665–72. doi: 10.1093/eurheartj/ehm557
10. Golledge J, Morris DR, Pinchbeck J, Rowbotham S, Jenkins J, Bourke M, et al. Editor’s choice—metformin prescription is associated with a reduction in the combined incidence of surgical repair and rupture related mortality in patients with abdominal aortic aneurysm. Eur J Vasc Endovasc. (2019) 57:94–101. doi: 10.1016/j.ejvs.2018.07.035
11. Davies NM, Holmes MV, Davey SG. Reading Mendelian randomisation studies: a guide, glossary, and checklist for clinicians. BMJ. (2018) 362:k601. doi: 10.1136/bmj.k601
12. Pingault JB, O'Reilly PF, Schoeler T, Ploubidis GB, Rijsdijk F, Dudbridge F. Using genetic data to strengthen causal inference in observational research. Nat Rev Genet. (2018) 19:566–80. doi: 10.1038/s41576-018-0020-3
13. Morris DR, Jones GT, Holmes MV, Bown MJ, Bulbulia R, Singh TP, et al. Genetic predisposition to diabetes and abdominal aortic aneurysm: a two stage Mendelian randomisation study. Eur J Vasc Endovasc. (2022) 63:512–9. doi: 10.1016/j.ejvs.2021.10.038
14. Zhang Y, Li Y, Dai X, Lin H, Ma L. Type 2 diabetes has a protective causal association with thoracic aortic aneurysm: a Mendelian randomization study. Diabetol Metab Syndr. (2023) 15:120. doi: 10.1186/s13098-023-01101-1
15. Lawlor DA. Commentary: two-sample Mendelian randomization: opportunities and challenges. Int J Epidemiol. (2016) 45:908–15. doi: 10.1093/ije/dyw127
16. Ross S, Gerstein HC, Eikelboom J, Anand SS, Yusuf S, Pare G. Mendelian randomization analysis supports the causal role of dysglycaemia and diabetes in the risk of coronary artery disease. Eur Heart J. (2015) 36:1454–62. doi: 10.1093/eurheartj/ehv083
17. Mahajan A, Taliun D, Thurner M, Robertson NR, Torres JM, Rayner NW, et al. Fine-mapping type 2 diabetes loci to single-variant resolution using high-density imputation and islet-specific epigenome maps. Nat Genet. (2018) 50:1505–13. doi: 10.1038/s41588-018-0241-6
18. Kanoni S, Graham SE, Wang Y, Surakka I, Ramdas S, Zhu X, et al. Implicating genes, pleiotropy, and sexual dimorphism at blood lipid loci through multi-ancestry meta-analysis. Genome Biol. (2022) 23:268. doi: 10.1186/s13059-022-02837-1
19. Meddens S, de Vlaming R, Bowers P, Burik C, Linner RK, Lee C, et al. Genomic analysis of diet composition finds novel loci and associations with health and lifestyle. Mol Psychiatry. (2021) 26:2056–69. doi: 10.1038/s41380-020-0697-5
20. Okbay A, Wu Y, Wang N, Jayashankar H, Bennett M, Nehzati SM, et al. Polygenic prediction of educational attainment within and between families from genome-wide association analyses in 3 million individuals. Nat Genet. (2022) 54:437–49. doi: 10.1038/s41588-022-01016-z
21. Dashti HS, Merino J, Lane JM, Song Y, Smith CE, Tanaka T, et al. Genome-wide association study of breakfast skipping links clock regulation with food timing. Am J Clin Nutr. (2019) 110:473–84. doi: 10.1093/ajcn/nqz076
22. Dashti HS, Daghlas I, Lane JM, Huang Y, Udler MS, Wang H, et al. Genetic determinants of daytime napping and effects on cardiometabolic health. Nat Commun. (2021) 12:900. doi: 10.1038/s41467-020-20585-3
23. Wang H, Lane JM, Jones SE, Dashti HS, Ollila HM, Wood AR, et al. Genome-wide association analysis of self-reported daytime sleepiness identifies 42 loci that suggest biological subtypes. Nat Commun. (2019) 10:3503. doi: 10.1038/s41467-019-11456-7
24. Jones SE, van Hees VT, Mazzotti DR, Marques-Vidal P, Sabia S, van der Spek A, et al. Genetic studies of accelerometer-based sleep measures yield new insights into human sleep behaviour. Nat Commun. (2019) 10:1585. doi: 10.1038/s41467-019-09576-1
25. Watanabe K, Jansen PR, Savage JE, Nandakumar P, Wang X, Hinds DA, et al. Genome-wide meta-analysis of insomnia prioritizes genes associated with metabolic and psychiatric pathways. Nat Genet. (2022) 54:1125–32. doi: 10.1038/s41588-022-01124-w
26. Wang Z, Emmerich A, Pillon NJ, Moore T, Hemerich D, Cornelis MC, et al. Genome-wide association analyses of physical activity and sedentary behavior provide insights into underlying mechanisms and roles in disease prevention. Nat Genet. (2022) 54:1332–44. doi: 10.1038/s41588-022-01165-1
27. Nagel M, Speed D, van der Sluis S, Ostergaard SD. Genome-wide association study of the sensitivity to environmental stress and adversity neuroticism cluster. Acta Psychiat Scand. (2020) 141:476–8. doi: 10.1111/acps.13155
28. Saunders G, Wang X, Chen F, Jang SK, Liu M, Wang C, et al. Genetic diversity fuels gene discovery for tobacco and alcohol use. Nature. (2022) 612:720–4. doi: 10.1038/s41586-022-05477-4
29. Thijssen AB, Dick DM, Posthuma D, Savage JE. Investigating genetically stratified subgroups to better understand the etiology of alcohol misuse. Mol Psychiatry. (2023) 28(10):4225–33. doi: 10.1038/s41380-023-02174-0
30. Burgess S, Thompson SG. Avoiding bias from weak instruments in Mendelian randomization studies. Int J Epidemiol. (2011) 40:755–64. doi: 10.1093/ije/dyr036
31. Nelson CP, Goel A, Butterworth AS, Kanoni S, Webb TR, Marouli E, et al. Association analyses based on false discovery rate implicate new loci for coronary artery disease. Nat Genet. (2017) 49:1385–91. doi: 10.1038/ng.3913
32. Burgess S, Butterworth A, Thompson SG. Mendelian randomization analysis with multiple genetic variants using summarized data. Genet Epidemiol. (2013) 37:658–65. doi: 10.1002/gepi.21758
33. Greco MF, Minelli C, Sheehan NA, Thompson JR. Detecting pleiotropy in Mendelian randomisation studies with summary data and a continuous outcome. Stat Med. (2015) 34:2926–40. doi: 10.1002/sim.6522
34. Bowden J, Davey SG, Burgess S. Mendelian randomization with invalid instruments: effect estimation and bias detection through egger regression. Int J Epidemiol. (2015) 44:512–25. doi: 10.1093/ije/dyv080
35. Burgess S, Thompson SG. Multivariable Mendelian randomization: the use of pleiotropic genetic variants to estimate causal effects. Am J Epidemiol. (2015) 181:251–60. doi: 10.1093/aje/kwu283
36. Rees J, Wood AM, Burgess S. Extending the mr-egger method for multivariable Mendelian randomization to correct for both measured and unmeasured pleiotropy. Stat Med. (2017) 36:4705–18. doi: 10.1002/sim.7492
37. Hemani G, Zheng J, Elsworth B, Wade KH, Haberland V, Baird D, et al. The mr-base platform supports systematic causal inference across the human phenome. Elife. (2018) 7:e34408. doi: 10.7554/eLife.34408
38. Sanderson E, Davey SG, Windmeijer F, Bowden J. An examination of multivariable Mendelian randomization in the single-sample and two-sample summary data settings. Int J Epidemiol. (2019) 48:713–27. doi: 10.1093/ije/dyy262
39. Verbanck M, Chen CY, Neale B, Do R. Detection of widespread horizontal pleiotropy in causal relationships inferred from Mendelian randomization between complex traits and diseases. Nat Genet. (2018) 50:693–8. doi: 10.1038/s41588-018-0099-7
40. Lederle FA, Johnson GR, Wilson SE, Chute EP, Littooy FN, Bandyk D, et al. Prevalence and associations of abdominal aortic aneurysm detected through screening. Aneurysm detection and management (ADAM) veterans affairs cooperative study group. Ann Intern Med. (1997) 126:441–9. doi: 10.7326/0003-4819-126-6-199703150-00004
41. Prakash SK, Pedroza C, Khalil YA, Milewicz DM. Diabetes and reduced risk for thoracic aortic aneurysms and dissections: a nationwide case-control study. J Am Heart Assoc. (2012) 1(2):jah3–e000323. doi: 10.1161/JAHA.111.000323
42. He X, Liu X, Liu W, Wang B, Liu Y, Li Z, et al. Association between diabetes and risk of aortic dissection: a case-control study in a Chinese population. PLoS One. (2015) 10:e142697. doi: 10.1371/journal.pone.0142697
43. Jimenez-Trujillo I, Gonzalez-Pascual M, Jimenez-Garcia R, Hernandez-Barrera V, de Miguel-Yanes JM, Mendez-Bailon M, et al. Type 2 diabetes mellitus and thoracic aortic aneurysm and dissection: an observational population-based study in Spain from 2001 to 2012. Medicine. (2016) 95:e3618. doi: 10.1097/MD.0000000000003618
44. Suzuki Y, Kaneko H, Yano Y, Okada A, Itoh H, Ueno K, et al. Dose-dependent relationship of blood pressure and glycaemic status with risk of aortic dissection and aneurysm. Eur J Prev Cardiol. (2022) 29:2338–46. doi: 10.1093/eurjpc/zwac205
45. Elefteriades JA, Farkas EA. Thoracic aortic aneurysm clinically pertinent controversies and uncertainties. J Am Coll Cardiol. (2010) 55:841–57. doi: 10.1016/j.jacc.2009.08.084
46. Astrand H, Ryden-Ahlgren A, Sundkvist G, Sandgren T, Lanne T. Reduced aortic wall stress in diabetes mellitus. Eur J Vasc Endovasc. (2007) 33:592–8. doi: 10.1016/j.ejvs.2006.11.011
47. Zarins CK, Xu C, Glagov S. Atherosclerotic enlargement of the human abdominal aorta. Atherosclerosis. (2001) 155:157–64. doi: 10.1016/S0021-9150(00)00527-X
48. Danyi P, Elefteriades JA, Jovin IS. Medical therapy of thoracic aortic aneurysms: are we there yet? Circulation. (2011) 124:1469–76. doi: 10.1161/CIRCULATIONAHA.110.006486
49. Dua MM, Miyama N, Azuma J, Schultz GM, Sho M, Morser J, et al. Hyperglycemia modulates plasminogen activator inhibitor-1 expression and aortic diameter in experimental aortic aneurysm disease. Surgery. (2010) 148:429–35. doi: 10.1016/j.surg.2010.05.014
50. Death AK, Fisher EJ, McGrath KC, Yue DK. High glucose alters matrix metalloproteinase expression in two key vascular cells: potential impact on atherosclerosis in diabetes. Atherosclerosis. (2003) 168:263–9. doi: 10.1016/S0021-9150(03)00140-0
51. Shantikumar S, Ajjan R, Porter KE, Scott DJ. Diabetes and the abdominal aortic aneurysm. Eur J Vasc Endovasc. (2010) 39:200–7. doi: 10.1016/j.ejvs.2009.10.014
52. Aronson D. Cross-linking of glycated collagen in the pathogenesis of arterial and myocardial stiffening of aging and diabetes. J Hypertens. (2003) 21:3–12. doi: 10.1097/00004872-200301000-00002
53. Takagi H. Association of diabetes mellitus with presence, expansion, and rupture of abdominal aortic aneurysm: “curiouser and curiouser!” cried alice. Semin Vasc Surg. (2016) 29:18–26. doi: 10.1053/j.semvascsurg.2016.06.003
54. Prasad K, Sarkar A, Zafar MA, Shoker A, Moselhi HE, Tranquilli M, et al. Advanced glycation end products and its soluble receptors in the pathogenesis of thoracic aortic aneurysm. Aorta. (2016) 4:1–10. doi: 10.12945/j.aorta.2016.15.018
55. Dattani N, Sayers RD, Bown MJ. Diabetes mellitus and abdominal aortic aneurysms: a review of the mechanisms underlying the negative relationship. Diab Vasc Dis Res. (2018) 15:367–74. doi: 10.1177/1479164118780799
56. De Rango P, Farchioni L, Fiorucci B, Lenti M. Diabetes and abdominal aortic aneurysms. Eur J Vasc Endovasc. (2014) 47:243–61. doi: 10.1016/j.ejvs.2013.12.007
57. Zheng H, Qiu Z, Chai T, He J, Zhang Y, Wang C, et al. Insulin resistance promotes the formation of aortic dissection by inducing the phenotypic switch of vascular smooth muscle cells. Front Cardiovasc Med. (2021) 8:732122. doi: 10.3389/fcvm.2021.732122
58. Poon AK, Meyer ML, Tanaka H, Selvin E, Pankow J, Zeng D, et al. Association of insulin resistance, from mid-life to late-life, with aortic stiffness in late-life: the atherosclerosis risk in communities study. Cardiovasc Diabetol. (2020) 19:11. doi: 10.1186/s12933-020-0986-y
Keywords: diabetes, aortic dissection, Mendelian randomisation, genome-wide association study, epidemiology
Citation: Sun Y, Du D, Zhang J, Zhao L, Zhang B, Zhang Y, Song T and Wu N (2024) Genetic predisposition to type 2 diabetes mellitus and aortic dissection: a Mendelian randomisation study. Front. Cardiovasc. Med. 11: 1382702. doi: 10.3389/fcvm.2024.1382702
Received: 29 February 2024; Accepted: 5 July 2024;
Published: 22 July 2024.
Edited by:
Xuerui Tan, First Affiliated Hospital of Shantou University Medical College, ChinaReviewed by:
Ravindra Pal Singh, Gujarat Biotechnology University, India© 2024 Sun, Du, Zhang, Zhao, Zhang, Zhang, Song and Wu. This is an open-access article distributed under the terms of the Creative Commons Attribution License (CC BY). The use, distribution or reproduction in other forums is permitted, provided the original author(s) and the copyright owner(s) are credited and that the original publication in this journal is cited, in accordance with accepted academic practice. No use, distribution or reproduction is permitted which does not comply with these terms.
*Correspondence: Naishi Wu, d25zaDY4QDEyNi5jb20=
†These authors have contributed equally to this work and share first authorship
Disclaimer: All claims expressed in this article are solely those of the authors and do not necessarily represent those of their affiliated organizations, or those of the publisher, the editors and the reviewers. Any product that may be evaluated in this article or claim that may be made by its manufacturer is not guaranteed or endorsed by the publisher.
Research integrity at Frontiers
Learn more about the work of our research integrity team to safeguard the quality of each article we publish.