 Kazuhiro Fujiyoshi1Minako Yamaoka-Tojo2*Kanako Fujiyoshi2Takumi Komatsu3Jun Oikawa4Kunio Kashino5Hitonobu Tomoike5Junya Ako1
- 1Department of Cardiovascular Medicine, Kitasato University School of Medicine, Sagamihara, Japan
- 2Department of Rehabilitation, Kitasato University School of Allied Health Sciences, Sagamihara, Japan
- 3Department of Functional Restoration Science, Kitasato University Graduate School of Medical Sciences, Sagamihara, Japan
- 4Department of Kitasato Clinical Research Center, Kitasato University School of Medicine, Sagamihara, Japan
- 5Bio-Medical Informatics Research Center, NTT Basic Research Laboratories, Atsugi, Japan
Background: Auscultatory features of heart sounds (HS) in patients with heart failure (HF) have been studied intensively. Recent developments in digital and electrical devices for auscultation provided easy listening chances to recognize peculiar sounds related to diastolic HS such as S3 or S4. This study aimed to quantitatively assess HS by acoustic measures of intensity (dB) and audio frequency (Hz).
Methods: Forty consecutive patients aged between 46 and 87 years (mean age, 74 years) with chronic cardiovascular disease (CVD) were enrolled in the present study after providing written informed consent during their visits to the Kitasato University Outpatient Clinic. HS were recorded at the fourth intercostal space along the left sternal border using a highly sensitive digital device. Two consecutive heartbeats were quantified on sound intensity (dB) and audio frequency (Hz) at the peak power of each spectrogram of S1–S4 using audio editing and recording application software. The participants were classified into three groups, namely, the absence of HF (n = 27), HF (n = 8), and high-risk HF (n = 5), based on the levels of NT-proBNP < 300, ≥300, and ≥900 pg/ml, respectively, and also the levels of ejection fraction (EF), such as preserved EF (n = 22), mildly reduced EF (n = 12), and reduced EF (n = 6).
Results: The intensities of four components of HS (S1–S4) decreased linearly (p < 0.02–0.001) with levels of body mass index (BMI) (range, 16.2–33.0 kg/m2). Differences in S1 intensity (ΔS1) and its frequency (ΔfS1) between two consecutive beats were non-audible level and were larger in patients with HF than those in patients without HF (ΔS1, r = 0.356, p = 0.024; ΔfS1, r = 0.356, p = 0.024). The cutoff values of ΔS1 and ΔfS1 for discriminating the presence of high-risk HF were 4.0 dB and 5.0 Hz, respectively.
Conclusions: Despite significant attenuations of all four components of HS by BMI, beat-to-beat alterations of both intensity and frequency of S1 were associated with the severity of HF. Acoustic quantification of HS enabled analyses of sounds below the audible level, suggesting that sound analysis might provide an early sign of HF.
1 Introduction
Elevated jugular venous pressure and the presence of a third heart sound precede the onset of heart failure (HF) symptoms by days to months (1). To prevent the clinical worsening of cardiovascular disease (CVD), early identification of HF becomes crucial. There is no doubt that physical examination raises suspicion for HF. Therefore, diastolic heart sounds (HS) such as third sound (S3) or fourth sound (S4) have garnered attention for their clinical significance in the presence of HF (2–4), and classical diagnostic tools have been modernized to assess the clinical significance of diastolic HS (5). However, Marcus et al. (2) found that the presence of an S3 had a sensitivity of 32%–52% and a specificity of 87%–92% and the presence of an S4 scored lower. When an implantable HS sensor was chronically embedded in animal models, the S3 intensity was able to detect elevated left atrial pressure, defined as >25 mmHg, with a sensitivity of 58% and specificity of 90% (6). Using the electro-stethoscope, physicians can recognize not only changes in audible HS but also the presence of S3 and/or S4 equivalent vibrations, which are inaudible to the human ear, during the protodiastolic (2, 3) and presystolic period (4, 7). To understand the acoustic features of HS, we introduced a digital acquisition and processing of HS to minimize subjective differences in audibility or visual recognition of phonocardiograms in patients with CVD. We expected that acoustic quantification of HS on intensity (dB) and frequency (Hz) would enable comparisons among patients with HF as well as with other clinical findings.
2 Methods
2.1 Study participants
The present study design was based on the Cardiovascular Second Prevention Center (CSPC) of the Kitasato University Hospital. Patients who were admitted to this hospital due to acute CVD sought care at the CSPC outpatient clinic to prevent CVD recurrences every other year of their own volition. From this hospital-based cohort in which stableness and chronicity of CVD were ascertained, a cross-sectional single-center exploratory study was designed to assess the clinical usefulness of quantitative HS analyses.
An adequate number of participants were pre-calculated in previous studies describing an association of HF in the general population and patients with CVD (8, 9). Six to eight patients with HF are minimally required for the statistical analysis; however, we expected that forty patients with CVD would be needed for the present analysis. The Kitasato University Hospital Research Ethics Committee approved the present study protocol (Clinical Trial Registration No. B22-060). Between 4 August 2023 and 6 October 2023, 40 consecutive outpatients, aged between 46 and 87 years with chronic CVD, were enrolled after receiving written informed consent from each patient. In the present participants, S3 and S4 were not audible at the outpatient clinic. The mean duration from their discharge of acute illness to the present CSPC visit was 8.9 ± 6.3 years.
2.2 Clinical evaluation and collecting HS
All participants underwent comprehensive clinical evaluations that included medical history updates, blood pressure measurements, electrocardiogram (ECG), echocardiography, chest x-ray, and blood tests on the same day. Blood collection for N-terminal pro-brain natriuretic peptide (NT-proBNP) was also performed during ordinary laboratory tests between 8:30 a.m. and 10:30 a.m. or 1:00 p.m. and 2:20 p.m.
HS collection was performed on the same day or within 17.0 ± 8.1 days, in between a tight schedule of the regular health insurance services using the handheld tri-antler chest piece (BMP-LD3, NTT Basic Research Laboratories, Japan, Figure 1A). This device has four microphones. Each microphone is placed inside the chest piece in each antler to record HS, and the fourth one is inside the housing to record ambient sounds (Figure 1B). BMP-LD3 was designed to attach three chest pieces firmly and easily to the anterior chest wall at the sitting or supine position of the participant per se. When the device was attached to the anterior chest, two chest pieces were perpendicularly placed on the second intercostal space (heart base) and the fourth intercostal space, along the left sternal border (Figure 1C). The last third one was at the apex (Figure 1D). Each patient sat freely in the daily examination room. Sounds from four microphones were recorded for at least 10 s. HS collected through the handheld tri-antler chest piece (BMP-LD3) were saved digitally at a rate of 16 kHz in a memory inside the connecting housing of BMP-LD3 (Figure 1A) (10). The block diagram of the procedure for S1–S4 extractions and their analyses is presented in Supplementary Figure S1.
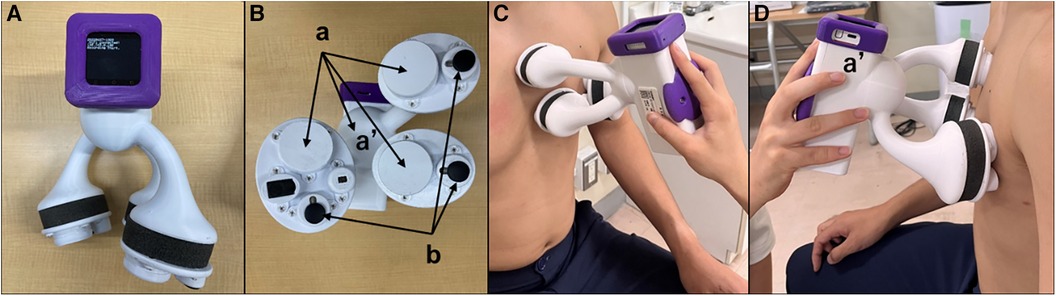
Figure 1. Depiction of handheld tri-antler chest piece to record heart sounds. Front view (A) of BMP-LD3 (handheld tri-antlers chest piece). The back side including four microphones, three of which are inside the chest pieces (a) and one in the connecting box. (b) Three electric terminals for ECG (B). Two microphones attached at the left upper and lower sternal border (C). One microphone attached at apex (D) The fourth microphone (a′) is in the housing (handle) to collect ambient noise used for noise cancellation purposes.
2.3 Analysis of HS
Collected HS were analyzed by the audio editing and recording software (Audacity 3.3.3; Muse Group, Cyprus). Audacity, a sound recording software that is freely available, was used in the study for recording and analyzing HS (11, 12); signals captured through each chest piece were amplified by 30 dB, which was then simply subtracted by the level of the ambient sounds. Although the first (S1) and second sounds (S2) were easily recognized in all cases on the phonocardiogram, S3 and S4 were noted as tiny sound vibrations (Figure 2). To save S3 and S4 correctly, the signals at the fourth intercostal space chest piece along the left sternal border were chosen, and the other two signals at the base and apex chest pieces were used for identifying the timings of S1, S2, S3, and S4. We defined sound vibrations during protodiastole as S3 equivalent (eS3) and those during presystole as S4 equivalent (eS4). S1 is mostly constructed by three peaks from the baseline (13, 14). S2 is constructed by two peaks from the baseline (15, 16). From the end of S2 to the start of eS3, there is a sound-free pause as the early systolic baseline (17). Then, eS3 was defined as shown in Figure 2. eS4 is from the end of the mid-systolic baseline to the start of S1 (2, 4). Thus, the range length was different between the first beat and the second one.
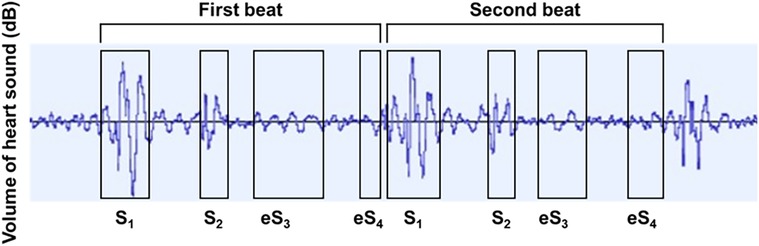
Figure 2. Phonocardiographic tracings in determining S1, S2, eS3, and eS4. S1, first heart sound; S2, second heart sound; eS3, equivalent to third heart sound; eS4, equivalent to the fourth heart sound.
We chose two consecutive beats, which were recorded with clear ECG and with the absence of respiratory noise. On these two beats, the average and their mathematical difference (Δ) of intensity (dB) and audio frequency (Hz) were taken for the analysis of the clinical characteristics of patients. The RR interval was measured by an ECG attached to the device. All measurements were performed by an independent clinical laboratory technologist who was blinded to the clinical features of each patient.
2.4 Definition of heart failure and clinical categories
HF and high-risk HF were defined as NT-proBNP ≥ 300 and ≥900 pg/ml, respectively (9). HF was also categorized on the levels of ejection fraction (EF). HF with reduced EF (HFrEF), mildly reduced EF (HFmrEF), and preserved EF (HFpEF) were defined as left ventricular ejection fraction (LVEF) <40%, 40%–50%, and ≥50%, respectively (18). Ischemic heart disease (IHD) included myocardial infarction, angina pectoris, and vasospastic angina. Atrial fibrillation (AF) was defined as absolute arrhythmia confirmed by ECG. The parameters of the echocardiogram follow the international guidelines for echocardiography (19). Valvular heart diseases were diagnosed by auscultation and echocardiography. The ECG wave graph and explanation of Q, R, and S waves at V1 and V5 of the ECG chest electrode are shown in Supplementary Figure S2. QRS duration was measured from the beginning of the Q wave to the end of the S wave (20). SV1 + RV5 voltage was defined as the sum of the S wave amplitude in V1 and the R wave amplitude in V5 (21). Cardiothoracic ratio (CTR) was defined as the ratio of the transverse dimension of the heart to the chest width measured on a chest radiograph of posteroanterior view (22).
2.5 Statistical analysis
Normally distributed continuous variables are expressed as mean ± standard deviation, whereas non-normally distributed values are expressed as median with interquartile range and were analyzed using Wilcoxon signed-rank test. Continuous variables were analyzed using unpaired t-tests. Categorical variables are reported as number (%) and were analyzed using the chi-squared test. Receiver operating characteristic (ROC) curves were constructed to assess the predicted occurrence of HF and high-risk HF and to determine the best cutoff of the sound intensity for detecting HF and high-risk HF. A multivariate regression analysis was performed to identify the factors associated with the presence of HF or high-risk HF among variables with values of p < 0.050 on the univariate logistic regression analysis. Statistical significance was defined as p < 0.050. JMP version 9.0 software (SAS Institute, Cary, NC, USA) was used to perform all statistical analyses.
3 Results
3.1 Clinical characteristics of CVD
The mean age of the participants was 71.6 ± 9.4 years, with males comprising 73% of the group and an average body mass index (BMI) of 24.2 ± 3.7 kg/m2. NT-proBNP was 156 (92.8–464) pg/ml, and laboratory tests including ECG, chest X-P, and echocardiography were within or close to normal levels (Table 1). The number of preserved EF was 23, 7, and 4 cases in non-HF (n = 27), HF (n = 8), and high-risk HF (n = 5), respectively. Beta-blockers were prescribed to 35 of 40 patients (85%) and to 11 of 13 patients with HF (85%) (Supplementary Table S1).
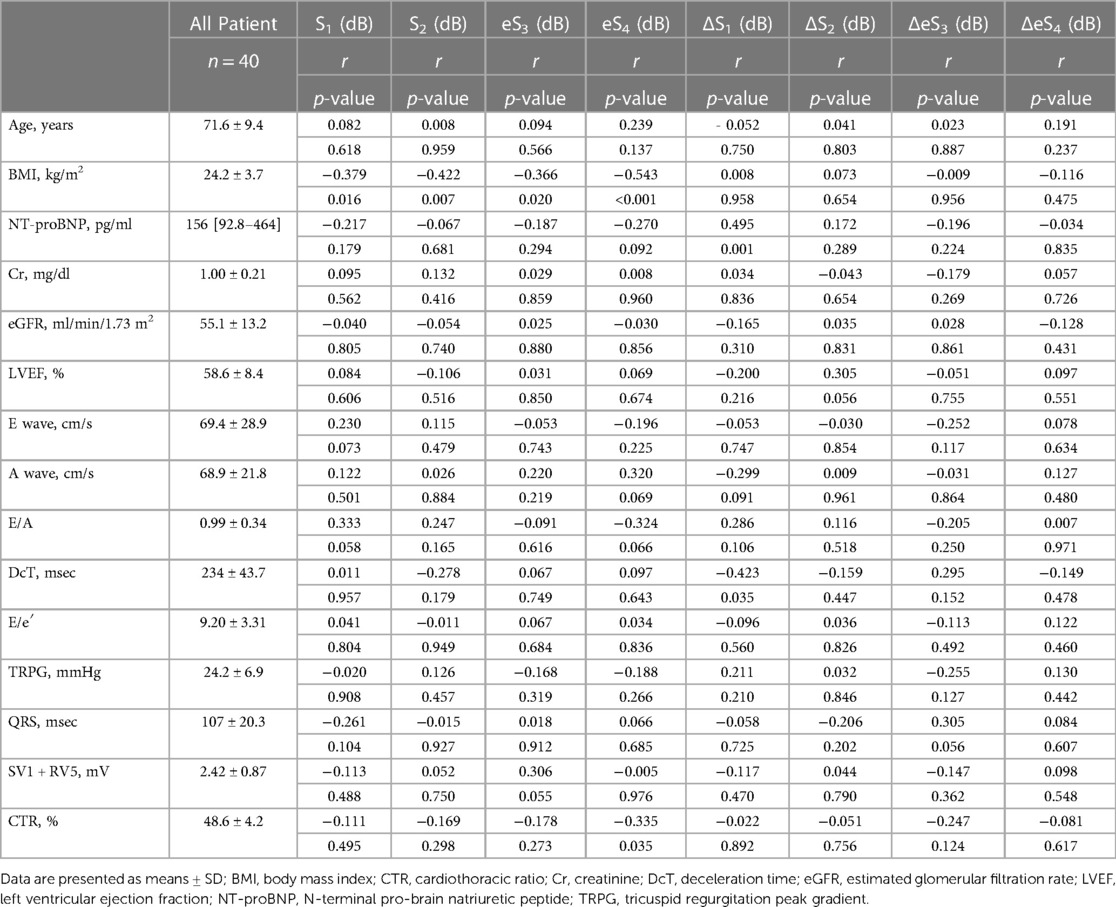
Table 1. Clinical characteristics and its relation to heart sound.
3.2 HS quantified in the participants
Distributions of each sound intensity (dB) and frequency (Hz) and a difference between two beats in intensity and frequency of four components are shown in Figure 3. HS intensities of all four components (S1–eS4) were inversely related to BMI (p < 0.02–p < 0.001, Table 1, Supplementary Figure S3), and eS4 was inversely related to CTR. There was no correlation between HS intensities and NT-proBNP (Supplementary Figure S4). The audio frequency of S1 (fS1) was positively related to BMI and CTR (BMI, p = 0.043; CTR, p = 0.010; Supplementary Table S2). There was no correlation between HS frequencies and NT-proBNP (Supplementary Figure S5). ΔS1 positively correlated with NT-proBNP (p = 0.001) and was inversely correlated with deceleration time in echocardiography (p = 0.035). On the other hand, ΔfS1 was positively correlated with NT-proBNP and CTR, respectively (NT-proBNP, p = 0.033; CTR, p = 0.018). As summarized in Table 2, intensities of S1, S2, eS3, and eS4 were not different in the presence or absence of HF, while ΔS1 (p = 0.024) and ΔfS1 (p = 0.042) between two consecutive beats were larger in patients with HF than that in patients without HF. These findings were observed where a preceding R–R interval was not different between HF and non-HF. ΔS1 (p = 0.012) and ΔfS1 (p = 0.012) were larger in patients with high-risk HF and were also correlated with AF (p = 0.001) or with E/e′ (echocardiographic parameters, p = 0.017, Table 3). Multivariate analysis showed that ΔS1 was an independent factor from ΔfS1 to predict HF (ΔS1, OR = 1.659, p = 0.044). A group of high-risk HF was correlated significantly with AF (AF, p < 0.001, ΔS1, p = 0.036, and ΔfS1, p = 0.011, Supplementary Table S3). Multivariate analysis showed that ΔfS1 was an independent factor from ΔS1 to predict high-risk HF (ΔfS1, OR = 1.690, p = 0.027). AF was a strongly independent factor from HS to predict HF or high-risk HF (Supplementary Table S4). The areas under the curve (AUC) of the ROC for the detection of high-risk HF assessed by ΔS1 and ΔfS1 were 0.706 and 0.843 (ΔS1, p = 0.047; ΔfS1, p = 0.031, Figure 4). The best cutoff values of high-risk HF for ΔS1 and ΔfS1 were 4.0 dB and 5.0 Hz, respectively (ΔS1, sensitivity 40.0%, specificity 81.1%; ΔfS1, sensitivity 100%, specificity 68.7%). However, the AUC of the ROC for the detection of HF assessed by ΔS1 and ΔfS1 was not significant (Supplementary Figure S6).
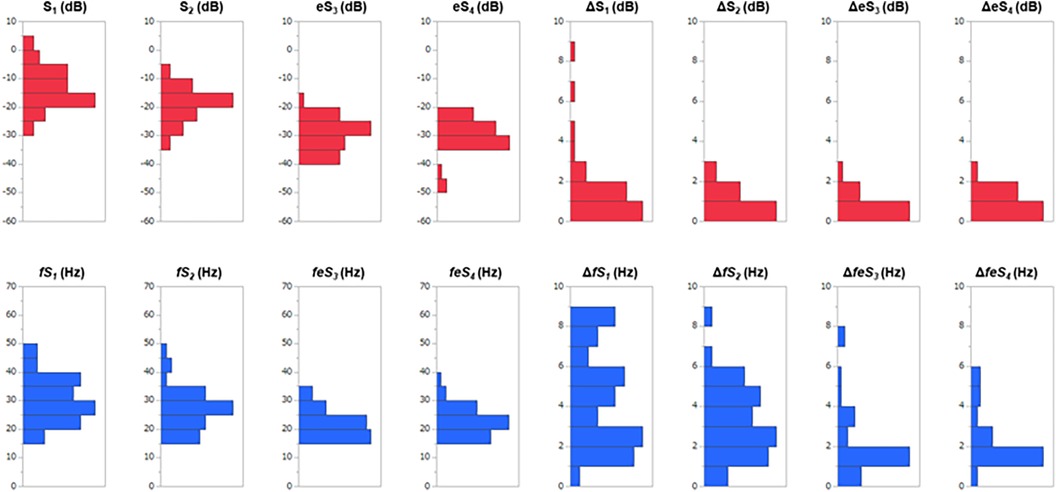
Figure 3. Distributions of sound features and a beat-to-beat difference in 40 CVD patients. S1, first heart sound; S2, second heart sound; eS3, equivalent to third heart sound; eS4, equivalent to the fourth heart sound; Δ is the difference between two consecutive beats; the red bars are heart sound intensities; the blue bars are heart sound frequencies.
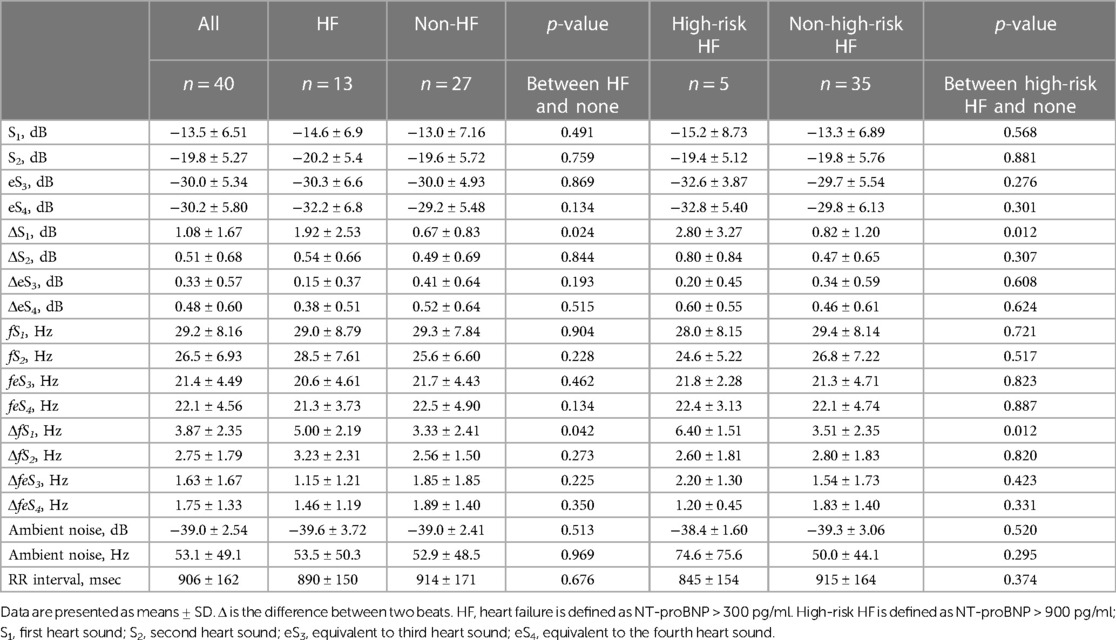
Table 2. Sound intensity and RR interval in HF and non-HF.

Table 3. Univariate/multivariate analysis for HF.
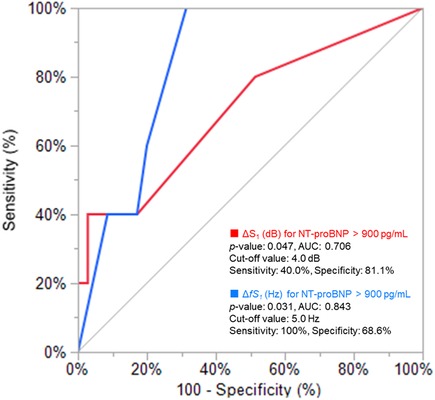
Figure 4. Receiver operating characteristic analysis for CAD patients with high NT-proBNP. AUC, area under the curve; ΔS1, acoustic difference (dB) of S1 between two consecutive beats; NT-proBNP, N-terminal pro-brain natriuretic peptide.
3.3 Detections of HF by HS
The incidence of HF was significantly higher in patients with ΔS1 ≥ 4.0 dB than those with ΔS1 < 4.0 dB (100 vs., 27.0%, p = 0.029). The incidence of HF was also significantly higher in patients with ΔfS1 ≥ 5.0 Hz than that of those without (56.3 vs. 16.7%, p = 0.015). Only one participant met both ΔS1 ≥ 4.0 dB and ΔfS1 ≥ 5.0 Hz, and the incidence of HF tended to be high although the statistical difference was not performed (Figures 5A,B). The incidence of high-risk HF was significantly higher in patients with ΔS1 ≥ 4.0 dB than those without (66.7 vs. 8.1%, p = 0.036). The incidence of HF was also significantly higher in patients with ΔfS1 ≥ 5.0 Hz than those without (31.3 vs. 0.00%, p = 0.007). Among the three groups according to the NT-proBNP, ΔS1 and ΔfS1 in patients with NT-proBNP over 900 pg/ml were significantly larger than those in patients with NT-proBNP below 300 pg/ml (ΔS1, p = 0.004; ΔfS1, p = 0.011, Supplementary Figure S7) although statistical significance was not observed between the other groups.
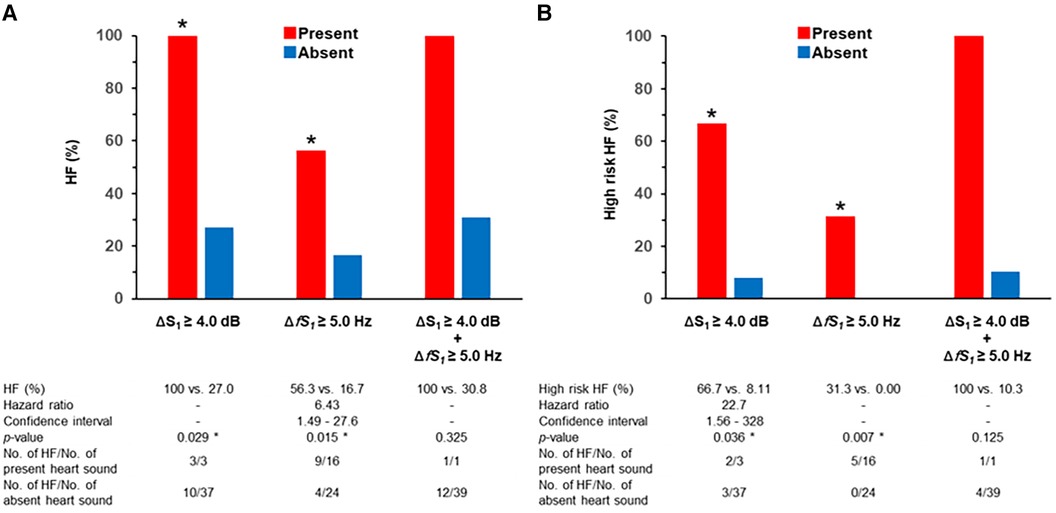
Figure 5. Incidence of HF and heart sound alterations. * is p < 0.050; Δ is the difference between two beats; HF, heart failure; S1, first heart sound. (A) HF is defined as NT-proBNP > 300 pg/ml. (B) High-risk HF is defined as NT-proBNP > 900 pg/ml.
4 Discussion
The main findings of this study were (1) quantitative sound analysis on acoustic measures through digital data acquisition and processing is necessary to overcome the auscultatory proficiency related to the subjectivity of the examiner, (2) the intensity of all components of HS was inversely related to the level of BMI, and (3) S1 alterations between two consecutive beats in intensity and frequency at the peak power of S1 spectrum were associated with levels of NT-proBNP.
4.1 Quantifying heart sound
There are many aspects in quantifying the clinical features of HS. For describing physical signs, physicians documented semiquantitatively by loudness, pitch, and tone with verbal expressions through the perception of the physician (23). A phonocardiogram is powerful in determining the timing of sound occurrence in relation to ECG; however, how to compare patients' variations remains unexplored. Reddy et al. (24) applied a calibrated pressure mechanocardiograph to measure sound strength, but pitch or tone was not measured. To overcome subjective differences in audibility or visual recognition of phonocardiogram, we introduced a digital acquisition and processing of HS.
Physical appropriateness of our auscultatory device, handheld tri-antler chest piece (BMP-LD3) was supported firstly by assessing the influence of BMI on the HS and secondly by recordings of tiny and barely audible vibrations around the timings of S3 and S4. It is known that the acoustic intensity of HS declines by the distance between the heart and the thorax surface, the volumes of the lung (25), and the amount of other sound absorbers such as connective, adipose, and muscle tissues (26). Luo et al. demonstrated a significant intensity drop in HS recordings in cases with BMI > 30 kg/m2, when physicians applied smartphones in the hospital for auscultation (27). In the present study, we observed an inverse relation between the intensity of HS and the levels of BMI (BMI between 16.2 and 33.0 kg/m2, n = 40, aged from 46 to 87 years). In addition, HS intensity in aged patients was weak (24), and stored data were augmented in the digital analysis in the present study. Accordingly, we understand that the present device has sufficient resolution to quantify HS acoustically.
4.2 Sensitive biomarkers in heart failure
HS have been accepted as a cardiac biomarker in patients with HF (28). To detect occurrences of HF, wearable devices such as a smartwatch or a smartphone (29, 30) are available along with an implanted long-term (31) and continuous monitoring device to observe ECG and cardiac sounds for the management of HF (32). Artificial intelligence analysis of ECG and phonocardiogram was challenged to predict the occurrence of HF (33–35). These studies focused on the presence of diastolic HS such as S3 or S4; however, S3 or S4 was not evident in the present participants; they were all ambulatory and did not exhibit overt HF upon visiting our outpatient clinic, and 13 of them (32.5%) had HF defined by NT-proBNP level ≥ 300 pg/ml.
Although HF in the present participants was hemodynamically and clinically mild and 85% of HF participants were under the control of beta-blockades, the quantitative sound analysis revealed that (1) a beat-to-beat alteration of S1 intensity (dB) and its audio frequency (Hz) was significantly associated with the level of NT-proBNP and (2) the size of CTR correlated negatively with eS4 intensity (p = 0.035) and positively with S1 audio frequency (p = 0.010) (Table 1). In addition, highly significant differences in ΔS1 intensity and frequency were noted between HF and non-HF. Since such peculiar findings were not observed in S2, eS3, or eS4, these findings may suggest a latent cardio-mechanistic derangement in HF.
4.3 Mechanisms of S1 beat-to-beat alteration
In previous case reports in patients with severe HF, S1 was documented to be soft and muffled because of congestive blood flow and poor heart pumping (13, 14). S1 appears during the isovolumic contraction when the left ventricular (LV) dP/dt reaches its peak level. A tight relationship between the maximum positive LVdP/dt and the amplitude of S1 was repeatedly demonstrated in animal studies (36, 37). The level of peak LV dP/dt has been accepted as a standard index of contractility (38). Then, the relationship between S1 sound characteristics and LV contractility may be described by a simple first-order system. However, a highly accurate pressure measurement was not realistic for participants in the outpatient clinic. To prove how well a simple first-order system fits to the relationship between S1 alteration and LV contractility remains one of the important future studies.
In the Framingham Heart Study, AF occurs in more than half of individuals with HF, and HF occurs in more than one-third of individuals with AF (39). HF and AF also frequently coexist. AF precedes and follows HF with both preserved and reduced EF (40). A previous study also reported that AF is highly predictive of underlying HFpEF (41). H2FPEF score was calculated by clinical variables including heavy, hypertensive, AF, pulmonary hypertension, and elder and filling pressure. Subsequently, AF accounts for 3 of 9 points in the H2FPEF score (42). HFA-PEFF score was also calculated by functional, morphological, and biomarker domains. AF is a main factor in the initial evaluation of the HFA-PEFF diagnostic algorithm (43), although both scores have good sensitivity and specificity to detect HFpEF (44). In the present study, AF was noted in 11 of 13 participants with HF and they were classified as HFpEF. Equal RR interval in these participants may indicate dysfunction of the autonomic nervous system (45). Accordingly, a beat-to-beat S1 alteration may represent mechanisms similar to pulsus alternans (46).
4.4 Sound alteration of non-audible level in heart failure
An audible range of humans is at least ≥0 dB at the audio frequencies between 20 Hz and 20 kHz (47). In human ears, the audible minimum change of sound pressure is at least ≥2 dB (23) although the audible threshold worsens according to age. In the present study, the detected sound signal was augmented electrically, which enabled us to recognize slight changes in HS on PCG recordings. In the present augmented signals, absolute differences in S1 intensity and its peak audio frequency between consecutive beats were 4.0 dB and 5.0 Hz, and such tiny changes were assessable due to the digital quantification of sound signals.
4.5 Limitations
There are several limitations: (1) the number of participants was limited in the present study; however, subjects from the real world of daily clinical activities provide the present research eliminating biases in the selection of participants, (2) participants with the absence of CVD were not included, (3) we did not study the difference between physician's audibility and digital acquisition of HS, and (4) since the present study is based on a small number of participants, the contribution of this single-center exploratory study remains a hypothesis generation for future further studies.
Conclusions
The practical role of auscultation has been discussed a lot, before and following the 200th anniversary of the stethoscope (48). Although S3 and S4 in HF have been defined by auscultatory recognition, their sensitivity and specificity in the physical examination are limited by the physician's proficiency and audibility (47, 49). The present findings on HF-associated S1 beat-to-beat alteration in sound characteristics propose a strong need for a highly sensitive stethoscope and its quantitative assessment on HS below audible level.
Data availability statement
The raw data supporting the conclusions of this article will be made available by the authors, without undue reservation.
Ethics statement
The studies involving humans were approved by the Kitasato University Hospital Research Ethics Committee (Clinical Trial Registration No. B22-060). The studies were conducted in accordance with the local legislation and institutional requirements. The participants provided their written informed consent to participate in this study.
Author contributions
KF: Conceptualization, Investigation, Writing – original draft. MY: Investigation, Supervision, Writing – review & editing. KF: Data curation, Investigation, Writing – review & editing. TK: Formal analysis, Supervision, Writing – review & editing. JO: Formal analysis, Methodology, Supervision, Writing – review & editing. KK: Methodology, Supervision, Writing – review & editing. HT: Conceptualization, Supervision, Writing – review & editing. JA: Project administration, Supervision, Writing – review & editing.
Funding
The authors declare financial support was received for the research, authorship, and/or publication of this article.
This work was supported by the Kitasato University and NTT Basic Research Laboratories.
Acknowledgments
The authors appreciate all of the staff of the Cardiovascular Preventive Division at the Kitasato University Hospital.
Conflict of interest
The authors declare that the research was conducted in the absence of any commercial or financial relationships that could be construed as a potential conflict of interest.
Publisher's note
All claims expressed in this article are solely those of the authors and do not necessarily represent those of their affiliated organizations, or those of the publisher, the editors and the reviewers. Any product that may be evaluated in this article, or claim that may be made by its manufacturer, is not guaranteed or endorsed by the publisher.
Supplementary material
The Supplementary Material for this article can be found online at: https://www.frontiersin.org/articles/10.3389/fcvm.2024.1372543/full#supplementary-material
References
1. Drazner MH, Rame JE, Stevenson LW, Dries DL. Prognostic importance of elevated jugular venous pressure and a third heart sound in patients with heart failure. N Engl J Med. (2001) 345:574–81. doi: 10.1056/NEJMoa010641
2. Marcus GM, Gerber IL, McKeown BH, Vessey JC, Jordan MV, Huddleston M, et al. Association between phonocardiographic third and fourth heart sounds and objective measures of left ventricular function. JAMA. (2005) 293:2238–44. doi: 10.1001/jama.293.18.2238
3. Sato Y, Kawasaki T, Honda S, Harimoto K, Miki S, Kamitani T, et al. Third and fourth heart sounds and myocardial fibrosis in hypertrophic cardiomyopathy. Circ J. (2018) 82:509–16. doi: 10.1253/circj.CJ-17-0650
4. Gupta S, Michaels AD. Relationship between accurate auscultation of the fourth heart sound and the level of physician experience. Clin Cardiol. (2009) 32:69–75. doi: 10.1002/clc.20431
5. Grenier MC, Gagnon K, Genest J, Durand J, Durand LG. Clinical comparison of acoustic and electronic stethoscopes and design of a new electronic stethoscope. Am J Cardiol. (1998) 81:653–6. doi: 10.1016/s0002-9149(97)00977-6
6. Thakur PH, An Q, Swanson L, Zhang Y, Gardner RS. Haemodynamic monitoring of cardiac status using heart sounds from an implanted cardiac device. ESC Hear Fail. (2017) 4:605–13. doi: 10.1002/ehf2.12171
7. Jordan MD, Taylor CR, Nyhuis AW, Tavel ME. Audibility of the fourth heart sound. Relationship to presence of disease and examiner experience. Arch Intern Med. (1987) 147:721–6. doi: 10.1001/archinte.1987.00370040103018
8. McDonagh TA, Metra M, Adamo M, Gardner RS, Baumbach A, Böhm M, et al. 2023 focused update of the 2021 ESC guidelines for the diagnosis and treatment of acute and chronic heart failure. Eur Heart J. (2023) 44:3627–39. doi: 10.1093/eurheartj/ehad195
9. Tsutsui H, Albert NM, Coats AJS, Anker SD, Bayes-Genis A, Butler J, et al. Natriuretic peptides: role in the diagnosis and management of heart failure: a scientific statement from the Heart Failure Association of the European Society of Cardiology, Heart Failure Society of America and Japanese Heart Failure Society. J Card Fail. (2023) 29:787–804. doi: 10.1016/j.cardfail.2023.02.009
10. Abelson D. The electro-acoustic stethoscope; an instrument for the simultaneous auscultation of heart sounds and audio signals. Med Biol Eng. (1971) 9:143. doi: 10.1007/BF02474743
11. Maheshkumar K, Dilara K, Maruthy KN, Sundareswaren L. Validation of PC–based sound card with biopac for digitalization of ECG recording in short–term HRV analysis. N Am J Med Sci. (2016) 8:307–11. doi: 10.4103/1947-2714.187150
12. Vizioli LH, Winckler FD, da Luz LC, Marques GK, Callegari-Jacques SM, Fornari F, et al. Abdominal palpation does not modify the number of bowel sounds in healthy volunteers and gastrointestinal outpatients. Am J Med Sci. (2020) 360:378–82. doi: 10.1016/j.amjms.2020.05.041
14. Waider W, Craige E. First heart sound and ejection sounds. Echocardiographic and phonocardiographic correlation with valvular events. Am J Cardiol. (1975) 35:346–56. doi: 10.1016/0002-9149(75)90026-0
15. DePasquale NP, Burch GE, Phillips JH. The second heart sound. Am Heart J. (1968) 76:419–31. doi: 10.1016/0002-8703(68)90238-X
16. Sabbah HN, Stein PD. Investigation of the theory and mechanism of the origin of the second heart sound. Circ Res. (1976) 39:874–82. doi: 10.1161/01.RES.39.6.874
17. Manson AL, Nudelman SP, Hagley MT, Hall AF, Kovács SJ. Relationship of the third heart sound to transmitral flow velocity deceleration. Circulation. (1995) 92:388–94. doi: 10.1161/01.CIR.92.3.388
18. Tsutsui H, Ide T, Ito H, Kihara Y, Kinugawa K, Makaya M, et al. Jcs/jhfs 2021 guideline focused update on diagnosis and treatment of acute and chronic heart failure. Circ J. (2021) 85:2252–91. doi: 10.1253/circj.CJ-21-0431
19. Nagueh SF, Smiseth OA, Appleton CP, Byrd BF, Dokainish H, Edvardsen T, et al. Recommendations for the evaluation of left ventricular diastolic function by echocardiography: an update from the American Society of Echocardiography and the European Association of Cardiovascular Imaging. J Am Soc Echocardiogr. (2016) 29:277–314. doi: 10.1016/j.echo.2016.01.011
20. Derval N, Duchateau J, Mahida S, Eschalier R, Sacher F, Lumens J, et al. Distinctive left ventricular activations associated with ECG pattern in heart failure patients. Circ Arrhythmia Electrophysiol. (2017) 10:1–10. doi: 10.1161/CIRCEP.117.005073
21. Hancock EW, Deal BJ, Mirvis DM, Okin P, Kligfield P, Gettes LS, et al. AHA/ACCF/HRS recommendations for the standardization and interpretation of the electrocardiogram. Part V: electrocardiogram changes associated with cardiac chamber hypertrophy a scientific statement from the American Heart Association Electrocardiography. J Am Coll Cardiol. (2009) 53:992–1002. doi: 10.1016/j.jacc.2008.12.015
22. Truszkiewicz K, Poręba R, Gać P. Radiological cardiothoracic ratio in evidence-based medicine. J Clin Med. (2021) 10:1–9. doi: 10.3390/jcm10092016
23. Buus S, Müsch H, Florentine M. On loudness at threshold. J Acoust Soc Am. (1998) 104:399–410. doi: 10.1121/1.423295
24. Reddy PS, Haidet K, Memo F. Relation of intensity of cardiac sounds to age. Am J Cardiol. (1985) 55:1383–8. doi: 10.1016/0002-9149(85)90509-0
25. Nersisson R, Noel MM. Heart sound and lung sound separation algorithms: a review. J Med Eng Technol. (2017) 41:13–21. doi: 10.1080/03091902.2016.1209589
26. Larsen BS, Winther S, Bøttcher M, Nissen L, Struijk J, Schmidt SE, et al. Correlations of first and second heart sounds with age, sex, and body mass index. Comput Cardiol. (2017) 44:1–4. doi: 10.22489/CinC.2017.141-408
27. Luo H, Lamata P, Bazin S, Bautista T, Barclay N, Shahmohammadi M, et al. Smartphone as an electronic stethoscope: factors influencing heart sound quality. Eur Hear J—Digit Heal. (2022) 3:473–80. doi: 10.1093/ehjdh/ztac044
28. Bayoumy K, Gaber M, Elshafeey A, Mhaimeed O, Dineen EH, Marvel FA, et al. Smart wearable devices in cardiovascular care: where we are and how to move forward. Nat Rev Cardiol. (2021) 18:581–99. doi: 10.1038/s41569-021-00522-7
29. Golbus JR, Gosch K, Birmingham MC, Butler J, Lingvay I, Lanfear DE, et al. Association between wearable device measured activity and patient-reported outcomes for heart failure. JACC Hear Fail. (2023) 11:1521–30. doi: 10.1016/j.jchf.2023.05.033
30. Werhahn SM, Dathe H, Rottmann T, Franke T, Vahdat D, Hasenfuß G, et al. Designing meaningful outcome parameters using mobile technology: a new mobile application for telemonitoring of patients with heart failure. ESC Hear Fail. (2019) 6:516–25. doi: 10.1002/ehf2.12425
31. Cao M, Gardner RS, Hariharan R, Nair DG, Schulze C, An Q, et al. Ambulatory monitoring of heart sounds via an implanted device is superior to auscultation for prediction of heart failure events. J Card Fail. (2020) 26:151–9. doi: 10.1016/j.cardfail.2019.10.006
32. Hughes A, Shandhi MMH, Master H, Dunn J, Brittain E. Wearable devices in cardiovascular medicine. Circ Res. (2023) 132:652–70. doi: 10.1161/CIRCRESAHA.122.322389
33. Susič D, Poglajen G, Gradišek A. Identification of decompensation episodes in chronic heart failure patients based solely on heart sounds. Front Cardiovasc Med. (2022) 9:1–10. doi: 10.3389/fcvm.2022.1009821
34. Averbuch T, Sullivan K, Sauer A, Mamas MA, Voors AA, Gale CP, et al. Applications of artificial intelligence and machine learning in heart failure. Eur Hear J—Digit Heal. (2022) 3:311–22. doi: 10.1093/ehjdh/ztac025
35. Khan MS, Arshad MS, Greene SJ, Van Spall HGC, Pandey A, Vemulapalli S, et al. Artificial intelligence and heart failure: a state-of-the-art review. Eur J Heart Fail. (2023) 25:1507–25. doi: 10.1002/ejhf.2994
36. Sakamoto T, Kusukawa R, Maccanon DM, Luisada AA. Hemodynamic determinants of the amplitude of the first heart sound. Circ Res. (1965) 16:45–57. doi: 10.1161/01.RES.16.1.45
37. Sakamoto T, Kusukawa R, MacCanon DM, Luisada AA. First heart sound amplitude in experimentally induced alternans. Dis Chest. (1966) 50:470–5. doi: 10.1378/chest.50.5.470
38. Libby P, Bonow RO, Mann DL, Tomaselli GF, Bhatt DL, Solomon SD, et al. Braunwald's Heart Disease: A Textbook of Cardiovascular Medicine, 12th Edition. Philadelphia: Elsevier (2021).
39. Wang TJ, Larson MG, Levy D, Vasan RS, Leip EP, Wolf PA, et al. Temporal relations of atrial fibrillation and congestive heart failure and their joint influence on mortality: the Framingham Heart Study. Circulation. (2003) 107:2920–5. doi: 10.1161/01.CIR.0000072767.89944.6E
40. Li Y, Gray A, Xue L, Farb MG, Ayalon N, Andersson C, et al. Metabolomic profiles, ideal cardiovascular health, and risk of heart failure and atrial fibrillation: insights from the Framingham Heart Study. J Am Heart Assoc. (2023) 12:e028022. doi: 10.1161/JAHA.122.028022
41. Reddy YNV, Obokata M, Gersh BJ, Borlaug BA. High prevalence of occult heart failure with preserved ejection fraction among patients with atrial fibrillation and dyspnea. Circulation. (2018) 137:534–5. doi: 10.1161/CIRCULATIONAHA.117.030093
42. Simple A. Evidence-based approach to help guide diagnosis of heart failure with preserved ejection fraction. Circulation. (2018) 138:861–70. doi: 10.1161/CIRCULATIONAHA.118.034646
43. Pieske B, Tschöpe C, De Boer RA, Fraser AG, Anker SD, Donal E, et al. How to diagnose heart failure with preserved ejection fraction: the HFA-PEFF diagnostic algorithm: a consensus recommendation from the Heart Failure Association (HFA) of the European Society of Cardiology (ESC). Eur Heart J. (2019) 40:3297–317. doi: 10.1093/eurheartj/ehz641
44. Reddy YN V, Kaye DM, Handoko ML, Bovenkamp Avd, Tedford RJ, Keck C, et al. Diagnosis of heart failure with preserved ejection fraction among patients with unexplained dyspnea. JAMA Cardiol. (2022) 7:891–9. doi: 10.1001/jamacardio.2022.1916
45. Khan AA, Lip GYH, Shantsila A. Heart rate variability in atrial fibrillation: the balance between sympathetic and parasympathetic nervous system. Eur J Clin Invest. (2019) 49:1e 13174. doi: 10.1111/eci.13174
46. Euler DE. Cardiac alternans: mechanisms and pathophysiological significance. Cardiovasc Res. (1999) 42:583–90. doi: 10.1016/S0008-6363(99)00011-5
47. Suzuki Y, Takeshima H. Equal-loudness-level contours for pure tones. J Acoust Soc Am. (2004) 116:918–33. doi: 10.1121/1.1763601
48. Bank I, Vliegen HW, Bruschke AVG. The 200th anniversary of the stethoscope: can this low-tech device survive in the high-tech 21st century? Eur Heart J. (2016) 37:3536–43. doi: 10.1093/eurheartj/ehw034
Keywords: auscultation, cardiovascular disease, heart failure, body mass index, heart sound
Citation: Fujiyoshi K, Yamaoka-Tojo M, Fujiyoshi K, Komatsu T, Oikawa J, Kashino K, Tomoike H and Ako J (2024) Beat-to-beat alterations of acoustic intensity and frequency at the maximum power of heart sounds are associated with NT-proBNP levels. Front. Cardiovasc. Med. 11:1372543. doi: 10.3389/fcvm.2024.1372543
Received: 18 January 2024; Accepted: 18 March 2024;
Published: 2 April 2024.
Edited by:
Michiaki Nagai, University of Oklahoma Health Science Center, United StatesReviewed by:
Makiko Kobayashi, Kumamoto University, JapanZaher S. Azzam, Rambam Health Care Campus, Israel
Francesco Paolo Lo Muzio, Angiologie und Intensivmedizin Deutsches Herzzentrum der Charité, Germany
© 2024 Fujiyoshi, Yamaoka-Tojo, Fujiyoshi, Komatsu, Oikawa, Kashino, Tomoike and Ako. This is an open-access article distributed under the terms of the Creative Commons Attribution License (CC BY). The use, distribution or reproduction in other forums is permitted, provided the original author(s) and the copyright owner(s) are credited and that the original publication in this journal is cited, in accordance with accepted academic practice. No use, distribution or reproduction is permitted which does not comply with these terms.
*Correspondence: Minako Yamaoka-Tojo myamaoka@med.kitasato-u.ac.jp