 Huilin Zheng
 Syed Waseem Abbas Sherazi
 Jong Yun Lee
94% of researchers rate our articles as excellent or good
Learn more about the work of our research integrity team to safeguard the quality of each article we publish.
Find out more
ORIGINAL RESEARCH article
Front. Cardiovasc. Med., 19 March 2024
Sec. Hypertension
Volume 11 - 2024 | https://doi.org/10.3389/fcvm.2024.1276608
Background and objectives: Hypertension is one of the most serious risk factors and the leading cause of mortality in patients with cardiovascular diseases (CVDs). It is necessary to accurately predict the mortality of patients suffering from CVDs with hypertension. Therefore, this paper proposes a novel cost-sensitive deep neural network (CSDNN)-based mortality prediction model for out-of-hospital acute myocardial infarction (AMI) patients with hypertension on imbalanced data.
Methods: The synopsis of our research is as follows. First, the experimental data is extracted from the Korea Acute Myocardial Infarction Registry-National Institutes of Health (KAMIR-NIH) and preprocessed with several approaches. Then the imbalanced experimental dataset is divided into training data (80%) and test data (20%). After that, we design the proposed CSDNN-based mortality prediction model, which can solve the skewed class distribution between the majority and minority classes in the training data. The threshold moving technique is also employed to enhance the performance of the proposed model. Finally, we evaluate the performance of the proposed model using the test data and compare it with other commonly used machine learning (ML) and data sampling-based ensemble models. Moreover, the hyperparameters of all models are optimized through random search strategies with a 5-fold cross-validation approach.
Results and discussion: In the result, the proposed CSDNN model with the threshold moving technique yielded the best results on imbalanced data. Additionally, our proposed model outperformed the best ML model and the classic data sampling-based ensemble model with an AUC of 2.58% and 2.55% improvement, respectively. It aids in decision-making and offers a precise mortality prediction for AMI patients with hypertension.
Cardiovascular diseases (CVDs) are the main type of noncommunicable diseases (NCDs) and account for most NCD deaths (1). It caused approximately 17.9 million deaths in 2019, more than one-third of deaths worldwide (2). Hypertension is one of the primary NCD risk factors and also one of the most critical risk factors for CVDs, also known as high blood pressure (3, 4, 7). It is known as a “silent killer” because the signs and symptoms usually do not occur until hypertension has reached the severe stage (5). In 2015, approximately 1 in 4 males and 1 in 5 females worldwide suffered from hypertension (6). Furthermore, high systolic and diastolic blood pressure is widely known to increase the mortality risk of CVD patients (8, 9). Hence, this paper targets the mortality prediction of AMI patients with hypertension, since many existing research does not mainly focus on CVD patients with hypertension. Regarding disease risk prediction and clinical prognosis for cardiovascular diseases (CVDs) and hypertension, there are generally two main categories of approaches: traditional regression-based and machine learning (ML)-based methods. Conventional regression-based methods, such as the Global Registry of Acute Coronary Events (GRACE) (10), Systematic Coronary Risk Evaluation (SCORE) (11), Thrombolysis in Myocardial Infarction (TIMI) (12), and Framingham Risk Scores (FRS) (13), etc. have been developed for the prediction of CVDs, whereas Cox proportional-hazards regression, Weibull regression, etc. have been used for the hypertension prediction a long time ago (14). However, the conventional regression-based models consider few risk factors and cannot deal with the missing values efficiently, which leads to a lower performance for the mortality prediction of CVD patients. In addition, several ML-based models using support vector machine (SVM), logistic regression (LR), decision tree (DT), random forest (RF), adaptive boosting (AdaBoost), extreme gradient boosting (XGBoost), etc. were also developed for the prediction of CVDs and hypertension, which is better than the traditional regression-based models generally (15–18). Deep learning (DL), one of the stated methods in ML, has advanced significantly in the previous ten years due to its powerful computational capacity (19). It has been used in various domains successfully including healthcare, such as cancer diagnosis (20), heart disease prediction (21, 22), drug response prediction (23), medical image analysis (24–26), etc. In DL techniques, the deep neural network (DNN) is a type of artificial neural network (ANN) that includes multiple hidden layers for the detection of more complex non-linear relationships between the input and output (27). It has shown a strong ability over general ML-based methods in different research. Hence, the DL-based approach is a better choice for predicting the seriousness and mortality in CVD patients with hypertension.
The class imbalance, defined as the skewed class distribution between the majority and minority classes, is also a common issue in the datasets from different domains, especially in medical datasets in which the majority class is the healthy person and the minority class is the patients. Most of the classifiers get biased results for the majority class when analyzing imbalanced data and ignore the minority class data in the highly imbalanced case. Several approaches such as data-level and algorithm-level methods can be applied to address this problem (28). In data-level techniques, various data oversampling and undersampling methods are applied to reduce imbalance levels (18, 29). However, data sampling techniques have some potential limitations. First, it may increase computation costs with unnecessary instances and obscure some potentially valuable data. Second, the data sampling method has the serious limitation of biased selection, which leads to incorrect conclusions. Third, the distribution of various classes is also affected by both undersampling and oversampling (30). In the algorithm-level technique, the cost or weight schema is used to mitigate the bias towards the majority class in the underlying classifiers or its output, which is famous as cost-sensitive learning (31). Compared with data-level techniques, this technique does not require the alteration of the original data distribution as the modified algorithms consider the uneven distribution of classes while training, which results in more accurate performance than data sampling techniques (32). In addition, a simple and straightforward method named threshold-moving has also shown effective results for the class imbalance problem, which moves the decision threshold in the output to make the high-cost samples harder to misclassify (33, 34).
Therefore, this paper proposes a cost-sensitive deep neural network (CSDNN)-based prediction model to forecast the mortality in out-of-hospital AMI patients with hypertension while using the threshold moving technique to improve the performance on imbalanced tabular data. Our research contributions can be outlined as follows: First, a DL method is proposed with a cost-sensitive learning technique to generate an accurate model for the mortality prediction of AMI patients with hypertension. Second, the proposed method with the threshold moving technique shows the efficiency of handling the imbalanced data problem. Third, several classic data sampling-based ensemble models such as balanced bagging (35), balanced RF (36), EasyEnsemble (37), and RUSBoost (38) classifiers which have shown good performance on imbalanced data are utilized to evaluate the performance and robustness of the proposed CSDNN-based mortality prediction model. Finally, the wrapper-based feature selection method, which combines Recursive Feature Elimination (RFE) with a cross-validation strategy for optimal feature selection to speed up all models, has demonstrated performance improvement in the proposed and other models.
The rest of the paper is organized as follows: Section 2 provides an overview of the related work on ML-based disease prediction and the solution of imbalanced medical data. Section 3 introduces the experimental dataset and methods applied in this paper. Section 4 presents the experimental results and discussion. Finally, Section 5 concludes the overall research.
ML techniques have been used to predict various diseases popularly. For example, Sherazi et al. (15) developed the ML-based 1-year mortality prognosis model for 8,227 Korean CVD patients, which showed that the applied ML algorithm improved the performance by 8% over the traditional GRACE model. Chang et al. (16) proposed ML-based prediction models for outcomes of hypertension patients using four classifiers such as DT, SVM, RF, and XGBoost, where their results showed that the XGBoost achieved the best prediction performance. Weng et al. (17) compared ML-based algorithms such as RF, LR, etc. with an established American Heart Association/American College of Cardiology (ACC/AHA) algorithm for the risk prediction of CVD in large-size data with 378,256 patients. The results exhibited that all ML algorithms improved the prediction performance than the baseline ACC/AHA algorithm. In addition, DL techniques have been also widely used in the medical field. Ali et al. (21) proposed an automatic diagnostic system for heart disease prediction based on the DNN. They demonstrated that the proposed method achieved a prediction accuracy of 93.33% and outperformed many other state-of-the-art ML-based methods such as SVM, RF, AdaBoost, etc. Das et al. (22) applied several ML and DL algorithms to detect heart disease using LR, DT, SVM, ANN, etc. In their result, the ANN achieved the best accuracy and was superior to other ML-based approaches.
Class imbalance often occurs in medical data, where the number of healthy individuals is greater than the number of patients. Various techniques can be used to solve this problem. The first method is the data-level technique. For instance, Zheng et al. (18) applied three types of data oversampling, undersampling, and hybrid sampling techniques to handle the class imbalance problem in patients with CVDs. Their results demonstrated that the proposed ML-based model using the hybrid data sampling method improved the accuracy of the final prediction results. Wang et al. (29) used an adaptive synthetic sampling approach (ADASYN) data oversampling technique to reduce the influence of class imbalance and then designed the RF classifier to predict diabetes. As a result, the method they proposed proved to be effective and superior. Secondly, the technique can also be used at the algorithm level. Mienye et al. (30) implemented various cost-sensitive learning algorithms such as DT, RF, LR, and XGBoost for four medical datasets. Their results showed the effectiveness of cost-sensitive learning in predicting imbalanced medical datasets. Qi et al. (31) proposed a hybrid cost-sensitive ensemble method based on three public datasets from the UCI machine learning repository for heart disease prediction. The results demonstrated that the proposed method could improve the efficiency of diagnosis and reduce the misclassification cost using the cost-sensitive learning strategy. Third, the simple threshold moving method can be applied. Mulugeta et al. (32) used several ML algorithms such as LR, Naïve Bayes, ANN, RF, etc., with the threshold moving technique to predict the risk of graft failure on imbalanced kidney transplant recipients data. The results showed that the data-driven threshold moving technique improved the prediction result from imbalanced data compared to the natural threshold of 0.5.
The experimental framework for mortality prediction in AMI patients with hypertension is shown in Figure 1, which mainly includes three parts: data extraction and preprocessing, predictive model generation, and model evaluation. The mortality of AMI patients is defined as cardiac death and non-cardiac death which is the target feature of this paper. In the first part, we extract the experimental data from the Korean Acute Myocardial Infarction Registry-National Institutes of Health (KAMIR-NIH) dataset (39) and preprocess the data, such as handling the missing values and irrelevant features, normalizing the data, and then splitting the data into training (80%) and test data (20%). In the second part, the proposed CSDNN-based mortality prediction model and several compared models are developed using the training data. Moreover, the hyperparameters are also optimized for each model to get high performance. In the end, the test data is used to evaluate the performance of the proposed model for the mortality prediction of AMI patients with hypertension and also compared with other prediction models.
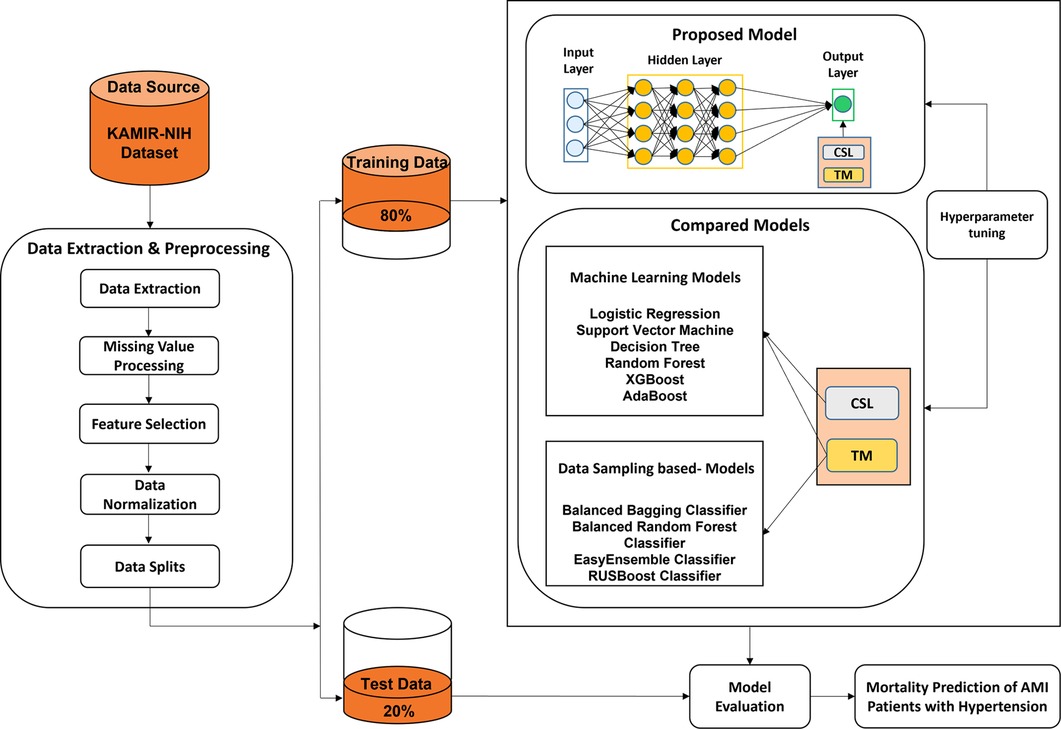
Figure 1. The experimental framework for the prediction of mortality in AMI patients with hypertension.
KAMIR is the first nationwide, prospective, multicenter registry specially designed to assess patients with AMI (40) in South Korea which is registered with 52 different Korean university hospitals and communities. The experiment in this paper is based on the KAMIR-NIH dataset, which includes 13,104 AMI patients’ records and 550 features with 2-year follow-ups from November 2011 to December 2019 (39). First, the experimental data is extracted from the original dataset for the target, where the total record of 5,602 out-of-hospital AMI patients with hypertension is extracted from the original 13,104 records and excluded the AMI patients' records died at the hospital (Excluded N = 504), failed to follow up for 2 years (Excluded N = 1,411), and without hypertension (Excluded N = 5,587). A total of 64 features are extracted from the KAMIR-NIH dataset, where 1 feature is used as the target variable and the other 63 features are used as the independent variables. The extracted data includes the demographic characteristics, clinical findings, medical history, and laboratory findings which refer to different studies (15, 18, 41, 42), as shown in Table 1. The experimental dataset has a strong representativeness of out-of-hospital AMI patients with hypertension and can be used to design our proposed prediction model for the target.
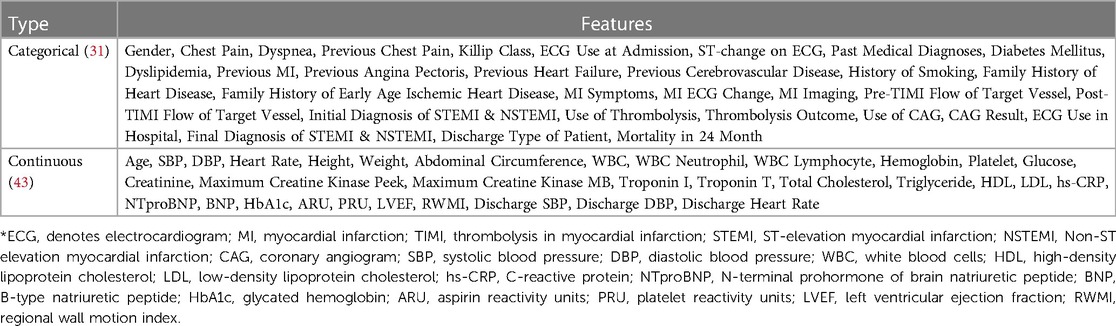
Table 1. The applied features from the KAMIR-NIH dataset.
There are several missing values (e.g., heart rate, systolic blood pressure, diastolic blood pressure, white blood cells, etc.) in the dataset. Therefore, different approaches are used to preprocess the dataset before designing the prediction model, which mainly includes three parts: missing value imputation, feature selection, and data normalization.
The collected dataset often contains several missing values, especially in the medical dataset. Firstly, we removed the features with more than 50% missing values in the dataset since those features may have a bad influence on the developed prediction models. Different types of methods have been used to handle the missing values which can be divided into two groups: statistical and ML-based techniques. Statistical techniques like mean and mode approaches are the simplest methods to impute the missing values in the data. The mean approach fills the missing values by the average value and the mode approach by the value that appears most often in the feature. The KNN is a representative supervised learning technique that is the most popular used ML method to impute the missing values based on the k nearest observed values (44). It has been shown that this imputation method is efficient in many types of research (45–47), and also includes tabular data (46). In this paper, the KNN-based imputation method is used to handle the missing values that use the k closest samples to determine the estimated missing value in the dataset, and k is set to 5.
The feature selection method is used popularly in the medical field, and can be used for dimensionality reduction and the development of more efficient prediction models (48–50). In this paper, the RFE wrapper-based feature selection method is used with a 5-fold cross-validation approach to select the most important features for our target. Moreover, the number of selected features can be decided by the algorithm automatically in the wrapper-based feature selection method, where the RF algorithm is used as an estimator in the RFE wrapper-based feature selection method because it has shown better performance in many domains. This method is used to provide the same inputs to all prediction models and improve the final performance.
ML algorithms compare the features in the data to find the patterns, there is a serious problem for the ML algorithms if the scale of the features in the data is severely different, especially for DL algorithms. Data normalization is a useful technique to normalize the scale of the features to a specific range such as between 0 and 1 or between −1 and 1, which can improve the performance as well as training stability of the ML and DL models (51). In this paper, the min-max normalization is used since it doesn't change the distribution of the original dataset. The calculation process of the method is shown in Equation (1).
Where x stands for the set of original values, the normalized value, the minimum value in x, the maximum value in x.
Cost-sensitive learning is the subfield of ML that considers the costs of misclassifications when dealing with classification problems. It is also a good solution for the class imbalance problem because it improves the generalization of the minority class by penalizing errors in that class and pushes the decision boundary away from these instances (52). It has been used popularly to address the class imbalance problem in different research (30, 33, 34, 53, 54). In cost-sensitive learning, the objective is to minimize the misclassification cost. The cost matrix of binary classification is shown in Table 2, where we use 1 for positive and 0 for negative.
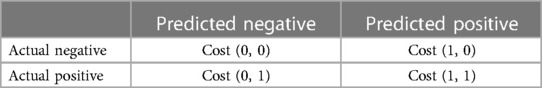
Table 2. The cost matrix of binary classification.
The instance cost of misclassification is measured by the , which corresponds to the misclassification costs of classifying into its predicted class (55). The cost of the correct classification, Cost (0,0) and Cost (1,1) are zero. To estimate the cost value of the misclassification, the imbalance ratio (IR) as shown in Equation (2) is used popularly, which can be calculated as the quotient of the number of majority samples by the number of samples in the minority class. In addition, the misclassification cost value can also be considered a hyperparameter in the model. The class_weight is a parameter in Python language used to learn the cost-sensitive learning for most of the baseline classification algorithms.
Many ML algorithms are designed to predict the probability of the class in terms of a default probability threshold of 0.5, which means that values equal to or exceeding the threshold are assigned to one class and all other values to another (31). However, the default threshold may lead to poor performance of the algorithms if there is a serious class imbalance issue in the dataset. The threshold moving technique (35) is used to handle the class imbalance problem which uses the original training data to train a model and then moves the decision probability threshold to predict the minority samples more accurately. Therefore, distinct threshold values are employed and then evaluated the label based on a selected evaluation matrix. The threshold that yields the best evaluation matrix will be used when predicting unseen data in the future.
DL methods have been applied to different types of data, such as image data, tabular data, text data, voice data, etc., and have shown adequate advantages in different domains recently. In this paper, a CSDNN-based method is proposed with a threshold moving technique to predict the mortality in out-of-hospital AMI patients with hypertension on imbalanced tabular data. To develop a more accurate DL-based model, we split the validation data (10% of the full data) from the training data, which is used to tune the hyperparameters and avoid the overfitting problem in the training process. Then we evaluate the performance of the proposed model with optimal hyperparameters on the test data (20%).
The architecture of the proposed CSDNN-based mortality prediction model is shown in Figure 2, which mainly consists of an input layer, three hidden layers, and an output layer. In the first part, the selected features from the dataset (e.g., gender, age, chest pain, etc.) are used as input to the input layer and then propagated to the subsequent layers. In the second step, three hidden layers are used with 20, 20, and 15 neurons and are fully connected, where the optimal hidden neurons are obtained from the hyperparameter optimization method. In the output layer, the result is produced for given inputs. To overcome the class imbalance problem between healthy individuals (majority) and patients (minority), the cost-sensitive learning technique is applied to the proposed method with the optimal weight value, which gives a much higher class_weight value to the patient's records. Moreover, the threshold moving technique is used to improve the performance which moves the decision probability threshold to maximize the prediction performance of the patient's class when training the prediction model. To solve this binary classification problem, the binary cross entropy (56) is used as the loss function which compares each of the predicted probabilities to the actual class output and then calculates the score that penalizes the probabilities based on the distance between the predicted and the actual values. Additionally, to minimize the loss and to achieve more accurate outputs in the neural network training process, the backward propagation algorithm (57) is used to fine-tune the weights. The whole process of the neural network computation and the binary cross entropy can be expressed as Equations (3, 4).
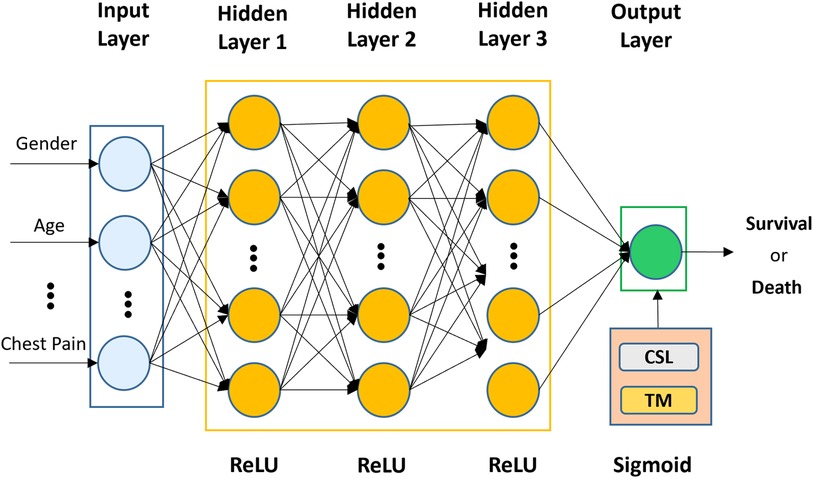
Figure 2. The architecture of the proposed CSDNN-based mortality prediction model with the threshold moving technique on imbalanced data.
where x represents the input units from the previous layer, and are the weight matrix and bias vector in each layer, respectively, is the activation function, N is the number of samples, is the probability of a positive class, and is the probability of a negative class.
The activation function is typically a nonlinear function and plays an important role in determining neuron activation. Without activation functions, the data would move through the network's nodes and layers using just linear functions, which are unable to recognize complicated patterns in the data. Several types of activation functions are used popularly, such as the rectified linear unit (ReLU), sigmoid, Tanh, etc (58). The ReLU is the most popular choice of activation function for hidden layers because it is easy to compute and does not make the problem of vanishing gradient. In this paper, the ReLU function is applied in all hidden layers because of its efficiency, and the sigmoid function is used in the output layer since our target feature is a binary-valued variable. The mathematical representations of the ReLU and sigmoid functions are shown in Equations (5, 6), where x denotes the input value.
In addition, the Adam optimizer, which is more efficient and can automatically reduce the learning rate, is used to optimize the weight with a learning rate of 0.01 (59). The batch size is given as 32, and the early stopping technique is applied with the patience of 30 to avoid overfitting and improve the speed of model development (60).
Some commonly used ML and ensemble methods such as SVM (61), LR (62), DT (63), RF (64), AdaBoost (65), and XGBoost (66), have shown better performance in different domains (5, 14, 15, 41, 54, 67). Therefore, we compared these models with the proposed CSDNN-based method to estimate the performance of the original imbalanced data with and without feature selection, cost-sensitive learning, and threshold moving technique. In addition, several classic data sampling-based ensemble methods such as balanced bagging (37), balanced RF (38), EasyEnsemble (68), and RUSBoost classifiers (69) are also applied with the feature selection and threshold moving technique to check the robustness of the proposed method. A brief description of these methods is as follows.
SVM (61) is a powerful method that seeks to identify an optimal decision boundary called hyperplane with maximum margin to classify the data points of both classes distinctly. Different kernel functions can be used to solve nonlinear problems. In this study, linear support vector classification (LinearSVC) (70) is used as an alternative to the traditional SVM with kernel functions due to its flexibility and speed for large datasets. LR (62) is a useful analysis method to solve binary classification problems by using a sigmoid function to squash the value range between 0 and 1. DT (63) is one of the most efficient ML algorithms and performs well on large datasets. It aims to predict the variable's values by learning from simple decisions. Several ensemble ML algorithms are also applied in this experiment. RF (64) is the famous ensemble method that constructs numerous decision trees by using the DT algorithm as a base estimator with a bagging approach at training time and finally outputs the result that most trees select. AdaBoost (65) is the typical boosting ensemble method that combines multiple weak estimators to generate the strong estimator by adaptively assigning the higher weight to misclassified instances and has shown its effectiveness in producing a more accurate model. XGBoost (66), the gradient-boosting framework, is used to build the decision tree-based ensemble. It has shown good performance and computational speed to handle classification and regression problems.
Several classic data sampling-based ensemble methods are also used in the experimental analysis. The balanced bagging method (37) uses all of the minority samples by undersampling the majority classes to improve the original bagging algorithm with skewed class distributions. Balanced RF classifier (38) takes the bootstrap samples from the minority class for each iteration of RF and then randomly undersamples the same number of replacement samples from the majority class to balance the dataset. EasyEnsemble classifier (68) is the ensemble of AdaBoost estimators which are trained on different balanced bootstrap samples by using the random undersampling technique to select the subset from the majority class and all instances from the minority class. RUSBoost classifier (61) randomly undersamples the dataset at each iteration to balance the class distribution while the AdaBoost algorithm is used to improve the performance using the balanced data.
A range of hyperparameter optimization methods is used frequently to customize and generate a more accurate prediction model. For example, random search (71) and grid search (72) are the simplest and most popular methods for hyperparameter optimization. In random search, search space is the bounded set of parameters with randomly chosen values, whereas the grid search method consists of a set of hyperparameter values and evaluates every position along the grid. The key difference between these methods is that only a few values are tested and chosen randomly in the random search. The performance of these methods is similar in small datasets, whereas the random search method is faster than the grid search method in large datasets. Several other references (15, 17, 69, 73) have been consulted in determining the parameters that may have a significant impact on the results of ML-based methods. In this paper, the random search with stratified 5-fold cross-validation is used to set the parameters of our proposed method and other compared methods because of the efficiency. The parameters and ranges of each algorithm were selected based on many references and our pre-experiment, as shown in Table 3. Moreover, to obtain the best value from all possible values of the class_weight parameter in our proposed method, the grid search with stratified 5-fold cross-validation is applied.
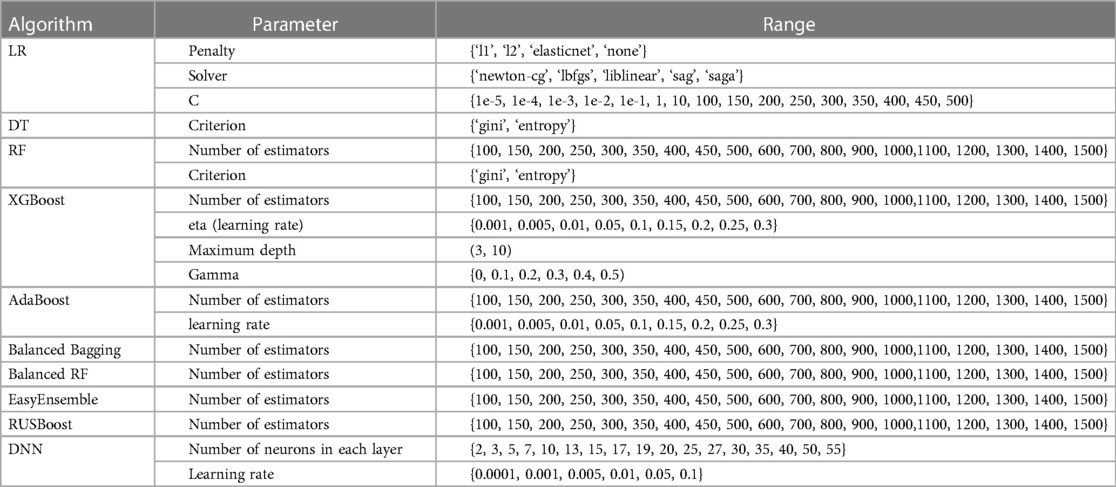
Table 3. Hyperparameter optimization of all machine learning algorithms with random search approach.
To analyze the categorical (i.e., gender, chest pain, etc.) and continuous (i.e., age, height, weight, etc.) variables in experimental data, we apply the Chi-square test (74) and independent t-test (75), respectively. In categorical variables, frequency and proportion are expressed, while continuous variables are expressed as mean value and standard deviation. Moreover, the significance level of p < 0.05 for statistical significance is used in this experiment.
We implemented all experiments on a Microsoft Windows server with Intel Xeon CPU E5-2696 v5 @ 4.40 GHz, 512GB random access memory (RAM), and NVIDIA GeForce GTX 1080 24 GB, and used IBM SPSS Statistics 23 for statistical analysis, and Python language (Version 3.6) in Jupyter Notebook (76) with scikit-learn (77), Tensorflow (78), Keras (79), imbalanced-learn (80) packages, and xgboost library (81), for data preprocessing and designing the prediction models.
Generally, standard performance measures such as accuracy, recall, precision, etc. are widely adopted for balanced datasets to estimate the results of the predictive models. However, the use of common metrics can mislead the results in a dataset with a skewed distribution. Especially in the medical domain, diagnosing the patient from general people for timely treatment can be seriously affected, and die in the worst situations. In addition, misdiagnosis of general people will cause a lot of unnecessary treatment costs and waste of medical resources. The performance of our proposed mortality prediction model will be evaluated by the balanced accuracy, area under the receiver operating characteristic curve (AUC), macro-averaged precision, recall, F1-score, and geometric mean (g-mean), where the macro-average gives equal weight to each class and compute the metric individually and then take the average. The mathematical expressions of the performance measures are shown in Equation (10–14), where true positive, false positive, true negative, and false negative in the confusion matrix are expressed as TP, FP, TN, and FN, respectively.
From the raw dataset, out-of-hospital AMI patients' data with hypertension (N = 5,602) was extracted as the experimental dataset which contained the survived patients of 5,402 (96.43%) and deceased patients 200 (3.57%) with 2-year follow-ups. Table 4 summarized the baseline characteristics of demographic information, clinical findings, medical history, and laboratory findings between the survived and deceased groups, and variables that were statistically significant between the two groups were boldfaced. The results showed that males were more likely to have AMI with hypertension than females. The mean age of the patients was 66.19 ± 11.68 years, and there was a difference of about 9 years between the survived group (65.87 ± 11.65) and the deceased group (74.69 ± 9.03) and was statistically significant (p ≤ 0.001***). In addition, the variables gender, age, weight, chest pain (typical), dyspnea (yes), heart rate, Killip class, current smoker (yes), LVEF, RWMI, history of diabetes mellitus, previous angina pectoris (yes), previous heart failure (yes), previous cerebrovascular disease (yes), neutrophil, lymphocyte, hemoglobin, glucose, creatinine, total cholesterol, triglyceride, hs-CRP, NTproBNP, BNP, and PRU, were statistically significant with p-value ≤ 0.001, as well as height ≤ 0.01, previous myocardial infarction (yes) ≤ 0.01, LDL ≤ 0.01, previous chest pain (yes) ≤ 0.05, use of CAG ≤ 0.05, HbA1c ≤ 0.05, ARU ≤ 0.05, respectively. On the other hand, abdominal circumference, SBP, DBP, ECG (yes), ST_change on ECG (yes), symptoms of MI (yes), MI ECG change (yes), use of thrombolysis, use of Echocardiogram, history of dyslipidemia (yes), family history of heart disease (yes), family history of early age ischemic heart disease (yes), WBC, platelet, maximum creatine kinase peek, maximum creatine kinase MB, troponin I, troponin T, and HDL were least significant with p-value > 0.05.
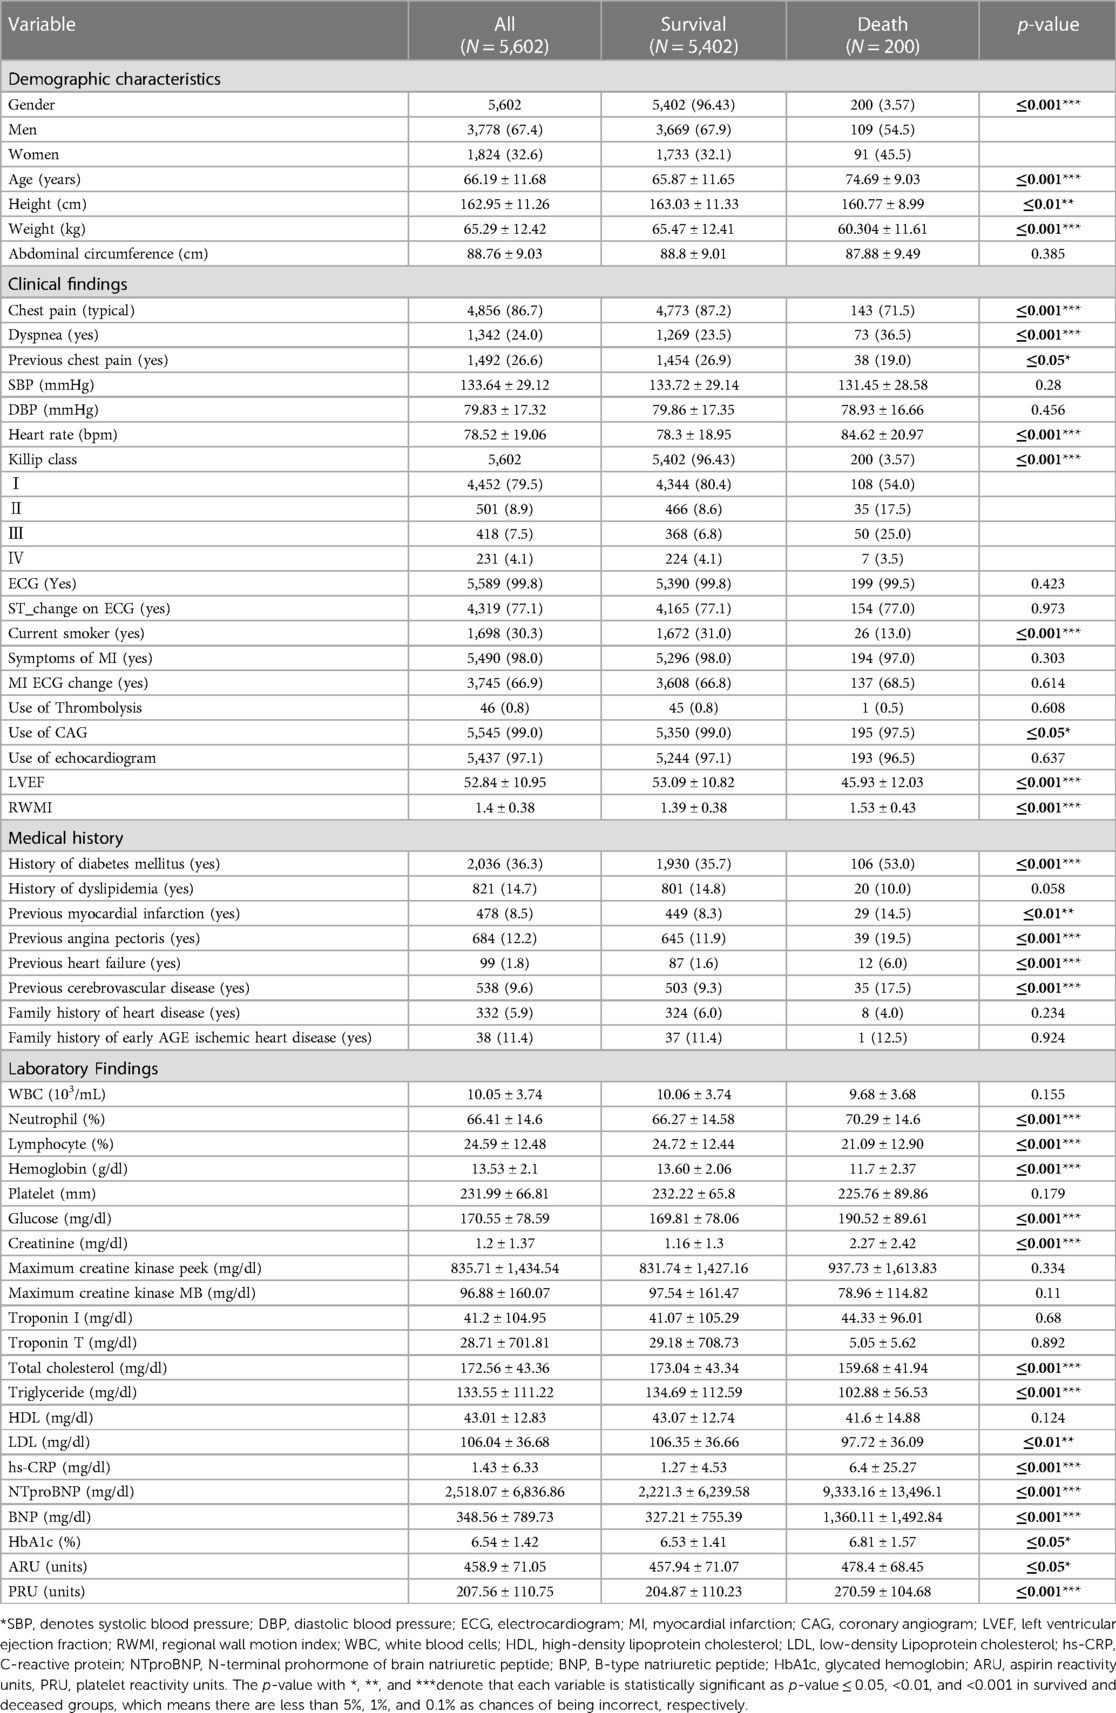
Table 4. The baseline characteristics of survived and deceased groups.
In this part, we examined the performance of the proposed CSDNN-based model as well as other famous ML-based models such as SVM, LR, DT, RF, AdaBoost, XGBoost, and classic data sampling-based ensemble models such as balanced bagging, balanced RF, EasyEnsemble, and RUSBoost for the mortality prediction of out of hospital AMI patients with hypertension. The performance was evaluated using balanced accuracy, AUC, macro-averaged precision, recall, F1-score, and g-mean. Tables 5–7 showed the performance comparison results of the proposed model and other prediction models on the original imbalanced data with and without feature selection, cost-sensitive learning, and threshold moving technique. The boldface expresses the best performance among compared models.
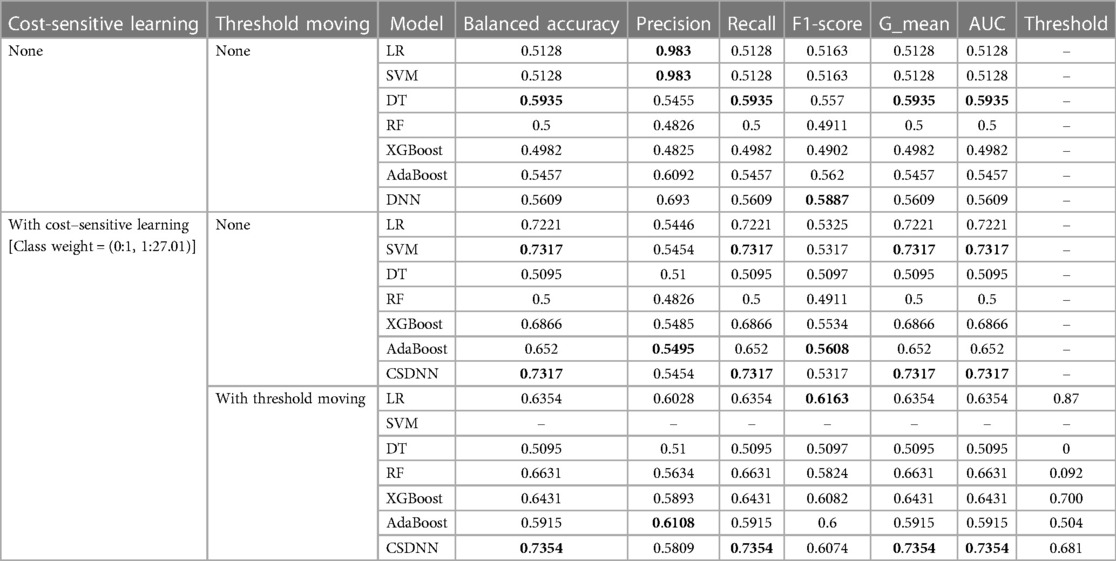
Table 5. Performance comparison of the proposed and machine learning-based prediction models without applying feature selection.
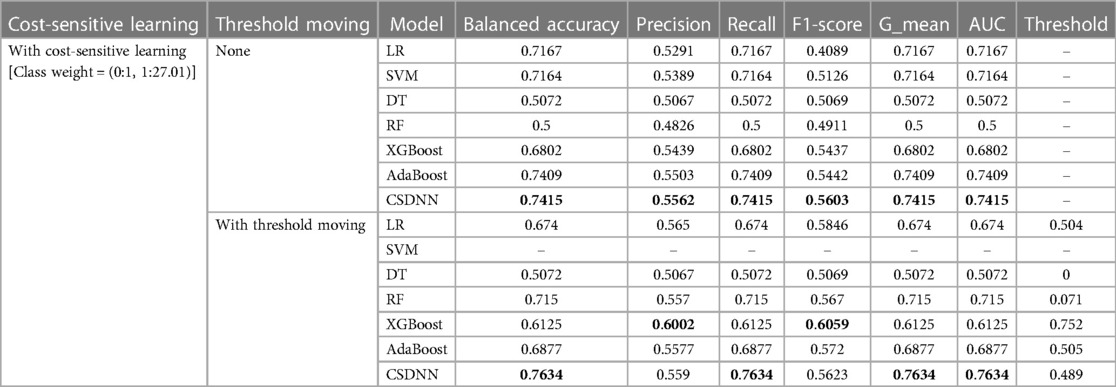
Table 6. Performance comparison of the proposed and machine learning-based prediction models with feature selection.
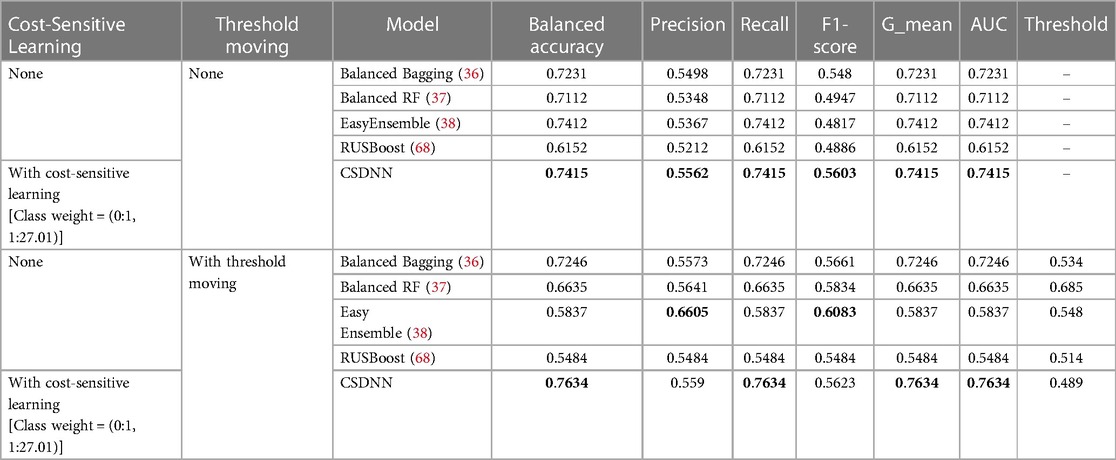
Table 7. Performance comparison of the proposed and classic data sampling-based ensemble prediction models with feature selection.
A total of 63 independent features were used to predict the mortality from the original imbalanced data. Table 5 showed the results of balanced accuracy, AUC, macro-averaged precision, recall, F1-score, and g-mean of the proposed model and other state-of-the-art ML-based models without applying the feature selection method. It can be divided into three different cases, (1) without applying cost-sensitive learning and threshold moving technique, (2) using cost-sensitive learning but without moving threshold, and (3) using both cost-sensitive learning and threshold moving technique. Moreover, the class_weight value of the cost-sensitive learning method applied in each algorithm was {0:1, 1:27.01}, which meant the class weight of the minority class was set up to 27.01 calculated by the IR. As shown in Table 5, it was evident that the issue of class imbalance affected every model. In the first case, the DT model got comparatively higher performance among all other models without using the cost-sensitive learning and threshold moving technique to solve the class imbalance problem. In the second case, the CSDNN model and SVM outperformed the other five models with cost-sensitive learning and without threshold moving techniques. Moreover, the CSDNN model showed the highest balanced accuracy of 0.7354, macro-averaged recall 0.7354, g-mean 0.7354, and AUC 0.7354, in the third case using both cost-sensitive learning and threshold moving technique. The class_weight value of {0:1, 1:27.01} was used in the proposed model and other ML-based prediction models with the cost-sensitive learning method. The default probability threshold of all classifiers is 0.5. However, the SVM prediction model with the threshold moving technique could not be applied since the LinearSVC classifier cannot predict the class probability of the samples.
After applying the RFE wrapper-based feature selection with a 5-fold cross-validation approach on the extracted experimental data, 27 optimal features were selected to predict the mortality in out-of-hospital AMI patients with hypertension. The optimal feature set consisted of age, heart rate, height, weight, abdominal circumference, WBC, neutrophil, lymphocyte, hemoglobin, platelet, glucose, creatinine, maximum creatine kinase peek, maximum creatine kinase MB, troponin I, troponin T, total cholesterol, HDL, LDL, hs-CRP, NTproBNP, BNP, ARU, PRU, LVEF, RWMI, and discharge heart rate. In Table 6, the performances of the proposed CSDNN-based model and other compared models with the optimal features were shown in two different cases. For instance, (1) using cost-sensitive learning but without moving threshold, (2) using both cost-sensitive learning and threshold moving techniques. The results demonstrated that the proposed model achieved the highest performance in both cases. The class_weight value of {0:1, 1:27.01} was also used for the cost-sensitive learning.
We also compared the performance of the proposed and classic data sampling-based ensemble prediction models. The performance comparison results of the proposed CSDNN model and classic data sampling-based ensemble models were shown in Table 7, which also included two cases, (1) without threshold moving, and (2) with threshold moving. The results indicated that the proposed CSDNN model obtained better performance than all data sampling-based ensemble prediction models in both cases.
To develop a more accurate prediction model and search for the best value of the parameter, we applied the grid-search with 3-fold cross-validation for our proposed CSDNN method to obtain the best AUC score. The result of the AUC score for different values was shown in Figure 3, which demonstrated that the optimal value was {0:1, 1:22.3} for the minority class. To clearly understand the proposed method, Table 8 compared the performance difference of the proposed model with and without feature selection, cost-sensitive learning, and threshold moving technique. There were two kinds of cases of the threshold moving technique, with the default value of {0:1, 1:27.01} or the optimal value of {0:1, 1:22.3} for the minority class, respectively. The results showed that after we applied the optimal value as {0:1, 1:22.3} to our dataset, the performance of our proposed CSDNN model was increased with the balanced accuracy of 0.7667, macro-averaged precision 0.5613, recall 0.7667, F1-score 0.5675, g-mean 0.7667, and AUC 0.7667.
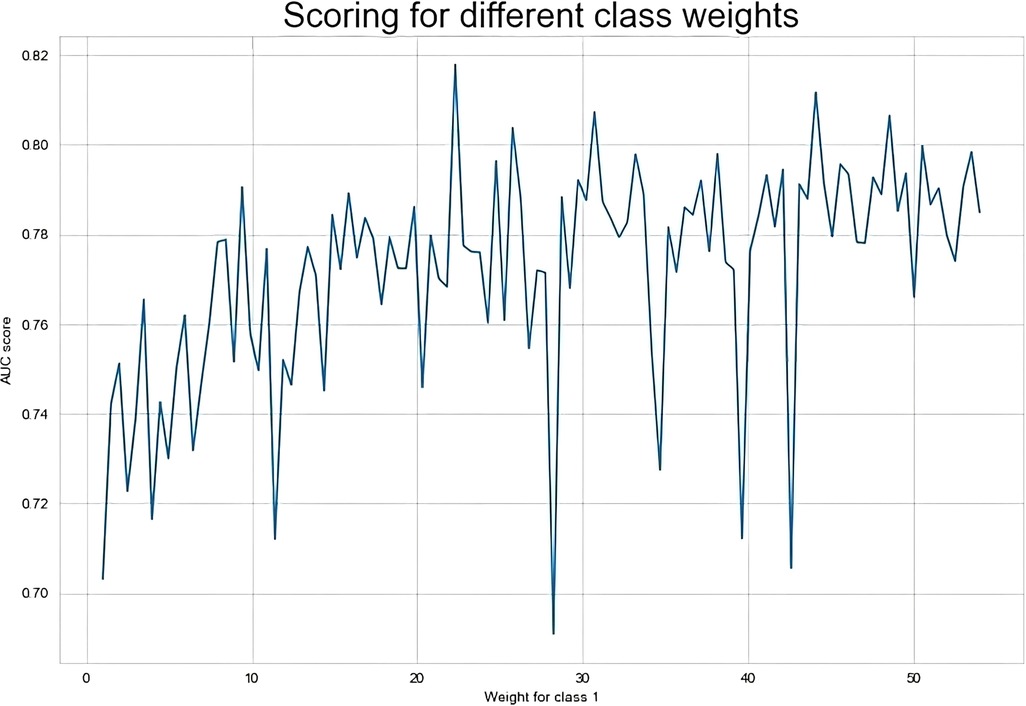
Figure 3. Result of the AUC score over different class weight values in the proposed model.
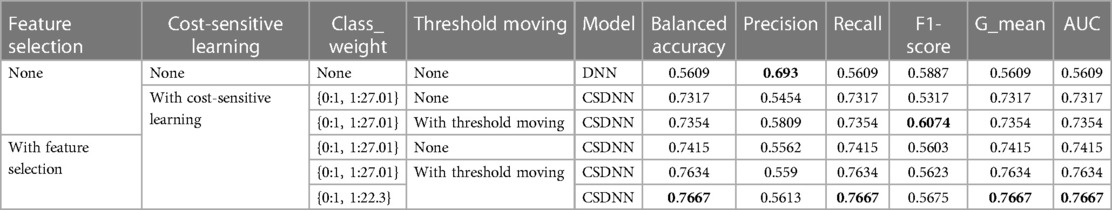
Table 8. Performance evaluation of the proposed models.
Additionally, the performance comparison of ROC curves on the proposed CSDNN model, state-of-the-art ML models, and classic data sampling-based ensemble models were also shown in Figure 4. Figures 4A–C showed the ROC curve comparisons between the CSDNN model and state-of-the-art ML classifiers on the three cases without applying the feature selection method on the original dataset, and Figures 4E–G showed the ROC curve comparisons between the CSDNN model, ML classifiers, and classic data sampling-based ensemble models on prescribed four cases with optimal features. As a result, ROC curves comparison in Figure 4A showed that the DT model obtained the best AUC of 0.5935 without feature selection, cost-sensitive learning, and threshold moving technique. In Figure 4B, the proposed model and SVM model exhibited the highest AUC of 0.7317 than other ML models, and the proposed model got a better AUC of 0.7354 than the other four models using the threshold moving technique as shown in Figure 4C. Figures 4D–G showed the ROC curves comparison of the proposed model with other models using the optimal features. In Figures 4D, F the proposed CSDNN model showed the best AUC of 0.7415 without moving the threshold, which was higher than the other models. Figures 4E, G demonstrated that the proposed model achieved the best AUC of 0.7667 with the optimal value. Additionally, Figure 5 demonstrated the ROC curve and precision-recall curve of the proposed model with the highest performance with feature selection, cost-sensitive learning, and threshold moving.
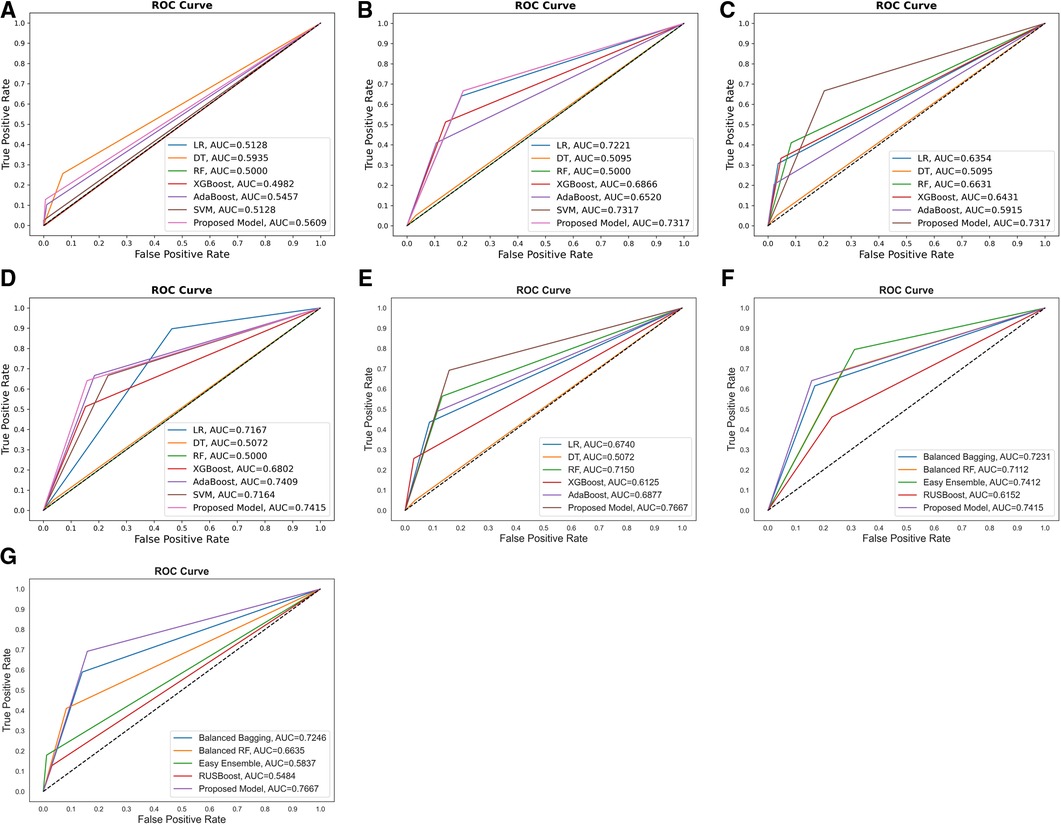
Figure 4. Comparison of the ROC curves of (A) proposed model and other ML models without feature selection, cost-sensitive learning, and threshold moving; (B) proposed model and others with cost-sensitive learning; (C) proposed model and others with cost-sensitive learning and threshold moving; (D) proposed model and others with feature selection and cost-sensitive learning; (E) proposed model and classic data sampling-based ensemble models with feature selection, cost-sensitive learning, and threshold moving; (F) proposed model and classic data sampling-based ensemble models with feature selection but without threshold moving; (G) proposed model and classic data sampling-based ensemble models with feature selection and threshold moving.
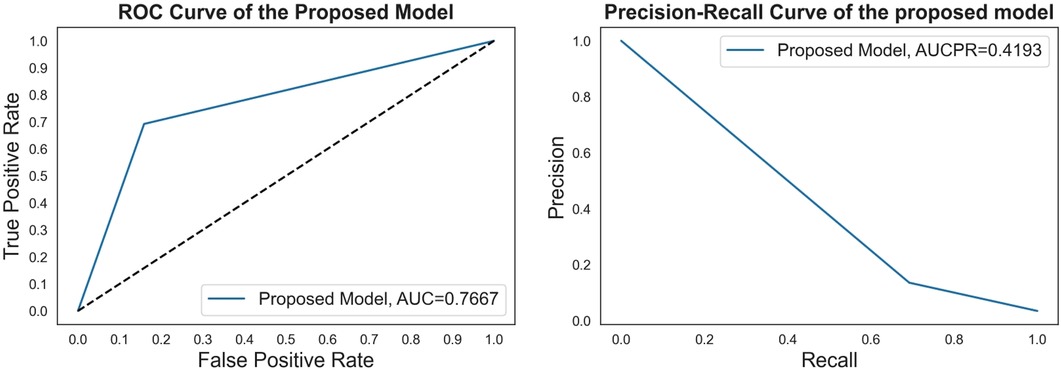
Figure 5. The ROC curve and precision-recall curve of the proposed model with feature selection, cost-sensitive learning, and threshold moving.
The confusion matrices of the proposed CSDNN model using the optimal features with and without moving the threshold were shown in Figure 6, where Figure 6A showed the confusion matrix and normalized confusion matrix of the proposed model without shifting the threshold and Figure 6B with moving the threshold. The figure shows the predicted class labels on the x-axis and the actual class labels on the y-axis, as well as 0 and 1 representing the survived and deceased patients, respectively. In the confusion matrix, the higher value for (0, 0) and (1, 1) indicates the more accurate prediction model for mortality in out-of-hospital AMI patients with hypertension. As a result, Figure 6A showed that the proposed CSDNN model without adjusting the threshold could predict 84% of the survived (N = 911) and 64% deceased (N = 25) patients accurately from the total population. The proposed model with moving the threshold was able to accurately predict 84% of the survived (N = 910) and 69% deceased (N = 27) patients as shown in Figure 6B, which was much higher than the result without applying the threshold moving technique.
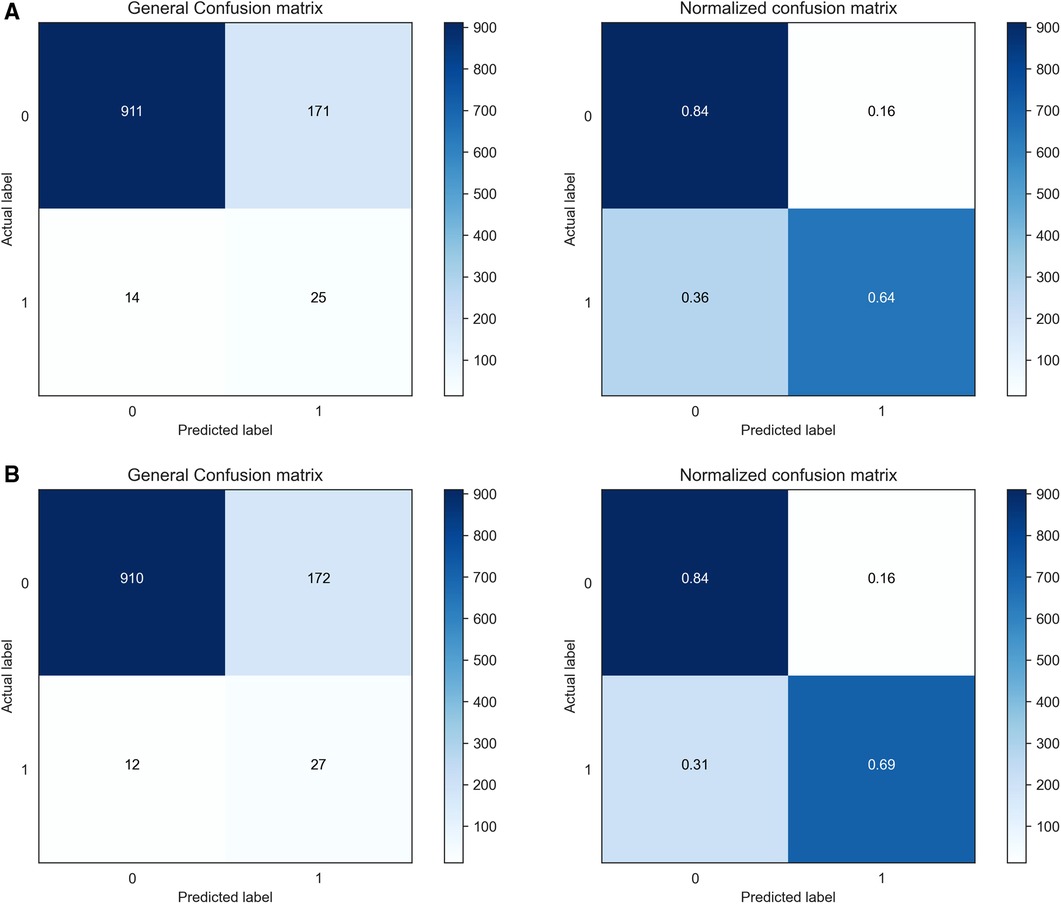
Figure 6. Confusion matrices and normalized confusion matrices of the proposed CSDNN model with the feature selection. (A) without threshold moving; (B) with threshold moving.
The mortality of CVD is continuously increasing every year globally and is strongly influenced by hypertension (3, 7). Early detection and management of people at risk before their symptoms appear is important. DL approaches have shown high performance in different domains, including healthcare (20–26), etc. Therefore, this paper was motivated to propose an accurate mortality prediction model for out-of-hospital Korean AMI patients with hypertension. In the experiment, the real-world AMI patients' dataset named KAMIR-NIH was used with 2-year follow-ups.
Since the experimental data was imbalanced, the cost-sensitive learning technique was performed in the proposed method. The effectiveness of the proposed model was proved by comparing it with other state-of-the-art ML and classic data sampling-based ensemble models. The results showed that the proposed CSDNN model could achieve better performance than all compared models. The cost-sensitive learning method could also improve the performance in most compared models such as LR, SVM, XGBoost, AdaBoost, etc. It also indicated that the cost-sensitive learning technique was a good solution to solve the class imbalance problem in the experimental data, which is supported by (30). In addition, optimizing the class weight value could also increase the final decision performance of the proposed model, and this result is consistent with a previous study (82). Figures 4E, G demonstrated that the proposed model achieved the best AUC of 0.7667 with the optimal value, which increased the AUC by 2.58% than the best performance of the state-of-the-art ML model AdaBoost and the AUC by 2.55% than the highest performance of the classic data sampling-based ensemble model EasyEnsemble for the mortality prediction of out of hospital AMI patients with hypertension.
Moreover, the performance of the proposed method was also improved by using the probability threshold moving technique. The results showed that the performance increased by about 3.5% of the proposed CSDNN model from the AUC of 0.7317–0.7667. It demonstrated the effectiveness of the threshold moving technique for the class imbalance problem, which is consistent with (35). However, the DT model with the cost-sensitive learning, and with and without shifting the threshold showed lower performance using the original features as well as the optimal extracted features. The reason for this is that the DT algorithm was proposed to predict the class correctly instead of the probability estimation (55). Additionally, the efficiency of developing the proposed model and other compared models was increased by using the RFE wrapper-based feature selection method, and the performances of the proposed model and many compared models such as LR, AdaBoost, etc. were also improved. The automatically selected 27 optimal features have been used as important risk factors related to the prediction of CVD patients in different studies (18, 41). The outcome can be a point of reference for various considerations by clinical experts for CVD prediction.
Several classic data sampling-based ensemble methods such as balanced bagging, balanced RF, EasyEnsemble, and RUSBoost were developed for the classification of imbalanced data. The proposed model which integrated the DNN, cost-sensitive learning, and threshold moving technique achieved better prediction performance than those methods. The current research established that it was also best practice to think about integrating various techniques for better prediction improvements. Finally, the proposed CSDNN model can be used as an aided diagnosis system for decision support in the mortality prediction of out-of-hospital AMI patients with hypertension.
However, there are several potential limitations in this paper. First, the result of this paper may not be suitable for patients from other populations due to the use of the Korean AMI dataset. Second, the proposed prediction model may not provide good performance for in-hospital patients or patients with short-term follow-ups since the experimental dataset used in this research was with 2-year follow-ups. Third, the experimental dataset was insufficient for the DL models since the DL models are data-hungry, and we could not collect more data. Moreover, the DL model was opaque even though it showed better results than other models.
In this paper, a CSDNN-based mortality prediction model was proposed for out-of-hospital Korean AMI patients with hypertension based on the real-world KAMIR-NIH dataset with 2-year follow-ups on imbalanced data. It was worthwhile to apply the cost-sensitive learning technique to overcome the imbalanced data problem and use the threshold moving technique to enhance the performance while using the feature selection method to increase efficiency. The results of our experiment showed that the proposed model outperformed other ML-based models and classic data sampling-based ensemble models with an AUC of 2.58% and 2.55% improvement over the best state-of-the-art ML model and the classic data sampling-based ensemble model, respectively. It is also expected that the results of this research will be useful for the decision-making of mortality prediction in AMI patients with hypertension. In the future, it is expected to collect more datasets from different countries to design an accurate and explainable mortality prediction model for multiple races.
Publicly available datasets were analyzed in this study. This data can be found here: The experimental datasets are confidential and available with the permission of the Korea Acute Myocardial Infarction Registry (KAMIR, http://kamir6.kamir.or.kr/) on reasonable request.
The studies involving human participants were reviewed and approved by Korea Acute Myocardial Infarction Registry(KAMIR, http://kamir6.kamir.or.kr/). Written informed consent was not required for this study, in accordance with the local legislation and institutional requirements.
HZ: Conceptualization, Formal Analysis, Investigation, Methodology, Validation, Visualization, Writing – original draft. SS: Conceptualization, Investigation, Validation, Writing – review & editing. JL: Conceptualization, Funding acquisition, Investigation, Project administration, Supervision, Validation, Writing – review & editing.
The author(s) declare that financial support was received for the research, authorship, and/or publication of this article.
This research was supported by Basic Science Research Program through the National Research Foundation of Korea (NRF) funded by the Ministry of Education (2022R1F1A1063003).
The authors would like to thank the editor and the reviewers for their suggestions to improve the manuscript. They also like to thank the Korea Acute Myocardial Infarction Registry (KAMIR), a nationwide, multicenter data collection registry, for providing the data for the experiments.
The authors declare that the research was conducted in the absence of any commercial or financial relationships that could be construed as a potential conflict of interest.
All claims expressed in this article are solely those of the authors and do not necessarily represent those of their affiliated organizations, or those of the publisher, the editors and the reviewers. Any product that may be evaluated in this article, or claim that may be made by its manufacturer, is not guaranteed or endorsed by the publisher.
1. World Health Organization (WHO), Noncommunicable diseases. (2022). Available online at: https://www.who.int/news-room/fact-sheets/detail/noncommunicable-diseases (accessed August 10, 2023).
2. World Health Organization (WHO), Cardiovascular diseases (CVDs). (2021). Available online at: https://www.who.int/news-room/fact-sheets/detail/cardiovascular-diseases-(cvds) (accessed August 10, 2023).
3. World Health Organization (WHO), Hypertension. (2023). Available online at: https://www.who.int/news-room/fact-sheets/detail/hypertension (accessed August 10, 2023).
4. Zhou B, Bentham J, Di Cesare M, Bixby H, Danaei G, Cowan MJ, et al. Worldwide trends in blood pressure from 1975 to 2015: a pooled analysis of 1479 population-based measurement studies with 19· 1 million participants. Lancet. (2017) 389(10064):37–55. doi: 10.1016/S0140-6736(16)31919-5
5. Ye C, Fu T, Hao S, Zhang Y, Wang O, Jin B, et al. Prediction of incident hypertension within the next year: prospective study using statewide electronic health records and machine learning. J Med Internet Res. (2018) 20(1):e22–41. doi: 10.2196/jmir.9268
6. World Health Organization (WHO), Hypertension. (2023). Available online at: https://www.who.int/health-topics/hypertension#tab=tab_1 (accessed August 10, 2023).
7. Stamler J, Stamler R, Neaton JD. Blood pressure, systolic and diastolic, and cardiovascular risks: uS population data. Arch Intern Med. (1993) 153(5):598–615. doi: 10.1001/archinte.1993.00410050036006
8. James PA, Oparil S, Carter BL, Cushman WC, Dennison-Himmelfarb C, Handler J, et al. 2014 evidence-based guideline for the management of high blood pressure in adults: report from the panel members appointed to the eighth joint national committee (JNC 8). JAMA. (2014) 311(5):507–20. doi: 10.1001/jama.2013.284427
9. Lee H, Yano Y, Cho SMJ, Park JH, Park S, Lloyd-Jones DM, et al. Cardiovascular risk of isolated systolic or diastolic hypertension in young adults. Circulation. (2020) 141(22):1778–86. doi: 10.1161/CIRCULATIONAHA.119.044838
10. Tang EW, Wong CK, Herbison P. Global registry of acute coronary events (GRACE) hospital discharge risk score accurately predicts long-term mortality post acute coronary syndrome. Am Heart J. (2007) 153(1):29–35. doi: 10.1016/j.ahj.2006.10.004
11. Conroy RM, Pyörälä K, Fitzgerald AE, Sans S, Menotti A, De Backer G, et al. Estimation of ten-year risk of fatal cardiovascular disease in Europe: the SCORE project. Eur Heart J. (2003) 24(11):987–1003. doi: 10.1016/S0195-668X(03)00114-3
12. Antman EM, Cohen M, Bernink PJ, McCabe CH, Horacek T, Papuchis G, et al. The TIMI risk score for unstable angina/non–ST elevation MI: a method for prognostication and therapeutic decision making. JAMA. (2000) 284(7):835–42. doi: 10.1001/jama.284.7.835
13. D'Agostino RB Sr, Pencina MJ, Massaro JM, Coady S. Cardiovascular disease risk assessment: insights from framingham. Glob Heart. (2013) 8(1):11–23. doi: 10.1016/j.gheart.2013.01.001
14. Chowdhury MZI, Naeem I, Quan H, Leung AA, Sikdar KC, O’Beirne M, et al. Prediction of hypertension using traditional regression and machine learning models: a systematic review and meta-analysis. PloS One. (2022) 17(4):e0266334–0266363. doi: 10.1371/journal.pone.0266334
15. Sherazi SWA, Jeong YJ, Jae MH, Bae JW, Lee JY. A machine learning–based 1-year mortality prediction model after hospital discharge for clinical patients with acute coronary syndrome. Health Informatics J. (2020) 26(2):1289–304. doi: 10.1177/1460458219871780
16. Chang W, Liu Y, Xiao Y, Yuan X, Xu X, Zhang S, et al. A machine-learning-based prediction method for hypertension outcomes based on medical data. Diagnostics. (2019) 9(4):178–99. doi: 10.3390/diagnostics9040178
17. Weng SF, Reps J, Kai J, Garibaldi JM, Qureshi N. Can machine-learning improve cardiovascular risk prediction using routine clinical data? PloS One. (2017) 12(4):e0174944. doi: 10.1371/journal.pone.0174944
18. Zheng H, Sherazi SWA, Lee JY. A stacking ensemble prediction model for the occurrences of major adverse cardiovascular events in patients with acute coronary syndrome on imbalanced data. IEEE Access. (2021) 9:113692–704. doi: 10.1109/ACCESS.2021.3099795
19. Shrestha A, Mahmood A. Review of deep learning algorithms and architectures. IEEE Access. (2019) 7:53040–65. doi: 10.1109/ACCESS.2019.2912200
20. Kleppe A, Skrede OJ, De Raedt S, Liestøl K, Kerr DJ, Danielsen HE. Designing deep learning studies in cancer diagnostics. Nat Rev Cancer. (2021) 21(3):199–211. doi: 10.1038/s41568-020-00327-9
21. Ali L, Rahman A, Khan A, Zhou M, Javeed A, Khan JA. An automated diagnostic system for heart disease prediction based on X2 statistical model and optimally configured deep neural network. IEEE Access. (2019) 7:34938–45. doi: 10.1109/ACCESS.2019.2904800
22. Das S, Sharma R, Gourisaria MK, Rautaray SS, Pandey M. Heart disease detection using core machine learning and deep learning techniques: a comparative study. Int J Emerg Technol. (2020) 11(3):531–8.
23. Baptista D, Ferreira PG, Rocha M. Deep learning for drug response prediction in cancer. Brief Bioinform. (2021) 22(1):360–79. doi: 10.1093/bib/bbz171
24. Naqvi RA, Hussain D, Loh WK. Artificial intelligence-based semantic segmentation of ocular regions for biometrics and healthcare applications. Comput Mater Contin. (2021) 66(1):715–32. doi: 10.32604/cmc.2020.013249
25. Sharif SMA, Naqvi RA, Biswas M, Loh WK. Deep perceptual enhancement for medical image analysis. IEEE J Biomed Health Inform. (2022) 26(10):4826–36. doi: 10.1109/JBHI.2022.3168604
26. Jafar A, Hameed MT, Akram N, Waqas U, Kim HS, Naqvi RA. Cardionet: automatic semantic segmentation to calculate the cardiothoracic ratio for cardiomegaly and other chest diseases. J Pers Med. (2022) 12(6):988–1008. doi: 10.3390/jpm12060988
27. Sze V, Chen YH, Yang TJ, Emer JS. Efficient processing of deep neural networks: a tutorial and survey. Proc IEEE. (2017) 105(12):2295–329. doi: 10.1109/JPROC.2017.2761740
28. Krawczyk B. Learning from imbalanced data: open challenges and future directions. Prog Artif Intell. (2016) 5(4):221–32. doi: 10.1007/s13748-016-0094-0
29. Wang Q, Cao W, Guo J, Ren J, Cheng Y, Davis DN. DMP_MI: an effective diabetes mellitus classification algorithm on imbalanced data with missing values. IEEE Access. (2019) 7:102232–38. doi: 10.1109/ACCESS.2019.2929866
30. Mienye ID, Sun Y. Performance analysis of cost-sensitive learning methods with application to imbalanced medical data. Inform Med Unlocked. (2021) 25:100690–99. doi: 10.1016/j.imu.2021.100690
31. Zhenya Q, Zhang Z. A hybrid cost-sensitive ensemble for heart disease prediction. BMC Med Inform Decis Mak. (2021) 21:1–18. doi: 10.1186/s12911-021-01436-7
32. Mulugeta G, Zewotir T, Tegegne AS, Juhar LH, Muleta MB. Classification of imbalanced data using machine learning algorithms to predict the risk of renal graft failures in Ethiopia. BMC Med Inform Decis Mak. (2023) 23(1):98. doi: 10.1186/s12911-023-02185-5
33. Zhu M, Xia J, Jin X, Yan M, Cai G, Yan J, et al. Class weights random forest algorithm for processing class imbalanced medical data. IEEE Access. (2018) 6:4641–52. doi: 10.1109/ACCESS.2018.2789428
34. Geng L, Qu W, Wang S, Chen J, Xu Y, Kong W, et al. Prediction of diagnosis results of rheumatoid arthritis patients based on autoantibodies and cost-sensitive neural network. Clin Rheumatol. (2022) 41(8):2329–39. doi: 10.1007/s10067-022-06109-y
35. Zheng J. Cost-sensitive boosting neural networks for software defect prediction. Expert Syst Appl. (2010) 37(6):4537–43. doi: 10.1016/j.eswa.2009.12.056
36. Jiang T, Huang P, Zhou K. Cost-efficiency disk failure prediction via threshold-moving. Concurr Comput Pract. (2020) 32(14):e5669–5682. doi: 10.1002/cpe.5669
37. Hido S, Kashima H, Takahashi Y. Roughly balanced bagging for imbalanced data. Stat Anal Data Min. (2009) 2(5-6):412–26. doi: 10.1002/sam.10061
38. Chen C, Liaw A, Breiman L. Using Random Forest to Learn Imbalanced Data. Berkeley: University of California (2004), 110(1-12), 24.
39. Korea Acute Myocardial Infarction Registry. (2023). Available online at: http://kamir6.kamir.or.kr (accessed August 10, 2023).
40. Kim Y, Ahn Y, Cho MC, Kim CJ, Kim YJ, Jeong MH. Current status of acute myocardial infarction in Korea. Korean J Med. (2019) 34(1):1–10. doi: 10.3904/kjim.2018.381
41. Lee HC, Park JS, Choe JC, Ahn JH, Lee HW, Oh JH, et al. Prediction of 1-year mortality from acute myocardial infarction using machine learning. Am J Cardiol. (2020) 133:23–31. doi: 10.1016/j.amjcard.2020.07.048
42. Sherazi SWA, Bae JW, Lee JY. A soft voting ensemble classifier for early prediction and diagnosis of occurrences of major adverse cardiovascular events for STEMI and NSTEMI during 2-year follow-up in patients with acute coronary syndrome. PloS One. (2021) 16(6):e0249338. doi: 10.1371/journal.pone.0249338
43. Johnson JM, Khoshgoftaar TM. Survey on deep learning with class imbalance. J Big Data. (2019) 6(1):1–54. doi: 10.1186/s40537-018-0162-3
44. Lin WC, Tsai CF. Missing value imputation: a review and analysis of the literature (2006–2017). Artif Intell Rev. (2020) 53:1487–509. doi: 10.1007/s10462-019-09709-4
45. Batista GE, Monard MC. A study of K-nearest neighbour as an imputation method. In Second International Conference on Hybrid Intelligent Systems, 87(251-260), 48. (2002).
46. Bania RK, Halder A. R-Ensembler: a greedy rough set based ensemble attribute selection algorithm with kNN imputation for classification of medical data. Comput Methods Programs Biomed. (2020) 184:105122. doi: 10.1016/j.cmpb.2019.105122
47. Celton M, Malpertuy A, Lelandais G, De Brevern AG. Comparative analysis of missing value imputation methods to improve clustering and interpretation of microarray experiments. BMC Genom. (2010) 11:1–16. doi: 10.1186/1471-2164-11-15
48. Yildirim P. Filter based feature selection methods for prediction of risks in hepatitis disease. Int J Mach Learn Comput. (2015) 5(4):258–63. doi: 10.7763/IJMLC.2015.V5.517
49. Mustaqeem A, Anwar SM, Majid M, Khan AR. Wrapper method for feature selection to classify cardiac arrhythmia. In 2017 39th Annual International Conference of the IEEE Engineering in Medicine and Biology Society (EMBC). IEEE (2017). p 3656–9.
50. Zheng H, Park HW, Li D, Park KH, Ryu KH. A hybrid feature selection approach for applying to patients with diabetes mellitus: knhanes 2013-2015. In 2018 5th NAFOSTED Conference on Information and Computer Science (NICS). IEEE (2018). p 110–3
51. Long NC, Meesad P, Unger H. A highly accurate firefly based algorithm for heart disease prediction. Expert Syst. Appl. (2015) 42(21):8221–31. doi: 10.1016/j.eswa.2015.06.024
52. Fernández A, García S, Galar M, Prati RC, Krawczyk B, Herrera F, et al. Cost-sensitive learning. In: Learning from imbalanced data sets. Cham: Springer (2018). p. 63–78. doi: 10.1007/978-3-319-98074-4_4
53. Zhang C, Tan KC, Li H, Hong GS. A cost-sensitive deep belief network for imbalanced classification. IEEE Trans Neural Netw Learn. (2018) 30(1):109–22. doi: 10.1109/TNNLS.2018.2832648
54. Siddiqui MK, Huang X, Morales-Menendez R, Hussain N, Khatoon K. Machine learning based novel cost-sensitive seizure detection classifier for imbalanced EEG data sets. Int J Interact Des Manuf. (2020) 14:1491–509. doi: 10.1007/s12008-020-00715-3
55. Ling CX, Sheng VS. Cost-sensitive learning and the class imbalance problem. Ency Mach Learn. (2008) 2011:231–5.
56. Ho Y, Wookey S. The real-world-weight cross-entropy loss function: modeling the costs of mislabeling. IEEE Access. (2019) 8:4806–13. doi: 10.1109/ACCESS.2019.2962617
57. Rumelhart DE, Hinton GE, Williams RJ. Learning representations by back-propagating errors. Nature. (1986) 323(6088):533–6. doi: 10.1038/323533a0
58. Sharma S, Sharma S, Athaiya A. Activation functions in neural networks. Towards Data Sci. (2017) 6(12):310–6.
59. Kingma DP, Ba J. (2014). Adam: A method for stochastic optimization. arXiv [Preprint] arXiv:1412.6980. Available online at: Available at: https://arxiv.org/abs/1412.6980 (accessed March 10, 2024).
60. Prechelt L. Early stopping-but when?. In Neural Networks: Tricks of the Trade, Heidelberg, Germany: Springer (2002). p 55–69.
61. Hearst MA, Dumais ST, Osuna E, Platt J, Scholkopf B. Support vector machines. IEEE Intell Sys Their Appl. (1998) 13(4):18–28. doi: 10.1109/5254.708428
62. Bagley SC, White H, Golomb BA. Logistic regression in the medical literature: standards for use and reporting, with particular attention to one medical domain. J Clin Epidemiol. (2001) 54(10):979–85. doi: 10.1016/S0895-4356(01)00372-9
63. Gordon AD, Breiman L, Friedman JH, Olshen RA, Stone CJ. Classification and regression trees. Biometrics. (1984) 40(3):874. doi: 10.2307/2530946
65. Freund Y, Schapire RE. A decision-theoretic generalization of on-line learning and an application to boosting. J Comput Syst Sci. (1997) 55(1):119–39. doi: 10.1006/jcss.1997.1504
66. Chen T, Guestrin C. Xgboost: a scalable tree boosting system. In Proceedings of the 22nd acm sigkdd International Conference on Knowledge Discovery and Data Mining, San Francisco California, USA: ACM (2016). p 785–94
67. Song X, Tong Y, Luo Y, Chang H, Gao G, Dong Z, et al. Predicting 7-day unplanned readmission in elderly patients with coronary heart disease using machine learning. Front Cardiovasc Med. (2023) 10:1190038. doi: 10.3389/fcvm.2023.1190038
68. Liu XY, Wu J, Zhou ZH. Exploratory undersampling for class-imbalance learning. IEEE Trans Syst Man Cybern Syst. Part B: Cybernetics. (2008) 39(2):539–50. doi: 10.1109/TSMCB.2008.2007853
69. Seiffert C, Khoshgoftaar TM, Van Hulse J, Napolitano A. RUSBoost: a hybrid approach to alleviating class imbalance. IEEE Trans Syst Man Cybern Syst, Part A: Systems and Humans. (2009) 40(1):185–97. doi: 10.1109/TSMCA.2009.2029559
70. Chang CC, Lin CJ. LIBSVM: a library for support vector machines. ACM Trans Intell Syst Technol. (2011) 2(3):1–27. doi: 10.1145/1961189.1961199
71. Bergstra J, Bengio Y. Random search for hyper-parameter optimization. J Mach Learn Res. (2012) 13(2):281–305.
72. Liashchynskyi P, Liashchynskyi P. (2019). Grid search, random search, genetic algorithm: a big comparison for NAS. arXiv [Preprint]. arXiv:1912.06059. Available online at: https://arxiv.org/abs/1912.06059 (accessed March 10, 2024).
73. Xiao X, Yan M, Basodi S, Ji C, Pan Y. (2020). Efficient hyperparameter optimization in deep learning using a variable length genetic algorithm. arXiv [Preprint]. arXiv:2006.12703. Available online at: https://arxiv.org/abs/2006.12703 (accessed March 10, 2024).
74. Pearson K. On the criterion that a given system of deviations from the probable in the case of a correlated system of variables is such that it can be reasonably supposed to have arisen from random sampling. Lond Edinb Dublin Philos Mag J Sci. (1900) 50(302):157–75. doi: 10.1080/14786440009463897
76. Jupyter.org. Project Jupyter. (2023). Available online at: http://jupyter.org/ (accessed August 10, 2023).
77. Pedregosa F, Varoquaux G, Gramfort A, Michel V, Thirion B, Grisel O, et al. Scikit-learn: machine learning in python. J Mach Learn Res. (2011) 12:2825–30.
78. Abadi M., Agarwal A., Barham P., Brevdo E., Chen Z., Citro C., et al. (2016). Tensorflow: Large-scale machine learning on heterogeneous distributed systems. arXiv [Preprint]. arXiv:1603.04467. Available online at: https://arxiv.org/abs/1603.04467 (accessed March 10, 2024).
79. Keras.io. Keras Documentation. (2023). Available online at: https://keras.io/ (accessed August 10, 2023).
80. Lemaître G, Nogueira F, Aridas CK. Imbalanced-learn: a python toolbox to tackle the curse of imbalanced datasets in machine learning. J Mach Learn Res. (2017) 18(1):559–63.
81. Brownlee J. XGBoost with python: gradient boosted trees with XGBoost and scikit-learn. Mach Learn Mastery. (2016) 1:1–109.
Keywords: acute myocardial infarction, mortality prediction, hypertension, deep learning, cost-sensitive learning, threshold moving
Citation: Zheng H, Sherazi SWA and Lee JY (2024) A cost-sensitive deep neural network-based prediction model for the mortality in acute myocardial infarction patients with hypertension on imbalanced data. Front. Cardiovasc. Med. 11:1276608. doi: 10.3389/fcvm.2024.1276608
Received: 12 September 2023; Accepted: 4 March 2024;
Published: 19 March 2024.
Edited by:
Claudio de Lucia, Local Health Authority Naples 1 Center, ItalyReviewed by:
Jianwei Zheng, Charles R. Drew University of Medicine and Science, United States© 2024 Zheng, Sherazi and Lee. This is an open-access article distributed under the terms of the Creative Commons Attribution License (CC BY). The use, distribution or reproduction in other forums is permitted, provided the original author(s) and the copyright owner(s) are credited and that the original publication in this journal is cited, in accordance with accepted academic practice. No use, distribution or reproduction is permitted which does not comply with these terms.
*Correspondence: Jong Yun Lee am9uZ3l1bkBjaHVuZ2J1ay5hYy5rcg==
Disclaimer: All claims expressed in this article are solely those of the authors and do not necessarily represent those of their affiliated organizations, or those of the publisher, the editors and the reviewers. Any product that may be evaluated in this article or claim that may be made by its manufacturer is not guaranteed or endorsed by the publisher.
Research integrity at Frontiers
Learn more about the work of our research integrity team to safeguard the quality of each article we publish.