 Tao-jun Ren1,2,†
 Kun Zhang1,2,†Wen-juan Li3
 Shu-tang Ren2Yun-zhou Huang2Ning Yang2
 Shou-ling Wu4*Yu-ming Li2*
- 1Clinical School of Cardiovascular Disease, Tianjin Medical University, Tianjin, China
- 2Department of Cardiology, TEDA International Cardiovascular Hospital, Tianjin, China
- 3Graduate School, North China University of Science and Technology, Tangshan, China
- 4Department of Cardiology, Kailuan General Hospital, Tangshan, China
Objective: This study aimed to investigate the association between BMI combined with neck circumference and the risk of hypertension.
Methods: We selected participants from the Kailuan study in 2014 who were normotensive as our research subjects. We compared the risk of hypertension among individuals in group 1 (non-obese with low neck circumference), group 2 (non-obese with high neck circumference), group 3 (obese with low neck circumference), and group 4 (obese with high neck circumference).
Results: After a median observation period of 3.86 years, hypertension occurred in 13,383 participants. Subjects in Group 2, 3, and 4 had significantly higher risks of hypertension compared to Group 1, with hazard ratios (HRs) of 1.066 (95% CI: 1.025, 1.110), 1.322 (95% CI: 1.235, 1.415), and 1.422 (95% CI: 1.337, 1.512), respectively. Additionally, adding BMI to a conventional model had a greater incremental effect on predicting hypertension compared to adding neck circumference alone. However, considering both BMI and neck circumference together further improved the prediction of hypertension.
Conclusion: Individuals with both high BMI and high neck circumference face a higher risk of hypertension. Moreover, BMI is a superior predictor of hypertension risk compared to neck circumference, but using both of these measures can further enhance the accuracy of hypertension risk prediction.
Introduction
Hypertension is a significant global public health challenge characterized by high prevalence and disability rates. In 2019, the World Health Organization reported an age-standardized prevalence of hypertension in adults aged 30–79 years worldwide, with rates of 34% in men and 32% in women (1). In China, the prevalence of hypertension has continued to rise over the past three decades due to factors such as population aging and unhealthy lifestyles. The prevalence of hypertension (≥140/90 mmHg) surged from 11.3% in 1991 (2) to 18.8% in 2002 (3), and to 23.2% in 2012–2015 (4). Consequently, hypertension remains a significant health concern in China. Hypertension can lead to multiple organ damage and increase the risk of cardiovascular events, renal diseases, and cerebrovascular accidents. It is crucial to identify individuals at high risk of developing hypertension early to prevent and manage this condition effectively.
Risk factors for hypertension include high-sodium and low-potassium diets, physical inactivity, psychosocial stress, smoking, alcohol consumption, lack of sleep, and obesity (5). Obesity, often assessed by body mass index (BMI), is a well-established risk factor for elevated blood pressure, and obese individuals are at higher risk of developing hypertension than those with a normal BMI (6). Neck circumference, a novel measure of central obesity, has also been found to be positively correlated with blood pressure (7, 8). However, there is a scarcity of prospective studies investigating the association between neck circumference and hypertension. To our knowledge, no studies have determined whether BMI or neck circumference is the superior predictor of hypertension risk or if their combined use enhances predictive accuracy. Therefore, this prospective cohort study aimed to investigate the roles of BMI and neck circumference in estimating the future risk of hypertension in the Kailuan population in Hebei, China.
Methods
Study design and study population
The Kailuan study is a community-based research project conducted in Tangshan, a city in northern China. The initial physical examination of employed and retired Kailuan Group employees at Kailuan General Hospital and its 11 affiliated hospitals took place in 2006–2007 (FY2006), with follow-up visits every two years. The 5th follow-up visit (FY 2014) introduced the measurement of neck circumference. For this study, we selected participants from the 2014 health examination as research subjects.
Inclusion criteria were as follows: (1) participation in the 2014 health examination; (2) complete information on BMI and neck circumference; (3) agreement to participate in this study and signing of informed consent. Exclusion criteria included: (1) participants with hypertension in 2014; (2) lack of blood pressure data during follow-up. The flow chart is presented in Figure 1. This study adhered to the Declaration of Helsinki and received approval from the Ethics Committee of Kailuan General Hospital (200605).
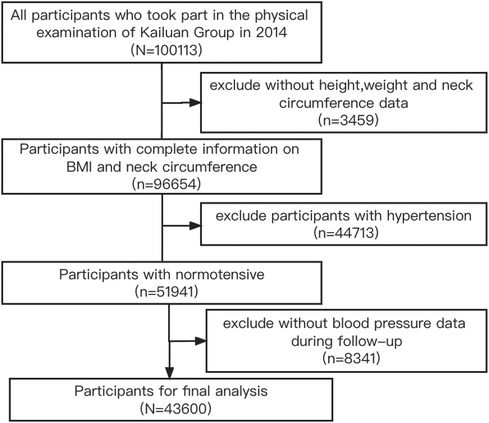
Figure 1. Flow chart of inclusion and exclusion.
Data collection
BMI measurement
Height was measured without shoes or hats with an accuracy of 0.1 cm, and weight was measured using calibrated platform scales with an accuracy of 0.1 kg. BMI was calculated as body mass (kg) divided by height squared (m2). A BMI ≥ 28 kg/m2 was defined as obesity.
Neck circumference measurement
Subjects were measured while sitting, looking straight ahead, and breathing calmly. A soft ruler was positioned directly below the thyroid cartilage to measure neck circumference, with an accuracy of 0.1 cm (9).
BP measurement
Blood pressure was measured in a consultation room by uniformly trained and qualified medical personnel using an Omron HEM-8102A electronic sphygmomanometer. Before measuring blood pressure, subjects were required to sit and rest quietly for at least 5 min, and they were not allowed to smoke or consume coffee or tea within 30 min. Sitting blood pressure was assessed thrice with intervals of 1–2 min, and the resulting average value was documented as the measurement outcome. Hypertension was characterized by an in-office systolic blood pressure of ≥140 mmHg and/or a diastolic blood pressure of ≥90 mmHg, a previous history of hypertension, or the utilization of antihypertensive medication (10).
Assessment of covariates
Basic information on the subjects was collected using questionnaires, including age, gender, smoking, drinking, salt intake, physical activity, education level, and nighttime sleep duration. Salt intake was assessed through a questionnaire survey, and participants categorized their daily habitual salt intake as low, moderate, or high. Previous cohort studies have established that 24-h urinary sodium excretion levels corresponding to low, moderate, and high salt intake are <6 g, 6–10 g, and >10 g, respectively (11). Physical activity was classified as never, occasional, or frequent, while education level was categorized as junior high school or below and high school or above. Additionally, information on diabetes history, antidiabetic treatment, lipid-lowering treatment, cardiovascular diseases (CVD), and cancer was obtained through questionnaires. Diabetes mellitus was defined as fasting blood glucose ≥7.0 mmol/L, a history of diabetes mellitus, or the use of antidiabetic therapy (12). CVD types included myocardial infarction (MI), ischemic stroke (IS), and hemorrhagic stroke (HS).
Laboratory test parameters were acquired by drawing venous blood from fasting individuals during the day of the physical examination. Fasting blood glucose, total cholesterol, creatinine, and high-sensitivity C-reactive protein levels were assessed using a Hitachi 7,600 Automatic Analyzer. Estimated glomerular filtration rate (eGFR) was estimated using the chronic kidney disease epidemiology collaboration (CKD-EPI) equation.
Grouping
Participants can be categorized based on BMI into non-obese and obese cohorts (13) (BMI < 28 and ≥28 kg/m2, respectively) or by neck circumference into low and high neck circumference cohorts (neck circumference <40 and ≥40 cm, respectively) following the 75th percentile of neck circumference and related references (14, 15). Consequently, the participants were divided into four groups according to BMI and neck circumference: group 1—non-obese and low neck circumference (BMI < 28 kg/m2 and neck circumference <40 cm); group 2—non-obese and high neck circumference (BMI < 28 kg/m2 and neck circumference ≥40 cm); group 3—obese and low neck circumference (BMI ≥ 28 kg/m2 and neck circumference <40 cm); and group 4—obese and high neck circumference (BMI ≥ 28 kg/m2 and neck circumference ≥40 cm).
Cohort follow-up and outcome
The follow-up started at the time of completing the baseline (2014) physical examination, and the occurrence of hypertension was considered the endpoint event. The last physical examination time without the endpoint event marked the end of follow-up. The median follow-up period was 3.86 years.
Statistical analysis
Measurement data with a normal distribution were presented as mean ± standard deviation (x ± s), and analysis of variance was used for comparing different groups. Non-normally distributed measurement data were expressed as a median and interquartile range, and the Kruskal-Wallis rank-sum test was used for comparison. Enumeration data groups were expressed as numbers (%) and compared using the chi-square test. The cumulative incidence of endpoint events in different groups was calculated using the Kaplan-Meier method, and differences among groups were assessed with the log-rank test. The incidence densities of new-onset hypertension between different groups were calculated by dividing the number of events by the total person-years of follow-up (per 1,000/person-year). We evaluated the interaction between BMI and neck circumference on the risk of hypertension. To analyze the effects of new-onset hypertension in different groups, Cox proportional hazards models were employed. Model 1 was adjusted for age and sex; model 2 was further adjusted for education, salt intake, smoking, drinking, physical activity, total cholesterol, estimated glomerular filtration rate, high-sensitivity C-reactive protein, nighttime sleep duration, diabetes, antidiabetic treatment, and lipid-lowering treatment; model 3 was further adjusted for baseline systolic blood pressure based on model 2.
To ensure the robustness of our findings, several sensitivity analyses were performed: (1) BMI was categorized into two levels according to the Asian standards (non-obese: BMI < 25 kg/m2, obese: BMI ≥ 25 kg/m2) (16). (2) Participants with diabetes were excluded. (3) Those using antidiabetic treatment or lipid-lowering treatment were excluded. (4) Cut-off of neck circumference in the prediction of hypertension using ROC curve and considering sex heterogeneity was explored. Further, neck circumference was categorized into two levels according to cut-off point by using ROC curve. (5) Those with CVD were excluded. (6) Participants with cancer were also excluded. Additionally, stratified analyses were conducted to analyze the effects of BMI and neck circumference on hypertension in different subgroups based on age (<60 y, ≥60 y), sex (male, female), and nighttime sleep duration (<7 h, ≥7 h). To assess the predictive ability of different models for hypertension risk, including the traditional model + BMI, traditional model + neck circumference, and traditional model + BMI + neck circumference, C statistics, net reclassification improvement index (NRI), and integrated discrimination improvement index (IDI) were calculated. The p-value was corrected for multiple testing using the Bonferroni correction. Statistical analyses were performed using SAS 9.4 and R 4.2.1 software, with p < 0.05 (two-sided) considered statistically significant.
Results
Baseline characteristics
In total, 10,113 individuals participated in the 2014 health examination of the Kailuan Group. Among them, 96,654 individuals had complete data for neck circumference and BMI, with 44,713 having hypertension and 51,941 having normal blood pressure. Of those with normal blood pressure, 8,341 with no blood pressure data during follow-up were excluded. A comparison of baseline characteristics between the loss-to-follow-up participants and the remaining participants is provided in Supplementary Table S1. Ultimately, 43,600 participants underwent statistical analysis, including 32,765 men (75.15%), with an average age of 46.19 ± 13.50 years. Systolic blood pressure, diastolic blood pressure, BMI, neck circumference, fasting blood glucose, total cholesterol, eGFR and high-sensitivity C-reactive protein were higher in group 4 than in group 1, along with a higher proportion of men, smokers, alcohol consumers, preference for saltiness, diabetes, and CVD, all with statistically significant differences (Table 1).
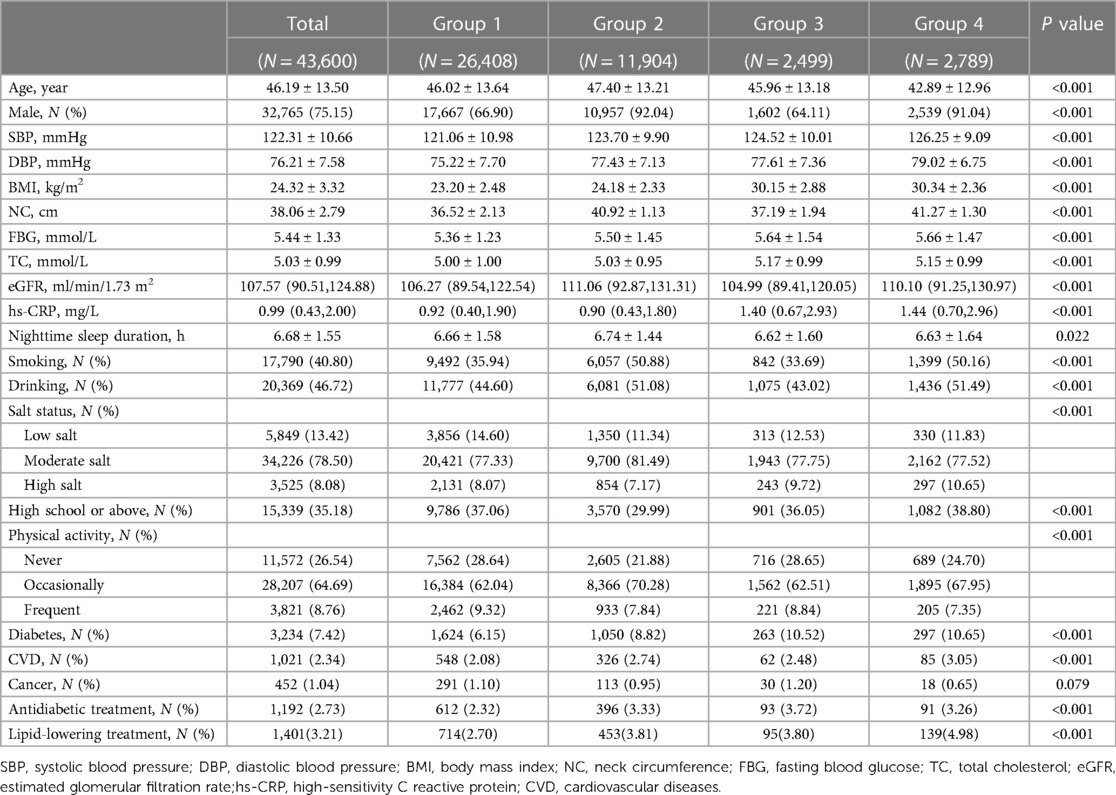
Table 1. Baseline characteristics of the study population (N = 43,600).
Risk of hypertension in groups by BMI and neck circumference
The median follow-up period was 3.86 years, during which 13,383 participants (30.69%) developed hypertension. The incidence densities of groups 1, 2, 3, and 4 were 71.82, 92.43, 107.23, and 123.84 per thousand person-years, respectively (Table 2). The cumulative incidence of hypertension among the different groups was statistically significant based on the log-rank test (P < 0.05) (Figure 2).
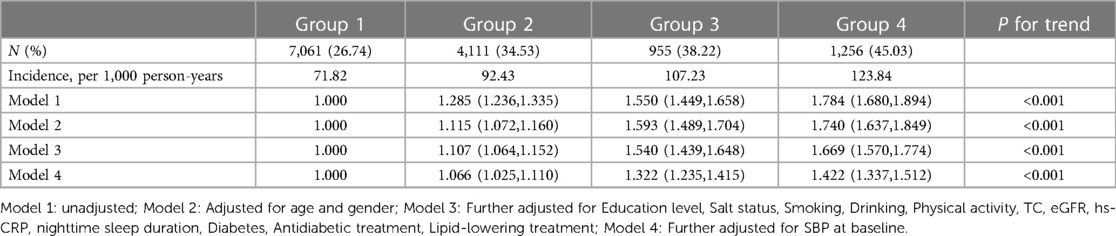
Table 2. Association of different BMI and NC with risk of hypertension (N = 43,600).
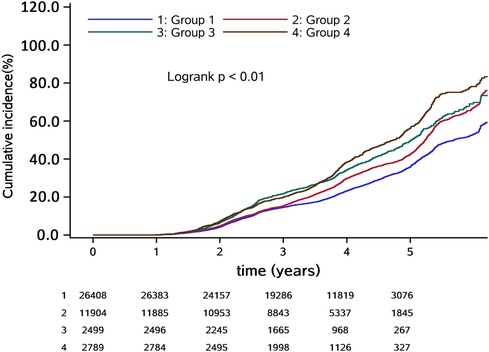
Figure 2. Cumulative incidence of hypertension.
We observed no significant multiplicative or additive interaction between BMI and neck circumference [P for additive interaction >0.05; RERI = 0.031 (95% CI: −0.051, 0.113); P for multiplicative interaction >0.05]. After adjusting for potential confounders, the risk of hypertension gradually increased in groups 2, 3, and 4 in comparison to group 1, with hazard ratios (HRs) [95% confidence interval (CI)] of 1.066 (1.025, 1.110), 1.322 (1.235, 1.415), and 1.422 (1.337, 1.512), respectively. The trend was statistically significant with P < 0.001 (Table 2). Sensitivity analyses yielded results consistent with the main findings (Figure 3, Supplementary Tables S2–S7).
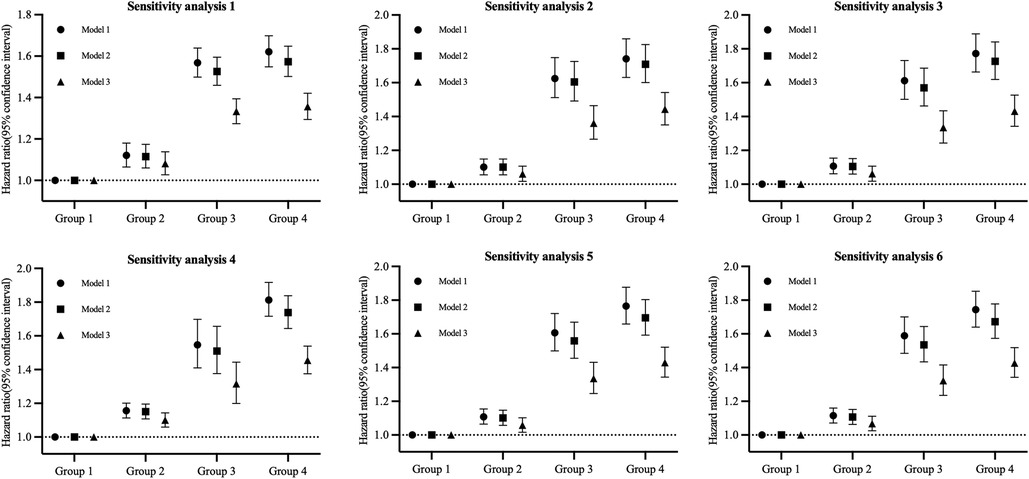
Figure 3. Sensitivity analyses for the association of BMI and NC with the risk of hypertension.
Additionally, we separately examined the relationship between different BMI and neck circumference groups and the risk of hypertension. The results indicated that elevated BMI and neck circumference levels increased the risk of hypertension (Tables 3, 4). Sensitivity analyses supported the main results (Supplementary Tables S8–S17).
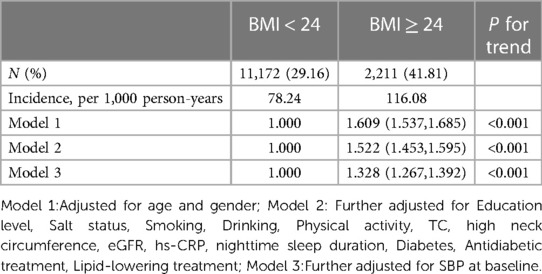
Table 3. Association between BMI and risk of hypertension (N = 43,600).
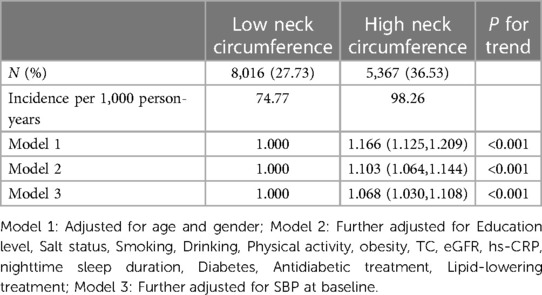
Table 4. Association between NC and risk of hypertension (N = 43,600).
Sensitivity analysis 1 used 25 kg/m2 as a cut-off point to redefine obesity. Sensitivity analysis 2 was performed by excluding participants with diabetes. Sensitivity analysis 3 was performed by excluding participants on antidiabetic treatment and lipid-lowering treatment. Sensitivity analysis 4 used 38.25 cm (men) and 36 cm (women) as cut-off points to redefine high neck circumference. Sensitivity analysis 5 involved the exclusion of participants with CVD. Sensitivity analysis 6 was conducted by excluding participants with cancer.
Model 1: Adjusted for age and gender; Model 2: Further adjustments included Education level, Salt status, Smoking, Drinking, Physical activity, TC, eGFR, hs-CRP, nighttime sleep duration, Diabetes, Antidiabetic treatment, Lipid-lowering treatment; Model 3: Additional adjustment incorporated SBP at baseline.
Stratified analysis
The stratified analysis demonstrated that groups were significantly associated with the risk of hypertension in participants younger than 60 years, male sex, and those whose nighttime sleep duration was less than 7 h, with HRs (95% CI) of 1.333 (1.246, 1.426), 1.427 (1.338, 1.522), and 1.420 (1.287, 1.567) in group 4, respectively (Figure 4).
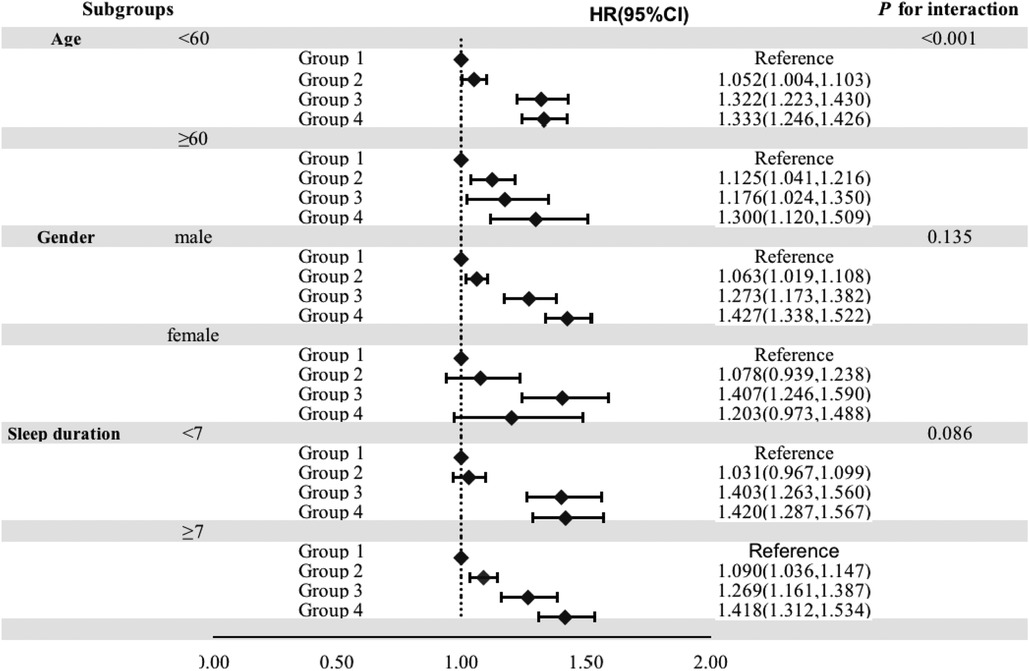
Figure 4. Stratified analysis for the association of BMI and NC with the risk of hypertension.
Predictive value of BMI and neck circumference
We compared the predictive value of BMI and neck circumference for the risk of hypertension (Table 5). The C statistics of the conventional model significantly improved with the incorporation of BMI (from 0.6699 to 0.6738, P < 0.001) and neck circumference (from 0.6699 to 0.6714, P < 0.001). The improvement was more significant after the incorporation of BMI. NRI improved more significantly after the incorporation of neck circumference (19.10%, P < 0.001) than that of BMI (12.93%, P < 0.001), and IDI improved more significantly after incorporating BMI (0.23%, P < 0.001) than that of neck circumference (0.15%, P < 0.001). The C statistic increased to 0.6745 (P < 0.001), the NRI improved by 19.67% (P < 0.001), and the IDI increased by 0.33% (P < 0.001) when both BMI and neck circumference were incorporated into the traditional model, demonstrating significant enhancements compared to when each was included separately.
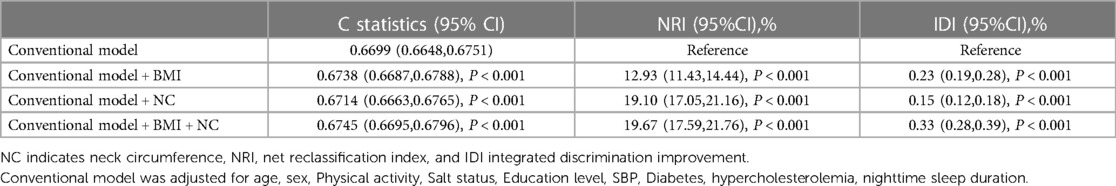
Table 5. Reclassification and discrimination statistics for BMI and NC.
Discussion
An important finding of the present study was that not only high BMI alone and high neck circumference alone are risk factors for hypertension, but also individuals with both high BMI and high neck circumference have a higher risk of hypertension. Moreover, BMI is superior to neck circumference in predicting the risk of hypertension, but considering both of them can further improve the prediction of hypertension risk.
In our study, the risk of hypertension was 42.2% higher in both the high BMI and high neck circumference group compared to both the low BMI and low neck circumference group. It was also higher compared to the BMI-alone and neck circumference-alone groups (32.8% and 6.8%, respectively). This suggests that the association between hypertension risk and the combination of BMI and neck circumference is stronger than with a single index. While some studies have shown a positive correlation between BMI combined with neck circumference and the severity of obstructive sleep apnea-hypopnea syndrome (OSAHS), a leading cause of secondary hypertension, no previous research has analyzed the association between this combination and the risk of hypertension. Luo et al. (17) found that patients with severe OSAHS had the highest mean neck circumference and BMI, and the risk of OSAHS increased when BMI exceeded 25 kg/m2 and neck circumference exceeded 40 cm. Our study, in agreement with this, demonstrated that individuals with both high BMI and neck circumference face a higher risk of OSAHS and hypertension than those with low BMI and neck circumference. Hypertension risk can be influenced by factors such as diabetes (18), antidiabetic treatment (19), and lipid-lowering treatment (20). We conducted sensitivity analyses after categorizing participants by BMI according to Asian standards (non-obese: BMI < 25 kg/m2, obese: BMI ≥ 25 kg/m2) and excluding those with diabetes or receiving antidiabetic and lipid-lowering treatments. The results aligned with the main findings, indicating the robustness of our study's conclusions. These findings supplement previous research on the relationship between hypertension and BMI and neck circumference.
BMI is a well-established predictor of hypertension (21–24). Deng et al. (24) demonstrated that incorporating BMI into the traditional model increased the C-statistic from 0.679 to 0.692 and led to a 19% improvement in the net reclassification index. In our study, the C-statistic was 0.6738 when BMI was included in the traditional model, and it was 0.6714 when neck circumference replaced BMI. However, when both were included in the traditional model, the C-statistic increased to 0.6745. These results suggest that BMI is a better predictor of hypertension risk than neck circumference, but the combination of both BMI and neck circumference offers superior predictive value. Therefore, when assessing an individual's risk of developing hypertension, both BMI and neck circumference should be taken into consideration.
The distribution of body fat differs between genders, with males having longer pharynxes and more fat deposition in the upper airway, especially in cases of obesity. Consequently, the relationship between BMI, neck circumference, and hypertension risk may vary between males and females. Our stratified analyses revealed a significant association between the combination of BMI and neck circumference and hypertension risk in men but not in women. In contrast to our results, Fan S et al. (8) showed that neck circumference was associated with hypertension risk in both men and women, with a higher risk in men [odds ratio (OR) = 1.57, 95% CI 1.14–2.17] compared to women (OR = 1.51, 95% CI 1.20–1.90). While our study did not find a significant association between BMI combined with neck circumference and hypertension risk in women, it is essential to note that the smaller number of women in our cohorts may have affected the results.
Although this study identified an increased risk of hypertension associated with high BMI combined with high neck circumference, the specific mechanism could not be assessed due to the observational nature of the study. Previous research suggests several potential factors. Firstly, neck circumference serves as an indicator of subcutaneous fat distribution in the upper body, which is known to release a significant portion of free fatty acids into the bloodstream, particularly in individuals with obesity (25). Elevated free fatty acids can trigger the production of oxidative stress markers, leading to vascular endothelial damage and hypertension development (26–28). Secondly, studies have linked both BMI (29) and neck circumference (30) to sleep apnea-hypopnea syndrome (SAHS), a primary cause of secondary hypertension affecting 30% to 50% of hypertension patients (31). Lastly, obesity-related fat accumulation around the kidneys can physically compress them, resulting in the activation of the renin-angiotensin-aldosterone system, a mechanism leading to hypertension (32).
This study, conducted in a large community cohort with a substantial sample size, collected prospective data over a 3.86-year follow-up period to investigate the relationship between high BMI in combination with high neck circumference and the risk of hypertension. Furthermore, this study meticulously recorded participant information to uphold data quality standards. Finally, when compared to waist circumference, neck circumference exhibits excellent reliability among and within observers. In contrast to waist circumference, neck circumference remains unaffected by the timing of measurement and maintains consistency both before and after eating. This enhances the practicality and convenience of using neck circumference in winter and busy healthcare settings, ultimately reducing inconvenience for both patients and healthcare staff. Nevertheless, there are certain limitations to consider: Firstly, our study was conducted exclusively among employees of the Kailuan Group in Tangshan City, with a notable predominance of male participants. Therefore, further validation is needed to ascertain the generalizability of these findings to other populations. Second, though this study adjusted for many potential confounders, residual confounding unmeasured factors could not be completely excluded, such as environment and genes. Third, detailed data on other long-standing illnesses such as COPD, which may have influenced the future development of hypertension, were not collected. Fourth, additional research is required to explore the prolonged impacts of fluctuating BMI and neck circumference on the progression of blood pressure. Fifth, the potential bias stemming from loss-to-follow-up may have impacted the subsequent development of hypertension.
Conclusion
This study has illustrated a favorable correlation between the combination of BMI and neck circumference and the risk of hypertension. Furthermore, the predictive capacity for hypertension can be enhanced through the joint consideration of BMI and neck circumference. Consequently, in clinical practice, it is advisable to incorporate both BMI and neck circumference for a more effective assessment and prediction of hypertension risk, enabling timely and successful preventative measures.
Data availability statement
The raw data supporting the conclusions of this article will be made available by the authors, without undue reservation.
Ethics statement
The studies involving humans were approved by the Ethics Committee of Kailuan General Hospital (approval number:2006-05) and with the 1964 Helsinki declaration and its later amendments or comparable ethical standards. The studies were conducted in accordance with the local legislation and institutional requirements. The participants provided their written informed consent to participate in this study.
Author contributions
TR: Data curation, Methodology, Software, Writing – original draft, Writing – review & editing. KZ: Writing – review & editing. WL: Data curation, Writing – review & editing. SR: Supervision, Writing – review & editing. YH: Supervision, Writing – review & editing. NY: Funding acquisition, Writing – review & editing. SW: Methodology, Resources, Supervision, Writing – review & editing. YL: Funding acquisition, Resources, Supervision, Writing – review & editing.
Funding
The author(s) declare financial support was received for the research, authorship, and/or publication of this article.
This study was funded by China International Medical Foundation (Grant No. Z-2019-42-1908 and No. Z-2019-42-1908-3).
Acknowledgments
The authors thank all the participants who contributed their data and all hospitals involved in this study.
Conflict of interest
The authors declare that the research was conducted in the absence of any commercial or financial relationships that could be construed as a potential conflict of interest.
The reviewer HZ declared a shared parent affiliation with the author(s) TR, KZ, STR, YH, NY, YL to the handling editor at the time of review.
Publisher's note
All claims expressed in this article are solely those of the authors and do not necessarily represent those of their affiliated organizations, or those of the publisher, the editors and the reviewers. Any product that may be evaluated in this article, or claim that may be made by its manufacturer, is not guaranteed or endorsed by the publisher.
Supplementary material
The Supplementary Material for this article can be found online at: https://www.frontiersin.org/articles/10.3389/fcvm.2023.1269328/full#supplementary-material
References
1. Zhou B, Carrillo-Larco RM, Danaei G, Riley LM, Paciorek CJ, Stevens GA, et al. Worldwide trends in hypertension prevalence and progress in treatment and control from 1990 to 2019: a pooled analysis of 1201 population-representative studies with 104 million participants. Lancet. (2021) 398(10304):957–80. doi: 10.1016/S0140-6736(21)01330-1
2. Tao S, Wu X, Duan X, Fang W, Hao J, Fan D, et al. Hypertension prevalence and status of awareness, treatment and control in China. Chin Med J. (1995) 108(7):483–9.7555263
3. Wu Y, Huxley R, Li L, Anna V, Xie G, Yao C, et al. Prevalence, awareness, treatment, and control of hypertension in China: data from the China national nutrition and health survey 2002. Circulation. (2008) 118(25):2679–86. doi: 10.1161/CIRCULATIONAHA.108.788166
4. Wang Z, Chen Z, Zhang L, Wang X, Hao G, Zhang Z, et al. Status of hypertension in China: results from the China hypertension survey, 2012-2015. Circulation. (2018) 137(22):2344–56. doi: 10.1161/CIRCULATIONAHA.117.032380
5. Wang JG, Zhang W, Li Y, Liu L. Hypertension in China: epidemiology and treatment initiatives. Nat Rev Cardiol. (2023) 20(8):531–45. doi: 10.1038/s41569-022-00829-z
6. Heianza Y, Kodama S, Arase Y, Hsieh SD, Yoshizawa S, Tsuji H, et al. Role of body mass index history in predicting risk of the development of hypertension in Japanese individuals: toranomon hospital health management center study 18 (TOPICS 18). Hypertension. (2014) 64(2):247–52. doi: 10.1161/HYPERTENSIONAHA.113.02918
7. Ben-Noun LL, Laor A. Relationship between changes in neck circumference and changes in blood pressure. Am J Hypertens. (2004) 17(5 Pt 1):409–14. doi: 10.1016/j.amjhyper.2004.02.005
8. Fan S, Yang B, Zhi X, He J, Ma P, Yu L, et al. Neck circumference associated with arterial blood pressures and hypertension: a cross-sectional community-based study in northern Han Chinese. Sci Rep. (2017) 7(1):2620. doi: 10.1038/s41598-017-02879-7
9. Preis SR, Massaro JM, Hoffmann U, D'agostino RB Sr, Levy D, Robins SJ, et al. Neck circumference as a novel measure of cardiometabolic risk: the Framingham heart study. J Clin Endocrinol Metab. (2010) 95(8):3701–10. doi: 10.1210/jc.2009-1779
10. Chobanian AV, Bakris GL, Black HR, Cushman WC, Green LA, Izzo JL Jr, et al. Seventh report of the joint national committee on prevention, detection, evaluation, and treatment of high blood pressure. Hypertension. (2003) 42(6):1206–52. doi: 10.1161/01.HYP.0000107251.49515.c2
11. Li Y, Huang Z, Jin C, Xing A, Liu Y, Huangfu C, et al. Longitudinal change of perceived salt intake and stroke risk in a Chinese population. Stroke. (2018) 49(6):1332–9. doi: 10.1161/STROKEAHA.117.020277
12. American Diabetes Association. 2. Classification and diagnosis of diabetes: standards of medical care in diabetes-2021. Diabetes Care. (2021) 44(Suppl 1):S15–s33. doi: 10.2337/dc21-S002
13. Zhou BF. Predictive values of body mass index and waist circumference for risk factors of certain related diseases in Chinese adults–study on optimal cut-off points of body mass index and waist circumference in Chinese adults. Biomed Envi Sci. (2002) 15(1):83–96.
14. Coutinho Costa J, Rebelo-Marques A, Machado JN, Gama JMR, Santos C, Teixeira F, et al. Validation of NoSAS (neck, obesity, snoring, age, sex) score as a screening tool for obstructive sleep apnea: analysis in a sleep clinic. Pulmonology. (2019) 25(5):263–70. doi: 10.1016/j.pulmoe.2019.04.004
15. Kale SS, Kakodkar P, Shetiya SH. Assessment of oral findings of dental patients who screen high and no risk for obstructive sleep apnea (OSA) reporting to a dental college—a cross sectional study. Sleep Sci. (2018) 11(2):112–7. doi: 10.5935/1984-0063.20180021
16. Banwell C, Lim L, Seubsman SA, Bain C, Dixon J, Sleigh A. Body mass index and health-related behaviours in a national cohort of 87,134 Thai open university students. J Epidemiol Community Health. (2009) 63(5):366–72. doi: 10.1136/jech.2008.080820
17. Luo W, Miao DS, He F. Correlation of body mass index, neck circumference and obstructive sleep apnea hypopnea syndrome. Zhonghua Er Bi Yan Hou Tou Jing Wai Ke Za Zhi. (2006) 41(6):460–1.16927805
18. Jia G, Sowers JR. Hypertension in diabetes: an update of basic mechanisms and clinical disease. Hypertension. (2021) 78(5):1197–205. doi: 10.1161/HYPERTENSIONAHA.121.17981
19. Hayashi T, Boyko EJ, Leonetti DL, Mcneely MJ, Newell-Morris L, Kahn SE, et al. Visceral adiposity and the prevalence of hypertension in Japanese Americans. Circulation. (2003) 108(14):1718–23. doi: 10.1161/01.CIR.0000087597.59169.8D
20. Kim JI, Tsujino T, Fujioka Y, Saito K, Yokoyama M. Bezafibrate improves hypertension and insulin sensitivity in humans. Hypertens Res. (2003) 26(4):307–13. doi: 10.1291/hypres.26.307
21. Kivimäki M, Batty GD, Singh-Manoux A, Ferrie JE, Tabak AG, Jokela M, et al. Validating the Framingham hypertension risk score: results from the Whitehall II study. Hypertension. (2009) 54(3):496–501. doi: 10.1161/HYPERTENSIONAHA.109.132373
22. Yu C, Ren X, Cui Z, Pan L, Zhao H, Sun J, et al. A diagnostic prediction model for hypertension in Han and Yugur population from the China national health survey (CNHS). Chin Med J. (2023) 136(9):1057–66. doi: 10.1097/CM9.0000000000001989
23. Nguyen TT, Adair LS, He K, Popkin BM. Optimal cutoff values for overweight: using body mass index to predict incidence of hypertension in 18- to 65-year-old Chinese adults. J Nutr. (2008) 138(7):1377–82. doi: 10.1093/jn/138.7.1377
24. Deng D, Chen C, Wang J, Luo S, Feng Y. Association between triglyceride glucose-body mass index and hypertension in Chinese adults: a cross-sectional study. J Clin Hypertens. (2023) 25(4):370–9. doi: 10.1111/jch.14652
25. Nielsen S, Guo Z, Johnson CM, Hensrud DD, Jensen MD. Splanchnic lipolysis in human obesity. J Clin Invest. (2004) 113(11):1582–8. doi: 10.1172/JCI21047
26. Stojiljkovic MP, Lopes HF, Zhang D, Morrow JD, Goodfriend TL, Egan BM. Increasing plasma fatty acids elevates F2-isoprostanes in humans: implications for the cardiovascular risk factor cluster. J Hypertens. (2002) 20(6):1215–21. doi: 10.1097/00004872-200206000-00036
27. Piro S, Spampinato D, Spadaro L, Oliveri CE, Purrello F, Rabuazzo AM. Direct apoptotic effects of free fatty acids on human endothelial cells. Nutr Metab Cardiovascular Dis. (2008) 18(2):96–104. doi: 10.1016/j.numecd.2007.01.009
28. Stojiljkovic MP, Zhang D, Lopes HF, Lee CG, Goodfriend TL, Egan BM. Hemodynamic effects of lipids in humans. Am J Physiol Regul Integr Comp Physiol. (2001) 280(6):R1674–1679. doi: 10.1152/ajpregu.2001.280.6.R1674
29. Morris LG, Kleinberger A, Lee KC, Liberatore LA, Burschtin O. Rapid risk stratification for obstructive sleep apnea, based on snoring severity and body mass index. Otolaryngol Head Neck Surg. (2008) 139(5):615–8. doi: 10.1016/j.otohns.2008.08.026
30. Kawaguchi Y, Fukumoto S, Inaba M, Koyama H, Shoji T, Shoji S, et al. Different impacts of neck circumference and visceral obesity on the severity of obstructive sleep apnea syndrome. Obesity. (2011) 19(2):276–82. doi: 10.1038/oby.2010.170
31. Yeghiazarians Y, Jneid H, Tietjens JR, Redline S, Brown DL, El-Sherif N, et al. Obstructive sleep apnea and cardiovascular disease: a scientific statement from the American heart association. Circulation. (2021) 144(3):e56–67. doi: 10.1161/CIR.0000000000000988
Keywords: BMI, neck circumference, hypertension, kailuan, prospective cohort study
Citation: Ren T-j, Zhang K, Li W-j, Ren S-t, Huang Y-z, Yang N, Wu S-l and Li Y-m (2023) Body mass index, neck circumference, and hypertension: a prospective cohort study. Front. Cardiovasc. Med. 10:1269328. doi: 10.3389/fcvm.2023.1269328
Received: 29 July 2023; Accepted: 19 September 2023;
Published: 2 October 2023.
Edited by:
Joao Henrique Costa-Silva, Federal University of Pernambuco, BrazilReviewed by:
Pei Qin, Shenzhen Qianhai Shekou Free Trade Zone Hospital, ChinaYan-song Zheng, People's Liberation Army General Hospital, China
Hong Zhu, Tianjin Medical University, China
© 2023 Ren, Zhang, Li, Ren, Huang, Yang, Wu and Li. This is an open-access article distributed under the terms of the Creative Commons Attribution License (CC BY). The use, distribution or reproduction in other forums is permitted, provided the original author(s) and the copyright owner(s) are credited and that the original publication in this journal is cited, in accordance with accepted academic practice. No use, distribution or reproduction is permitted which does not comply with these terms.
*Correspondence: Shou-ling Wu ZHJ3dXNsQDE2My5jb20= Yu-ming Li Y2FyZGlvbGFiQDE2My5jb20=
†These authors have contributed equally to this work