
95% of researchers rate our articles as excellent or good
Learn more about the work of our research integrity team to safeguard the quality of each article we publish.
Find out more
ORIGINAL RESEARCH article
Front. Cardiovasc. Med. , 06 October 2023
Sec. Cardiovascular Epidemiology and Prevention
Volume 10 - 2023 | https://doi.org/10.3389/fcvm.2023.1234325
 Mengyi Zheng1
 Xinyuan Zhang2Quanhui Zhao3
 Shuohua Chen3Xinying Guo1
 Chi Wang4
 Jost B. Jonas5
 Shouling Wu3*†Caixia Guo1*†
Background: This study aims to investigate the association between an elevated bilateral pulse wave velocity difference (BPWVD) and cardiovascular diseases (CVDs) and all-cause mortality.
Methods: This study included a total of 38,356 participants. A multivariable Cox proportional hazards regression was used to assess the association between high BPWVD and the increased risk of CVDs and all-cause mortality by calculating hazard ratios (HRs) with 95% confidence intervals.
Results: A total of 1,213 cases of CVDs were identified over a mean duration of 6.19 years, including 886 cases of cerebral infarction (CI), 105 cases of intracerebral hemorrhage (ICH), and 222 cases of myocardial infarction (MI), along with 1,182 cases of all-cause mortality. The median BPWVD was 42 cm/s (19–80 cm/s). After adjusting for all confounders and baseline brachial-ankle PWV (baPWV), our analysis revealed a significant correlation between a higher risk of CVDs, MI, and all-cause mortality with an increase in BPWVD per standard deviation. HRs (95% confidence interval) were found to be 1.06 (1.01–1.11), 1.11 (1.02–1.21), and 1.07 (1.04–1.10), respectively. Among the participants with higher baPWV on the left side, the HRs (95% confidence interval) were 1.08 (1.02–1.14) for CVDs, 1.27 (1.10–1.46) for incident ICH, 1.16 (1.00–1.24) for incident MI, and 1.10 (1.07–1.15) for all-cause mortality, for per standard deviation increase in BPWVD.
Conclusions: Our findings reveal a significant correlation between elevated BPWVD and the risks of developing CVDs and all-cause mortality. This highlights the importance of thoroughly evaluating BPWVD as a means of detecting individuals at risk for CVDs and mortality.
Arterial stiffness and atherosclerosis are independent risk factors for cardiovascular diseases (CVDs) and all-cause mortality (1). The brachial-ankle pulse wave velocity (baPWV) is a commonly employed non-invasive method in Asian countries for assessing arterial stiffness (2), and it has a strong correlation with carotid-femoral PWV (3). During the assessment of arterial stiffness, it is possible to measure blood pressure on all four extremities, as well as obtain the ankle-brachial index (ABI) and baPWV on the right and left side simultaneously (4). In this study, we observed inconsistencies in the bilateral brachial-ankle pulse wave velocity, which we referred to as the bilateral brachial-ankle pulse wave velocity difference (BPWVD).
Previous studies also found that the percent in the baPWV difference between the two sides was 4 ± 5% in subjects without any atherosclerotic factors, and it seems to relate to the delay in the calculated baPWV caused by arterial stenosis (5). The ABI and inter-arm difference (IAD) in blood pressure are the simple procedures used to diagnose peripheral artery disease (PAD) (6). In addition, high IAD ( ≥ 15 mmHg) and low ABI (ABI ≤ 0.9) (7, 8) have been consistently shown as independent predictors of atherosclerotic cardiovascular diseases (ASCVDs) and mortality. In individuals with severe atherosclerosis, such as PAD, the narrowing of the arteries due to stenosis affects the blood pressure between the two sides, resulting in a decrease in the accuracy of baPWV measurement (4, 9). Consequently, this leads to a greater discrepancy in baPWV values (abnormal difference) between left and right sides. It remains unclear whether an elevated BPWVD, similar to elevated IAD, is associated with a higher risk of CVD and all-cause mortality. Therefore, in order to clarify the clinical significance of BPWVD, we investigated the association between BPWVD and incident cardiovascular disease and all-cause mortality in the Kailuan cohort.
The Kailuan Study is a cohort study that focuses on a functional community population (10, 11). The study started in 2006, with participants being subjected to follow-up assessments every 2 years. During the second follow-up period (2010–2011), certain participants were subjected to baPWV detection. The study at Kailuan General Hospital was granted approval by the ethics committee in accordance with the Helsinki Declaration. Between 2010 and 2017, a total of 42,227 participants underwent baPWV measurements. All participants signed a written informed consent to participate in the study. Individuals who had outlier values of the baPWV [±5 standard deviation (SD)] (n = 239), those with a history of CVDs (n = 821) and atrial fibrillation (n = 328), and those with incomplete information on physical measurements were excluded from the study. Finally, this study included a total of 38,356 participants (Supplementary Figure S1). We compared the baseline characteristics for the inclusion and exclusion populations (Supplementary Table S1) (Registration No.: ChiCTR-TNC-11001489).
The baPWV detection was conducted from 7:00 a.m. to 9:00 a.m., while ensuring that the temperature of the examination room was maintained between 22°C and 25°C. Each participant was assessed by trained professionals. The baPWV values were collected using the detection device [BP-203RPE III networked device produced by Omron Healthcare (China) Co., Ltd.], and the four-limb blood pressure and ABI values were recorded simultaneously. Prior to the measurement, the participants were instructed to refrain from smoking, rest for more than 5 min, and maintain a quiet and supine posture during the measurement. Two replicate measurements were taken for each participant, and the average of the two sets of data was used as the final result (Supplementary Figure S2) (12). The definition of baseline baPWV is the average value of baPWV on the left and right sides at the baseline level.
BPWVD is calculated as the absolute difference between left- and right-side baPWVs (9). The participants with BPWVD values higher than the highest quartile value (80 cm/s) were categorized as the “high BPWVD group,” whereas those with BPWVD values lower than 80 cm/s were categorized as the “normal BPWV group.” The IAD and the inter-ankle systolic blood pressure difference (IAND) were defined as the absolute difference in systolic blood pressure between both arms and ankles, respectively.
Following fasting for 8–12 h, 5 ml of elbow venous blood was collected from each participant during the follow-up. All blood biochemical indicators were measured at the central laboratory of Kailuan General Hospital using a Hitachi 747 automatic analyzer operated by specialized laboratory physicians. Using the CKD-EPI formula, the estimated glomerular filtration rate (eGFR) was calculated (13).
Blood pressure was measured between 7:00 a.m. and 9 a.m. on the survey. To ensure accuracy, all participants were instructed to abstain from smoking or consuming tea or coffee for a minimum duration of 30 min prior to the measurement. Three measurements were performed, separated by 1–2 min intervals, and the mean value was calculated. The mean arterial pressure (MAP) was calculated using the formula: 1/3 × systolic blood pressure (SBP) + 2/3 × diastolic blood pressure (DBP). Trained nurses measured the height, weight, heart rate, and waist circumference. Using the formula weight in kilograms divided by the height in meters squared, the body mass index (BMI) was calculated.
For demographic information, medications, and living habits, please refer to the previously published research (11, 14). During the 2016–2017 follow-up, supplementary information on the dominant hand was also gathered.
The starting point of the study is marked by the time of the first baPWV test for each participant. Every year, trained professionals review the hospitalization diagnoses and document the outcomes of the participants at Kailuan General Hospital, as well as its affiliated hospitals and the designated hospitals covered by the city's medical insurance. The outcomes during the follow-up are CVDs and all-cause mortality, which includes cerebral infarction (CI), intracerebral hemorrhage (ICH), and myocardial infarction (MI). For individuals with multiple events (≥2 times), the time and event of the first occurrence were used as the outcome, while for those without any event, the end of follow-up was defined as the last available follow-up time, which was 31 December 2020 (15, 16). The diagnoses of MI (17), CI, and ICH (18) were based on both the patient's clinical symptoms and laboratory examination results.
The mean and SD were used to describe the baseline characteristics of normally distributed continuous variables, while the median and interquartile range were used for skewed distribution continuous variables. Categorical variables were represented by frequencies and percentages. One-way analysis of variance or chi-square test was employed to compare the differences in continuous and categorical variables among various groups. Multivariate logistic regression, specifically stepwise regression, was used to investigate the risk factors associated with BPWVD.
A multivariate Cox proportional hazards regression model was used to analyze whether high BPWVD was associated with an increased risk of cardiovascular disease and all-cause mortality. Hazard ratios (HRs) and P-values for risks per SD increment of BPWVD were also calculated. Since the BPWVD value was the absolute value of the difference between the left and right sides, considering higher baPWV values on the left or right side may affect the results. Therefore, we divided the population into two subgroups based on participants with higher left or right baPWV values and repeated the above analysis in each group. Model 1 was adjusted for possible covariates, including age, sex, MAP, heart rate, fasting blood glucose (FBG), BMI, low-density lipoprotein cholesterol (LDL-C), high-density lipoprotein cholesterol (HDL-C), log-transformed high-sensitivity C-reactive protein (hs-CRP), uric acid (UA), eGFR, smoking status, alcohol consumption, physical activity, and dominant hand. Model 2 was further adjusted for lipid-lowering drugs, antihypertensive drugs, and antihyperglycemic drugs. IAD, IAND, and baseline baPWV were further adjusted in Model 3 and Model 4.
In addition, a series of sensitivity analyses were conducted to assess the consistency of the findings. First, considering the potential impact attributed to gender, one of the unmodifiable factors, we conducted stratified analyses and repeated measures. Second, considering the potential bias caused by peripheral artery disease, we excluded participants with ABI ≤ 0.9 or IAD ≥ 15 mmHg or both of these conditions in subsequent sensitivity analyses.
To assess the reproducibility of baPWV and BPWVD, 77 subjects without CVD were recruited as the repeatability validation population. BaPWV was measured three times according to the standard procedure, and we applied intraclass correlation coefficients (ICCs) to evaluate the reproducibility of the measurement results. Rosner's standardized criteria (2000) were utilized to assess the ICCs (19). In this validation population, the ICC is 0.58 for three repeated measurements and 0.63 for the last two repeated measurements, which indicate favorable reproducibility (Supplementary Tables S2–S6).
Finally, we fitted the time-dependent receiver operator characteristic (ROC) curves (20) and calculated the area under the curve (AUC) over time at 2, 4, 6, 8, and 10 years. The predictive values of BPWVD, ABI, and IAD in relation to CVD and all-cause mortality were compared over the follow-up.
All analyses were performed using SAS 9.4 (SAS Institute, Cary, NC, USA) and R software (version 3.6.0; R Core Team). Statistical significance was defined as two-sided P-values less than 0.05.
The mean age of the participants was 48.4 ± 12.7 years, with 27,691 (72.5%) being male. The baPWV measured on the right side was 1,477 ± 325 cm/s, whereas the baPWV measured on the left side was 1,482 ± 332 cm/s. The mean BPWVD was 62.9 ± 78.6 cm/s with a median of 42 cm/s and a third quartile value of 80 cm/s. The difference in bilateral baPWV was approximately normal, as shown in Figure 1. We therefore defined BPWVD ≥ 80 cm/s as the high BPWVD group, which consisted of 9,651 (25.2%) participants. The high BPWVD group was observed to have a significantly (P < 0.001) higher age, predominantly male, and a higher prevalence of cardiovascular risk factors in comparison with the normal BPWVD group (P < 0.001) (Table 1 and Supplementary Table S7).
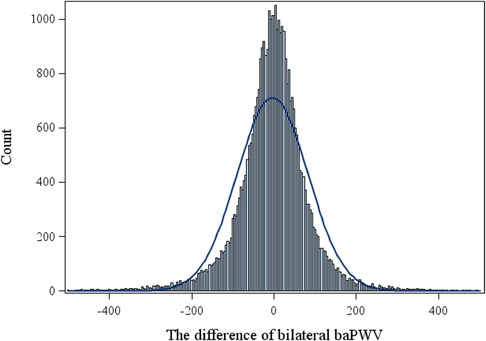
Figure 1. The histogram for difference of bilateral baPWV.

Table 1. The baseline characteristics for the participants with high or normal bilateral baPWV difference.
In the multivariate backward stepwise logistic regression model, the risk factors for a high BPWVD include older age and higher baseline values of baPWV, IAD, BMI, and LDL-C, higher prevalence of diabetes mellitus and intake of antihyperglycemic drugs, lower prevalence of regular physical activities, and lower eGFR at baseline (Supplementary Table S8).
We detected 1,213 CVDs over a mean duration of 6.19 years, including 886 cases of CI, 105 cases of ICH, and 222 cases of MI, along with 1,182 cases of all-cause mortality. The high BPWVD group had statistically (log-rank test) higher cumulative incidence rates for all events when compared with the normal BPWVD group (Table 2) (Figure 2 and Supplementary Figure S3). The Cox proportional hazard model revealed that, following multivariate adjustment, per standard deviation increment in BPWVD was associated with increasing risk for incident CVDs, MI, and all-cause mortality. HRs (95% confidence interval) were 1.06 (1.01–1.11), 1.11 (1.02–1.21), 1.07 (1.04–1.10), respectively (Table 3). In the participants with higher baPWV on the left side, the HRs (95% confidence interval) were 1.08 (1.02–1.14) for CVDs, 1.27 (1.10–1.46) for incident ICH, 1.16 (1.00–1.24) for incident MI, and 1.10 (1.07–1.15) for all-cause mortality, for per standard deviation increment in BPWVD (Table 4). However, no statistically significant association was observed between BPWVD and all events in participants with higher baPWV on the right side (Supplementary Table S9).
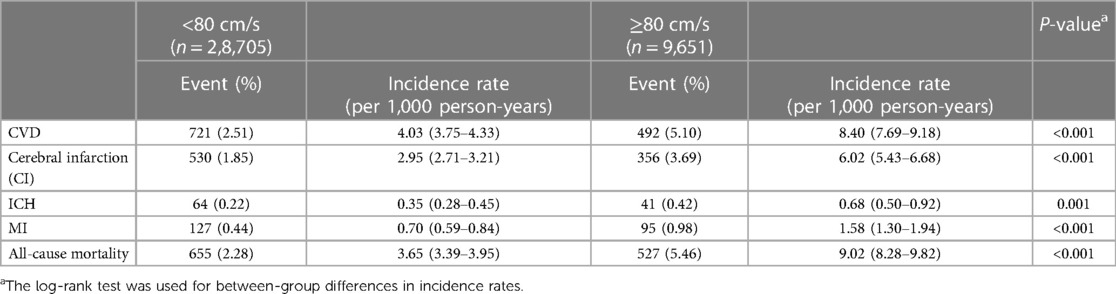
Table 2. Incidence rates of cardiovascular diseases and all-cause mortality in high or normal bilateral baPWV difference group among 38,356 participants.
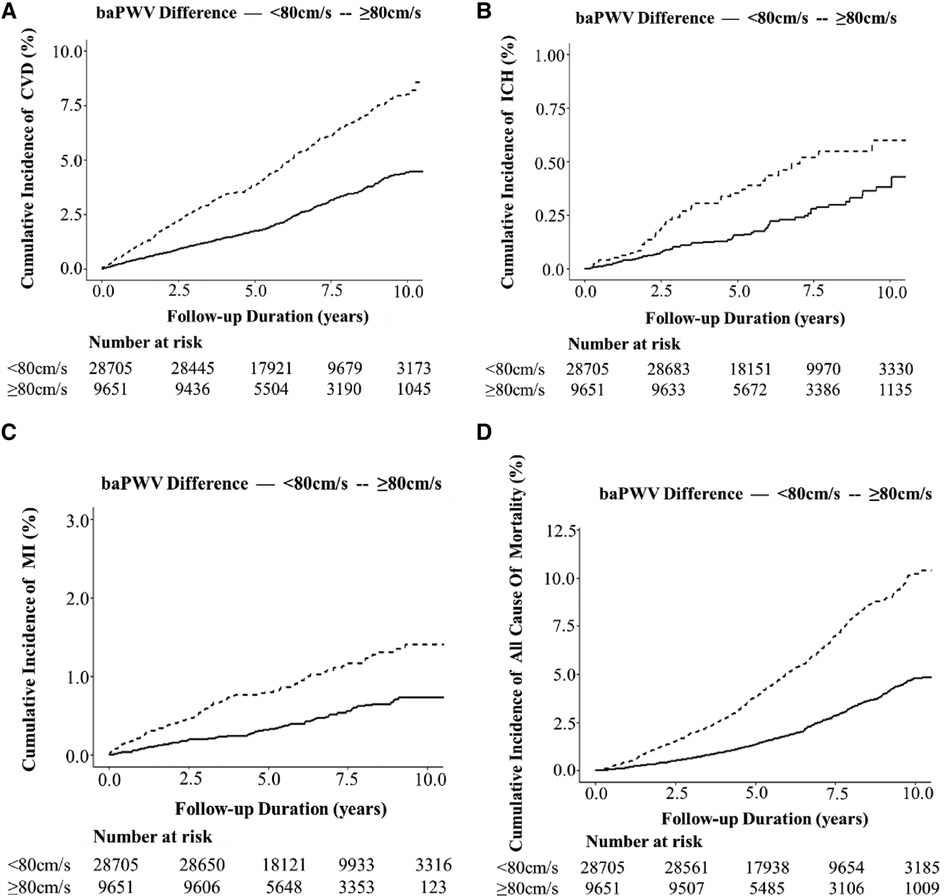
Figure 2. Kaplan –Meier plot of the cumulative incidence of cardiovascular diseases and all-cause mortality over a mean of 6.19 years among 38,356 participants with high or normal bilateral baPWV difference. (A) CVD; (B) ICH; (C) MI; and (D) all-cause mortality.
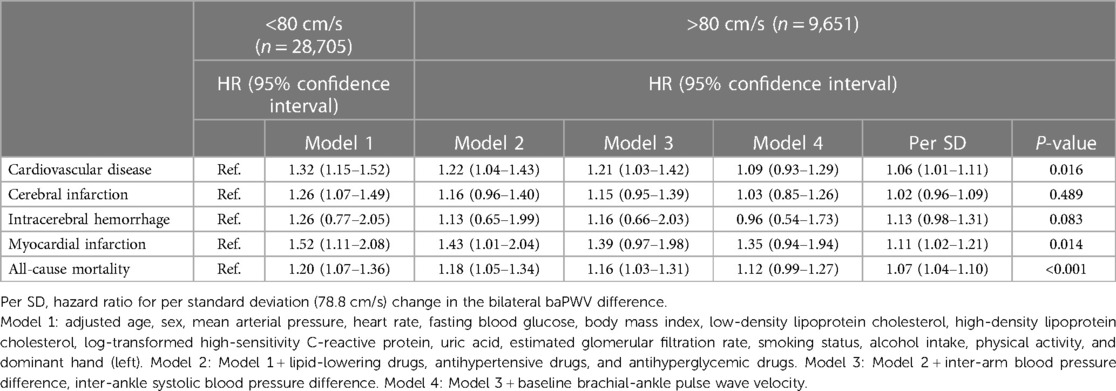
Table 3. Hazard ratios for bilateral baPWV difference related to cardiovascular disease and all-cause mortality among 38,356 participants.
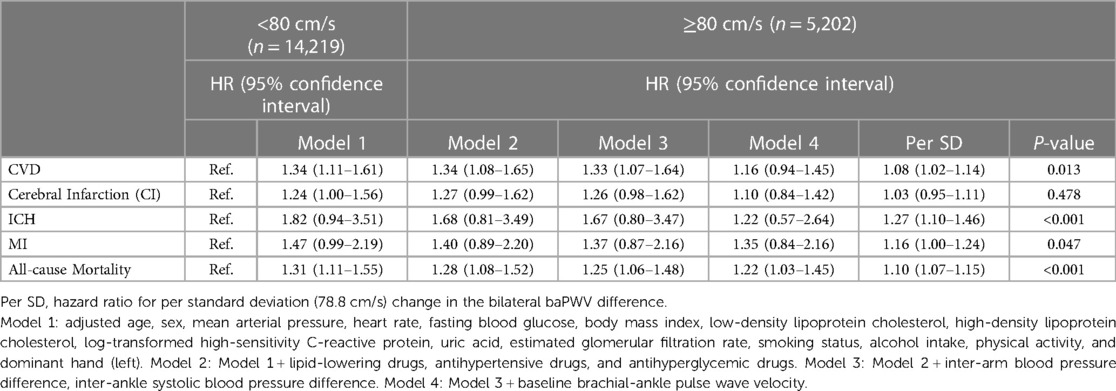
Table 4. Hazard ratios for bilateral baPWV difference related to cardiovascular disease and all-cause mortality among 19,421 participants with the left higher baPWV.
For sensitivity analyses, the results among men were similar to those in the overall population, with an HR (95% confidence interval) of 1.06 (1.01–1.11) for incident CVDs, 1.13 (1.04–1.23) for MI, and 1.07 (1.04–1.10) for all-cause mortality. There was no significance observed in women (Supplementary Table S10). In addition, after excluding participants with an ABI ≤ 0.9 or IAD ≥ 15mmHg, respectively, the HRs (95% confidence interval) in participants without ABI ≤ 0.9 were 1.19 (1.03–1.37) for incident ICH and 1.07 (1.02–1.12) for all-cause mortality (Supplementary Table S11). The HRs (95% confidence interval) in participants without IAD ≥15 mmHg were 1.07 (1.02–1.13) for incident CVD, 1.17 (1.03–1.33) for incident ICH, 1.11 (1.02–1.10) for MI, and 1.07 (1.04–1.10) for all-cause mortality (Supplementary Table S12). Furthermore, for participants without ABI ≤ 0.9 and IAD ≥ 15 mmHg, the HRs (95% confidence interval) were 1.21 (1.06–1.40) for incident ICH and 1.07 (1.02–1.12) for all-cause mortality (Supplementary Table S13). As the covariates vary over time, we transformed the covariates into updated confounders and further conducted time-dependent covariate analysis (Supplementary Table S14). Considering the influence of hypertension, diabetes, and overweight/obesity on the measurement of baPWV, we investigated the impact of BPWVD on outcomes under different blood pressure conditions, different blood glucose levels, and overweight/obesity conditions. The results indicated that participants with hypertension, diabetes, and overweight/obesity combined with BPWVD value of ≥80 cm/s had a higher risk of developing CVD and all-cause mortality (Supplementary Tables S15–S18). In order to further validate the reliability of the results, we conducted propensity scoring, and the results were similar (Supplementary Table S19).
We compared the predictive value of BPWVD, ABI, and IAD in this population. The discriminatory power to identify CVDs ranged from 0.62 to 0.73 using the BPWVD method, while the ability to identify all-cause mortality ranged from 0.66 to 0.76 using the same method. Both ABI (AUC for CVDs: from 0.51 to 0.50, AUC for all-cause mortality: from 0.50 to 0.50) and IAD to CVD (AUC for CVDs: from 0.45 to 0.36, AUC for all-cause mortality: from 0.48 to 0.40) did not provide significantly predictive value in the study population (Supplementary Table S20 and Supplementary Figures S4,S5).
We defined the high BPWVD group by using a threshold value of 80 cm/s. The study findings indicate that while no significant increase in the risk for new-onset cardiovascular disease and all-cause mortality was observed in the high BPWVD group, an increase of 1 SD in BPWVD was associated with 6%, 11%, and 7% increased risks of CVD, MI, and all-cause mortality, respectively. Furthermore, participants with elevated BPWVD and higher left baPWV values had a 22% greater risk of all-cause death compared with those with normal BPWVD values after adjusting for baseline baPWV and all confounding factors. In addition, for each standard deviation increase in BPWVD, the risk for CVD, ICH, MI, and all-cause mortality increased by 8%, 27%, 16%, and 10%, correspondingly. After excluding the cases with IAD ≥ 10 mmHg or ABI ≥ 15 mmHg, similar results were found. These findings may indicate the following: (1) independent of baseline baPWV and conventional risk factors, an elevated BPWVD could be a risk factor for CVD, MI, ICH and all-cause mortality, and it might provide a new clinical marker for screening high-risk populations for CVD, MI, ICH, and all-cause mortality; (2) the increased risk of CVD and all-cause mortality caused by BPWVD may have a dose–response relationship, and the optimal cut-off value needs to be further explored; and (3) this bilateral baPWV difference might be more representative when the left side baPWV value is higher than the right side.
Several studies have demonstrated that ABI, IAD, and baPWV are associated with an increased risk of incident CVD and death. Tokitsu et al. (21) reported that increased IAD was positively associated with a higher likelihood of experiencing coronary events in the future. Criqui et al. (22) observed that lower ABI was associated with an increased risk of CVD in individuals without known history of CVDs. One study found that increasing carotid-femoral PWV could raise the risk of incident coronary heart disease by 2.07 times (23); higher baPWV would increase the risk of coronary-related events in patients with heart failure or with preserved left ventricular ejection fraction (24). Therefore, the association between BPWVD and CVD, MI, and all-cause mortality may be reasonable. Our results prove that BPWVD is superior to ABI and IAD in predicting these outcomes, as evidenced by larger AUCs in this study. Previous studies have also reported that both lower ABI and higher PWV have been associated with the occurrence of microbleeds and intracerebral hemorrhage (25, 26). In the absence of peripheral artery disease, higher BPWVD may, by unevenly altering wall thickness and elasticity, lead to greater fluctuation in the pressure of blood flow, thus increasing the risk of intracerebral hemorrhage. This suggested a potential independent association between BPWVD and the cerebral vascular health.
Although we found positive associations between higher BPWVD and higher incidence of CVDs, ICH, MI, and all-cause mortality, the underlying mechanisms remain largely unclear. One plausible explanation is that arterial stiffness is more severe on one side than on the other side. First, bilateral baPWV measurements originate anatomically from the same arterial vessel, the aorta, through which arterial blood flow diverges into the peripheral arteries. Thus, the difference in baPWV between the left and right sides may result from variations of arterial stiffness in four extremities, despite them originating from the same vascular, the aorta. Second, an abnormally high BPWVD could be caused by an increase in baPWV on one side or a decrease in baPWV on the other side. After excluding participants with an abnormally low ABI of ≤ 0.9 or an abnormally high IAD of ≥ 15 mmHg, our findings remained statistically significant. Therefore, a drop in baPWV on one side may not be the primary reason for the finding (4). The findings derived from our investigation on the participants with a baPWV higher on the left side supported this hypothesis. In contrast to the right subclavian artery, the left subclavian artery leaves the aorta at a narrower angle, potentially causing an increased velocity of blood flow on the left side. In addition, previous research (27, 28) has demonstrated the existence of a gradient in arterial stiffness between the aorta and the arteries in the upper limb. This observation suggests that there may be variations in arterial stiffness between the left and right sides, indicating a possible association with disease occurrence.
Our findings have important clinical implications for the management and prevention of CVDs. As a cost-effective, easily accessible, and non-invasive clinical parameter, BPWVD should be considered during baPWV measurements. Using only one side for the baPWV measurements may result in either overestimations or underestimations of arterial stiffness. In a study conducted by Motobe et al., it was shown that after excluding the subjects with arteriosclerosis obliterans (ASOs), a low ABI and a borderline ABI measured by the Vascular Profiler are frequently observed in healthy young individuals in Japan (9). The prevalence of ABI ≤ 0.9 may lead to a lower baPWV value than the normal value, and ABI ≥ 1.33 might lead to a higher baPWV value than the normal value (29–31.) Therefore, it is more sensible to use the mean baPWV value on both sides to represent arterial stiffness status. Individuals with normal PWV values but high BPWVD may still lack awareness of the potential hazards and overlook the associated cardiovascular risks. Consequently, these findings emphasize the importance of adopting a more proactive approach to population screening for high BPWVD and implementing more intensive interventions to modify cardiovascular risk factors among individuals with high BPWVD.
To the best of our knowledge, this was the first large-scale study reporting the association of BPWVD with CVD and all-cause mortality through baPWV measurements. The bilateral baPWV measurements were performed simultaneously following standard protocols to avoid measurement errors. We further adjusted detailed demographics, lifestyle factors, and biochemical parameters in the statistical models and incorporated the consideration of the dominant hand (left/right) in our analysis.
Several limitations of our study also merit consideration. First, our study is restricted to one cohort, with a relatively short follow-up period. Thus, it is necessary to validate our findings by conducting future analyses that involve additional demographic or ethnic populations with longer follow-up intervals. Second, participants with an ABI ≤ 0.9 and an IAD ≥ 15 mmHg were excluded from medical imaging examinations, as these procedures are widely recognized as the gold standard for diagnosing peripheral artery disease. Third, we arbitrarily used the upper quartile of the BPWVD as the cut-off value for the classification of the “high BPWVD group,” so that future studies may assess the best-separating cut-off value for the definition of the high BPWVD group. Fourth, we measured arterial stiffness using the baPWV instead of the carotid-femoral PWV. Nonetheless, various studies have reported a robust correlation between the carotid-femoral PWV and the baPWV. The American Heart Association has recognized baPWV as a widely used and clinically accepted measure for determining arterial stiffness, with a rating of “Class I, Level of Evidence B” (2). Fifth, we do not yet have a good explanation of the pathogenesis of intracerebral hemorrhage, thus warranting further investigation in future research. Whether the difference in the dominant hand would be associated with the localization of intracerebral hemorrhage (left/right) is a subject that warrants further investigation in future studies that encompass a larger sample size.
An elevated BPWVD can be an independent risk factor for CVD, MI, ICH, and all-cause mortality, which remains significant even after adjusting for baseline baPWV and traditional risk factors. This finding is significant and suggests that BPWVD has the potential to be a novel clinical marker for identifying high-risk populations. Moreover, the increased risk associated with BPWVD may exhibit a dose–response relationship with CVD and all-cause mortality. However, the optimal cut-off value needs to be further explored. These findings indicate that in addition to focusing on the value of baPWV during the baPWV measurement, we also need to pay more attention to the difference in arterial stiffness between the two sides, which may serve as a new indicator for identifying individuals at high risk for cardiovascular complications.
The datasets presented in this article are not readily available due to restrictions. Requests to access the datasets should be directed to the corresponding author.
The studies involving humans were approved by the Ethics Committee of Kailuan General Hospital. The studies were conducted in accordance with the local legislation and institutional requirements. The participants provided their written informed consent to participate in this study.
MZ and XZ were mainly responsible for the design of the study, data analysis, and article writing. QZ, SC, XG, CW, and JJ were mainly responsible for data collection and partial analysis. SW and CG were mainly responsible for data inspection and article revision. All authors contributed to the article and approved the submitted version.
We express our gratitude to the study participants and their families, the survey team members of the 11 Kailuan Medical Group regional hospitals, and the project management and development teams at the Kailuan Group and Beijing Tongren Hospital.
The authors declare that the research was conducted in the absence of any commercial or financial relationships that could be construed as a potential conflict of interest.
The reviewer TL declared a shared parent affiliation with the authors MZ and CG to the handling editor at the time of review.
All claims expressed in this article are solely those of the authors and do not necessarily represent those of their affiliated organizations, or those of the publisher, the editors and the reviewers. Any product that may be evaluated in this article, or claim that may be made by its manufacturer, is not guaranteed or endorsed by the publisher.
The Supplementary Material for this article can be found online at: https://www.frontiersin.org/articles/10.3389/fcvm.2023.1234325/full#supplementary-material
1. Vlachopoulos C, Aznaouridis K, Stefanadis C. Prediction of cardiovascular events and all-cause mortality with arterial stiffness: a systematic review and meta-analysis. J Am Coll Cardiol. (2010) 55:1318–27. doi: 10.1016/j.jacc.2009.10.061
2. Townsend RR, Wilkinson IB, Schiffrin EL, Avolio AP, Chirinos JA, Cockcroft JR, et al. Recommendations for improving and standardizing vascular research on arterial stiffness: a scientific statement from the American Heart Association. Hypertension. (2015) 66:698–722. doi: 10.1161/HYP.0000000000000033
3. Lu Y, Zhu M, Bai B, Chi C, Yu S, Teliewubai J, et al. Comparison of carotid-femoral and brachial-ankle pulse-wave velocity in association with target organ damage in the community-dwelling elderly Chinese: the Northern Shanghai study. J Am Heart Assoc. (2017) 6(2):e004168. PMID: 28219916; PMCID: PMC5523744. doi: 10.1161/JAHA.116.004168
4. Ato D. Pitfalls in the ankle-brachial index and brachial-ankle pulse wave velocity. Vasc Health Risk Manag. (2018) 14:41–62. doi: 10.2147/VHRM.S159437
5. Tomiyama H, Yamashina A, Arai T, Hirose K, Koji Y, Chikamori T, et al. Influences of age and gender on results of noninvasive brachial-ankle pulse wave velocity measurement—a survey of 12517 subjects. Atherosclerosis. (2003) 166:303–9. doi: 10.1016/S0021-9150(02)00332-5
6. Mancia G, Fagard R, Narkiewicz K, Redón J, Zanchetti A, Böhm M, et al. 2013 ESH/ESC guidelines for the management of arterial hypertension: the task force for the management of arterial hypertension of the European Society of Hypertension (ESH) and of the European Society of Cardiology (ESC). Eur Heart J. (2013) 34:2159–219. doi: 10.1093/eurheartj/eht151
7. Clark CE, Taylor RS, Shore AC, Ukoumunne OC, Campbell JL. Association of a difference in systolic blood pressure between arms with vascular disease and mortality: a systematic review and meta-analysis. Lancet. (2012) 379:905–14. doi: 10.1016/S0140-6736(11)61710-8
8. Gu X, Man C, Zhang H, Fan Y. High ankle-brachial index and risk of cardiovascular or all-cause mortality: a meta-analysis. Atherosclerosis. (2019) 282:29–36. doi: 10.1016/j.atherosclerosis.2018.12.028
9. Motobe K, Tomiyama H, Koji Y, Yambe M, Gulinisa Z, Arai T, et al. Cut-off value of the ankle-brachial pressure index at which the accuracy of brachial-ankle pulse wave velocity measurement is diminished. Circ J. (2005) 69:55–60. doi: 10.1253/circj.69.55
10. Wang C, Yuan Y, Zheng M, Pan A, Wang M, Zhao M, et al. Association of age of onset of hypertension with cardiovascular diseases and mortality. J Am Coll Cardiol. (2020) 75:2921–30. doi: 10.1016/j.jacc.2020.04.038
11. Wu S, An S, Li W, Lichtenstein AH, Gao J, Kris-Etherton PM, et al. Association of trajectory of cardiovascular health score and incident cardiovascular disease. JAMA Netw Open. (2019) 2:e194758. doi: 10.1001/jamanetworkopen.2019.4758
12. Wu S, Jin C, Li S, Zheng X, Zhang X, Cui L, et al. Aging, arterial stiffness, and blood pressure association in Chinese adults. Hypertension. (2019) 73:893–9. doi: 10.1161/HYPERTENSIONAHA.118.12396
13. Levey AS, Stevens LA, Schmid CH, Zhang YL, Castro AF 3rd, Feldman HI, et al. A new equation to estimate glomerular filtration rate. Ann Intern Med. (2009) 150:604–12. doi: 10.7326/0003-4819-150-9-200905050-00006
14. Huang S, Li J, Shearer GC, Lichtenstein AH, Zheng X, Wu Y, et al. Longitudinal study of alcohol consumption and HDL concentrations: a community-based study. Am J Clin Nutr. (2017) 105:905–12. doi: 10.3945/ajcn.116.144832
15. Li W, Jin C, Vaidya A, Wu Y, Rexrode K, Zheng X, et al. Blood pressure trajectories and the risk of intracerebral hemorrhage and cerebral infarction: a prospective study. Hypertension. (2017) 70:508–14. doi: 10.1161/HYPERTENSIONAHA.117.09479
16. Jin C, Chen S, Vaidya A, Wu Y, Wu Z, Hu FB, et al. Longitudinal change in fasting blood glucose and myocardial infarction risk in a population without diabetes. Diabetes Care. (2017) 40:1565–72. doi: 10.2337/dc17-0610
17. Tunstall-Pedoe H, Kuulasmaa K, Amouyel P, Arveiler D, Rajakangas AM and Pajak A. Myocardial infarction and coronary deaths in the World Health Organization MONICA project. Registration procedures, event rates, and case-fatality rates in 38 populations from 21 countries in four continents. Circulation. (1994) 90:583–612. doi: 10.1161/01.CIR.90.1.583
18. Stroke–1989. Recommendations on stroke prevention, diagnosis, and therapy. Report of the WHO task force on stroke and other cerebrovascular disorders. Stroke. 1989;20:1407–31. doi: 10.1161/01.STR.20.10.1407
19. Wang YX, Feng W, Zeng Q, Sun Y, Wang P, You L, et al. Variability of metal levels in spot, first morning, and 24-hour urine samples over a 3-month period in healthy adult Chinese men. Environ Health Perspect. (2016) 124:468–76. doi: 10.1289/ehp.1409551
20. Martínez-Camblor P, Pardo-Fernández JC. Smooth time-dependent receiver operating characteristic curve estimators. Stat Methods Med Res. (2018) 27:651–74. doi: 10.1177/0962280217740786
21. Tokitsu T, Yamamoto E, Hirata Y, Fujisue K, Sugamura K, Maeda H, et al. Relationship between inter-arm blood pressure differences and future cardiovascular events in coronary artery disease. J Hypertens. (2015) 33:1780–9.; discussion 1790. doi: 10.1097/HJH.0000000000000616
22. Criqui MH, McClelland RL, McDermott MM, Allison MA, Blumenthal RS, Aboyans V, et al. The ankle-brachial index and incident cardiovascular events in the MESA (Multi-Ethnic Study of Atherosclerosis). J Am Coll Cardiol. (2010) 56:1506–12. doi: 10.1016/j.jacc.2010.04.060
23. Mattace-Raso FU, van der Cammen TJ, Hofman A, van Popele NM, Bos ML, Schalekamp MA, et al. Arterial stiffness and risk of coronary heart disease and stroke: the Rotterdam Study. Circulation. (2006) 113:657–63. doi: 10.1161/CIRCULATIONAHA.105.555235
24. Tokitsu T, Yamamoto E, Oike F, Hirata Y, Tsujita K, Yamamuro M, et al. Clinical significance of brachial-ankle pulse-wave velocity in patients with heart failure with preserved left ventricular ejection fraction. J Hypertens. (2018) 36:560–8. doi: 10.1097/HJH.0000000000001589
25. Ding J, Mitchell GF, Bots ML, Sigurdsson S, Harris TB, Garcia M, et al. Carotid arterial stiffness and risk of incident cerebral microbleeds in older people: the age, gene/environment susceptibility (AGES)-Reykjavik study. Arterioscler Thromb Vasc Biol. (2015) 35:1889–95. doi: 10.1161/ATVBAHA.115.305451
26. Acampa M, Guideri F, Di Donato I, Tassi R, Marotta G, Lo Giudice G, et al. Arterial stiffness in patients with deep and lobar intracerebral hemorrhage. J Stroke. (2014) 16:184–8. doi: 10.5853/jos.2014.16.3.184
27. Fortier C, Sidibe A, Desjardins MP, Marquis K, De Serres SA, Mac-Way F, et al. Aortic-brachial pulse wave velocity ratio: a blood pressure-independent index of vascular aging. Hypertension. (2017) 69:96–101. doi: 10.1161/HYPERTENSIONAHA.116.08409
28. Niiranen TJ, Kalesan B, Larson MG, Hamburg NM, Benjamin EJ, Mitchell GF, et al. Aortic-brachial arterial stiffness gradient and cardiovascular risk in the community: the Framingham Heart Study. Hypertension. (2017) 69:1022–8. doi: 10.1161/HYPERTENSIONAHA.116.08917
29. Niboshi A, Hamaoka K, Sakata K, Inoue F. Characteristics of brachial-ankle pulse wave velocity in Japanese children. Eur J Pediatr. (2006) 165:625–9. doi: 10.1007/s00431-006-0135-y
30. Ishida A, Miyagi M, Kinjo K, Ohya Y. Age- and sex-related effects on ankle-brachial index in a screened cohort of Japanese: the Okinawa peripheral arterial disease study (OPADS). Eur J Prev Cardiol. (2014) 21:712–8. doi: 10.1177/2047487312462822
Keywords: arterial stiffness, bilateral difference, cardiovascular disease, all-cause mortality, clinical indicator
Citation: Zheng M, Zhang X, Zhao Q, Chen S, Guo X, Wang C, Jonas JB, Wu S and Guo C (2023) The impact of bilateral brachial-ankle pulse wave velocity difference on cardiovascular disease and all-cause mortality. Front. Cardiovasc. Med. 10:1234325. doi: 10.3389/fcvm.2023.1234325
Received: 4 June 2023; Accepted: 21 September 2023;
Published: 6 October 2023.
Edited by:
Gen-Min Lin, Hualien Armed Forces General Hospital, TaiwanReviewed by:
Chen Chi, Tongji University, China© 2023 Zheng, Zhang, Zhao, Chen, Guo, Wang, Jonas, Wu and Guo. This is an open-access article distributed under the terms of the Creative Commons Attribution License (CC BY). The use, distribution or reproduction in other forums is permitted, provided the original author(s) and the copyright owner(s) are credited and that the original publication in this journal is cited, in accordance with accepted academic practice. No use, distribution or reproduction is permitted which does not comply with these terms.
*Correspondence: Shouling Wu ZHJ3dXNsQDE2My5jb20= Caixia Guo Y3hnYmJAMTYzLmNvbQ==
†These authors have contributed equally to this work and share last authorship
Disclaimer: All claims expressed in this article are solely those of the authors and do not necessarily represent those of their affiliated organizations, or those of the publisher, the editors and the reviewers. Any product that may be evaluated in this article or claim that may be made by its manufacturer is not guaranteed or endorsed by the publisher.
Research integrity at Frontiers
Learn more about the work of our research integrity team to safeguard the quality of each article we publish.