
95% of researchers rate our articles as excellent or good
Learn more about the work of our research integrity team to safeguard the quality of each article we publish.
Find out more
ORIGINAL RESEARCH article
Front. Cardiovasc. Med. , 06 October 2023
Sec. Cardiovascular Biologics and Regenerative Medicine
Volume 10 - 2023 | https://doi.org/10.3389/fcvm.2023.1215958
This article is part of the Research Topic Sex Differences and Cardiovascular Therapeutics View all 13 articles
 Mohamed Zaid1*
 Lorenzo Sala2
 Laurel Despins3
 David Heise4
 Mihail Popescu5
 Marjorie Skubic6
 Salman Ahmad7
 Craig A. Emter8
 Virginia H. Huxley9,10
 Giovanna Guidoboni11
In this study, anatomical and functional differences between men and women in their cardiovascular systems and how these differences manifest in blood circulation are theoretically and experimentally investigated. A validated mathematical model of the cardiovascular system is used as a virtual laboratory to simulate and compare multiple scenarios where parameters associated with sex differences are varied. Cardiovascular model parameters related with women’s faster heart rate, stronger ventricular contractility, and smaller blood vessels are used as inputs to quantify the impact (i) on the distribution of blood volume through the cardiovascular system, (ii) on the cardiovascular indexes describing the coupling between ventricles and arteries, and (iii) on the ballistocardiogram (BCG) signal. The model-predicted outputs are found to be consistent with published clinical data. Model simulations suggest that the balance between the contractile function of the left ventricle and the load opposed by the arterial circulation attains similar levels in females and males, but is achieved through different combinations of factors. Additionally, we examine the potential of using the BCG waveform, which is directly related to cardiovascular volumes, as a noninvasive method for monitoring cardiovascular function. Our findings provide valuable insights into the underlying mechanisms of cardiovascular sex differences and may help facilitate the development of effective noninvasive cardiovascular monitoring methods for early diagnosis and prevention of cardiovascular disease in both women and men.
Women and men exhibit anatomical and functional differences in their cardiovascular systems. For example, women have smaller heart sizes, stronger ventricular contractility, smaller blood vessels, and smaller overall blood volume in the circulation (1–3). The manifestations of cardiovascular diseases also differ by sex. During a heart attack, men often present crushing chest pain, spreading pain in arms, nausea and cold sweat, whereas women mostly exhibit pain under the breastbone, abdominal pain, shortness of breath, nausea, and extreme fatigue (4, 5). In recent years, clinical studies have raised awareness of these differences along with the need to account for them to improve patient outcomes (6).
In this work, we contribute to this important area of research by investigating the effect of sex anatomical and functional differences on the circulation by means of a validated closed-loop mathematical model of the cardiovascular system (7–9). The model here is used as a virtual laboratory to simulate and compare multiple scenarios where parameters associated with sex differences are varied, such as ventricular contractility and arterial geometry. The model is also used to quantify the impact of sex-related parameter differences on the distribution of blood volume through the cardiovascular system. The model-predicted volumetric outputs are found to be consistent with published clinical data. Interestingly, the model indicates that the balance between the contractile function of the left ventricle (LV) and the load opposed by the arterial circulation, represented by the ventricular-arterial coupling (VAC) ratio, attains similar levels in females and males. This balance, however, is achieved through a different combination of factors. In females, the higher LV contractility is met by reduced arterial diameters, and this coupling ultimately leads to similar VAC ratios as in males.
Another interesting aspect of this work is that the mathematical model used to simulate cardiovascular sex differences also allows us to predict the shape of the ballistocardiogram (BCG) pertaining to the specific simulated scenario. As a matter of fact, the BCG signal is directly related to cardiovascular volumes. At each heartbeat, the blood ejected from the ventricles moves across the vascular compartments of the body which, as a consequence, host different amounts of blood at different instants along the cardiac cycle. The repetitive motion of blood volumes within the cardiovascular system results in the repetitive motion of the center of mass of the human body at each cardiac cycle, which is the motion captured by the BCG (10). Since the body motion is transmitted to the objects with which the body is in contact, the BCG offers a natural opportunity for noninvasive, unobtrusive monitoring of cardiovascular function. In the last decades, many devices for BCG sensing have been proposed, such as bed sensors (11, 12), weighing scales (13, 14), and accelerometers (15, 16).
A recent study showed that different BCG waveforms may be indicative of different cardiovascular baseline characteristics (15). Given the differences that the cardiovascular system exhibits in women and men, it is reasonable to conjecture that the baseline shape of the BCG signal may also be different depending on sex. Within this work, we test this conjecture by comparing the shape of BCG waveforms predicted by the mathematical model upon sex-related changes in cardiovascular parameters with BCG waveforms experimentally acquired on healthy males and females. Our study indicated that sex-related differences in arterial diameter and length are the major determinants of sex-related BCG differences, which manifest primarily through a decrease in amplitude and an earlier occurrence of the peaks, especially in the systolic phase.
The approach proposed in this work consists of utilizing mathematical modeling to interpret clinical and experimental data on the grounds of fundamental principles of cardiovascular physiology. This approach provides valuable insights on how different factors contribute to determine the healthy baseline conditions in women and men, which is a fundamental step towards a deeper understanding of sex differences in cardiovascular disease. Furthermore, we envision that the sex-related analysis of the BCG waveform will facilitate the effective design and implementation of noninvasive cardiovascular monitoring based on BCG sensing that will enable early diagnosis and prevent the worsening of cardiovascular disease in both women and men. The work is organized as follows. Sex-related cardiovascular differences observed in clinical studies are reviewed in Section 2. The main features of the mathematical model for the cardiovascular system are illustrated in Section 3, with particular emphasis on its inputs, outputs, and methods for BCG computing. The details of the experimental BCG acquisition are also provided in Section 3. The comparison between model predictions and clinical and experimental data is presented in Section 4, while conclusions and perspectives are outlined in Section 5.
The cardiovascular system exhibits a similar structure in women and men, but its dimensions and functions are distinctly different depending on sex (5). The female heart size is, on average, one-fourth smaller than the male heart (3). Independently from the body size, women showed to have smaller ventricular chambers and smaller arterial diameter and length compared to men of the same age and race (1, 17). Table 1 summarizes the main findings related to differences in healthy hearts and arteries of males and females. The findings are also discussed below.
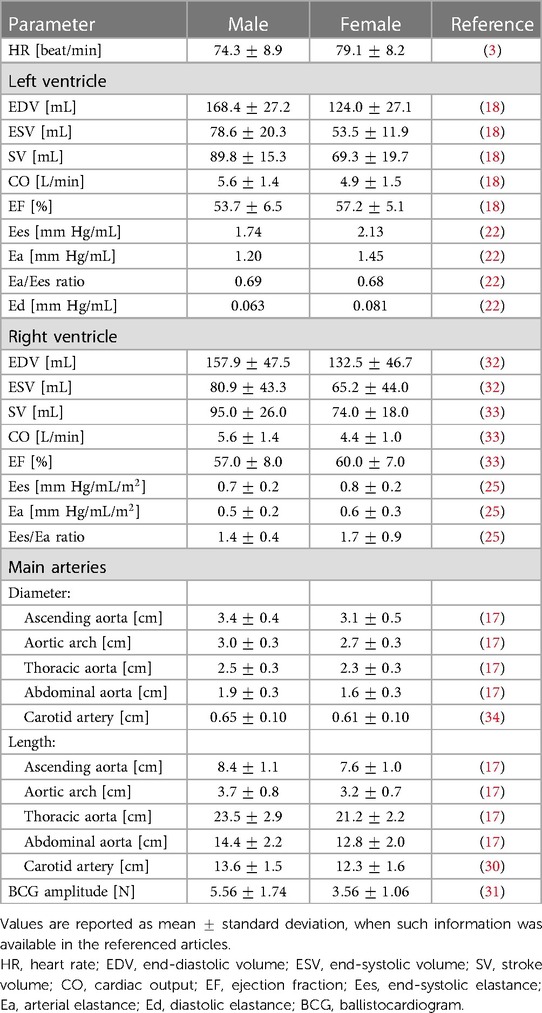
Table 1. Cardiovascular parameters for males and females.
The Left Ventricle (LV) in women is typically smaller than in men, leading to lower end-diastolic volume (EDV) and end-systolic volume (ESV). The stroke volume (SV) is also smaller in women, being approximately % less than that in men (3, 18). The higher heart rate (HR) typically observed in women reduces the gap difference in the cardiac output (CO) to approximately % (1, 3, 18, 19). LV ejection fraction (EF), a meaningful indicator of ventricular efficiency, is found to be approximately % higher in women than in men (20). LV end-systolic elastance (Ees), an important marker of LV contractility, is also found to be higher in the female heart, with Ees being approximately % higher in women than in men (21). The increased value of Ees in females is accompanied by an increased value of diastolic elastance, Ed, and arterial elastance, Ea. Specifically, Ed and Ea are found to be approximately % and % higher in women than in men (22, 23). In a healthy heart, an increase in Ees is usually accompanied by an increase in Ea; this maintains the ventricular-arterial coupling (VAC) ratio (Ea/Ees ratio) within the healthy human range, approximately between and , to ensure overall cardiovascular efficiency and performance (24). Interestingly, despite the many differences in anatomy and function, both the female and male hearts are characterized by similar VAC ratios very close to (25).
The Right Ventricle (RV) in women is also characterized by smaller size and higher contractility compared to men (20, 26). Similarly to the LV, EDV and ESV in the RV are lower in females by % and %, respectively. The SV and the CO in the right ventricle are also lower in females. The female RV is characterized by values of EF, Ees, and Ea that are higher than those found in males by %, % and %, respectively (18, 22, 27). The end-diastolic elastance Ed, on the other hand, has not been found to be significantly different between the right ventricle of males and females (26). The RV-Pulmonary Arterial (RV-PA) coupling estimated by RV Ees/Ea ratio is considered to be an indicator of RV efficiency. Its healthy range falls between and for healthy individuals; in males and females it is reported at and , respectively (25, 28).
The Main Arteries also present important differences among women and men. Vessel diameters and lengths are usually smaller in females compared to males (1, 29). Diameter and length of the arterial root are, on average, approximately % smaller in females than in males. This difference, however, seems to vary along the aortic segments. Specifically, the female-male differences in the diameters of the ascending aorta, the aortic arch, the thoracic aorta, and the abdominal aorta are found to amount approximately to %, %, %, and %, respectively (17). The diameter of the carotid artery is approximately % smaller in females compared to males (30). Similarly, arteries are typically shorter in women, for whom the length of ascending aorta, the aortic arch, the thoracic aorta, and the abdominal aorta are approximately 9.5%, 13.5%, 9.8% and 11.1% smaller than in men (17). The carotid length is reported to be 9.6% smaller in women (30).
It is reasonable to assume that the female-male differences in the cardiovascular system will also manifest in BCG signals. We recall that the BCG waveform results from the motion of the center of mass of the human body as the blood volume redistributes within different vascular compartments at each heartbeat (10). Thus, anatomic and functional differences in the cardiovascular system may lead to different patterns in blood volume distribution, which could be picked up by the BCG. Indeed, it has been observed that the mean BCG amplitude in females is lower than in males by nearly % ( N vs. N) (31).
This study utilizes a validated mathematical model for the cardiovascular system to predict and quantify how the distribution of blood volume within the body is impacted by differences in specific cardiac and vascular parameters associated with males and females (Section 2). The cardiovascular model leverages the analogy between the flow of a fluid in a hydraulic network and the flow of current in an electric circuit and translates fundamental principles of cardiovascular physiology into mathematical equations, a comprehensive description of the cardiovascular model, with full details, is provided in (7). Here we focus on describing which parameters are used as model inputs (Section 3.1), which quantities are computed as model outputs (Section 3.3), and which numerical strategies are used to solve the equations (Section 3.4). The model-predicted BCG waveforms are compared with experimental BCG waveforms acquired on human subjects by means of an accelerometer placed on a suspended bed. The details of the experimental BCG acquisition are given in Section 3.5.
The cardiovascular model schematized in the central panel of Figure 1 is described in detail in Guidoboni et al. (7). The pumping action of the ventricles, represented by a voltage source and a time-varying capacitor connected in series, is driving the blood flow through the systemic and pulmonary circulations. Resistances and inductances along the circuit represent viscous and inertial effects, respectively, of the blood flowing through. Capacitances capture the compliance of blood vessels, which can deform and accommodate different levels of blood volume throughout the cardiac cycle.
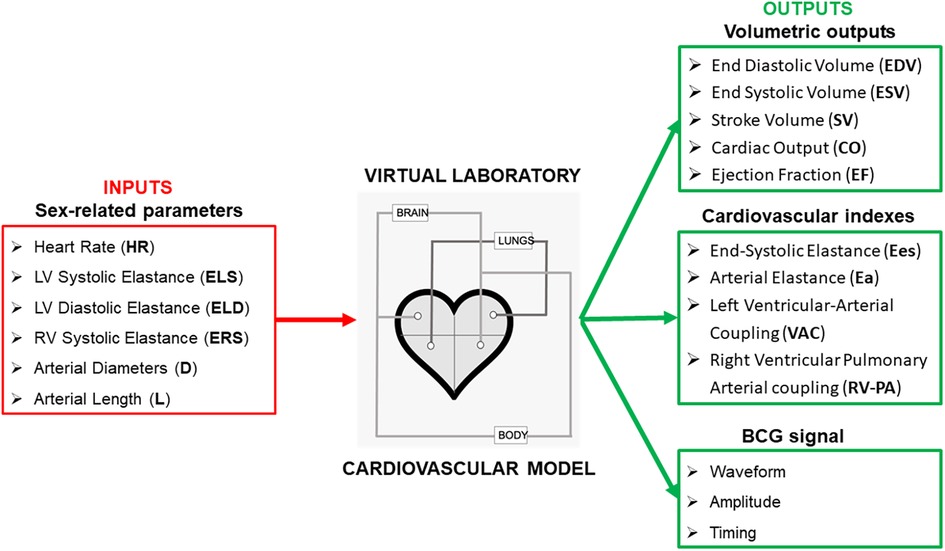
Figure 1. Selected parameters that have been found to be significantly different among women and men are used as inputs for the cardiovascular model proposed in Guidoboni et al. (7) to estimate volumetric outputs of the left and right ventricles, along with cardiovascular indeces and the ballistocardiogram (BCG) waveform.
In the following, we illustrate how specific parameters exhibiting sex-related differences are accounted for in the model, referring the interested reader to (7) for the full model details.
• Heart rate. The HR can be used as a direct input of the model through the parameters that define the activation functions and for the left and right ventricles, respectively (see Eq. (6g) in (7)). The functions and are periodic and their period can be determined from HR as
where HR is measured in beats/min. In order to account for the higher HR that is typically observed in females (see Section 2), we have assumed the HR in our female model to be higher than in our male model. This led us to adopt the values of beats/min and beats/min for the HR in our male and female models, respectively.
• Ventricular properties. Each ventricle in the cardiovascular model is described via a pressure generator capturing the isovolumic contraction, connected in series with a time-varying elastance accounting for the tension-length curve of activated fibers and the ventricular geometry. In particular, the elastances for the left and right ventricles, denoted by and , respectively, are related to the activation functions and via the following constitutive equations:
where , , and are parameters that can be set to different values for women and men. Specifically, we have assumed , , and to be higher in the female model (see Table 2). Conversely, was assumed to be the same for both the female and male models, since no significant differences were reported in the literature for the values of Ed in the right ventricle.
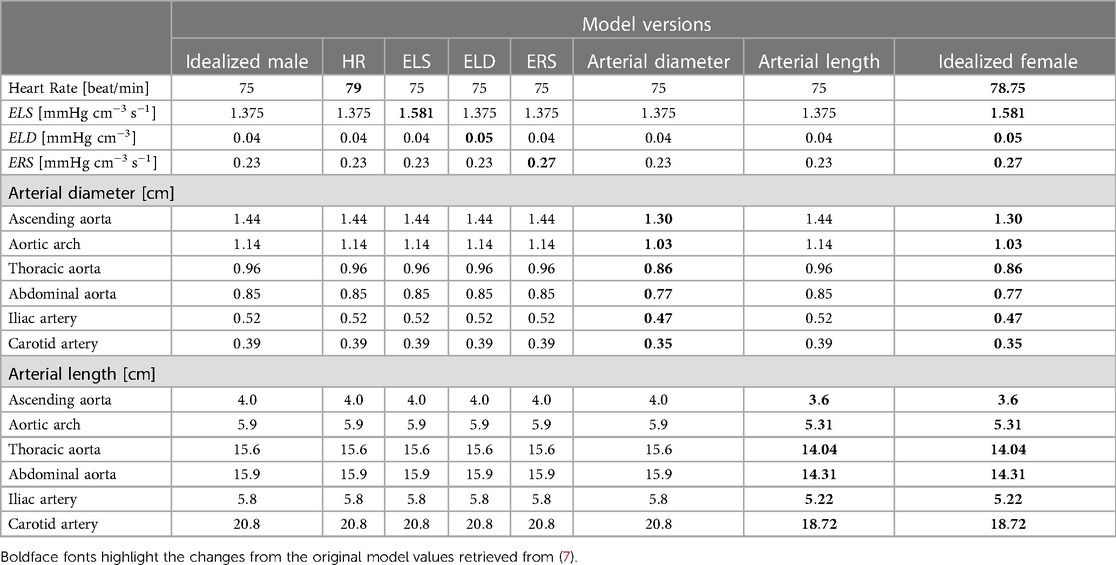
Table 2. Input parameter values for the 8 different versions of the cardiovascular model considered in this work, from the original parameters employed in (7), to represent the idealized male to the parameters used to describe the idealized female.
• Arterial diameter and length. Diameter and length of the main arteries are a direct input for the cardiovascular model, as they enter explicitly in the formulas to compute the vessel resistance , inductance , and capacitance reported below for ease of reference:
In these formulas, and represent the vessel diameter and length, respectively, whereas and represent the blood viscosity and density, and and represent the thickness and the Young modulus of the vessel wall, respectively. In order to account for the smaller vessel diameters and lengths that are typically observed in females (see Section 2), we have assumed and for all major arteries to be smaller than in our male model.
In order to assess the impact that the change in each of the aforementioned inputs has on the distribution of blood volume and pressure throughout the cardiovascular system, we proceed by considering the following different versions of the model:
• Idealized male model: in this version, henceforth referred to as male model for simplicity, all the values of the model parameters are the same as those reported in (7);
• HR model: in this version, all model parameters are the same as for the male model except for HR, which is assumed to be higher than what was reported in (7);
• ELS model: in this version, all model parameters are the same as for the male model except for ELS, which is assumed to be higher than what was reported in (7);
• ELD model: in this version, all model parameters are the same as for the male model except for ELD, which is assumed to be higher than what was reported in (7);
• ERS model: in this version, all model parameters are the same as for the male model except for ERS, which is assumed to be higher than what was reported in (7);
• Arterial diameter model: in this version, all model parameters are the same as for the male model except for the diameters of the major arteries, which are assumed to be smaller than what was reported in (7);
• Arterial length model: in this version, all model parameters are the same as for the male model except for the lengths of the major arteries, which are assumed to be smaller than what reported in (7);
• Idealized female model: in this version, henceforth referred to as female model for simplicity, the changes in HR, arterial diameter and length, ELS, ELD and ERS listed above are implemented simultaneously.
By comparing the cardiovascular outputs (see Section 3.3) obtained for each model version listed above, we will be able to study the effect of changing the value of one parameter at a time versus changing them all together. The summary of the parameter values pertaining to each version are summarized in Table 3. Boldface fonts have been utilized to emphasize the values of those parameters that differ from the rest. The values of the model parameters not reported explicitly in Table 2 are assumed to be the same as those in (7).
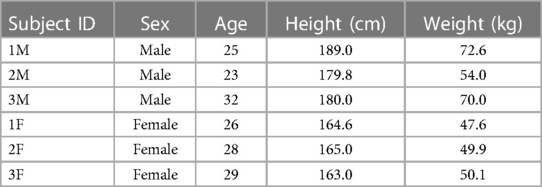
Table 3. Details of the subjects recruited for the synchronous acquisition of ECG and BCG signals.
For a given set of parameters, the outputs of the cardiovascular model are quantities computed from the solution of the system of nonlinear ordinary differential equations describing the model (see Appendix of (7)). In this study we will be focusing on three main types of outputs: volumetric outputs, cardiovascular indexes, and BCG waveform.
• Volumetric outputs. The model-predicted EDV and ESV are computed as the maximum and minimum values, respectively, of the simulated volume waveforms for the left and right ventricles. From these values, we compute , , and .
• Cardiovascular indexes. The model-predicted end-systolic pressure (ESP) is computed as the maximum pressure value simulated for the left and right ventricles. From these values and the volumetric outputs, we compute , , , and .
• BCG waveform. The model-predicted volume waveforms at the various nodes of the model provide the time-dynamics of how blood volume redistributes throughout the cardiovascular system. Using basic physics principles (7, 10), this information can be used to calculate the force associated with the motion of the center of mass of the human body, which gives rise to the BCG waveform.
The cardiovascular model has been implemented using OpenModelica (35), an open-source modelica-based modeling and simulation environment. The mathematical equations representing the system have been solved using a differential algebraic system solver, DASSL, with time step of s and tolerance of , as in (7). Exploiting the library PyFMI, a Python script has been written to call a functional mockup unit (FMU) generated by OpenModelica that can solve the cardiovascular model for specified input values. In order to ensure that the solution reaches a periodic behavior, the system is solved over a time interval of cardiac cycles. The solution segment corresponding to the last cardiac cycle is then considered for analysis. Post-processing of results has also been implemented in Python.
Six subjects were recruited for this study. Sex, age, height, and weight are reported in Table 3. Data collection was performed in a controlled laboratory environment, where subjects were asked to lie on the suspended bed described previously in (7). ECG and BCG were synchronously recorded by a three-lead configuration and by a Kionix accelerometer with mV/g sensitivity placed on the suspended bed frame, respectively. An ADInstrument PowerLab data acquisition system was used to collect the signals synchronously. ECG and BCG signals were both filtered via a th-order Butterworth bandpass filter to remove the high-frequency noise and the low-frequency respiration movement. ECG and BCG signals were filtered with a cut-off frequency of [0.7–40] and [1.25–15] Hz, respectively (15). R peaks in the ECG signal were used to segment the BCG signal at each cardiac cycle. For each subject, the mean BCG wave of the bundle of segmented waveforms was used as a pattern.
The outputs of the cardiovascular model obtained for the various versions illustrated in Section 3.2 are compared in terms of volumetric outputs (Section 4.1), cardiovascular indexes (Section 4.2), and BCG waveforms (Section 4.3). BCG waveforms estimated from the model are then compared with the BCG signals obtained experimentally (Section 4.3). We recall that, starting from the idealized male model version based on the model parameters reported in (7), we vary specific parameter values individually (i.e. HR, ELS, ELD, ERS, arterial diameter and length), thereby yielding six additional model versions. All changes are simultaneously incorporated into a single version called idealized female model version. Since the specific values of the modified parameters reported in Table 2 may vary from person to person, we also tested the cases in which such values were altered by 5%.
Figure 2 shows the EDV (shown as blue bars) and ESV (shown as red bars) for the LV (left panel) and the RV (right panel). The error bars indicate the change in outputs due to 5% alteration in the parameter value that characterizes the corresponding model. The EDV and ESV obtained for the LV in the female model are and mL, respectively. These values are % and % lower than those obtained for the male model, where EDV and ESV result to be and mL, respectively. These volume values are within the ranges reported in clinical studies, which are reported alongside the model predictions in Table 4 for ease of comparison. The barplots suggest that the increase in ELD and ELS contribute the most to this volumetric difference. These results seem reasonable since a higher ELD value corresponds to a reduction in ventricular relaxation that limits the filling phase, whereas a higher ELS value corresponds to a stronger contractility that reduces the volume of blood remaining in the LV after each contraction.
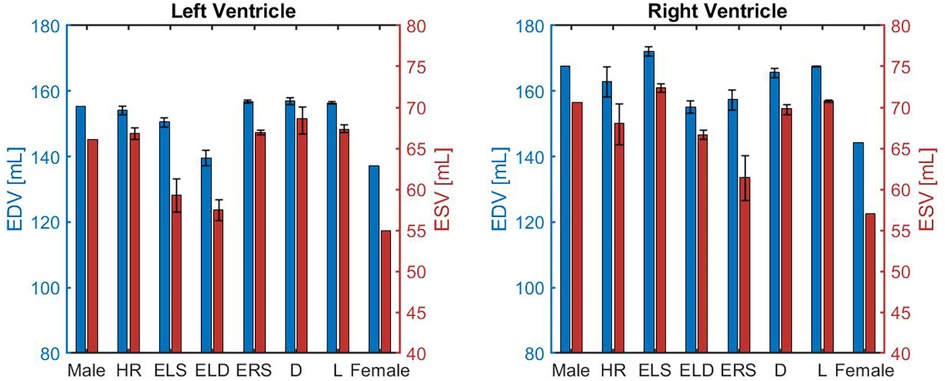
Figure 2. Comparison of left and right ventricular end-diastolic volume (EDV) and end-systolic volume (ESV) obtained for different model versions, namely the idealized male model (Male), HR model (HR), ELS model (ELS), ELD model (ELD), ERS model (ERS), Arterial diameter model (), Arterial length model (), and the idealized female model (Female) described in Section 3.2.
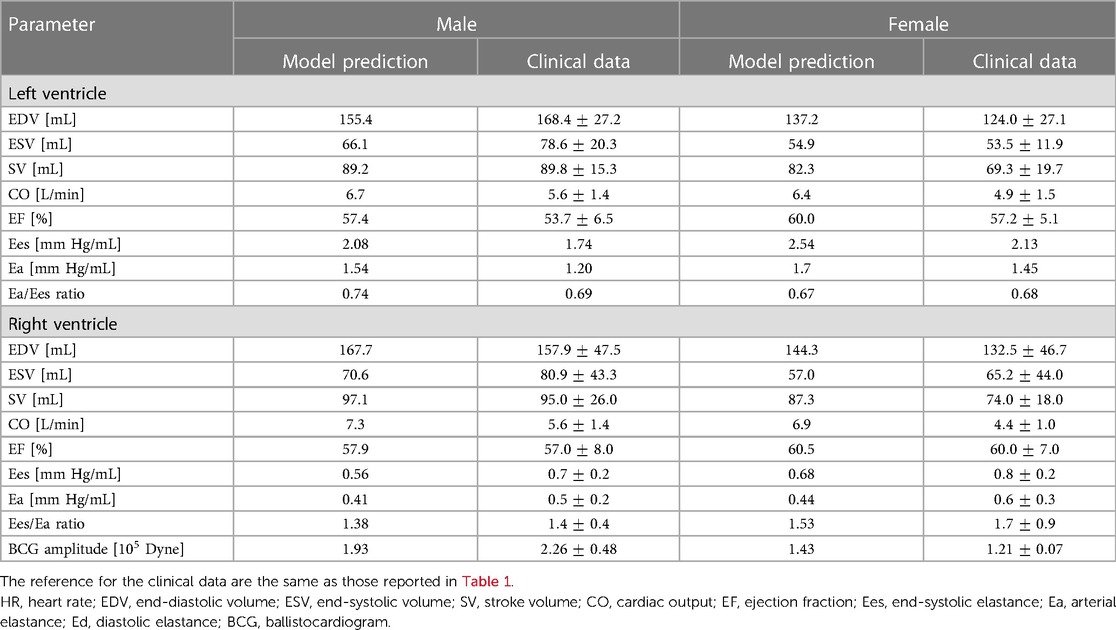
Table 4. Comparison between model predictions and clinical data for cardiovascular markers in males and females.
Similarly to the LV, the blood volumes predicted by the model in the female RV are lower than in males. The model-predicted EDV and ESV in the RV of the female model are and mL compared to and mL obtained for males. The smaller blood volumes predicted for both ventricles of the female model are consistent with the smaller ventricular size observed in women (18).
Figure 3 is organized in three rows, reporting the results for stroke volume (SV), cardiac output (CO) and ejection fraction (EF), and two columns, corresponding to the left and right ventricles (LV, RV). The model simulations predict lower SV for both the LV and the RV in the female model when compared to the male model. The percent difference is % in the LV and in the RV. Interestingly, when compared to the male model, the SV is higher in the ELS model, due to increased contractility, and lower in the ELD model, due to higher diastolic stiffness. The latter effect seems to be predominant since, overall, the SV predicted for the female model is lower than in the male model. Interestingly, the increase in HR compensates for the SV reduction leading to a simulated CO for the female model that is only % smaller than in the male model for the LV and 5.5% for the RV. Furthermore, the model predicted EF for the female model is higher than the value obtained for the male model in both ventricles. The barplots show that this is mainly due to the increase in ELS and ERS, which represent stronger LV and RV ventricular contractions, respectively. These results are consistent with the trends exibited by the clinical data reported in Table 4.
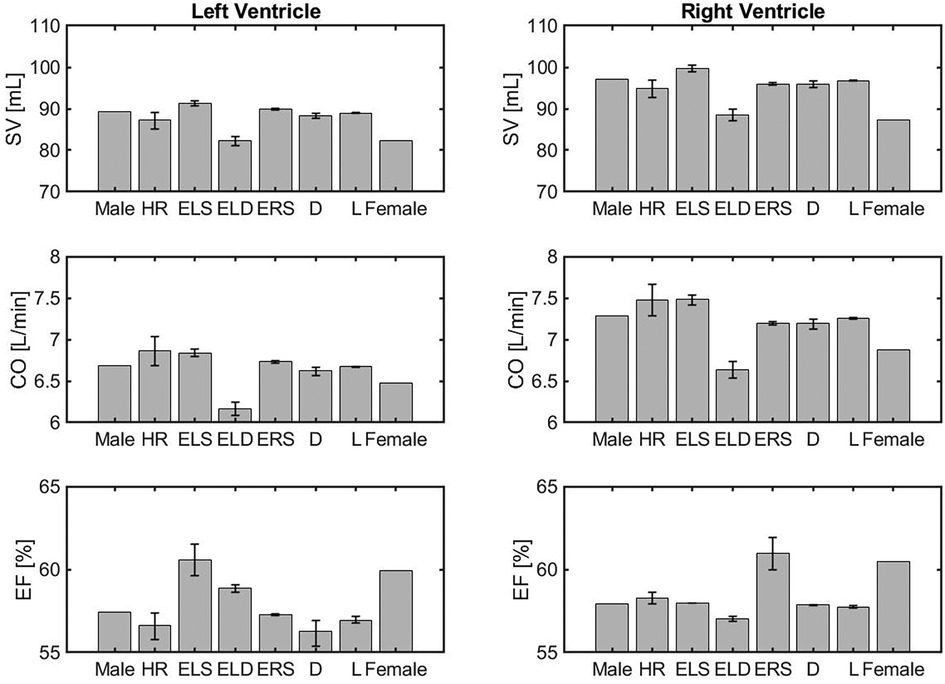
Figure 3. Comparison of volumetric outputs obtained for different model versions, namely the idealized male model (Male), HR model (HR), ELS model (ELS), ELD model (ELD), ERS model (ERS), Arterial diameter model (), Arterial length model (), and the idealized female model (Female) described in Section 3.2.
Cardiovascular indexes obtained with the different versions of the cardiovascular model are reported as barplots in Figure 4. The panels in the figure are organized in 3 rows, reporting the results of Ees, Ea and their ratio for the left and right ventricles. The error bars indicate the change in outputs due to alteration in the parameter value that characterizes the corresponding model.
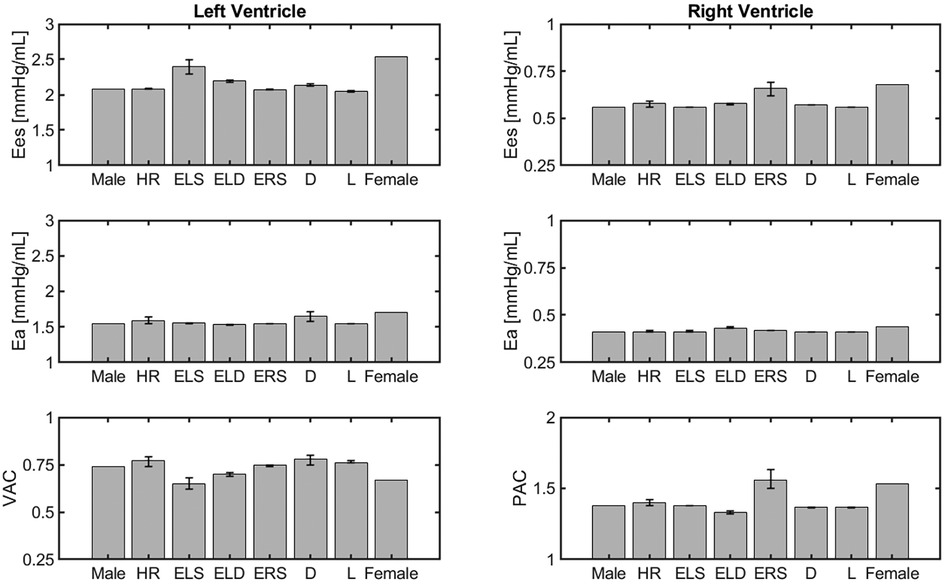
Figure 4. Comparison of cardiovascular indexes obtained for different model versions, namely the idealized male model, HR model, ELS, model, ELD model, ERS model, Arterial diameter model, Arterial length model, and the idealized female model described in Section 3.2.
The model simulations predict higher Ees values in the female model compared to the male model. This is mainly due to an increase in ventricular contractility, represented by ELS in the LV and ERS in the RV. This is consistent with the clinical findings, as summarized in Table 4.
The model predicted Ea values for both the LV and RV are slightly higher in the female model than in the male model. As a result, the VAC ratios obtained for the female and male models are quite similar, equal to and respectively, and within the healthy human range [0.6–1.2] reported in the literature (25). The simulated RV-PA coupling (PAC) in the female and male models result to be and , respectively, which are also within the reported optimal coupling range of [1.0–2.0] (28).
The BCG waveforms reconstructed virtually with the 8 different models presented in Section 3.2 are displayed in Figure 5. Specifically, idealized female and idealized male model simulations are highlighted in red and black solid lines, respectively, whereas the other cases are reported in dashed lines. Model simulations predict that an increase in ELS (red dashed line with triangles) enhances and anticipates the peak of the systolic phase in the BCG waveform. This result is consistent with the findings reported in (9), where the associations between changes in ventricular contractility and changes in BCG amplitude and timing were established on a preclinical swine model using induced myocardial infarction. Simulations also predict that a reduction in arterial diameter (blue dashed line with diamonds) decreases and anticipates the peak of the systolic phase in the BCG waveform. Moreover, the effect of the arterial diameter reduction is reflected in the post-systolic phase of the BCG, where the shape of the waveform differs from the male model with the presence of double peaks between and s. This result is consistent with the findings of Inan et al. where authors hypothesize that the second peak in the BCG waveform could be related to the mechanical resonance of the vasculature (31). Indeed, similar simulation results in the post-systolic phase can be observed when the arterial length is reduced (purple dashed line with squares). This behavior in the BCG waveform might be traced back to the fact that smaller and shorter tubes induce faster wave propagation. On the RV side, an increase in the value of ERS (violet dashed line in Figure 6) does not seem to influence the BCG waveform. This interesting finding suggests that the BCG signal may not be strongly influenced by RV function. When the BCG waveform obtained for the various model versions is compared with that obtained for the idealized female model, it appears that the reduction of arterial diameter is the dominant feature affecting sex-related BCG changes. Indeed, female BCG predicted amplitude has been found to be smaller than in the proposed idealized male model. This important outcome is in line with the results of (31, 36).

Figure 5. BCG waveforms obtained simulating the 8 different models presented in Section 3.1. In particular solid black line indicates the result employing the original idealized male model. Solid red line is obtained using the idealized female model. Blue, orange, yellow, violet, green and cyan dashed lines represent the BCG waveforms using the HR, ELS, ERS, arterial diameter () and arterial length () models, respectively.
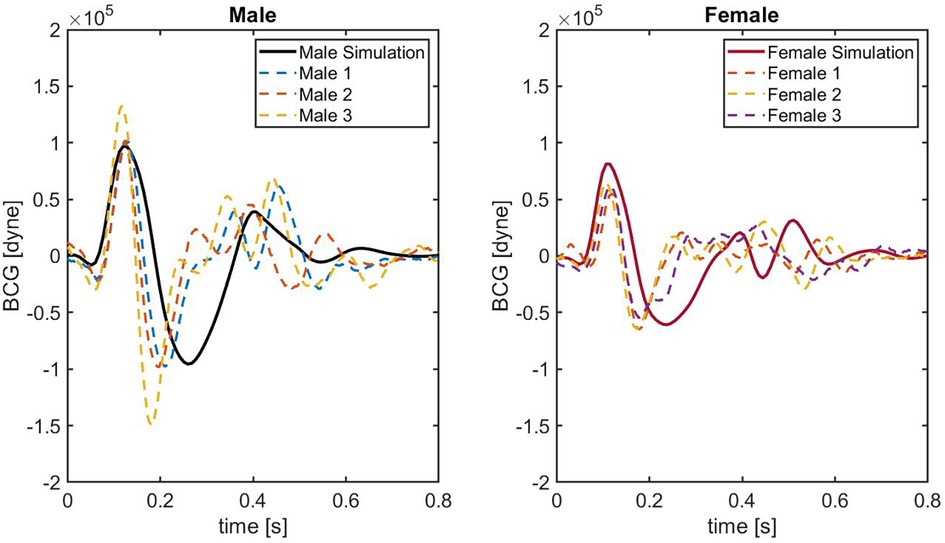
Figure 6. BCG waveforms obtained on 6 different healthy subjects. Solid black line indicates the result employing the original idealized male model. Solid red line is obtained using the idealized female model. Colored dashed lines represent the BCG waveforms acquired on each subject.
Figure 6 shows the comparison between model-predicted and experimentally-measured BCG waveforms. In the left panel, the BCG waveform for the idealized male model (black solid curve) is compared with the experimental waveforms of three male subjects (dashed curves). Similarly, in the right panel the BCG waveform for the idealized female model (red solid curve) is compared with the experimental waveforms of three female subjects (dashed curves). Notably, in the systolic phase between and s, the agreement between the model-predicted BCG for male and female and the measured BCG curves is quite satisfactory. The similarity in the systolic peaks is clearly detectable, both in terms of timing and amplitude. While comparable in terms of amplitude, shape of the BCG waveform in the post-systolic phase reported experimentally is more complex than the one predicted by the model. This result is not surprising, since capturing the features of the BCG in the post-systolic phase remains challenging both experimentally and theoretically (7, 10), and it motivates further research in this direction.
This study provides novel insights on the effect of sex-related anatomical and functional differences on blood circulation. Theoretical predictions based on a mechanism-driven cardiovascular model were used to interpret clinical and experimental data and describe how different factors contribute to determine the healthy baseline conditions in women and men. This is a fundamental step towards a deeper understanding of sex differences in cardiovascular disease. Our results indicate that the balance between LV contractile function and arterial impedance is achieved differently in females and males, with higher LV contractility in females being met by smaller arterial diameters. This difference in cardiovascular balance is captured by the BCG waveform, where the reduced arterial diameters lead to smaller amplitudes and earlier timing of the BCG peaks. These insights help deepen our understanding of sex-related baseline differences in cardiovascular function and could enable better tailoring of therapeutic and monitoring approaches to cardiovascular disease in women and men. Thanks to its noninvasiveness and strict relationship with blood volume distribution, sex-informed BCG sensing could be used to monitor cardiovascular changes in many different situations, spanning from optimizing physical exercise (37, 38) to detecting risks during pregnancy (39, 40).
Noninvasive cardiovascular monitoring based on BCG waveforms can provide advantages with respect to accessibility and cost-effectiveness when compared to other techniques such as echocardiography, making BCG-based devices suitable for routine monitoring in home and ambulatory settings. Routine monitoring could potentially lead to early diagnosis of cardiovascular complications, facilitating timely interventions and reducing the burden of cardiovascular diseases. While BCG waveforms hold great promise, a critical challenge for widespread clinical use is the standardization of BCG waveform acquisition. To-date, several devices and methods have been used to measure the BCG in various settings, and these are not always comparable. Therefore, the great challenge is to standardize BCG measurement to ensure that data collected from different sources can be consistent and comparable.
The results presented in this work should be contextualized within the limitations of the methods utilized to obtain them. The model simulations have been compared with published values of cardiac volumes and related parameters. These values, however, should be considered more as general indicators than as exact numbers since they may vary depending on the particular subjects under consideration. The cardiovascular model considered here does not include a detailed description of the atria, which could affect the ability to capture post-systolic events in the distribution of blood volumes and, consequently, in the BCG waveform. Furthermore, the comparison between experimentally-measured and model-predicted BCG waveforms could benefit from a larger pool of subjects. A larger cohort spanning across ages would better facilitate insights into how aging may affect cardiovascular function in women and men. These are very important directions of research that could be explored by extending the approach presented here.
The raw data supporting the conclusions of this article will be made available by the authors upon request.
The studies involving humans were approved by Institutional review board of University of Missouri, Columbia MO, USA. The studies were conducted in accordance with the local legislation and institutional requirements. The participants provided their written informed consent to participate in this study.
All authors have contributed to the conception and design of the study, contributed to manuscript revision, and finalized the draft. GG and MZ have contributed to drafting the manuscript. GG, MZ, MS, MP, DH, LD, SA, CE, and VH have contributed to the BCG-sensing technique and the interpretation of the results. GG, MZ, and LS have contributed to the implementation of the mathematical model and its numerical simulations. GG and MZ have contributed to all aspects of the project. All authors contributed to the article and approved the submitted version.
This work was partially supported by the University of Missouri and the Center for Eldercare and Rehabilitation Technology. GG was partially supported by NSF-DMS 2108711/2108665 and NIH R01EY034718.
We would like to acknowledge Nicholas Mattia Marazzi, Ahmad Suliman, and Ruhan Yi at the University of Missouri for helping with the data collection.
GG would like to disclose that she received remuneration from Foresite Healthcare LLC for serving as a consultant. MS would like to disclose that she received remuneration from Foresite Healthcare LLC for serving on the advisory board. These relationships do not conflict with the work in this article and are pursuant to the University of Missouri’s policy on outside activities.
The remaining authors declare that the research was conducted in the absence of any commercial or financial relationships that could be construed as a potential conflict of interest.
All claims expressed in this article are solely those of the authors and do not necessarily represent those of their affiliated organizations, or those of the publisher, the editors and the reviewers. Any product that may be evaluated in this article, or claim that may be made by its manufacturer, is not guaranteed or endorsed by the publisher.
1. Beale AL, Meyer P, Marwick TH, Lam CS, Kaye DM. Sex differences in cardiovascular pathophysiology: why women are overrepresented in heart failure with preserved ejection fraction. Circulation. (2018) 138(2):198–205. doi: 10.1161/CIRCULATIONAHA.118.034271
2. Huxley VH, Wang J. Cardiovascular sex differences influencing microvascular exchange. Cardiovasc Res. (2010) 87(2):230–42. doi: 10.1093/cvr/cvq142
3. Pierre SRS, Peirlinck M, Kuhl E. Sex matters: a comprehensive comparison of female, male hearts. Front Physiol. (2022) 13:831179. doi: 10.3389/fphys.2022.831179
4. Prabhavathi K, Selvi KT, Poornima K, Sarvanan A. Role of biological sex in normal cardiac function, in its disease outcome—a review. J Clin Diagn Res. (2014) 8(8):BE01. doi: 10.7860/JCDR/2014/9635.4771
5. Huxley VH. Sex, the cardiovascular system: the intriguing tale of how women and men regulate cardiovascular function differently. Adv Physiol Educ. (2007) 31(1):17–22. doi: 10.1152/advan.00099.2006
6. Schmetzer O, Flörcken A. Sex and gender differences in hematology. In Sex and gender aspects in clinical medicine. Springer (2011). p. 151–68.
7. Guidoboni G, Sala L, Enayati M, Sacco R, Szopos M, Keller JM, et al. Cardiovascular function and ballistocardiogram: a relationship interpreted via mathematical modeling. IEEE Trans Biomed Eng. (2019) 66(10):2906–17. doi: 10.1109/TBME.2019.2897952
8. Guidoboni G. Model-Based Sensor Technology for Detection of Cardiovascular Status (2020). Assignee: The Curators of the University of Missouri. PCT Patent Application No.: PCT/US2019/052738. Published as WO2020068859A1
9. Zaid M, Sala L, Ivey JR, Tharp DL, Mueller CM, Thorne PK, et al. Mechanism-driven modeling to aid non-invasive monitoring of cardiac function via ballistocardiography. Front Med Technol. (2022) 4:788264. doi: 10.3389/fmedt.2022.788264 35252962
10. Starr I, Noordergraaf A. Ballistocardiography in cardiovascular research: physical aspects of the circulation in health, disease. Philadelphia/Montreal: Lippincott (1967).
11. Lydon K, Su BY, Rosales L, Enayati M, Ho K, Rantz M, et al. Robust heartbeat detection from in-home ballistocardiogram signals of older adults using a bed sensor. In Conference of the IEEE Engineering in Medicine, Biology Society. IEEE (2015). p. 7175–9.
12. Su BY, Enayati M, Ho K, Skubic M, Despins L, Keller J, et al. Monitoring the relative blood pressure using a hydraulic bed sensor system. IEEE Trans Biomed Eng. (2018) 66(3):740–8. doi: 10.1109/TBME.2018.2855639
13. Inan OT, Etemadi M, Giovangrandi LB, Kovacs GT, Wiard RM. Weighing scale, sensor systems and methods for monitoring heart function, June 16. U.S. Patent No 9,055,871 (2015).
14. Etemadi M, Inan OT, Giovangrandi L, Kovacs GT. Rapid assessment of cardiac contractility on a home bathroom scale. IEEE Trans Inf Technol Biomed. (2011) 15(6):864–9. doi: 10.1109/TITB.2011.2161998
15. Marazzi NM, Guidoboni G, Zaid M, Sala L, Ahmad S, Despins L, et al. Combining physiology-based modeling and evolutionary algorithms for personalized, noninvasive cardiovascular assessment based on electrocardiography and ballistocardiography. Front Physiol. (2022) 12:1953. doi: 10.3389/fphys.2021.739035
16. Zaid M, Ahmad S, Suliman A, Camazine M, Weber I, Sheppard J, et al. Noninvasive cardiovascular monitoring based on electrocardiography, ballistocardiography: a feasibility study on patients in the surgical intensive care unit [Preprint] (2021).
17. Rylski B, Desjardins B, Moser W, Bavaria JE, Milewski RK. Gender-related changes in aortic geometry throughout life. Eur J Cardiothorac Surg. (2014) 45(5):805–11. doi: 10.1093/ejcts/ezt597
18. Rutkowski DR, Barton GP, François CJ, Aggarwal N, Roldán-Alzate A. Sex differences in cardiac flow dynamics of healthy volunteers. Radiology. (2020) 2(1):e190058. doi: 10.1148/ryct.2020190058
19. Chung AK, Das SR, Leonard D, Peshock RM, Kazi F, Abdullah SM, et al. Women have higher left ventricular ejection fractions than men independent of differences in left ventricular volume: the Dallas Heart Study. Circulation. (2006) 113(12):1597–604. doi: 10.1161/CIRCULATIONAHA.105.574400
20. Tandri H, Daya SK, Nasir K, Bomma C, Lima JA, Calkins H, et al. Normal reference values for the adult right ventricle by magnetic resonance imaging. Am J Cardiol. (2006) 98(12):1660–4. doi: 10.1016/j.amjcard.2006.07.049
21. Walley KR. Left ventricular function: time-varying elastance, left ventricular aortic coupling. Crit Care. (2016) 20(1):1–11. doi: 10.1186/s13054-016-1439-6
22. Redfield MM, Jacobsen SJ, Borlaug BA, Rodeheffer RJ, Kass DA. Age-and gender-related ventricular-vascular stiffening: a community-based study. Circulation. (2005) 112(15):2254–62. doi: 10.1161/CIRCULATIONAHA.105.541078
23. Chen C-H, Nakayama M, Nevo E, Fetics BJ, Maughan WL, Kass DA. Coupled systolic-ventricular and vascular stiffening with age: implications for pressure regulation and cardiac reserve in the elderly. J Am Coll Cardiol. (1998) 32(5):1221–7. doi: 10.1016/S0735-1097(98)00374-X
24. Coutinho T, Borlaug BA, Pellikka PA, Turner ST, Kullo IJ. Sex differences in arterial stiffness and ventricular-arterial interactions. J Am Coll Cardiol. (2013) 61(1):96–103. doi: 10.1016/j.jacc.2012.08.997
25. Singh I, Oliveira RK, Heerdt PM, Pari R, Systrom DM, Waxman AB. Sex-related differences in dynamic right ventricular-pulmonary vascular coupling in heart failure with preserved ejection fraction. Chest. (2021) 159(6):2402–16. doi: 10.1016/j.chest.2020.12.028
26. Tello K, Richter MJ, Yogeswaran A, Ghofrani HA, Naeije R, Vanderpool R, et al. Sex differences in right ventricular–pulmonary arterial coupling in pulmonary arterial hypertension. Am J Respir Crit Care Med. (2020) 202(7):1042–6. doi: 10.1164/rccm.202003-0807LE
27. Keen J, Prisco SZ, Prins KW. Sex differences in right ventricular dysfunction: insights from the bench to bedside. Front Physiol. (2021) 11:623129. doi: 10.3389/fphys.2020.623129
28. Hsu S. Coupling right Ventricular – Pulmonary arterial research to the pulmonary hypertension patient bedside. Circ Heart Fail. (2019) 12(1):e005715.
29. Wolak A, Gransar H, Thomson LE, Friedman JD, Hachamovitch R, Gutstein A, et al. Aortic size assessment by noncontrast cardiac computed tomography: normal limits by age, gender, and body surface area. JACC: Cardiovasc Imaging. (2008) 1(2):200–9. doi: 10.1016/j.jcmg.2007.11.005
30. Choudhry FA, Grantham JT, Rai AT, Hogg JP. Vascular geometry of the extracranial carotid arteries: an analysis of length, diameter, and tortuosity. J Neurointerv Surg. (2016) 8(5):536–40. doi: 10.1136/neurintsurg-2015-011671
31. Inan OT. Novel technologies for cardiovascular monitoring using ballistocardiography and electrocardiography. Vol. 70. Ann Arbor, Ml: ProQuest LLC (2009).
32. Martínez-Sellés M, Pérez-David E, Yotti R, Jiménez-Borreguero J, Loughlin G, Gallego L, et al. Gender differences in right ventricular function in patients with non-ischaemic cardiomyopathy. Neth Heart J. (2015) 23:578–84. doi: 10.1007/s12471-015-0753-y
33. Kawel-Boehm N, Hetzel SJ, Ambale-Venkatesh B, Captur G, Francois CJ, Jerosch-Herold M, et al. Reference ranges (“normal values”) for cardiovascular magnetic resonance (CMR) in adults and children: 2020 update. J Cardiovasc Magn Reson. (2020) 22(1):1–63. doi: 10.1186/s12968-020-00683-3
34. Krejza J, Arkuszewski M, Kasner SE, Weigele J, Ustymowicz A, Hurst RW, et al. Carotid artery diameter in men and women and the relation to body and neck size. Stroke. (2006) 37(4):1103–5. doi: 10.1161/01.STR.0000206440.48756.f7
35. Fritzson P, Aronsson P, Pop A, Lundvall H, Nystrom K, Saldamli L, et al. Openmodelica-a free open-source environment for system modeling, simulation, and teaching. In 2006 IEEE Conference on Computer Aided Control System Design, 2006 IEEE International Conference on Control Applications, 2006 IEEE International Symposium on Intelligent Control. IEEE (2006). p. 1588–95.
36. Harrison WK, Smith E. Sex differences in cardiac function of a group of young adults. Cardiology. (1980) 66(2):74–84. doi: 10.1159/000170853
37. Arbeit S, Jokl E, Koskela A, McCubbin W. Ballistocardiographic changes during a 30 day physical training period. Am Heart J. (1957) 54(4):556–60. doi: 10.1016/0002-8703(57)90295-8
38. Rabineau J, Hossein A, Landreani F, Haut B, Mulder E, Luchitskaya E, et al. Cardiovascular adaptation to simulated microgravity and countermeasure efficacy assessed by ballistocardiography and seismocardiography. Sci Rep. (2020) 10(1):1–13. doi: 10.1038/s41598-020-74150-5
39. Hall JE, Hall ME. Guyton and Hall textbook of medical physiology e-Book. Philadelphia, PA: Elsevier Health Sciences (2020).
Keywords: cardiovascular sex differences, noninvasive sensing, ballistocardiography, cardiovascular modeling, sex differeces, physiology-based modeling
Citation: Zaid M, Sala L, Despins L, Heise D, Popescu M, Skubic M, Ahmad S, Emter CA, Huxley VH and Guidoboni G (2023) Cardiovascular sex-differences: insights via physiology-based modeling and potential for noninvasive sensing via ballistocardiography. Front. Cardiovasc. Med. 10:1215958. doi: 10.3389/fcvm.2023.1215958
Received: 3 May 2023; Accepted: 12 September 2023;
Published: 6 October 2023.
Edited by:
Rajesh Katare, University of Otago, New ZealandReviewed by:
Audrey Adji, Victor Chang Cardiac Research Institute, Australia,© 2023 Zaid, Sala, Despins, Heise, Popescu, Skubic, Ahmad, Emter, Huxley and Guidoboni. This is an open-access article distributed under the terms of the Creative Commons Attribution License (CC BY). The use, distribution or reproduction in other forums is permitted, provided the original author(s) and the copyright owner(s) are credited and that the original publication in this journal is cited, in accordance with accepted academic practice. No use, distribution or reproduction is permitted which does not comply with these terms.
*Correspondence: Mohamed Zaid bW9oYW1lZC56YWlkMUBtYWluZS5lZHU=
Disclaimer: All claims expressed in this article are solely those of the authors and do not necessarily represent those of their affiliated organizations, or those of the publisher, the editors and the reviewers. Any product that may be evaluated in this article or claim that may be made by its manufacturer is not guaranteed or endorsed by the publisher.
Research integrity at Frontiers
Learn more about the work of our research integrity team to safeguard the quality of each article we publish.