
94% of researchers rate our articles as excellent or good
Learn more about the work of our research integrity team to safeguard the quality of each article we publish.
Find out more
ORIGINAL RESEARCH article
Front. Cardiovasc. Med., 03 July 2023
Sec. Heart Failure and Transplantation
Volume 10 - 2023 | https://doi.org/10.3389/fcvm.2023.1183485
This article is part of the Research TopicInfiltrative Cardiomyopathy and Heart FailureView all 5 articles
 Aaisha Ferkh1,2
 Catherina Tjahjadi3Luke Stefani1,2Paul Geenty1,2Karen Byth4
 Kasun De Silva1,2Anita C. Boyd5David Richards5Peter Mollee6,7Dariusz Korczyk3
 Mark S. Taylor8
 Fiona Kwok9Eddy Kizana1,2,10
 Arnold C. T. Ng3Liza Thomas1,2,11*
Aims: Differentiating phenotypes of cardiac “hypertrophy” characterised by increased wall thickness on echocardiography is essential for management and prognostication. Transthoracic echocardiography is the most commonly used screening test for this purpose. We sought to identify echocardiographic markers that distinguish infiltrative and storage disorders that present with increased left ventricular (LV) wall thickness, namely, cardiac amyloidosis (CA) and Anderson–Fabry disease (AFD), from hypertensive heart disease (HHT).
Methods: Patients were retrospectively recruited from Westmead Hospital, Sydney, and Princess Alexandra Hospital, Brisbane. LV structural, systolic, and diastolic function parameters, as well as global (LVGLS) and segmental longitudinal strains, were assessed. Previously reported echocardiographic parameters including relative apical sparing ratio (RAS), LV ejection fraction-to-strain ratio (EFSR), mass-to-strain ratio (MSR) and amyloidosis index (AMYLI) score (relative wall thickness × E/e′) were evaluated.
Results: A total of 209 patients {120 CA [58 transthyretin amyloidosis (ATTR) and 62 light-chain (AL) amyloidosis], 31 AFD and 58 HHT patients; mean age 64.1 ± 13.7 years, 75% male} comprised the study cohort. Echocardiographic measurements differed across the three groups, The LV mass index was higher in both CA {median 126.6 [interquartile range (IQR) 106.4–157.9 g/m2]} and AFD [median 134 (IQR 108.8–152.2 g/m2)] vs. HHT [median 92.7 (IQR 79.6–102.3 g/m2), p < 0.05]. LVGLS was lowest in CA [median 12.29 (IQR 10.33–15.56%)] followed by AFD [median 16.92 (IQR 14.14–18.78%)] then HHT [median 18.56 (IQR 17.51–19.97%), p < 0.05]. Diastolic function measurements including average e′ and E/e′ were most impaired in CA and least impaired in AFD. Indexed left atrial volume was highest in CA. EFSR and MSR differentiated secondary (CA + AFD) from HHT [receiver operating curve–area under the curve (ROC-AUC) of 0.80 and 0.91, respectively]. RAS and AMYLI score differentiated CA from AFD (ROC-AUC of 0.79 and 0.80, respectively). A linear discriminant analysis with stepwise variable selection using linear combinations of LV mass index, average e′, LVGLS and basal strain correctly classified 79% of all cases.
Conclusion: Simple echocardiographic parameters differentiate between different “hypertrophic” cardiac phenotypes. These have potential utility as a screening tool to guide further confirmatory testing.
Echocardiographic cardiac “hypertrophy” [defined as increased left ventricular (LV) wall thickness on echocardiography] is a hallmark of infiltrative cardiomyopathies such as cardiac amyloidosis (CA), lysosomal storage diseases such as Anderson–Fabry disease (AFD), and conditions with true myocyte hypertrophy such as hypertrophic cardiomyopathy (HCM) and hypertensive heart disease (HHT). Patients with infiltrative/storage aetiologies of cardiac “hypertrophy” often experience a delay in diagnosis (1), with significant implications for management, as disease-specific therapies are now available. Endomyocardial biopsy is the gold standard for diagnosis but is invasive and often non-diagnostic (2). Whilst non-invasive imaging strategies include bone scintigraphy for diagnosing transthyretin (ATTR) CA (3) and cardiac magnetic resonance imaging (CMR) for CA and AFD (4), echocardiography is the initial, widely available and relatively inexpensive modality for screening, offering an attractive alternative to identify aetiology in cardiomyopathies with a “hypertrophic” phenotype.
Previous studies have investigated novel echocardiographic parameters. Phelan et al. (5) demonstrated that relative apical sparing ratio (RAS—ratio of apical to mid + basal longitudinal strain) >1 was sensitive and specific for CA, vs. patients with HCM and aortic stenosis. Left ventricular ejection fraction (LVEF)-to-strain ratio (EFSR) was a strong discriminator between CA and HCM (6). More recently, the increased wall thickness (IWT) score distinguished CA from other causes of LV “hypertrophy”, including HCM (7). An amyloidosis index (AMYLI) score [relative wall thickness (RWT) × E/E′] <2.2 was sensitive, excluding CA (8). Finally, our group (9) demonstrated that the LV mass-to-strain ratio (MSR) accurately distinguished ATTR and light-chain (AL) amyloidosis.
However, most of the above reports include small patient populations and involve complex multiparametric measures (e.g., IWT score), and none have included patients with AFD. The studies above have extensively investigated CA vs. HCM, and reports do not focus on differentiating CA from AFD. Our primary aim was to investigate echocardiographic parameters (including EFSR, MSR, AMYLI and RAS) that distinguish secondary causes (infiltrative and storage) that present with increased LV wall thickness including CA and AFD from HHT.
Consecutive CA patients were retrospectively recruited from amyloidosis clinics at Westmead Hospital, Sydney (2009–2021), and Princess Alexandra Hospital, Brisbane (2013–2021), both tertiary state referral centres for amyloidosis. The inclusion criteria include (1) a positive cardiac biopsy for amyloidosis, (2) positive bone scintigraphy for ATTR amyloidosis (grade ≥2 cardiac tracer uptake) and absence of monoclonal gammopathy of uncertain significance (10) or (3) in the case of AL, a biopsy showing AL amyloid deposits with an unexplained increased wall thickness and elevated N-terminal prohormone of brain natriuretic peptide (NT-proBNP) (11). AFD patients were consecutively recruited from the Genetic Medicine Department at Westmead Hospital (2001–2020), and all had positive AFD gene tests. HHT patients were selected from a departmental database (2010–2021). Only patients with mean LV wall thickness ≥11 mm were included in all groups to ensure a “hypertrophic” phenotype. Patients with other structural heart diseases or major valvulopathy were excluded. The ethics committees in both participating institutions approved the study.
A comprehensive transthoracic echocardiogram, including 2D, colour, and Doppler, was performed in all patients in accordance with the American Society of Echocardiography/European Association of Cardiovascular Imaging guidelines (12), using General Electric (GE) EchoPAC version 204 (Milwaukee, WI, United States). Experienced researchers with extensive training in echocardiographic and strain measurements performed the measurements.
In the parasternal long-axis view, LV interventricular septum and posterior wall thickness and LV end-diastolic diameter (LVEDD) were measured in end-diastole. Mean wall thickness (MWT) was the average of LV interventricular septum and posterior wall thickness. RWT was calculated as 2 × posterior wall thickness/LVEDD. LV ejection fraction (LVEF) was calculated using Simpson's biplane-derived LV end-diastolic and LV end-systolic volumes. The LV mass index (LVMI) was derived using the Devereux formula and indexed to the body surface area (BSA). Left atrial volume (LAVI) was obtained from the four- and two-chamber apical views using the area-length method and indexed to BSA. Mitral inflow E and A velocities and E/A ratio were obtained for LV diastolic function. Tissue Doppler septal and lateral annular e′ velocities were obtained. Average e′ and E/average e′ were calculated. Tricuspid annular plane systolic excursion (TAPSE) was measured for right ventricular (RV) function.
Two-dimensional speckle tracking strain analysis (GE EchoPAC software version 204 Q-Analysis) was utilised to measure LV global longitudinal strain (LVGLS) and RV free-wall strain (RVFWS). Frame rates of >60 frames per second and an average of measurements from three cardiac cycles were used; in atrial fibrillation (AF), an average of three cycles with similar R-R intervals was utilised. LVGLS was measured from the apical 4-chamber, 2-chamber, and long-axis views by tracing the endocardium and manually adjusting the region of interest to myocardial thickness, providing an 18-segment LV model (6 segments per apical view). LVGLS was the average of 18 segments. Basal, mid, and apical segmental strains were calculated as the average of six segments at each level. RVFWS was the average of the three free-wall segments. Absolute values for strains are reported.
E/A could only be derived in sinus rhythm (SR) (n = 96). In the older AFD studies, the RV-S′ velocity was often not measured and hence was excluded from the results. TAPSE could only be measured in 19/31, and RVFWS in 15. Parameter ratios mentioned previously such as EFSR (LVEF:LVGLS), RAS (apical strain/mid + basal strain), AMYLI (RWT × E/e′) and MSR (LVMI:LVGLS) were derived and evaluated (Figure 1).
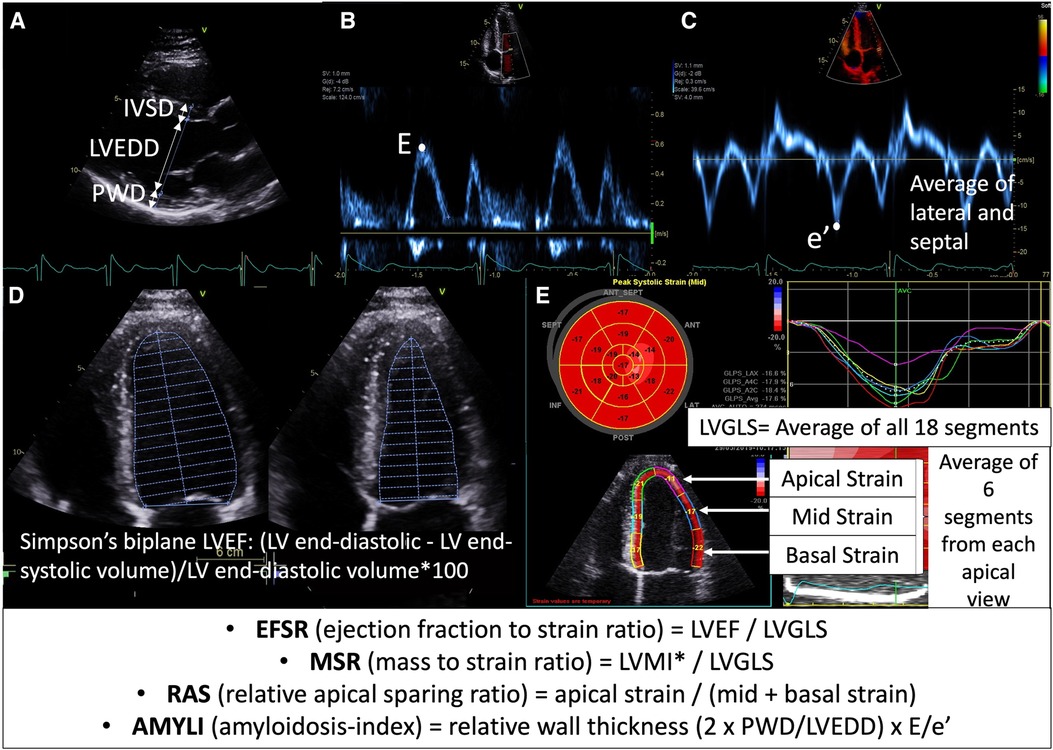
Figure 1. Calculation of echocardiographic formulae evaluated in this study: (A) parasternal long-axis view demonstrating wall thickness (IVSD, interventricular septal diameter; PWD, posterior wall diameter) and cavity size (LVEDD) measurement, (B) mitral valve inflow Doppler demonstrating E velocity, (C) tissue Doppler of mitral valve demonstrating e′ velocity (average of septal and lateral used in E/e′ formula), (D) Simpson's LVEF measurement (apical four-chamber view demonstrated here, but biplane four- and two-chamber views are used in calculation); (E) longitudinal strain measurement demonstrating segmental strain (average of six segments across apical four-chamber, two-chamber and long-axis views at each of basal, mid and apical levels) and global longitudinal strain (LVGLS—average of all 18 segments). *LVMI was calculated using the Devereux formula (i.e., 0.8 {1.04 [(LVEDD + IVSD + PWD)3 − LVEDD3]} + 0.6) and indexed to body surface area.
IBM SPSS Statistics version 28 (SPSS, Chicago, IL, United States) was used to analyse data. Categorical variables were summarised using frequencies and percentages. Median and interquartile range (IQR) were used for continuous variables due to their skewed distributions. Chi-squared tests were used to test the association between categorical variables. The Mann–Whitney test and Kruskal–Wallis nonparametric analysis of variance examined differences for continuous variables. Two-tailed tests with a 5% significance level were used throughout.
The receiver operating curve–area under the curve (ROC-AUC) was used to quantify the performance of continuous variables in differentiating (1) secondary (infiltrative/storage) aetiology (CA and AFD) vs. HHT and (2) CA vs. AFD. To compare infiltrative/storage causes (CA and AFD) with HHT, a cut-point achieving high sensitivity and reasonable specificity was selected for screening purposes. For CA vs. AFD, a cut-point that evenly balanced specificity and sensitivity was set. A simple two-step tree-based classifier was used to classify patients into one of three groups, and its performance was evaluated. Since age differed significantly between AFD and the other groups, a general linear model was used to estimate age-adjusted differences in the four parameters (EFSR, MSR, RAS and AMYLI) between secondary causes (infiltrative/storage; CA + AFD) and HHT groups and between CA and AFD.
The potential for developing machine learning classifiers based solely on candidate variables easily measured from echocardiograms was explored. As proof of concept, a simple supervised learning classifier, linear discriminant analysis (LDA) (13–15) with stepwise variable selection, was used to estimate linear combinations of candidate variables, which best explained differences between CA, AFD and HHT. Leave-one-out cross-validation was used to estimate the diagnostic performance of LDA. A scatterplot of the second vs. first canonical discriminant function illustrates the separation of the groups. A separate LDA was performed in a subgroup of patients with mild–moderately increased wall thickness (MWT <16 mm).
Intraobserver and interobserver variability was performed for LV mass and strain measurements. Intraclass correlation coefficients were above 0.9 for all measurements demonstrating good reproducibility.
A total of 120 CA patients (62 AL and 58 ATTR), 31 AFD and 58 HHT patients comprised the study group. Table 1 presents clinical and echocardiographic parameters. All three groups had a male predominance, with no difference in sex distribution across groups. Patients with AFD were younger than those of other groups. HHT patients had higher blood pressure and body mass index (BMI). All AFD and HHT patients were in SR. A total of 23 CA patients were in AF/flutter and 1 in paced rhythm.
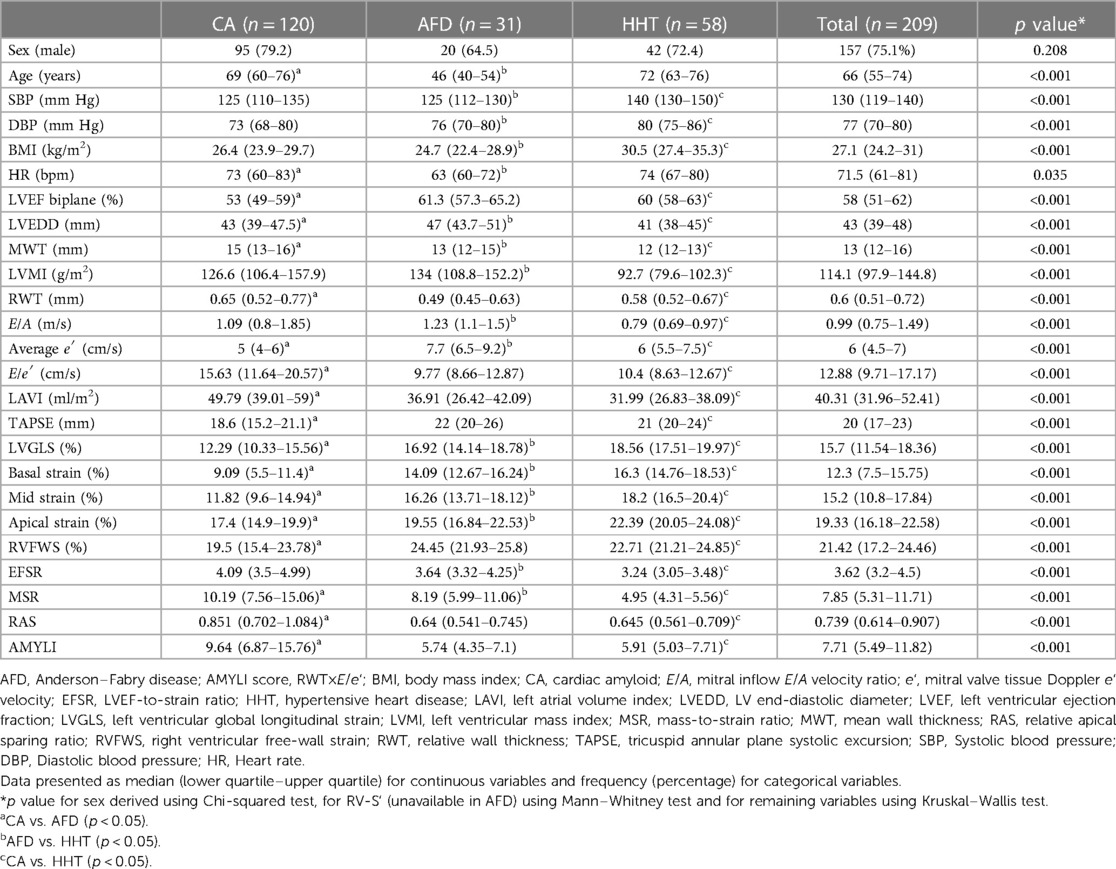
Table 1. Baseline characteristics and echocardiographic parameters in CA, AFD, and HHT patient groups.
With echocardiographic parameters, LVEF was lower in CA compared with both AFD and HHT, although the median LVEF for CA was low–normal (53%). LVMI was higher in both CA and AFD vs. HHT. MWT was highest in CA, whilst LVEDD was highest in AFD. Doppler measurements including average e′ and E/e′ were most impaired in CA and least impaired in AFD. LAVI was highest in CA. RV function measures (TAPSE, RVFWS) were lowest in CA and similar/preserved in AFD and HHT. LVGLS was lowest in CA followed by AFD, then HHT. This trend was also observed for segmental strain, predominantly basal strain, and RAS was highest in CA.
With derived parameters, EFSR was similar, whilst MSR differentiated CA and AFD (p = 0.058 and p = 0.044, respectively). Both EFSR and MSR differentiated the secondary causes (CA and AFD) vs. HHT (p < 0.001). RAS and AMYLI were comparable between AFD and HHT (0.530 and 0.379, respectively) but differentiated CA vs. AFD and HHT (p < 0.001 for both). The ROC-AUC of EFSR and MSR for secondary causes (CA and AFD) vs. HHT was 0.80 for EFSR and 0.91 for MSR, respectively (Figure 2). The sensitivity and specificity of EFSR ≥3.3 for detecting secondary causes (CA + AFD vs. HHT) were 80% (95% CI 72%–86%) and 59% (95% CI 45%–71%), respectively, and corresponding values for MSR ≥5.3 were 91% (95% CI 86%–95%) and 71% (95% CI 57%–82%). The ROC-AUC for MSR, RAS and AMYLI for CA vs. AFD were 0.79, 0.80 and 0.61, respectively (Figure 3). The sensitivity and specificity of RAS ≥0.74 (74%) for detecting CA (vs. AFD) were 71% (95% CI 62%–79%) and 74% (95% CI 55%–88%), and corresponding values for AMYLI ≥7.6 were 71% (95% CI 62%–79%) and 83% (95% CI 65%–94%).
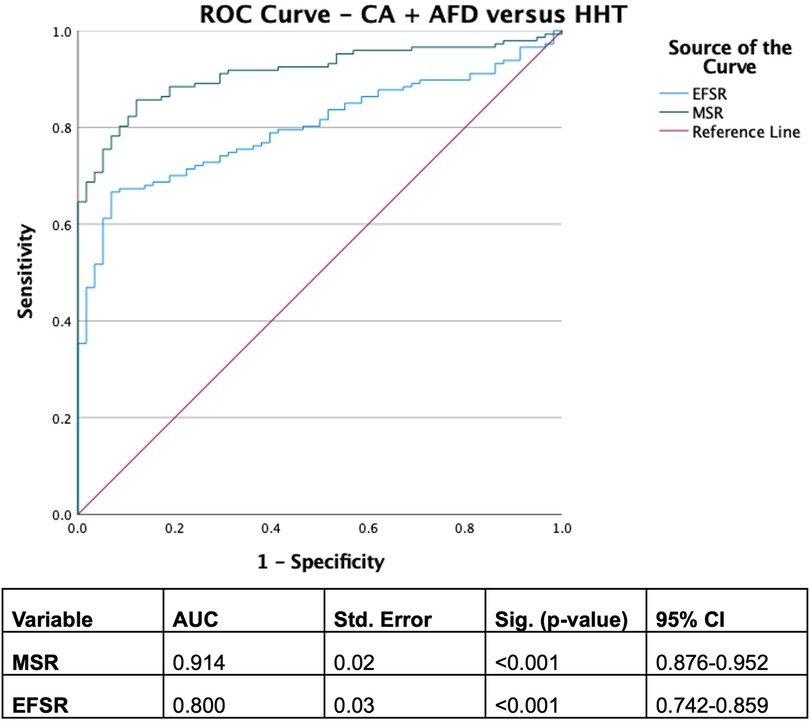
Figure 2. ROC curve for secondary infiltrative and storage aetiologies (cardiac amyloidosis and Anderson–Fabry disease) vs. hypertensive cardiomyopathy.
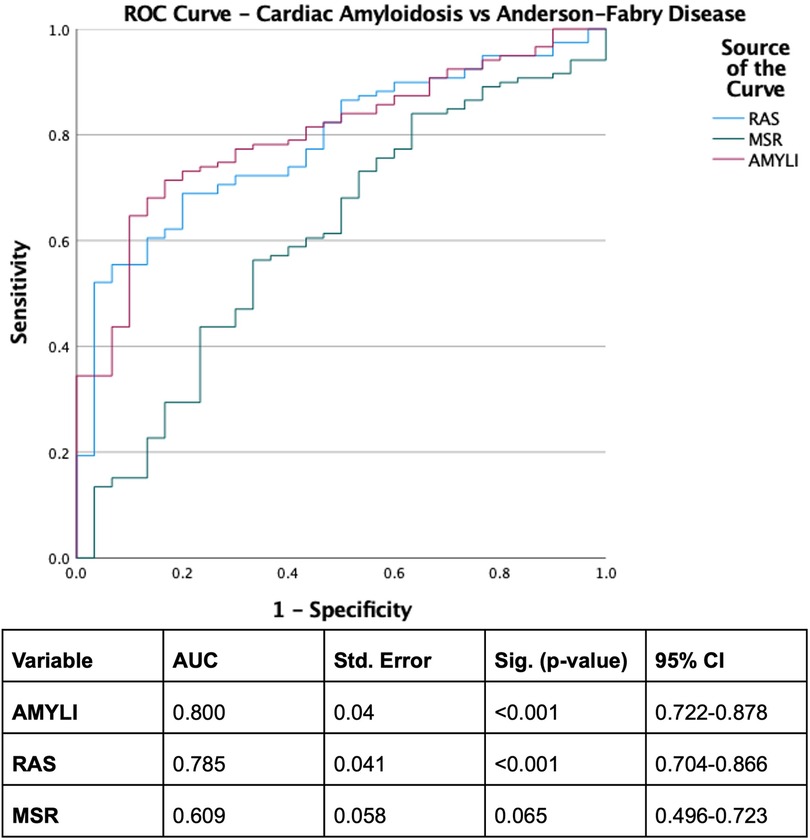
Figure 3. ROC curve for differentiating cardiac amyloidosis from Anderson–Fabry disease. AMYLI score, relative wall thickness × E/e′.
A two-step approach of MSR ≥5.3 and AMYLI ≥7.6 to differentiate CA, AFD and HHT was assessed. The predicted group for each case was determined by assignment to “predicted HHT” if MSR <5.3, “predicted CA” if MSR ≥5.3 and AMYLI ≥7.6 and “predicted AFD” if MSR ≥5.3 and AMYLI <7.6. Cross-tabulation compared the true group with the predicted group and accurately predicted 70% of all cases (69% CA, 77% AFD and 69% HHT).
After age adjustment, EFSR and MSR still differentiated secondary causes (CA + AFD) from HHT (p < 0.001 for both), and RAS and AMYLI differentiated CA from AFD (p < 0.05 for both) (Supplementary data).
Figure 4 illustrates the LDA results based solely on candidate variables easily measured from echocardiograms. The two canonical discriminant functions that best explained the differences between the three groups were linear combinations of LVMI, average e′, LVGLS and basal strain (Supplementary data). Leave-one-out cross-validation estimated that 79% of all cases were correctly classified (i.e., 78% CA, 70% AFD and 85% HHT), a 9% improvement on the two-step approach using MSR ≥5.3 status and AMYLI ≥7.6 status. These findings need validation in independent samples of patients.
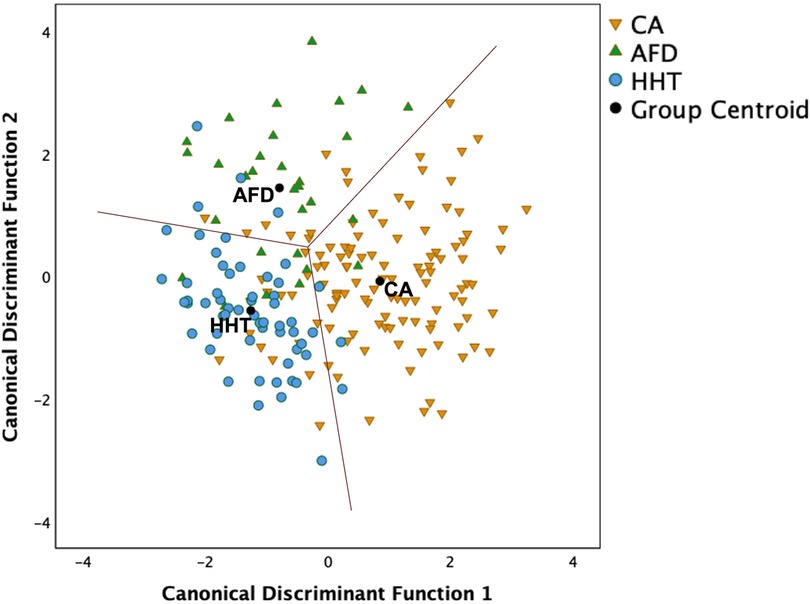
Figure 4. Scatterplot of two canonical discriminant functions (linear combinations of left ventricular mass index, average e′, left ventricular global longitudinal strain and basal strain) derived using linear discriminant analysis to differentiate the three groups. Overall, 78.6% of cases were correctly classified using leave-one-out cross-validation, comprising 78% CA, 70% AFD, and 85% HHT.
In the subgroup of patients with mild–moderately increased wall thickness (MWT <16 mm; 72 CA, 24 AFD and 58 HHT patients), RAS and AMYLI differentiated CA from AFD (p < 0.001) whilst EFSR and MSR differentiated AFD from HHT (p = 0.008 and p < 0.001, respectively) (Supplementary data). For secondary causes (CA + AFD) vs. HHT, the ROC-AUC was 0.72 for EFSR and 0.87 for MSR (Supplementary Figure S1). For CA vs. AFD, the ROC-AUC was 0.75 for RAS and 0.79 for AMYLI (Supplementary Figure S2). LDA of this subgroup (Supplementary Figure S3) demonstrated basal strain, LVMI and average e′ as candidates for inclusion in the final model. The model correctly predicted 79% of all subgroups on cross-validation (75% CA, 83% AFD and 83% HHT).
This study has several key findings. Firstly, we demonstrate that simple echocardiographic metrics differentiate “hypertrophic” phenotypes. MSR discriminated secondary (infiltrative and storage) causes (CA + AFD) from HHT (ROC-AUC 0.91; MSR ≥5.3 with 91% sensitivity, 71% specificity for CA + AFD), whilst the AMYLI score discriminated CA from AFD (ROC-AUC 0.80, with AMYLI ≥7.6 having 71% sensitivity and 83% specificity for CA). Secondly, we demonstrated that an LDA based on four echocardiographic measurements, i.e., basal strain, LVGLS, LVMI, and average e′, has a good discriminative ability. It accurately predicted the correct group for 79% of cases overall. A similar result for LDA was seen in the subset of early disease patients with mild–moderately increased wall thickness.
AFD patients were younger as this hereditary condition manifests earlier in life (16), whilst CA, particularly ATTR, occurs predominantly in the elderly (17). The male predominance of these conditions is recognised, particularly ATTR-CA, and AFD, which is X-linked (16, 18). However, the inherent underrepresentation of females in all cohorts may also be due to delays in diagnosis (19). BMI was higher in HHT, likely due to the relationship between obesity and hypertension (20).
With respect to echocardiographic parameters, LVMI was highest in CA and AFD. LV cavity size was higher in AFD compared with CA, and consequently, RWT was lowest in AFD. Small LV cavity size is a hallmark of advanced CA (21), but to our knowledge, there have been no reports of comparatively preserved LV cavities in AFD patients. The relatively preserved diastolic function markers (average e′ and E/e′) seen in AFD patients could partly be attributed to their younger age. Similarly, previous AFD studies have reported mild diastolic dysfunction, with only a small percentage of AFD patients demonstrating restrictive filling (22, 23). Left atrial volume was highest in CA patients and is a hallmark of the condition (24). This could be attributed to increased age, diastolic dysfunction, atrial fibrillation, and coexistent atrial myopathy from atrial amyloid deposition (25). Previous reports have shown that the left atrium (LA) size is smaller in AFD compared with HCM (26), and mild LA dilatation appears to be the characteristic phenotype of AFD.
LV systolic function by LVEF was slightly reduced in CA, whilst LVGLS (a more sensitive marker of LV dysfunction) was markedly reduced. Reduced LVGLS is also a marker of early AFD cardiomyopathy (27). Basal segmental strain in CA was markedly reduced compared with mid and apical strain, with a resultant high RAS, as reported previously (5, 28). Reduction in basal strain has been reported in AFD patients compared with healthy controls (22, 29) and was noted in our group with AFD vs. HHT. However, this was due to a reduction in overall LVGLS in AFD, with RAS being similar in both groups. Moreover, RV function (RVFWS and TAPSE) was also reduced in CA but relatively preserved in AFD (which was similar to HHT). Previous studies have demonstrated that patients with AFD have better RV function compared with those with CA, despite having similar levels of RV “hypertrophy” (30).
Using derived echocardiographic parameters, we distinguished infiltrative and storage causes (CA + AFD) from HHT (EFSR and MSR) and CA vs. AFD (RAS and AMYLI), with reasonable sensitivity and specificity. Whilst EFSR was shown to be a strong predictor of CA vs. HCM and hypertensive patients (6), our study demonstrated poor discrimination between CA and AFD (p = 0.058).
Both RAS and AMYLI demonstrated good diagnostic performance for CA. Whilst AMYLI was reported as having a good rule-out value, with a value <2.22 excluding CA diagnosis (8), we found reasonable sensitivity (71%) and specificity (83%) for a value ≥7.6 for differentiating CA from AFD. This is due to increased RWT (increased wall thickness with small cavity size) and increased filling pressures (E/e′), both of which are hallmarks of CA.
The LDA using LVMI, e′, LVGLS and basal strain demonstrated good predictive utility for the three groups. These parameters reflect diverse properties (LV structure, systolic and diastolic function) and are easily measured in routine clinical practice. LDA uses simple linear combinations of these measurements that can be calculated and used clinically to classify a new patient into the phenotype group whose centroid is closest (Euclidian distance). These calculations are easily automated and can be trained in machine learning models to improve classification. Other studies have demonstrated the utility of LDA in machine learning algorithms for medical diagnosis (31). Preliminary studies have demonstrated the utility of artificial intelligence in echocardiography for identifying CA and HCM (32, 33), but there are currently no data regarding its utility in AFD except using cardiac magnetic resonance imaging (34). Thus, we can implement our suggested LDA into echocardiographic software for automated screening.
In addition, we demonstrated good accuracy for LDA even in a subgroup of patients with mild–moderately increased wall thickness (MWT <16 mm). Pagourelias et al. (6) demonstrated the accuracy of EFSR in differentiating CA from HCM and HHT in a subgroup with milder “hypertrophy” (wall thickness 12–16 mm). In the subgroup, LDA correctly predicted a similar proportion of cases as that of the entire group (79%), suggesting that this model is robust even in early disease stages.
Infiltrative and storage aetiologies of cardiac “hypertrophy,” including CA and AFD, are often misdiagnosed or diagnosed late (1, 35), with inevitable treatment delays and increased morbidity. Specialised tests such as CMR or an invasive biopsy can significantly increase healthcare expenditure. Echocardiography, which is inexpensive and widely available, could expedite simple screening, facilitating prompt referral for specific diagnostic testing. As demonstrated, this can be achieved either with simple formulas (e.g., MSR or AMYLI) or with LDA, which can be integrated into echocardiographic software. A proposed clinical algorithm is demonstrated in the central illustration (Figure 5). Thus, the benefit of these techniques is in facilitating early diagnosis, whilst also rationalising downstream investigations. Notably, these echocardiographic algorithms should be utilised to complement clinical information (e.g., demographics, clinical history and examination findings and ECG data) and not as definitive diagnoses.
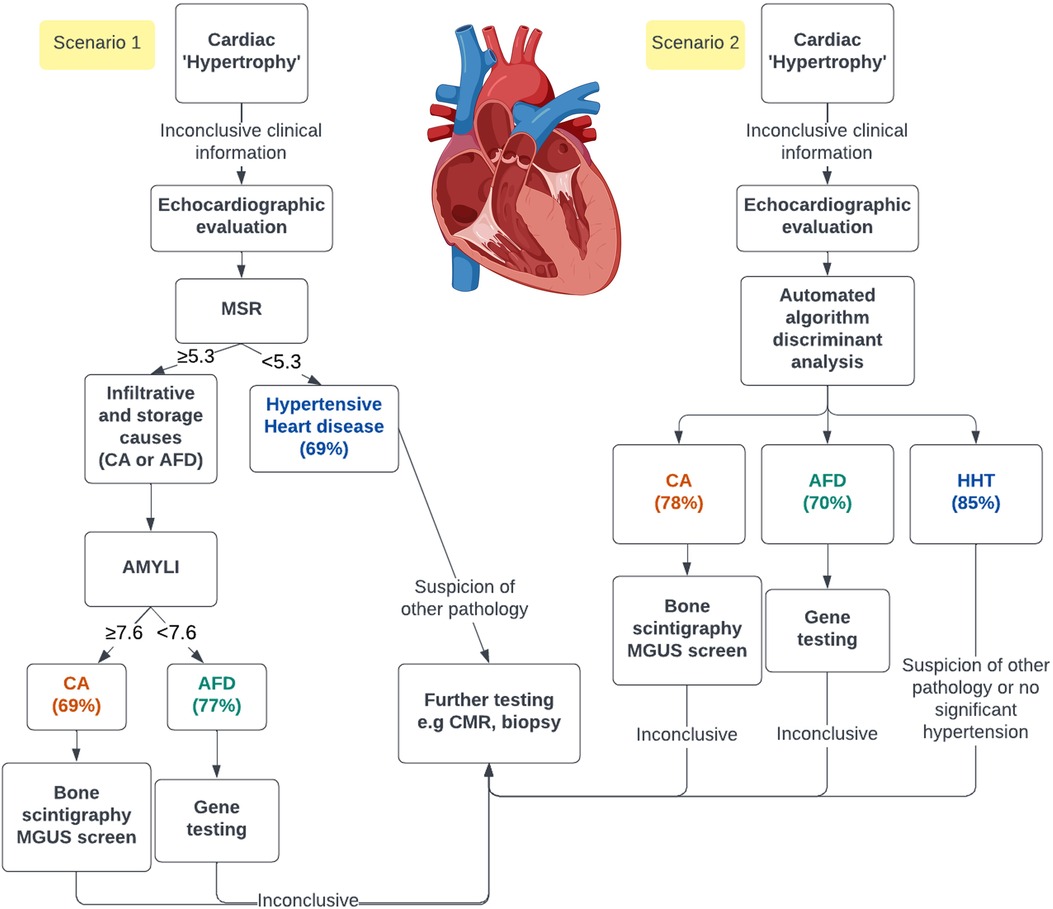
Figure 5. Central illustration. Demonstration of the opportunity of using either simple echocardiographic formulas (scenario 1) or a linear discriminant analysis in an automated algorithm (scenario 2) to screen patients with echocardiographic cardiac “hypertrophy.” The percentage predicted for each group using both methods is represented. AMYLI score, relative wall thickness × E/e′; MGUS, monoclonal gammopathy of uncertain significance.
This study was retrospective in nature, and an independent validation sample of patients from the three phenotypes of interest was not available. Some RV parameters were excluded, especially in the AFD patients with suboptimal RV views. However, we demonstrate that accurate phenotyping is possible utilising only LV parameters. We did not include a comparison with the IWT score (7) as it is a complex score. The proponents of the IWT subsequently developed the simplified AMYLI score evaluated in this study. We did not include HCM for comparison in this study as echocardiographic markers in HCM have been extensively studied before (5–7), and this study focused on CA and AFD. HHT patients had amyloidosis excluded based on clinical criteria and did not have bone scintigraphy. Thus, occult amyloidosis could not be excluded, although we feel this is unlikely as there remained good sensitivity differentiating HHT and secondary aetiologies with the above algorithms.
More specific echocardiographic measurements, including LA strain and regional strain (e.g., LV posterolateral strain), which have shown some utility in CA (36) and AFD (37), were not explored in this study as they are complex to perform, and we sought to incorporate simple measurements and formulae for clinical utility. Another inherent limitation is the vendor dependency of strain analysis, particularly in the case of GE EchoPAC (used in this study), which is vendor-specific. However, recent studies have demonstrated good agreement between vendor-independent and vendor-specific software for LV global longitudinal strain (38). Whilst electrocardiogram data (e.g., low voltage) are useful in these conditions, their use in screening tools is limited by low sensitivity (39). Thus, this was not analysed for inclusion in our algorithms. Moreover, the benefit of echocardiographic algorithms is that they can be potentially incorporated directly into echocardiographic software for automated screening. Finally, we did not incorporate biochemical markers (troponin, NT-proBNP) because the assays differed across time points and sites, reflecting real-life practice.
Simple echocardiographic measurements differentiate cardiac “hypertrophic” phenotypes, namely, amyloid, Anderson–Fabry and hypertensive heart diseases. We demonstrate that LDA, comprising simple parameters, is effective in accurately differentiating groups. The findings suggest that LDA or other supervised learning classifiers have the potential to be used in automated echocardiographic machine learning algorithms as screening tools. Such an approach would facilitate the early identification of “hypertrophic” phenotypes, guiding downstream confirmatory testing.
The raw data supporting the conclusions of this article will be made available by the authors, without undue reservation.
The Western Sydney Local Health District Human Research Ethics Committee and Metro South Human Research Ethics Committee reviewed and approved the studies involving human participants. Written informed consent for participation was not required for this study in accordance with the national legislation and the institutional requirements.
AF and LT designed the study. AF, CJ, and LS performed echocardiographic measurements. AN and LT provided supervision. AF performed statistical analysis with the assistance of KB. AF wrote the draft manuscript. All authors critically reviewed and provided feedback on the final manuscript. All authors contributed to the article and approved the submitted version.
AF was supported by the University of Sydney Faculty of Medicine and Health Executive Dean Stipend Scholarship.
The central illustration (Figure 5) was created with elements from biorender.com.
The authors declare that the research was conducted in the absence of any commercial or financial relationships that could be construed as a potential conflict of interest.
All claims expressed in this article are solely those of the authors and do not necessarily represent those of their affiliated organizations, or those of the publisher, the editors and the reviewers. Any product that may be evaluated in this article, or claim that may be made by its manufacturer, is not guaranteed or endorsed by the publisher.
The Supplementary Material for this article can be found online at https://www.frontiersin.org/articles/10.3389/fcvm.2023.1183485/full#supplementary-material
AFD, Anderson–Fabry disease; AL, light-chain; AMYLI, amyloidosis index (relative wall thickness ×
1. Rozenbaum MH, Large S, Bhambri R, Stewart M, Whelan J, van Doornewaard A, et al. Impact of delayed diagnosis and misdiagnosis for patients with transthyretin amyloid cardiomyopathy (ATTR-CM): a targeted literature review. Cardiol Ther. (2021) 10(1):141–59. doi: 10.1007/s40119-021-00219-5
2. Khan T, Selvakumar D, Trivedi S, Rao K, Harapoz M, Thiagalingam A, et al. The value of endomyocardial biopsy in diagnosis and guiding therapy. Pathology. (2017) 49(7):750–6. doi: 10.1016/j.pathol.2017.08.004
3. Gillmore JD, Maurer MS, Falk RH, Merlini G, Damy T, Dispenzieri A, et al. Nonbiopsy diagnosis of cardiac transthyretin amyloidosis. Circulation. (2016) 133(24):2404–12. doi: 10.1161/CIRCULATIONAHA.116.021612
4. Haaf P, Garg P, Messroghli DR, Broadbent DA, Greenwood JP, Plein S. Cardiac T1 mapping and extracellular volume (ECV) in clinical practice: a comprehensive review. J Cardiovasc Magn Reson. (2016) 18(1):89. doi: 10.1186/s12968-016-0308-4
5. Phelan D, Collier P, Thavendiranathan P, Popović ZB, Hanna M, Plana JC, et al. Relative apical sparing of longitudinal strain using two-dimensional speckle-tracking echocardiography is both sensitive and specific for the diagnosis of cardiac amyloidosis. Heart. (2012) 98(19):1442–8. doi: 10.1136/heartjnl-2012-302353
6. Pagourelias ED, Mirea O, Duchenne J, Van Cleemput J, Delforge M, Bogaert J, et al. Echo parameters for differential diagnosis in cardiac amyloidosis: a head-to-head comparison of deformation and nondeformation parameters. Circ Cardiovasc Imaging. (2017) 10(3):e005588. doi: 10.1161/CIRCIMAGING.116.005588
7. Boldrini M, Cappelli F, Chacko L, Restrepo-Cordoba MA, Lopez-Sainz A, Giannoni A, et al. Multiparametric echocardiography scores for the diagnosis of cardiac amyloidosis. JACC Cardiovasc Imaging. (2020) 13(4):909–20. doi: 10.1016/j.jcmg.2019.10.011
8. Aimo A, Chubuchny V, Vergaro G, Barison A, Nicol M, Cohen-Solal A, et al. A simple echocardiographic score to rule out cardiac amyloidosis. Eur J Clin Invest. (2021) 51(5):e13449. doi: 10.1111/eci.13449
9. Geenty P, Sivapathan S, Stefani Luke D, Boyd A, Richards D, Kwok F, et al. Left ventricular mass-to-strain ratio predicts cardiac amyloid subtype. JACC Cardiovasc Imaging. (2021) 14(3):690–2. doi: 10.1016/j.jcmg.2020.08.035
10. Glaudemans AW, van Rheenen RW, van den Berg MP, Noordzij W, Koole M, Blokzijl H, et al. Bone scintigraphy with (99 m)technetium-hydroxymethylene diphosphonate allows early diagnosis of cardiac involvement in patients with transthyretin-derived systemic amyloidosis. Amyloid. (2014) 21(1):35–44. doi: 10.3109/13506129.2013.871250
11. Grogan M, Dispenzieri A, Gertz MA. Light-chain cardiac amyloidosis: strategies to promote early diagnosis and cardiac response. Heart. (2017) 103(14):1065–72. doi: 10.1136/heartjnl-2016-310704
12. Lang RM, Badano LP, Mor-Avi V, Afilalo J, Armstrong A, Ernande L, et al. Recommendations for cardiac chamber quantification by echocardiography in adults: an update from the American Society of Echocardiography and the European Association of Cardiovascular Imaging. Eur Heart J Cardiovasc Imaging. (2015) 16(3):233–71. doi: 10.1093/ehjci/jev014
13. Fisher RA. The use of multiple measurements in taxonomic problems. Ann Eugen. (1936) 7(2):179–88. doi: 10.1111/j.1469-1809.1936.tb02137.x
14. Hastie T, Tibshirani R, Friedman J. The elements of statistical learning. New York: Springer-Verlag (2001).
16. O'Mahony C, Elliott P. Anderson-Fabry disease and the heart. Prog Cardiovasc Dis. (2010) 52(4):326–35. doi: 10.1016/j.pcad.2009.11.002
17. Brunjes DL, Castano A, Clemons A, Rubin J, Maurer MS. Transthyretin cardiac amyloidosis in older Americans. J Card Fail. (2016) 22(12):996–1003. doi: 10.1016/j.cardfail.2016.10.008
18. Martinez-Naharro A, Hawkins PN, Fontana M. Cardiac amyloidosis. Clin Med (Lond). (2018) 18(Suppl. 2):s30–5. doi: 10.7861/clinmedicine.18-2-s30
19. Sandhu AT, Tisdale RL, Rodriguez F, Stafford RS, Maron DJ, Hernandez-Boussard T, et al. Disparity in the setting of incident heart failure diagnosis. Circ Heart Fail. (2021) 14(8):e008538. doi: 10.1161/CIRCHEARTFAILURE.121.008538
20. Jiang S-Z, Lu W, Zong X-F, Ruan H-Y, Liu Y. Obesity and hypertension. Exp Ther Med. (2016) 12(4):2395–9. doi: 10.3892/etm.2016.3667
21. Seward JB, Casaclang-Verzosa G. Infiltrative cardiovascular diseases: cardiomyopathies that look alike. J Am Coll Cardiol. (2010) 55(17):1769–79. doi: 10.1016/j.jacc.2009.12.040
22. Esposito R, Santoro C, Mandoli GE, Cuomo V, Sorrentino R, La Mura L, et al. Cardiac imaging in Anderson-Fabry disease: past, present and future. J Clin Med. (2021) 10(9):1994. doi: 10.3390/jcm10091994
23. Palecek T, Linhart A, Lubanda JC, Magage S, Karetova D, Bultas J, et al. Early diastolic mitral annular velocity and color M-mode flow propagation velocity in the evaluation of left ventricular diastolic function in patients with Fabry disease. Heart Vessels. (2006) 21(1):13–9. doi: 10.1007/s00380-005-0852-6
24. Fitzgerald BT, Scalia GM, Cain PA, Garcia MJ, Thomas JD. Left atrial size—another differentiator for cardiac amyloidosis. Heart Lung Circ. (2011) 20(9):574–8. doi: 10.1016/j.hlc.2011.06.002
25. Ballantyne B, Manian U, Sheyin O, Davey R, De S. Stroke risk and atrial mechanical dysfunction in cardiac amyloidosis. ESC Heart Fail. (2020) 7(2):705–7. doi: 10.1002/ehf2.12602
26. Saccheri MC, Cianciulli TF, Challapa Licidio W, Lax JA, Beck MA, Morita LA, et al. Comparison of left atrial size and function in hypertrophic cardiomyopathy and in Fabry disease with left ventricular hypertrophy. Echocardiography. (2018) 35(5):643–50. doi: 10.1111/echo.13829
27. Lu DY, Huang WM, Wang WT, Hung SC, Sung SH, Chen CH, et al. Reduced global longitudinal strain as a marker for early detection of Fabry cardiomyopathy. Eur Heart J Cardiovasc Imaging. (2022) 23(4):487–95. doi: 10.1093/ehjci/jeab214
28. Nakao Y, Saito M, Inoue K, Higaki R, Yokomoto Y, Ogimoto A, et al. Cardiac amyloidosis screening using a relative apical sparing pattern in patients with left ventricular hypertrophy. Cardiovasc Ultrasound. (2021) 19(1):30. doi: 10.1186/s12947-021-00258-x
29. Zada M, Lo Q, Trivedi SJ, Harapoz M, Boyd AC, Devine K, et al. Electrocardiographic characteristics and their correlation with echocardiographic alterations in Fabry disease. J Cardiovasc Dev Dis. (2022) 9(1):11. doi: 10.3390/jcdd9010011
30. Graziani F, Laurito M, Pieroni M, Pennestrì F, Lanza GA, Coluccia V, et al. Right ventricular hypertrophy, systolic function, and disease severity in Anderson-Fabry disease: an echocardiographic study. J Am Soc Echocardiogr. (2017) 30(3):282–91. doi: 10.1016/j.echo.2016.11.014
31. Perfecto-Avalos Y, Garcia-Gonzalez A, Hernandez-Reynoso A, Sánchez-Ante G, Ortiz-Hidalgo C, Scott S-P, et al. Discriminant analysis and machine learning approach for evaluating and improving the performance of immunohistochemical algorithms for COO classification of DLBCL. J Transl Med. (2019) 17(1):198. doi: 10.1186/s12967-019-1951-y
32. Duffy G, Cheng PP, Yuan N, He B, Kwan AC, Shun-Shin MJ, et al. High-throughput precision phenotyping of left ventricular hypertrophy with cardiovascular deep learning. JAMA Cardiol. (2022) 7(4):386–95. doi: 10.1001/jamacardio.2021.6059
33. Goto S, Mahara K, Beussink-Nelson L, Ikura H, Katsumata Y, Endo J, et al. Artificial intelligence-enabled fully automated detection of cardiac amyloidosis using electrocardiograms and echocardiograms. Nat Commun. (2021) 12(1):2726. doi: 10.1038/s41467-021-22877-8
34. Satriano A, Afzal Y, Sarim Afzal M, Fatehi Hassanabad A, Wu C, Dykstra S, et al. Neural-network-based diagnosis using 3-dimensional myocardial architecture and deformation: demonstration for the differentiation of hypertrophic cardiomyopathy. Front Cardiovasc Med. (2020) 7:584727. doi: 10.3389/fcvm.2020.584727
35. Monserrat L, Gimeno-Blanes JR, Marín F, Hermida-Prieto M, García-Honrubia A, Pérez I, et al. Prevalence of Fabry disease in a cohort of 508 unrelated patients with hypertrophic cardiomyopathy. J Am Coll Cardiol. (2007) 50(25):2399–403. doi: 10.1016/j.jacc.2007.06.062
36. Brand A, Frumkin D, Hübscher A, Dreger H, Stangl K, Baldenhofer G, et al. Phasic left atrial strain analysis to discriminate cardiac amyloidosis in patients with unclear thick heart pathology. Eur Heart J Cardiovasc Imaging. (2021) 22(6):680–7. doi: 10.1093/ehjci/jeaa043
37. Frumkin D, Mattig I, Laule N, Al Daas M, Canaan-Kühl S, Knebel F, et al. Comparative analysis of phasic left atrial strain and left ventricular posterolateral strain pattern to discriminate Fabry cardiomyopathy from other forms of left ventricular hypertrophy. Echocardiography. (2021) 38(11):1870–8. doi: 10.1111/echo.15224
38. Chamberlain R, Shiino K, Scalia GM, Sabapathy S, Chan J. Advantage and validation of vendor-independent software for myocardial strain analysis compared to vendor-specific software. Australas J Ultrasound Med. (2021) 24(1):48–57. doi: 10.1002/ajum.12229
Keywords: cardiac amyloidosis, Fabry disease, cardiac hypertrophy, infiltrative cardiomyopathies, echocardiography, strain imaging
Citation: Ferkh A, Tjahjadi C, Stefani L, Geenty P, Byth K, De Silva K, Boyd AC, Richards D, Mollee P, Korczyk D, Taylor MS, Kwok F, Kizana E, Ng ACT and Thomas L (2023) Cardiac “hypertrophy” phenotyping: differentiating aetiologies with increased left ventricular wall thickness on echocardiography. Front. Cardiovasc. Med. 10:1183485. doi: 10.3389/fcvm.2023.1183485
Received: 10 March 2023; Accepted: 15 June 2023;
Published: 3 July 2023.
Edited by:
Concetta Zito, University of Messina, ItalyReviewed by:
Anna Brand, Deutsches Herzzentrum der Charité, Germany© 2023 Ferkh, Tjahjadi, Stefani, Geenty, Byth, De Silva, Boyd, Richards, Mollee, Korczyk, Taylor, Kwok, Kizana, Ng and Thomas. This is an open-access article distributed under the terms of the Creative Commons Attribution License (CC BY). The use, distribution or reproduction in other forums is permitted, provided the original author(s) and the copyright owner(s) are credited and that the original publication in this journal is cited, in accordance with accepted academic practice. No use, distribution or reproduction is permitted which does not comply with these terms.
*Correspondence: Liza Thomas bGl6YS50aG9tYXNAc3lkbmV5LmVkdS5hdQ==
Disclaimer: All claims expressed in this article are solely those of the authors and do not necessarily represent those of their affiliated organizations, or those of the publisher, the editors and the reviewers. Any product that may be evaluated in this article or claim that may be made by its manufacturer is not guaranteed or endorsed by the publisher.
Research integrity at Frontiers
Learn more about the work of our research integrity team to safeguard the quality of each article we publish.