- 1Academy of Medical Engineering and Translational Medicine, Tianjin University, Tianjin, China
- 2Tianjin Huanhu Hospital, China
- 3Institute of Biomedical Engineering, Chinese Academy of Medical Sciences and Peking Union Medical College, Tianjin, China
- 4School of Medical Science and Engineering, Tianjin University, Tianjin, China
Objective: In this study, we aimed to investigate the classification of symptomatic plaques by evaluating the models generated via two different approaches, a radiomics-based machine learning (ML) approach, and an end-to-end learning approach which utilized deep learning (DL) techniques with several representative model frameworks.
Methods: We collected high-resolution magnetic resonance imaging (HRMRI) data from 104 patients with carotid artery stenosis, who were diagnosed with either symptomatic plaques (SPs) or asymptomatic plaques (ASPs), in two medical centers. 74 patients were diagnosed with SPs and 30 patients were ASPs. Sampling Perfection with Application-optimized Contrasts (SPACE) by using different flip angle Evolutions was used for MRI imaging. Repeated stratified five-fold cross-validation was used to evaluate the accuracy and receiver operating characteristic (ROC) of the trained classifier. The two proposed approaches were investigated to train the models separately. The difference in the model performance of the two proposed methods was quantitatively evaluated to find a better model to differentiate between SPs and ASPs.
Results: 3D-SE-Densenet-121 model showed the best performance among all prediction models (AUC, accuracy, precision, sensitivity, and F1-score of 0.9300, 0.9308, 0.9008, 0.8588, and 0.8614, respectively), which were 0.0689, 0.1119, 0.1043, 0.0805, and 0.1089 higher than the best radiomics-based ML model (MLP). Decision curve analysis showed that the 3D-SE-Densenet-121 model delivered more net benefit than the best radiomics-based ML model (MLP) with a wider threshold probability.
Conclusion: The DL models were able to accurately differentiate between symptomatic and asymptomatic carotid plaques with limited data, which outperformed radiomics-based ML models in identifying symptomatic plaques.
1. Introduction
Many recent studies have shown that vulnerable plaques are generally associated with a high risk of cerebral infarction, and the identification of vulnerable plaques by assessing plaque components is becoming increasingly crucial (1). Characteristic plaque components, such as intraplaque hemorrhage (IPH) and lipid-rich necrotic core (LRNC), are highly associated with ischemic cerebrovascular events and are usually referred to as SPs (2). Early identification of SPs may facilitate prognosis and thereby mitigate adverse outcomes of ischemic cerebrovascular events. In the literature, CT and ultrasound-based texture analysis of plaques has been used to differentiate SPs from ASPs (3). Compared to CT and ultrasound, 3D-HRMRI has a good resolution in soft tissue, and the combination of multiple contrast levels provides more valuable information in clinical practice. Recently, many researchers have introduced ML based technologies to process high dimensional data from HRMRI. Le et al. (4) found that 3D imaging models have better robustness and predictive accuracy than 2D imaging models. HRMRI can accurately identify the composition of plaques; however, the small size of plaques and the lack of histological validation make clinical application challenging (5, 6). Evaluation of plaque characteristics in symptomatic patients showed that fibrous cap thickness, the presence of IPH, and the size of an LRNC can be imaging biomarkers of ischemic events (7). However, images contain much more information than can be visualized or quantified by simple manual measurements.
Recently, the emergence of HRMRI acquisition and artificial intelligence technologies provides opportunities to transform HRMRI image information into quantitatively mineable data. One of the key risk factors for stroke is plaque stability, and many studies have focused on the non-invasive identification of symptomatic plaques to guide treatment strategies (8). The identification of imaging features of SPs via visual assessment of radiology professionals is the most intuitive, but it requires years of professional training and is partially subjective. In the study reported by Chen et al. (7), the AI model (p = 0.0003) performed better than visual assessment model (p = 0.021). Researchers prefer to build AI models because they offer several advantages over traditional methods. These models can evaluate large amounts of data quickly and accurately, automate tedious tasks, reduce the potential for human error, and provide objective insights.
Radiomics-based image analysis is proposed to extract and analyze a large number of quantitative features from regions of interest (ROIs), which are believed to reflect the imaging phenotype of carotid plaques. Radiomics-based ML models are an important tool for differentiating SPs from ASPs (9, 10). Combining radiomics analysis with classical ML and integrated learning algorithms is an emerging technology.
However, high-throughput radiomics analysis is limited by the manual delineation of carotid plaque boundaries, which is time-consuming and poorly reproducible in creating ROIs. DL algorithms are considered to be more advanced ML techniques and are used in many research areas. DL is based on various artificial neural networks that learn effective features from image data without delineating carotid plaque boundaries, which can greatly reduce the time for HRMRI image pre-processing (11). For image analysis, DL technologies have proven to be effective in disease classification as well as localization and segmentation of lesions, and these techniques have shown superior accuracy and efficiency in diagnostic and image analysis tasks compared to traditional methods (12).
The accurate recognition of carotid plaques using deep learning is challenged by limitations in the dataset, overfitting, and redundant computations. To optimize feature extraction and reduce unnecessary computations, we chose DenseNet, which has a unique connectivity pattern that effectively mitigates gradient disappearance. Additionally, SENet enhances the relevant feature channels while suppressing the less useful ones, enabling adaptive recalibration and improving accuracy. We integrated SENet (13) with DenseNet to extract useful information and achieve high accuracy in recognizing carotid plaques.
The purpose of this study was to investigate the feasibility of discriminate SPs and ASPs based on MRI images. The discrimination models were generated through two approaches in this paper, a radiomics-based ML and an end-to-end DL approach.
2. Materials and methods
The overall process pipelines were summarized in Figure 1.
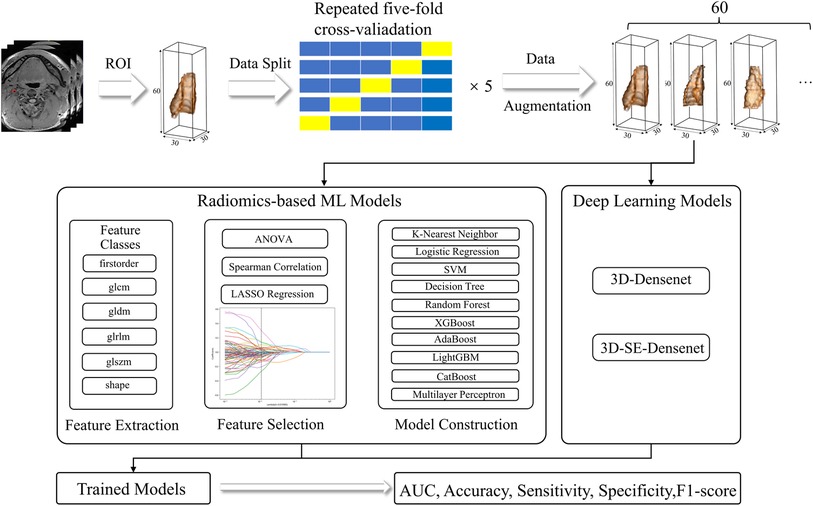
Figure 1. Radiomics and DL pipelines. The two approaches were developed separately, and the performance was evaluated based on AUC, accuracy, sensitivity, specificity, and F1-score.
2.1. Participant recruitment
This study was conducted in accordance with the Declaration of Helsinki and ethics approval was obtained from the local institutional ethics review board. HRMRI data of 195 patients with carotid plaques were collected in Tianjin Huanhu Hospital and Tianjin First Central Hospital from December 2016 to April 2021. Participants provided informed written consent for retrospective data analysis. The principles for the inclusion and exclusion criteria were set in accordance with the literature (7).
Inclusion criteria were set as (a) Patients had an acute ischemic stroke within the past 7 days, whose corresponding unilateral infarction was confined to a single carotid region as defined by diffusion-weighted imaging (14); (b) Patients with symptom duration ≤24 h met the WHO definition of transient ischemic attack but had documented acute ischemic infarction; (c) carotid lumen stenosis >30% (15).
Exclusion criteria were set as (a) patients with ≥70% carotid stenosis; (b) cardiogenic stroke; (c) patients with bilateral infarcts or clinical signs due to bilateral carotid plaques; and (d) other causes, such as MRI images missing some slice data. 91 patients were excluded from the study.
Ischemic stroke can be caused by both the characteristics of carotid plaque and degree of stenosis. In patients with less than 30% carotid stenosis, the carotid plaque is small and still in the formation stage, which is not likely related to the current ischemia status of the participant. Embolism in patients who have had an ischemic stroke may be originated from an embolus elsewhere in the body other than carotid. Therefore, patients with less than 30% carotid stenosis should be excluded to prevent interference from other factors (15). On the other hand, patients with carotid artery stenosis greater than 70% may experience ischemic stroke due to insufficient blood supply, rather than the characteristics of the carotid plaque. Therefore, patients with carotid artery stenosis greater than 70% should also be excluded in this study (16). Therefore, in this study, we sought to establish a quantitative imaging biomarker to identify SPs and ASPs in 30%–70% carotid stenosis.
All patients were divided into SPs and ASPs groups. The detailed criteria for the diagnosis of SPs are: patients with regions of ADC <620 × 10−6 mm2/s (CST-ADC) (17) or Tmax >6 s mismatch volume (penumbra volume–infarct volume) of 15 ml or more (18). The rest of the carotid plaque is ASPs.
Finally, we utilized high-resolution magnetic resonance imaging (HRMRI) data from 104 patients with carotid artery stenosis, who were diagnosed with either symptomatic plaques (SPs) or asymptomatic plaques (ASPs), in two medical centers. 74 patients were diagnosed with SPs and 30 patients were ASPs.
In our study, we focused on patients with 30%–70% carotid artery stenosis. Previous studies have shown that the stroke risk is consistently 2–3 times higher for 70%–99% distal stenosis compared to 50%–69% stenosis. Compared to 70%–99% stenosis, 50%–69% stenosis is not a high risk and major factor for SPs (16). In contrast, in patients with <30% carotid stenosis, ischemic stroke may not originate from symptomatic plaque in the carotid artery. Therefore, we sought to establish a quantitative imaging biomarker to identify SPs and ASPs in 30%–70% carotid stenosis.
2.2. Data split
In order to address the limitation of a small sample size, we performed a repeated stratified five-fold cross-validation approach. This was done five times to ensure robustness of the results and obtain more reliable mean and standard values for the classification metrics. This approach was applied to both machine learning and deep learning methods in our study.
2.3. Magnetic resonance imaging data
The MRI imaging equipment of Tianjin Huanhu Hospital and Tianjin I Central Hospital are of the same type. All imaging data were acquired from two 3-T MRI systems (MAGNETOM Prisma, Siemens Healthcare, Erlangen Germany) with a 64-channel integrated head/neck coil. The imaging protocol included SPACE, DWI, and DSC-PWI. For the SPACE sequencing, the repetition time was set to 700 ms, the echo time was 12 ms, and the slice thickness was 1.0 mm. DWI images were acquired using a spin-echo type echo-planar (SE-EPI) sequence with b values as 0 and 1,000 s/mm2. In addition, apparent diffusion coefficient (ADC) maps were calculated from the diffusion scan raw data in a pixel-by-pixel manner. For the parameters of DWI, the repetition time was set to 2,900 ms; the echo time was set to 73 ms, the field of view was set to 240 × 240 mm2, the size of the matrix was set to 168 × 134, the number of the slice was set to 19, slice thickness was set to 5 mm, acquisition time was set to 23 s. For DSC-PWI (TR = 1,500 ms, TE = 30 ms, FOV = 22 cm, matrix = 128 × 128, 19 × 5 mm slices, total scan time = 1 min 38 s), gradient-echo planar imaging was performed during the passage of 0.1 mmol/kg of gadolinium-based contrast agent (Magnevist; Schering, Berlin, Germany) administered at a rate of 3 ml/sec. For each MRI image section, 50 temporal measurements were acquired for DCS-PWI analysis.
Valid MRI scanning images from 104 patients with carotid stenosis were included in this paper.
2.4. Radiomic-based ML as assessment model
2.4.1. Plaque segmentation, data processing and feature extraction
Two board-certified radiologists were invited to analyze all images, with eight and five years of imaging experience in clinical practice. ROIs were obtained by manually segmenting SPACE images using 3D-Slicer (version 5.0.3). The segmentation label of each image is fulfilled by one radiologist and checked by the other.
Due to the limited amount of training data in our dataset, volumentations (19) techniques including “Random Rotation”, “Random Flip”, “Gaussian Blur”, “Gaussian Noise” and four combinations of static data augumentations were used to expand the dataset to sixty times the original dataset, which could also help the model to focus on task-related features (20). The augmented data were used as train data only and were not used in the model testing. Radiomics features were extracted using the pyradiomics (21) feature package based on Anaconda Prompt (version 4.2.0), according to the Image Biomarker Standardization Initiative (IBSI) feature guidelines. All images were co-registered, normalized, interpolated, and resampled to 1 × 1 × 1 mm3 resolution prior to radiomics extraction. First-order features (e.g., energy, entropy and mean), shape features (e.g., sphericity, surface area, voxel volume, etc.), gray level cooccurrence matrix (GLCM), gray level run length matrix (GLRLM), gray level size zone matrix (GLSZM) and gray level dependence matrix (GLDM) of original images and filtered images were extracted by pyradiomics.
2.4.2. Radiomic feature selection
We chose four methods to select radiomics features. One method did not involve feature selection, while the other three methods used feature selection. The three methods were LASSO, ANOVA_LASSO, and ANOVA_spearman_LASSO. LASSO employed only the LASSO feature screening method, while ANOVA_LASSO used the ANOVA feature selection method first, followed by the LASSO feature screening method. ANOVA_spearman_LASSO utilized the ANOVA feature screening method first, followed by the spearman correlation coefficient screening, and finally, LASSO for feature selection.
In this paper, we present ANOVA_spearman_LASSO as an example and provide technical details for its three steps. Other feature selection methods follow the same pattern. Firstly, we calculated the ANOVA (One Way Analysis of Variance) p-values between labels and features in the classification task and removed features with p > 0.05. In this step, we followed the first step of radiomics features selection in Yang et al.’s paper (22). Secondly, to construct radiomics features, similar features with high correlation were rejected using Spearman's correlation analysis. Feature pairs with a Spearman's correlation coefficient greater than 0.9 were considered highly correlated features, and only one type of feature was used in the feature engineering. Finally, the Least Absolute Shrinkage and Selection Operator (LASSO) method (23) was used to select the features with non-zero coefficients from the primary dataset. The features selected by LASSO were normalized using the Z scores in the training and validatation datasets.
2.4.3. Radiomics-based ML approach as assessment model
The radiomics-based ML approach used nine classic ML models: K-Nearest Neighbor (KNN), Logistic Regression (LR), Support Vector Machines (SVM), Decision Tree (DT), Random Forest (RF), XGBoost, AdaBoost, LightGBM, CatBoost, Multilayer Perceptron (MLP). These algorithms were implemented using Scikit-learn, an open-source Python ML library (24). In order to obtain optimal hyperparameters, grid search optimization with repeated stratified five-fold cross-validation was used to fine-tune the models to reduce bias due to model overfitting. The hyperparameters with the highest average AUC score during the five-fold cross-validation were considered the best model for this particular round of five-fold cross-validation analysis. The five-fold cross-validation returns with only one set of optimal hyperparameters. Five repetitions of five-fold cross-validation result with five different configurations of data segmentation. Therefore, there are five different sets of hyperparameters for the repeated five-fold cross-validation. The range of hyperparameters to find using the grid search method and its description can be found in the Supplementary S2. Similar technologies were also used in the following analysis to evaluate the models generated via the Deep Learning approach.
2.5. Deep learning approach as assessment model
DL techniques, especially convolution neural networks, have demonstrated outstanding performance in diagnostic and image analysis tasks (25). In contrast to traditional ML methods, they do not require quantification and selection of radiological features, as they are trained directly on the image in an end-to-end paradigm. In this study, two different network architectures were trained and evaluated, including 3D-DenseNet (26) and 3D-SE-DenseNet (13).
The three-dimensional rectangles are padded from the ROI annotation. After assessing the general size range of carotid arteries, we determined a 3D rectangular cube with a size of 30 × 30 × 60 pixels.
The multilayer perceptron, 3D-DenseNet and 3D-SE-DenseNet choose the same optimiser and share the same set of hyperparameters. A stochastic gradient descent (SGD) optimizer was used to minimize the cross-entropy loss between the model output and the target classification labels. A weighted random sampler was used to overcome the sample imbalance problem in this study. We utilized the same static data augmentation method as the previously mentioned radiomics-based machine learning method. In deep learning, a grid search method is used to find the best learning rate and batch size parameters for optimal performance. The range of hyperparameters in deep learning methods can be found in the Supplementary S2. We stopped training after 500 epochs. A repeated stratified five-fold cross-validation technique was used and the model with the optimal stratified cross-validation evaluation metric was obtained using the same hyperparameters. The classification performance of all two network architectures was tested in the same way. We evaluated the DL models by accuracy, precision, recall, F1 score, and area under the curve (AUC). A decision curve analysis was conducted to further assess the classification models.
2.5.1. DenseNet
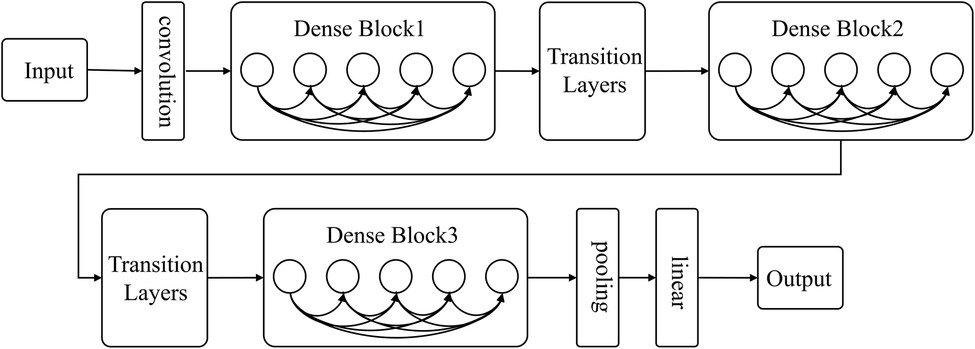
As deep learning networks get deeper, the issue of gradient disappearance becomes increasingly apparent. This is where DenseNet comes in, improving on other networks by reducing the number of parameters and addressing gradient disappearance. The network links all layers to the feature map directly to ensure maximum information transmission. In contrast to traditional convolutional neural networks, where L connections exist in the L layer, DenseNet boasts L(L + 1)/2 connections. Alternating between Dense Block and Transition layers (As shown in Figure 2), the Dense Block is crucial to the structure, connecting every layer in the network and promoting information transfer while reducing gradient disappearance. This reduces the number of parameters and makes the network simpler to train. Transition layers sit between Dense Blocks and contain a batch normalization layer (BN), convolution layer (Conv), and an average pooling layer to further lessen dimensions.
2.5.2. SENet
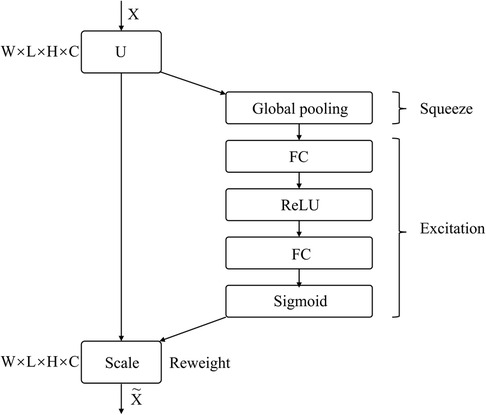
SENet is a sub-network structure that enhances network performance at the feature channel level. By automatically determining the importance of each feature channel through learning, SENet improves useful features and suppresses those that are not as useful for the task at hand. The network comprises Squeeze, Excitation, and Reweight blocks.
Figure 3 depicts the SE Block, where X represents the input image with c1 feature channels. A series of convolution operations on X yields U with c2 feature channels. Through the Squeeze operation, the entire network acquires a global receptive field, while the Excitation generates weights for each feature channel. Finally, the Reweight re-calibrates original features in the channel dimension, to create an operation from U to X.
2.5.3. SE-DenseNet
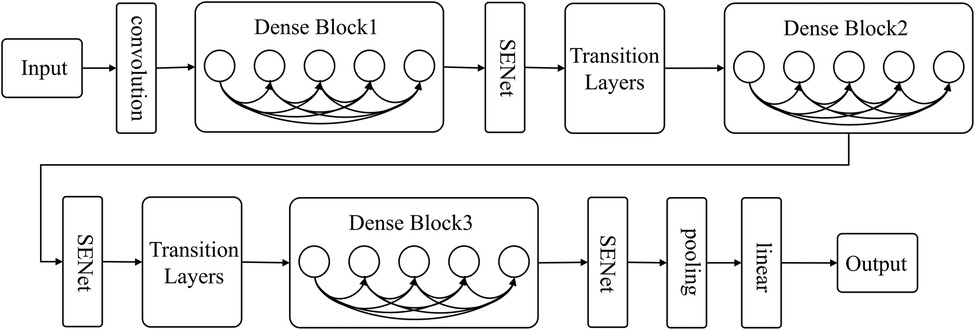
The present research utilizes DenseNet's dense connection and SENet's feature recalibration feature to classify carotid plaque. A sub-structure network, SENet, is incorporated into DenseNet to create SE-DenseNet, as illustrated in Figure 4. By placing SENet before and after each Dense Block in the network, SE-DenseNet can effectively obtain and enhance beneficial features while suppressing features that are not relevant to the current task.
2.6. Evaluation metrics
To evaluate our models with an unbalanced sample size, we used the AUC value as the primary indicator. We represented the relationship between the recall rate and false positive rate at different decision thresholds through the generation of an ROC curve. The AUC, a dependable metric for evaluating model classification performance, was derived from the ROC curve. A score of 1.00 denotes perfect separation, while a score of 0.50 corresponds to random classification.
In addition to AUC, we utilized other measures to assess the models’ performance. Accuracy represents the model's robustness and is defined by the percentage of correctly identified labels out of the entire population. Precision, or the positive predictive value, is the probability that a predicted true label is indeed true. Sensitivity, referred to as the true positive rate (TPR) or recall, is the percentage of correctly identified true class labels. Lastly, the F1-score, which is the harmonic mean of sensitivity and precision, was used as another measure.In the result section, the results are shown as the mean of repeated five-fold cross-validation.
2.7. Statistical analysis
The Means ± SDs were calculated for continuous variables and percentages for categorical variables. For analysis of variance, we included variables that showed statistical significance in the one-way ANOVA test and variables with Spearman's correlation coefficient less than 0.9. All statistical analysis were performed using SPSS 24.0. Two-sided p-value of <0.05 was considered statistically significant.
3. Results
We provide a detailed evaluation and variance of radiomics-based ML and DL models using repeated stratified five-fold cross-validation approach in the Supplementary S1.
3.1. Demographics
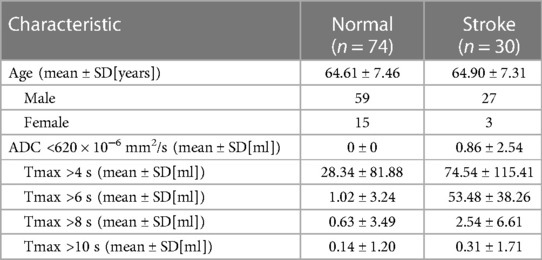
MRI imaging data from 104 patients (86 males and 18 females) with carotid stenosis were included in the analysis. 22 patients' imaging data were acquired from the Tianjin First Central Hospital and 82 patients' imaging data were acquired from the Tianjin Huanhu Hospital, with a median age of 64 years (range: 41–82). The demographics were shown in Table 1. 74 of the 104 patients were diagnosed with ischemic stroke. Figure 5 showed images of carotid plaque in a representative case of carotid stenosis.

Figure 5. Carotid plaque segmentation. (A) SPACE sequence of MRI images with a carotid plaque in a patient. (B) Manually selected plaque segmentation. (C) 3D reconstruction of carotid plaque.
3.2. Radiomics features for the carotid plaques
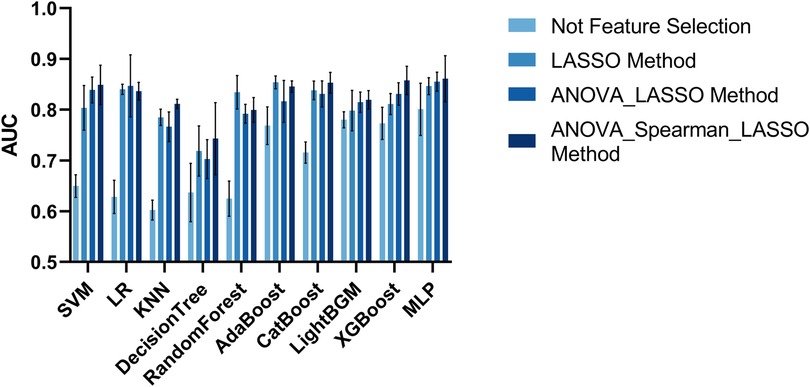
In total, 5,174 features were initially extracted from the SPACE of MRI. We utilized four methods to select radiomics features. One approach for constructing a classification model in radiomics does not require feature selection as it utilizes the complete set of radiomics features available. The AUC metrics of the classification models are shown in Figure 6. The model with the best classification performance is the Multilayer Perceptron model. The AUC, accuracy, precision, sensitivity, and F1 score of Multilayer Perceptron are 0.8009, 0.7824, 0.5994, 0.5568, and 0.5892 respectively.
The AUC evaluation metrics of the classification model using the LASSO feature selection method are shown in Figure 6. The model with the best classification performance is the Multilayer Perceptron model. The AUC, accuracy, precision, sensitivity, and F1 score of Multilayer Perceptron are 0.8465, 0.8326, 0.7849, 0.6462, and 0.6735 respectively.
The AUC evaluation metrics of the classification model using the ANOVA_LASSO feature selection method is shown in Figure 6. The model with the best classification performance is the Multilayer Perceptron model. The AUC, accuracy, precision, sensitivity, and F1 score of Multilayer Perceptron are 0.8552, 0.8130, 0.6686, 0.6859, and 0.6699 respectively.
The AUC evaluation results of the classification model using the ANOVA_spearman_LASSO feature selection method are shown in Figure 6. The model with the best classification performance is the Multilayer Perceptron model. The AUC, accuracy, precision, sensitivity, and F1 score of Multilayer Perceptron are 0.8611, 0.8189, 0.7965, 0.7783, and 0.7525 respectively.
The classification performance of radiomics-based ML approaches in discriminating SPs and ASPs based on the best feature selection approach, i.e., ANOVA_spearman_LASSO, was summarized in Table 2.

Table 2. The outcome of the radiomics-based ML models with ANOVA_spearman_LASSO method. Models with the highest performance are highlighted in bold.
Our results demonstrated that the radiomics-based ML model employing ANOVA_spearman_LASSO feature selection and MLP classification displayed the highest AUC value. The ROC curve for this model, as measured by repeated stratified five-fold cross-validation, is shown in Figure 7A.
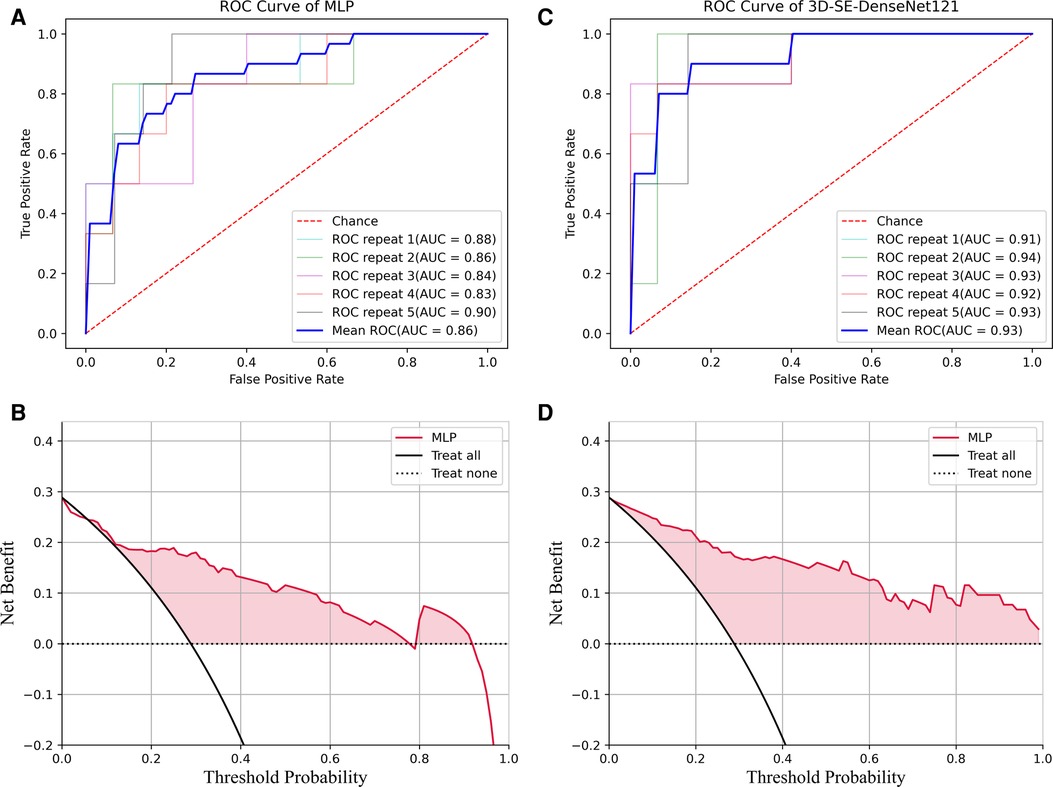
Figure 7. ROC and DCA results of the MLP and 3D-Densenet121. (A) ROC for MLP method; (B) DCA curve analysis for the best run of MLP method; (C) ROC for 3D-SE-Densenet121method; (D) DCA for the best run of 3D-SE-Densenet121 method.
3.3. The DL approach as assessment model
Two DL frameworks were used in this section, 3D-DenseNet, and 3D-SE-DenseNet, and several models were derived from the original framework and evaluated in this paper. The 3D-DenseNet model series were generated and assessed in the image dataset, including 3D-DenseNet121, 3D-DenseNet169, 3D-DenseNet201, 3D-DenseNet264. The 3D-DenseNet demonstrated the best performance. The 3D-SE-Densenet model series included 3D-SE-Densenet121, 3D-SE-Densenet169, 3D-SE-Densenet201 and 3D-SE-Densenet264. The 3D-SE-Densenet121 showed the best performance.
The performance of the CNN models in differentiating SPs and ASPs was shown in Table 3. The AUC, accuracy, precision, sensitivity, and F1 score of 3D-Densenet121 algorithm were 0.8968, 0.9094, 0.8795, 0.8035, and 0.8556, respectively. The AUC, accuracy, precision, sensitivity, and F1 score of 3D-SE-DenseNet121 algorithm were 0.9300, 0.9308, 0.9008, 0.8588, and 0.8614, respectively. Based on these results, 3D-SE-DenseNet121 outperformed the 3D-DenseNet. The AUC, accuracy, precision, sensitivity and F1 score of the 3D-SE-DenseNet121 algorithm were 0.0332, 0.0214, 0.0213, 0.0553, and 0.0058 higher than those of 3D-DenseNet121, respectively.

Table 3. The outcome of the deep learning models. Models with the highest performance are highlighted in bold.
The ROC curve for 3D-SE-DenseNet121, as measured by repeated stratified five-fold cross-validation, is shown in Figure 7C.
3.4. Decision curve analysis
We performed a decision curve analysis (DCA) to assess the classification models in terms of net benefit against threshold probability, which could be crucial in clinical applications. A decision curve analysis graph with threshold probability on the x-axis and net benefit on the y-axis illustrated the trade-offs between true positives and false positives as the threshold probability varies, respectively.
Figure 7B showed the DCA results for the best run of the best-performing ML model using MLP. The decision curve analysis for the best run of MLP showed that within a threshold probability from 6% to 77% or 80% to 91%, checking patients based on the classification model leads to a higher net benefit than assigning all patients as SPs or ASPs.
To optimize the 3D-SE-Densenet121 model, DCA analysis (Figure 7D) suggests that utilizing threshold probabilities between 1% to 99% would yield the most significant advantages for the classification model.
Comparing the DCA results of 3D-SE-Densenet121 and MLP, the 3D-SE-Densenet121 demonstrated more robust performance and brought more net benefit than MLP with a wider range of threshold probability.
4. Discussion
In this study, we recruited 104 patients with carotid stenosis. HRMRI was conducted to acquire imaging data. The radiomics-based ML approach and DL approaches were proposed and investigated in this study to differentiate SPs and ASPs.
The ANOVA_spearman_LASSO and MLP model combination has emerged as the most effective radiomics-based ML model, as shown by our research. Utilizing feature selection, the best radiomics-based ML models demonstrated superior performance, with higher AUC, accuracy, precision, sensitivity, and F1 scores than models without feature selection, with differences of 0.0602, 0.0365, 0.1971, 0.2215, and 0.1633, respectively. These findings underscore the significance of feature selection in accurately distinguishing between ASPs and SPs. By implementing feature selection in our study, we have gained numerous benefits. Firstly, it has enhanced the accuracy of our model and mitigated the danger of overfitting. Moreover, feature screening has deepened our comprehension of the model's workings and has also reduced computational costs.
By utilizing ANOVA_spearman_LASSO, the top radiomics-based ML models achieved superior performance as compared to models utilizing ANOVA_LASSO. The former displayed significantly higher AUC, accuracy, precision, sensitivity, and F1 scores, with differences of 0.0059, 0.0059, 0.1279, 0.0924 and 0.0826, respectively. These results underscore the significance of utilizing the spearman method in accurately distinguishing between ASPs and SPs. The MRI image data is amplified by sixty-fold using static data enhancement techniques. Radiomics technique yielded 5,174 extracted image histology features. However, some of these features, such as the first-order features in the “random rotate” approach to data enhancement, were redundant. To address this issue, we employed the Spearman method, a nonparametric, ranking-based method that is better equipped to handle nonlinear data relationships, eliminate unimportant and irrelevant features, and prevent overfitting and underfitting of the model. As a result, the filtered features were more representative, better explained the prediction results.
The raw MRI image data is amplified by a factor of sixty through static data enhancement techniques. With the radiomics technique, we extracted a total of 5,174 image histology features. Although we extracted a large number of image histology features, we included a large number of redundant features, such as first order features in the “random rotate” approach to data enhancement. The Spearman method is a nonparametric, ranking-based method that can better handle the nonlinear relationships of the data, eliminate unimportant and useless features, and avoid overfitting and underfitting of the model. The filtered features are more representative, can better explain the prediction results of the model, and are more easily understood by people.
The 3D-SE-Densenet121 showed the best performance among all models. The best performance method for radiomics-based ML approach was the combination of ANOVA_spearman_LASSO and MLP. The best performance method for the DL approach was 3D-SE-Densenet121 model. The AUC, accuracy, precision, sensitivity, and F1 scores of the best DL method (3D-SE-Densenet121) were 0.0689, 0.1119, 0.1043, 0.0805, and 0.1089 higher than those of the best radiomics-based ML models (MLP), respectively.
It was clear that the DL models had better performance than the radiomics-based ML model in differentiating ASPs from SPs (AUC = 0.9294 vs. AUC = 0.8853). These results were consistent with the findings for Mantle Cell Lymphoma (27) and Deep Vein Thrombosis (28) that DL models had better diagnostic performance than radiomics-based ML models. This was due to the fact that DL extracts more representative high-level abstract features from the raw data, while machine learning requires manual feature selection and design. In addition, it was clear that the model performance was directly reflected in the DCA results. The 3D-SE-Densenet-121 model demonstrated the highest performance in all the model evaluation metrics. Unlike the MLP model based on radiomics features, the 3D-SE-Densenet-121 model demonstrated stable and robust net benefit in DCA. Furthermore, the LightGBM, XGBoost, Multilayer Perceptron models and the CNN-based 3D-SE-Densenet model (i.e., nonlinear classifiers with high complexity) showed higher performance compared to other models, which suggested that models with higher nonlinear complexity were favored for HRMRI data.
Additionally, compared with the AUC results of other papers, our classification models for SPs and ASPs have achieved better performance. Li et al. (10) constructed a 3D HRMRI-based radiomics model to identify symptomatic plaques with an AUC of 0.906. Compared to our study, Li et al.'s study had a lower AUC than our best model's 0.9300, and he used a single-center dataset while we acquired data from two centers. Huang et al. (29) used radiomics ultrasonography to non-invasively predict SPs and ASPs with a training set of 0.930 and a test set of 0.922, which is also lower than the AUC of our highest model. The two-dimensional radiomics model using maximum plaque area slices to classify carotid plaques in the study by Zhang et al. (9) showed better performance than the conventional methods (AUC = 0.984 vs. AUC = 0.804), but the size of the dataset and the absence of repeated stratified cross-validation might lower the reproducibility of this paper.
Although, this paper was not intended to focus on model complexity, the analysis of the relationship between the number of learning parameters and model performance was not included in this paper, we still observed some preliminary performance discrepancies with different number of learning parameters and different network architectures. Among all the models tested in this paper, our experiments showed that 3D-DenseNet121, which has the fewest parameters among the four 3D-DenseNet models, demonstrated the best performance. Similarly, 3D-SE-DenseNet121, which was the 3D-SE-DenseNet model with the fewest parameters among the four 3D-SE-DenseNet models, yielded the best results in our experiments. Furthermore, 3D-SE-DenseNet121 model outperformed 3D-DenseNet despite that 3D-SE-DenseNet121 had more parameters. These results suggests that the SE Block has a positive impact on the model's performance. Therefore, when working with small spatial sample sizes, choosing the right number of parameters and architecture was crucial.
To our knowledge, this paper represents the first study to utilize 3D HRMRI-based radiomics-based ML and DL models for evaluating carotid plaque properties. Through comparing and systematically examining these two approaches with the same dataset, our proposed methods have demonstrated robustness and high-performance, particularly in the case of the DL approach.
However, our study has several limitations. First of all, the limitation in the size of the MRI image data set severely limits the robustness and generalizability of the findings in this paper, future studies should be conducted with larger cohorts to further validated the methods proposed in this paper. Limited by the scale of our research and restricted availability of clinical data, it is clear that the models' performance in this paper are still far from practical applications in clinical scenarios. Larger datasets are thus required for further investigation of the models from diverse perspectives to investigate their clinical efficacy. Secondly, future studies with fully automated segmentation and classification methods should be investigated to further streamline the analysis and minimize intervention from the healthcare professionals. In the end, although radiomics methods seem to be easier to interpret in terms of the significance of features, there are several methods to explain DL models. For example, local saliency analysis, class activation mapping and other methods can be used to investigate the features learned by the DL models which may further broaden our understanding in the imaging characteristics of SP plaques.
5. Conclusion
In this paper, a multi-center high-resolution carotid MRI dataset was constructed, and radiomics-based ML and DL approaches were evaluated for the classification of carotid plaques. Compared with radiomics-based ML approaches, DL approaches demonstrated superior performance in the classification of carotid plaques on sequential HRMRI, especially the 3D-SE-Densenet models, in terms of accuracy and AUC. The 3D-SE-Densenet-121 model showed the best performance among all models.
Data availability statement
The raw data of this paper were patient imaging data and our ethics restrict publishing/sharing raw data to any other institutions. However, the scripts and codes can be available upon requests.
Ethics statement
The studies involving human participants were reviewed and approved by Huanhu Hospital, Tianjin University. The patients/participants provided their written informed consent to participate in this study.
Author contributions
CG contribtes in the data analysis and manuscript drafting, CC contributes in the conceptualization of the project, original data acquisition and funding acquisition, XZ contributes in the conceptualization of the project, funding acquisiton, supervisions of the project process and manuscript drafting and revision, JZ contributes in the original data preprocessing. GN and DM provides basic resource for this paper. All authors contributed to the article and approved the submitted version.
Funding
This work was supported in part by the National Key Research and Development Program of China under Grant 2022YFF1202900, the National Natural Science Foundation of China under Grant 82102174, and China Postdoctoral Science Foundation under Grant 2021TQ0243.
Acknowledgments
The authors would like to thank the Academy of Medical Engineering and Translational Medicine, Tianjin University, Tianjin, China, and the Institute of Biomedical Engineering, Chinese Academy of Medical Sciences and Peking Union Medical College, Tianjin, China, for their equal contributions to supporting this paper.
Conflict of interest
The authors declare that the research was conducted in the absence of any commercial or financial relationships that could be construed as a potential conflict of interest.
Publisher's note
All claims expressed in this article are solely those of the authors and do not necessarily represent those of their affiliated organizations, or those of the publisher, the editors and the reviewers. Any product that may be evaluated in this article, or claim that may be made by its manufacturer, is not guaranteed or endorsed by the publisher.
Supplementary material
The Supplementary Material for this article can be found online at: https://www.frontiersin.org/articles/10.3389/fcvm.2023.1173769/full#supplementary-material
References
1. Naghavi M, Libby P, Falk E, Casscells SW, Litovsky S, Rumberger J, et al. From vulnerable plaque to vulnerable patient—a call for new definitions and risk assessment strategies: part I. Circulation. (2003) 108:1664–72. doi: 10.1161/01.CIR.0000087480.94275.97
2. Kopczak A, Schindler A, Bayer-Karpinska A, Koch ML, Sepp D, Zeller J, et al. Complicated carotid artery plaques as a cause of cryptogenic stroke. J Am Coll Cardiol. (2020) 76:2212–22. doi: 10.1016/j.jacc.2020.09.532
3. Kakkos SK, Stevens JM, Nicolaides AN, Kyriacou E, Pattichis CS, Geroulakos G, et al. Texture analysis of ultrasonic images of symptomatic carotid plaques can identify those plaques associated with ipsilateral embolic brain infarction. Eur J Vasc Endovasc Surg. (2007) 33:422–9. doi: 10.1016/j.ejvs.2006.10.018
4. Le EPV, Rundo L, Tarkin JM, Evans NR, Chowdhury MM, Coughlin PA, et al. Assessing robustness of carotid artery CT angiography radiomics in the identification of culprit lesions in cerebrovascular events. Sci Rep. (2021) 11:1–14. doi: 10.1038/s41598-021-82760-w
5. Turan TN, Rumboldt Z, Granholm A-C, Columbo L, Welsh CT, Lopes-Virella MF, et al. Intracranial atherosclerosis: correlation between in-vivo 3T high resolution MRI and pathology. Atherosclerosis. (2014) 237:460–3. doi: 10.1016/j.atherosclerosis.2014.10.007
6. Jiang Y, Zhu C, Peng W, Degnan AJ, Chen L, Wang X, et al. Ex-vivo imaging and plaque type classification of intracranial atherosclerotic plaque using high resolution MRI. Atherosclerosis. (2016) 249:10–6. doi: 10.1016/j.atherosclerosis.2016.03.033
7. Chen S, Liu C, Chen X, Liu WV, Ma L, Zha Y. A radiomics approach to assess high risk carotid plaques: a non-invasive imaging biomarker, retrospective study. Front Neurol. (2022) 13:1–13. doi: 10.3389/fneur.2022.788652
8. Leng XY, Wong KS, Liebeskind DS. Evaluating intracranial atherosclerosis rather than intracranial stenosis. STROKE. (2014) 45:645–51. doi: 10.1161/STROKEAHA.113.002491
9. Zhang R, Zhang Q, Ji A, Lv P, Zhang J, Fu C, et al. Identification of high-risk carotid plaque with MRI-based radiomics and machine learning. Eur Radiol. (2021) 31:3116–26. doi: 10.1007/s00330-020-07361-z
10. Li H, Liu J, Dong Z, Chen X, Zhou C, Huang C, et al. Identification of high-risk intracranial plaques with 3D high-resolution magnetic resonance imaging-based radiomics and machine learning. J Neurol. (2022) 269:6494–503. doi: 10.1007/s00415-022-11315-4
12. Chan HP, Samala RK, Hadjiiski LM, Zhou C. Deep learning in medical image analysis. In: Lee G, Fujita H, editors. Deep learning in medical image analysis: Challenges and applications. (2020). p. 3–21. Available at: https://link.springer.com/chapter/10.1007/978-3-030-33128-3_1
13. Hu J, Shen L, S G. Squeeze-and-excitation networks. Proc IEEE Conf Comput Vis Pattern Recognit. (2018):7132–41. doi: 10.1109/TPAMI.2019.2913372
14. Takaya N, Yuan C, Chu B, Saam T, Underbill H, Cai J, et al. Association between carotid plaque characteristics and subsequent ischemic cerebrovascular events: a prospective assessment with MRI—initial results. Stroke. (2006) 37:818–23. doi: 10.1161/01.STR.0000204638.91099.91
15. Neurolog- C. Benefit of carotid endarterectomy in patients with symp tomatic moderate or severe stenos is benefit of carotid endarterectomy in patients with symptomatic. (1998) 339(20):1415–25. doi: 10.1056/NEJM199811123392002
16. Angiography S, Anzidei M, Napoli A, Marincola BC. Gadofosveset-enhanced MR angiography of carotid arteries: does steady-state imaging improve accuracy of first-pass imaging? Comparison with selective digital subtraction angiography. Radiology. (2009) 251:457–66. doi: 10.1148/radiol.2512081197
17. Cao C, Liu Z, Liu G, Jin S, Xia S. Ability of weakly supervised learning to detect acute ischemic stroke and hemorrhagic infarction lesions with diffusion-weighted imaging. Quant Imaging Med Surg. (2022) 12:321–32. doi: 10.21037/qims-21-324
18. Sacchetti DC, Cutting SM, McTaggart RA, Chang AD, Hemendinger M, Mac Grory B, et al. Perfusion imaging and recurrent cerebrovascular events in intracranial atherosclerotic disease or carotid occlusion. Int J Stroke. (2018) 13:592–9. doi: 10.1177/1747493018764075
19. Available at: https://github.com/ashawkey/volumentations.
20. Roth HR, Lu L, Liu J, Yao J, Seff A, Cherry K, et al. Improving computer-aided detection using convolutional neural networks and random view aggregation. IEEE Trans Med Imaging. (2016) 35:1170–81. doi: 10.1109/TMI.2015.2482920
21. Van Griethuysen JJM, Fedorov A, Parmar C, Hosny A, Aucoin N, Narayan V, et al. Computational radiomics system to decode the radiographic phenotype. Cancer Res. (2017) 77:e104–7. doi: 10.1158/0008-5472.CAN-17-0339
22. Yang L, Xu P, Zhang Y, Cui N, Wang M, Peng M, et al. A deep learning radiomics model may help to improve the prediction performance of preoperative grading in meningioma. Neuroradiology. (2022) 64:1373–82. doi: 10.1007/s00234-022-02894-0
23. Sauerbrei W, Royston P, Binder H. Selection of important variables and determination of functional form for continuous predictors in multivariable model building. Stat Med. (2007) 26:5512–28. doi: 10.1002/sim.3148
24. Pedregosa F, Varoquaux G, Gramfort A, Michel V, Thirion B, Grisel O, et al. Scikit-learn: machine learning in python. J Mach Learn Res. (2011) 12:2825–30.
25. Kayalibay B, Jensen G, van der Smagt P. CNN-based Segmentation of Medical Imaging Data. (2017). Available at: http://arxiv.org/abs/1701.03056
26. Liu M, Li F, Yan H, Wang K, Ma Y, Shen L, et al. A multi-model deep convolutional neural network for automatic hippocampus segmentation and classification in Alzheimer’s disease. Neuroimage. (2020) 208:116459. doi: 10.1016/j.neuroimage.2019.116459
27. Lisson CS, Lisson CG, Mezger MF, Wolf D, Schmidt SA, Thaiss WM, et al. Deep neural networks and machine learning radiomics modelling for prediction of relapse in mantle cell lymphoma. Cancers (Basel). (2022) 14(8):2008. doi: 10.3390/cancers14082008
28. Hwang JH, Seo JW, Kim JH, Park S, Kim YJ, Kim KG. Comparison between deep learning and conventional machine learning in classifying iliofemoral deep venous thrombosis upon CT venography. Diagnostics. (2022) 12(2):274. doi: 10.3390/diagnostics12020274
Keywords: prognosis, MRI image analysis, radiomics, machine learning, deep learning, stroke risk assessment
Citation: Gui C, Cao C, Zhang X, Zhang J, Ni G and Ming D (2023) Radiomics and artificial neural networks modelling for identification of high-risk carotid plaques. Front. Cardiovasc. Med. 10:1173769. doi: 10.3389/fcvm.2023.1173769
Received: 2 March 2023; Accepted: 19 June 2023;
Published: 6 July 2023.
Edited by:
Pablo Blanco, National Laboratory for Scientific Computing (LNCC), BrazilReviewed by:
Carlos Alberto Bulant, National Scientific and Technical Research Council (CONICET), ArgentinaYang Yingjian, Northeastern University, China
You-Bin Deng, Huazhong University of Science and Technology, China
© 2023 Gui, Cao, Zhang, Zhang, Ni and Ming. This is an open-access article distributed under the terms of the Creative Commons Attribution License (CC BY). The use, distribution or reproduction in other forums is permitted, provided the original author(s) and the copyright owner(s) are credited and that the original publication in this journal is cited, in accordance with accepted academic practice. No use, distribution or reproduction is permitted which does not comply with these terms.
*Correspondence: Xin Zhang eGluX3poYW5nX2JtZUAxNjMuY29t
†These authors have contributed equally to this work
 Chengzhi Gui
 Chen Cao
 Xin Zhang
 Jiaxin Zhang4
 Guangjian Ni