
95% of researchers rate our articles as excellent or good
Learn more about the work of our research integrity team to safeguard the quality of each article we publish.
Find out more
ORIGINAL RESEARCH article
Front. Cardiovasc. Med. , 07 September 2023
Sec. General Cardiovascular Medicine
Volume 10 - 2023 | https://doi.org/10.3389/fcvm.2023.1132685
This article is part of the Research Topic Insights in General Cardiovascular Medicine: 2023 View all 5 articles
 Cien Zhen1,2,3,†
 Wei Chen4,†Weikun Chen2,3,†
 Hualin Fan1,2,3Zijing Lin2,3,5
 Lihuan Zeng6Zehuo Lin2,3,7
 Weibin He2,3Yu Li2,3,5Shimin Peng2,3Lin Zeng2,3
 Chongyang Duan8
 Ning Tan2,3
 Yuanhui Liu2,3,1*
 Pengcheng He1,2,3*
Introduction: It is unclear whether admission-blood-glucose-to-albumin ratio (AAR) predicts adverse clinical outcomes in patients with ST-segment elevation myocardial infarction (STEMI) who are treated with percutaneous coronary intervention (PCI). Here, we performed a observational study to explore the predictive value of AAR on clinical outcomes.
Methods: Patients diagnosed with STEMI who underwent PCI between January 2010 and February 2020 were enrolled in the study. The patients were classified into three groups according to AAR tertile. The primary outcome was in-hospital all-cause mortality, and the secondary outcomes were in-hospital major adverse cardiac events (MACEs), as well as all-cause mortality and MACEs during follow-up. Logistic regression, Kaplan–Meier analysis, and Cox proportional hazard regression were the primary analyses used to estimate outcomes.
Results: Among the 3,224 enrolled patients, there were 130 cases of in-hospital all-cause mortality (3.9%) and 181 patients (5.4%) experienced MACEs. After adjustment for covariates, multivariate analysis demonstrated that an increase in AAR was associated with an increased risk of in-hospital all-cause mortality [adjusted odds ratio (OR): 2.72, 95% CI: 1.47–5.03, P = 0.001] and MACEs (adjusted OR: 1.91, 95% CI: 1.18–3.10, P = 0.009), as well as long-term all-cause mortality [adjusted hazard ratio (HR): 1.64, 95% CI: 1.19–2.28, P = 0.003] and MACEs (adjusted HR: 1.58, 95% CI: 1.16–2.14, P = 0.003). Receiver operating characteristic (ROC) curve analysis indicated that AAR was an accurate predictor of in-hospital all-cause mortality (AUC = 0.718, 95% CI: 0.675–0.761) and MACEs (AUC = 0.672, 95% CI: 0.631–0.712).
Discussion: AAR is a novel and convenient independent predictor of all-cause mortality and MACEs, both in-hospital and long-term, for STEMI patients receiving PCI.
ST-segment elevation myocardial infarction (STEMI) remains a major cause of mortality worldwide, despite the common use of standardized interventional and medical treatments (1, 2). Early risk evaluation of patients during hospitalization is useful in making clinical decisions and selecting the optimal treatment. In recent years, risk assessment of STEMI patients has commonly been performed using the Global Registry of Acute Coronary Events (GRACE) risk score, which includes medical history, some clinical symptoms and signs, cardiac biomarkers, and electrocardiographic changes (2). Nonetheless, the GRACE risk score is complicated for use in the emergency department of primary hospitals, particularly in developing countries. Therefore, simple and easily accessible indicators with high prognostic value for outcomes in such patients are required.
Blood glucose and albumin levels at admission are rapidly and easily accessible biomarkers for use in the emergency room. An increased blood glucose level at admission indicates diabetes mellitus (DM), which may accelerate the progression of STEMI (3). Accordingly, some studies have shown that patients with STEMI who have a higher admission blood glucose level are at an increased risk of adverse events (4–8). Recent studies have indicated that admission blood glucose level may also be increased in stress-induced hyperglycemia (SIH) due to the response of the sympathetic nervous system to physiological and emotional stress, leading to an increased risk of acute cardiovascular diseases (9). Therefore, admission blood glucose level is a valuable indicator to evaluate the prognosis of individuals with cardiovascular disease.
Although traditionally considered to be an indicator of malnutrition, albumin (10, 11) is a multifunctional protein associated with DM, inflammation, and thrombosis, which are risk factors for or triggers of STEMI or its progression (12). In addition, recent studies have shown that a decrease in serum albumin is linked to an increase in cardiovascular mortality (13–16). An indicator consisting of a combination of albumin and admission blood glucose levels may guide the need for malnutrition treatment and blood glucose control, as well as indicating the occurrence of a thrombo-inflammatory reaction during STEMI and subsequent percutaneous coronary intervention (PCI) treatment. Therefore, we hypothesized that the admission-blood-glucose-to-albumin ratio (AAR), a novel composite index of two biomarkers, may predict adverse clinical outcomes for STEMI patients receiving PCI. In this study, the predictive value of AAR was explored in a study with a large sample size.
Between January 2010 and February 2020, we enrolled STEMI patients undergoing PCI at the Guangdong Provincial People's Hospital. The definition of STEMI was determined in accordance with the guidelines of the European Society of Cardiology (2, 17). We excluded any patients: (1) who had a diagnosis of non-ST-elevation myocardial infarction (NSTEMI); (2) who did not undergo PCI treatment; (3) for whom no admission laboratory parameters were available, or for whom variables needed to calculate the ratio were missing; or (4) who had active carcinoma or acute/chronic inflammatory diseases. This study was conducted according to the guidelines laid down in the Declaration of Helsinki, and all procedures involving human subjects/patients were approved by the research ethics committee of Guangdong Provincial People's Hospital (No. GDREC2016378H). Written informed consent was obtained from all participants.
All patients were treated in accordance with the hospital protocol and the European Society of Cardiology guidelines for STEMI patients (2, 17). Within 24 h of admission, before PCI, blood samples were obtained to measure the relevant laboratory parameters, including admission blood glucose and serum albumin levels. Before PCI, all eligible patients were prescribed aspirin (300 mg) and clopidogrel (300 or 600 mg) or ticagrelor (180 mg). Following the recommendations for catheter procedures (18), coronary angiography and PCI were performed by experienced interventional cardiologists, who made all decisions relating to the procedures, including the choice of vessel access, the selection of stents, the volume of contrast, and so on. After PCI, patients received dual antiplatelet therapy, including aspirin (100 mg/day) combined with clopidogrel (75 mg/day) or ticagrelor (90 mg twice/day). Other medications were prescribed by the patients’ physicians according to standard regimens. Clinical information on demographic characteristics and other relevant data on the enrolled patients were extracted from the hospital electronic database by trained researchers. Follow-up data were collected by trained nurses through telephone tracking or outpatient visits.
In-hospital all-cause mortality was the primary outcome. The secondary outcomes were in-hospital major adverse cardiac events (MACEs), as well as all-cause mortality and MACEs during follow-up. In-hospital MACEs were defined as the combined endpoint of all-cause mortality, stroke, target vessel revascularization, and recurrent myocardial infarction during hospitalization. MACEs during follow-up were defined as the combined endpoint of follow-up all-cause mortality or stroke.
AAR was calculated as [admission blood glucose (mmol/L) × 18/albumin (g/L)] or [admission blood glucose (mg/dl)/albumin (g/L)] using the same blood samples obtained at admission. The value of AAR was calculated for every patient according to the formula. AAR values were stratified into tertiles, according to which patients were divided into three groups: T1 (n = 1,074; AAR < 3.35), T2 (n = 1,076; 3.35 ≤ AAR < 4.56), and T3 (n = 1,074; AAR ≥ 4.56). Categorical variables are reported in the form of numbers (percentages). In order to compare the distributions of categorical variables, Chi-square tests or Fisher's exact tests were employed. For continuous variables, normally distributed data are reported in the form of means ± standard deviation (SD), while non-normally distributed data are reported in the form of medians (Q25–Q75). Normally distributed continuous variables were compared using one-way ANOVA; otherwise, the Kruskal–Wallis test was performed. To calculate odds ratios (ORs) and 95% confidence intervals (CIs) for in-hospital mortality and MACEs according to AAR, we performed univariate and multivariate logistic regression analyses. Model 1 was adjusted for, age, sex, smoking status, prior stroke, chronic obstructive pulmonary disease, diabetes mellitus (DM), hypertension, prior myocardial infarction, prior PCI, anemia, Killip class ≥II, estimated glomerular filtration rate (eGFR), aspirin, glycoprotein IIb/IIIa inhibitors, multiple lesions, and transradial access. Model 2 was adjusted for alanine aminotransferase (ALT) in addition to the covariates adjusted for in Model 1; Model 3 was adjusted for insulin in addition to the covariates adjusted for in Model 1; and Model 4 was adjusted for heart rate and prior cardiac arrest in addition to the covariates adjusted for in Model 1. These models were used to perform univariate and multivariate logistic regression analyses. To determine how well AAR predicts in-hospital mortality and MACEs, receiver operating characteristic (ROC) curves were constructed and the area under the ROC curve (AUC) was subsequently calculated. The AUC value can be used to evaluate the efficacy of the predictor (AUC <0.6, poor discrimination; 0.6–0.75, good discrimination; >0.75, excellent discrimination) (19). The optimal cutoff value was determined by the maximum Youden index (Youden = sensitivity + specificity–1). To assess the prognostic value of AAR in patients with and without DM, ROC curves were plotted to determine the optimal cutoff value for AAR as a predictor of MACEs in each of the two groups. In addition, nomograms for the predictive value of in-hospital all-cause mortality and MACEs were constructed. To assess for non-linearity in the relationship between AAR as a continuous variable and in-hospital death or MACEs, we fitted restricted cubic spline models to identify a non-linear relationship. Kaplan–Meier analysis was conducted to visualize several survival curves illustrating follow-up risks of mortality and MACEs in different AAR groups. The effect of AAR on long-term mortality and MACEs was assessed using univariate and multivariate Cox proportional hazards regression analyses in Models 1–4. Log-rank tests were used to compare survival curves between groups. A P-value of 0.05 or below was considered to represent statistical significance. SAS version 9.4 (SAS Institute, Cary, NC, USA) was used to perform the statistical analyses.
A flow chart of the study is presented in Figure 1. Patients were divided into three groups according to AAR tertile. The mean AAR value across all patients was 4.58 ± 2.38, and the average age was 62.10 ± 12.24 years. The baseline clinical characteristics of the three groups are presented in Table 1. Compared to the other groups, patients in the T3 group were older, had a higher Killip class, stayed in hospital for longer, had lower systolic and diastolic blood pressure, and were more likely to have been treated with prior PCI and to have been diagnosed with hypertension, anemia, DM, and stroke. In addition, a higher AAR was associated with higher hemoglobin A1c (HbA1c) and serum creatinine levels, as well as lower low-density lipoprotein cholesterol, total cholesterol, hemoglobin, left ventricular ejection fraction, and eGFR.
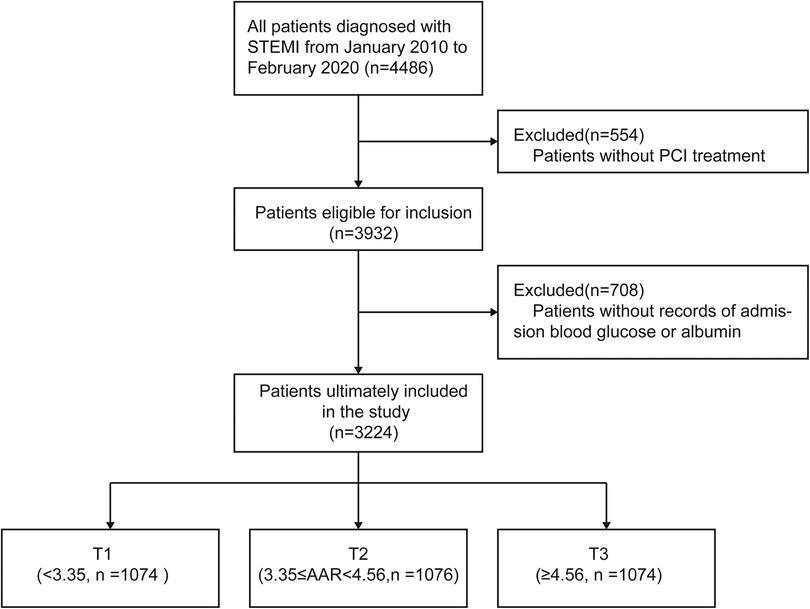
Figure 1. Flow chart of the study participants.
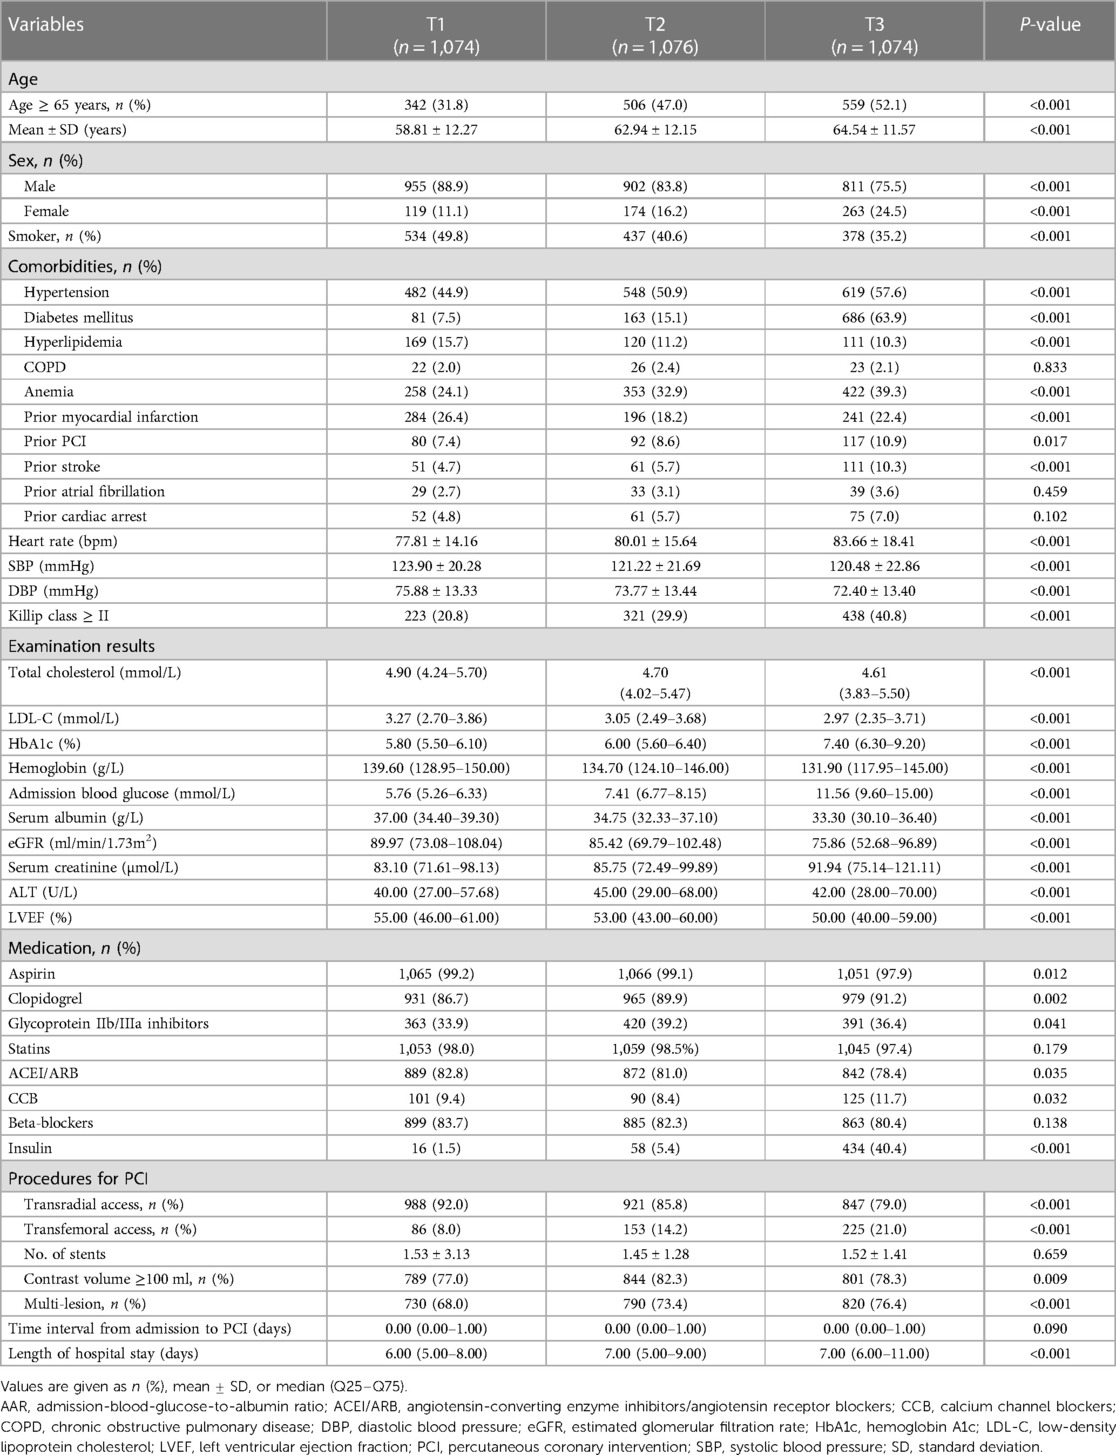
Table 1. Patients’ baseline characteristics by AAR tertile.
In total, 130 patients (3.9%) died in hospital and 181 (5.4%) experienced in-hospital MACEs. Moreover, significantly higher rates of in-hospital all-cause mortality and MACEs were reported in the T3 group compared to the T1 group (8.0% vs. 1.5% and 9.9% vs. 3.0%, respectively; P < 0.001).
Among these STEMI patients after PCI, the continuous variable of AAR was positively associated with risk of in-hospital all-cause mortality (OR: 1.22, 95% CI: 1.16–1.27, P = 0.000) and MACEs (OR: 1.19, 95% CI: 1.14–1.24, P = 0.000) in univariate logistic regression analyses. After adjusting for confounders in the multivariate logistic regression analysis, the results showed that a higher risk of in-hospital all-cause mortality (adjusted OR: 1.14, 95% CI: 1.07–1.22, P = 0.000) and MACEs (adjusted OR: 1.11, 95% CI: 1.05–1.18, P = 0.001) (Supplementary Table S1, Model 1) was independently predicted by AAR, indicating that AAR was an independent predictor of these outcomes. When AAR was examined as a categorical variable, univariate logistic regression analysis revealed that the T3 group was at an elevated risk of unfavorable outcomes in terms of in-hospital all-cause mortality (OR: 5.75, 95% CI: 3.35–9.87, P = 0.000) and MACEs (OR: 3.57, 95% CI: 2.38–5.35, P = 0.000), but not the T2 group (OR: 1.77, 95% CI: 0.95–3.28, P = 0.072; OR: 1.36, 95% CI: 0.85–2.16, P = 0.201, respectively). Furthermore, the results of the multivariate logistic regression analysis revealed that AAR level was substantially associated with the adjusted risk of in-hospital all-cause mortality, with higher adjusted risk in the T3 group (adjusted OR: 2.72, 95% CI: 1.47–5.03, P = 0.001) and MACEs (adjusted OR: 1.91, 95% CI: 1.18–3.10, P = 0.009) as compared to the T1 group (Supplementary Table S2, Model 1). Furthermore, when considering the effects of factors potentially associated with albumin or blood glucose and several important determinants of prognosis, these findings of the logistic regression analyses were not materially affected in additional models that further adjusted for ALT (Supplementary Tables S1 and S2, Model 2), insulin (Supplementary Tables S1 and S2, Model 3), heart rate, and prior cardiac arrest (Supplementary Tables S1 and S2, Model 4).
ROC curve analysis showed that AAR could predict in-hospital all-cause mortality (AUC = 0.718, 95% CI: 0.675–0.761) (Figure 2A) as well as MACEs (AUC = 0.672, 95% CI: 0.631–0.712) (Figure 2B). The optimal cutoff value for AAR was 4.429, as calculated on the basis of the Youden index. Interestingly, according to ROC curve analysis in the DM subgroup, the predictive value of AAR for in-hospital all-cause mortality was different for patients with and without DM (with-DM group: AUC = 0.653, 95% CI: 0.587–0.718; without-DM group: AUC = 0.669, 95% CI: 0.615–0.723; interaction P = 0.001) (Figure 2C). Furthermore, it is necessary to account for HbA1c, one of the indicators of DM and long-term glycemic control, in evaluating the prognostic value of AAR. However, additional ROC analyses for HbA1c subgroups revealed that there was no significant difference between HbA1c subgroups for either in-hospital all-cause mortality (HbA1c ≤6.1 subgroup: AUC = 0.723, 95% CI: 0.662–0.783; HbA1c >6.1 subgroup: AUC = 0.749, 95% CI: 0.691–0.808; P for comparison = 0.535) or in-hospital MACEs (HbA1c ≤6.1 subgroup: AUC = 0.666, 95% CI: 0.609–0.722; HbA1c >6.1 subgroup: AUC = 0.704, 95% CI: 0.648–0.761; P for comparison = 0.343).
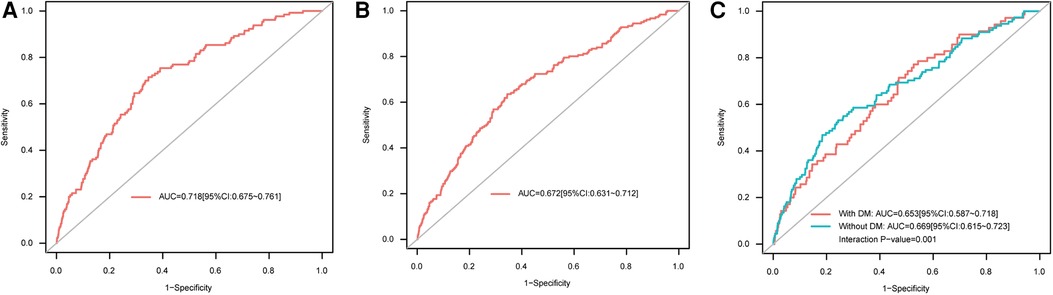
Figure 2. ROC curves for AAR as a predictor of (A) in-hospital all-cause mortality, (B) in-hospital MACEs, and (C) in-hospital all-cause mortality in the DM subgroup. AAR, admission-blood-glucose-to-albumin ratio; AUC, area under the ROC curve; DM, diabetes mellitus; MACEs, major adverse cardiac events; ROC, receiver operating characteristic.
Several other factors should be considered in the evaluation of the predictive value of AAR. In order to compare AAR with two individual indices (admission blood glucose and albumin), ROC curve analyses for these three indicators were conducted (Supplementary Figure S1). These analyses showed that, for both in-hospital all-cause mortality and in-hospital MACEs, the predictive value of AAR was significantly greater than that of admission blood glucose (AUC for mortality = 0.664, 95% CI: 0.671–0.712, P for comparison with AAR <0.0001; AUC for MACEs = 0.633, 95% CI: 0.591–0.676, P for comparison with AAR <0.0001), while the AUC for AAR was marginally higher than the AUC for albumin (AUC for mortality = 0.701, 95% CI: 0.655–0.747, P for comparison with AAR = 0.508; AUC for MACEs = 0.655, 95% CI: 0.614–0.696, P for comparison with AAR = 0.466). In addition, time heterogeneity should be considered. Specifically, given the fluctuations in glucose level that occur over the 24 h of each day (20, 21), we wondered whether the effect of postprandial blood glucose had an impact on the prognostic value of AAR. To test this, we divided patients into three groups according to the time period in which the admission measurements were taken: 06:00–12:00 (morning), 12:00–18:00 (afternoon), and 18:00–06:00 (nighttime); these groups consisted of 380 (11.8%), 1,358 (42.1%), and 1,486 (46.1%) STEMI patients who underwent PCI, respectively. ROC curve analyses for each of the three groups (Supplementary Figure S2) showed that the AUC values for prediction of clinical outcomes were largest for the nighttime group (18:00–6:00) (AUC for mortality = 0.734, 95% CI: 0.677–0.791; AUC for MACEs = 0.707, 95% CI: 0.655–0.759); however, comparisons among the three groups indicated no statistically significant differences in the AUC values for in-hospital all-cause mortality (P = 0.614) or MACEs (P = 0.186). Finally, given that the 10-year span of the data collection period may have been a source of major heterogeneity, we performed ROC curve analyses with patients categorized into two 5-year subgroups, namely a 2010–2015 subgroup and a 2016–2020 subgroup (Supplementary Figure S3). These analyses revealed that the 10-year time heterogeneity was small, both in the case of in-hospital all-cause mortality and in the case of in-hospital MACEs (P for comparisons between AUCs of two subgroups = 0.583 and 0.446, respectively).
According to the restricted cubic spline model, as AAR increased, ORs for in-hospital all-cause mortality and MACEs increased (Supplementary Figure S4). Moreover, in order to confirm the predictive value of AAR for in-hospital all-cause mortality and MACEs, nomograms were constructed (Supplementary Figure S5). In summary, AAR provides satisfactory prognostic value in the prediction of adverse events during hospitalization.
Over the median follow-up duration of 1.66 years, 339 cases of all-cause mortality and 376 MACEs occurred: by group, there were 57 (5.3%), 100 (9.3%), and 182 (16.9%) cases of all-cause mortality and 70 (6.5%), 108 (10.0%), and 198 (18.4%) MACEs in the T1 group (AAR < 3.35), the T2 group (3.35 ≤ AAR < 4.56), and the T3 group (AAR ≥ 4.56), respectively. Based on Kaplan–Meier curves, patients in the T3 group experienced higher rates of all-cause mortality and MACEs during follow-up than those in the T1 group (P < 0.0001) (Figure 3). According to the results of multivariable Cox regression analysis, AAR was found to be an independent risk factor for long-term all-cause mortality and MACEs, regardless of whether AAR was treated as a continuous variable or a categorical variable (Table 2 and Supplementary Table S3). In particular, when AAR was treated as a categorical variable, the T3 group had a higher risk of all-cause mortality [adjusted hazard ratio (HR): 1.64, 95% CI: 1.19–2.28, P = 0.003] as well as MACEs (adjusted HR: 1.58, 95% CI: 1.16–2.14, P = 0.003) compared with the T1 group (Table 2, Model 1). Similarly, the HRs for all-cause mortality and MACEs in different models were comparable when further adjusting for ALT (Table 2 and Supplementary Table S3, Model 2), insulin (Table 2 and Supplementary Table S3, Model 3), heart rate, and prior cardiac arrest (Table 2 and Supplementary Table S3, Model 4).
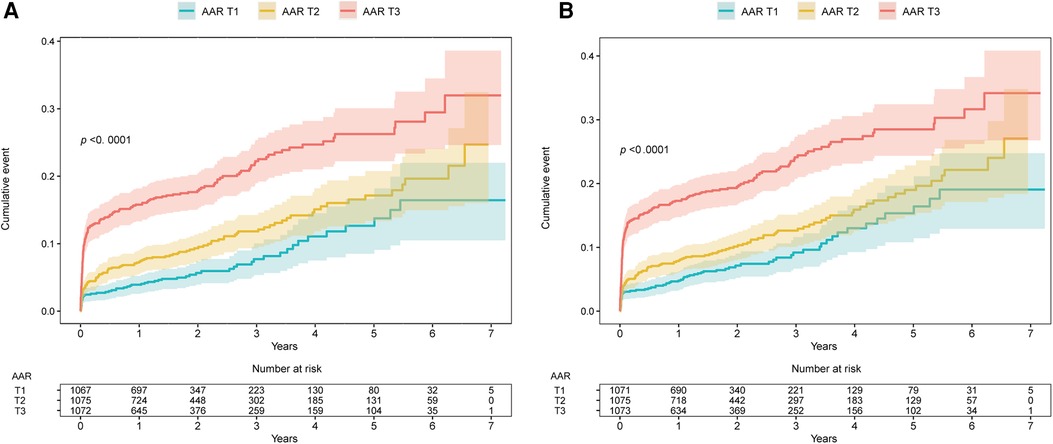
Figure 3. Kaplan–Meier survival curves for (A) long-term all-cause mortality and (B) long-term MACEs. AAR, admission-blood-glucose-to-albumin ratio; MACEs, major adverse cardiac events. AAR groups: T1, AAR value <3.35; T2, AAR value=3.35–4.56; T3, AAR value ≥4.56.
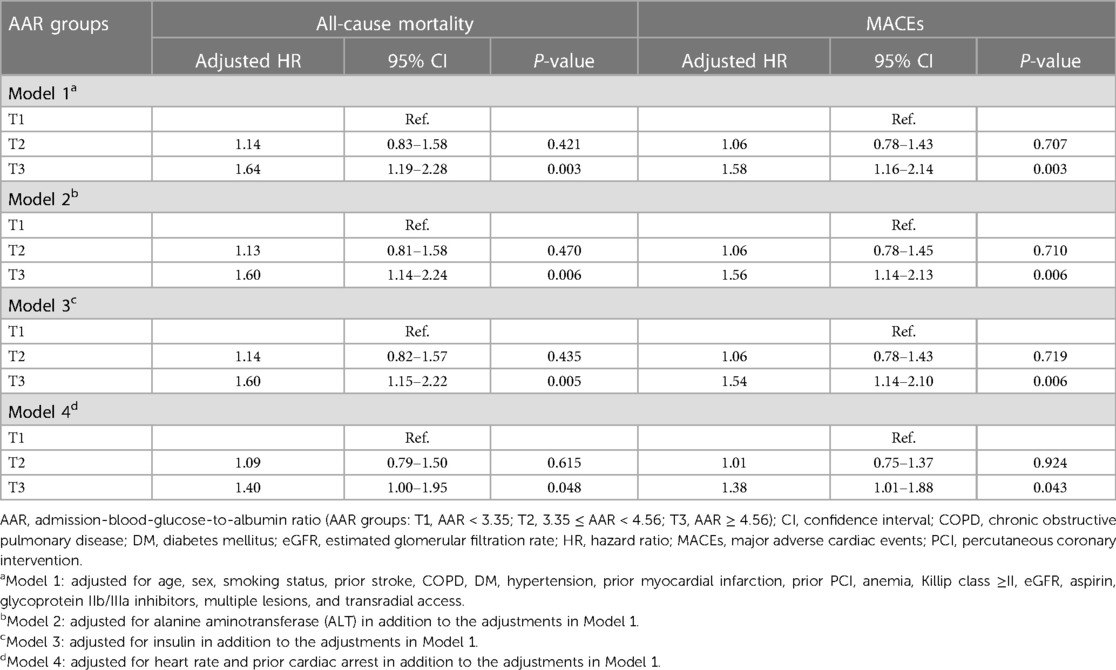
Table 2. Multivariable Cox regression analysis for all-cause mortality and MACEs during follow-up by AAR as a categorical variable.
This is the first study to demonstrate the prognostic value of AAR for STEMI patients undergoing PCI. The results showed that there was an independent correlation between AAR and all-cause mortality and between AAR and MACEs during both hospitalization and follow-up. Furthermore, a cut-off value of AAR >4.429 had good discriminative ability for in-hospital all-cause mortality.
Rapid advances in imaging and laboratory examinations have improved our understanding of the etiology of STEMI. Inflammation is a key regulator of plaque, and an exposed lipid core triggers thrombosis. Thrombo-inflammatory reaction also occurs at the site of stent implantation after PCI (12). DM is a metabolic disorder with increased risks of myocardial infarction and consequent complications. In diabetic patients with STEMI, hyperglycemia might lead to oxidative stress, endothelial dysfunction, platelet activation, coagulation disturbances, and restenosis (3, 22, 23). In line with this, adverse events are more likely to occur in STEMI patients with elevated admission blood glucose at a level that is higher than normal but lower than DM thresholds (regarded as pre-diabetes) (24, 25). Therefore, admission blood glucose level may have prognostic value for adverse outcomes in STEMI patients undergoing PCI (4–6).
In STEMI patients, an elevated blood glucose level at admission indicates abnormal glucose metabolism due to chronic DM/pre-diabetes, the stress of the acute illness, or both. The association between chronic hyperglycemia (mainly attributed to DM) and adverse outcomes in STEMI patients is well known. In addition, SIH can worsen the cardiovascular outcomes of patients with or without DM, especially the latter group (9). A possible explanation is that SIH may exacerbate STEMI progression due to oxidative stress and tissue injury, while chronic hyperglycemia in DM may provoke a “preconditioning phenomenon” in cells and tissues, in response to the injury induced by SIH (9, 26). Roberts et al. (27) proposed the stress hyperglycemia ratio (SHR), consisting of corrected absolute blood glucose and HbA1c levels, as an index for the determination of background glycemia. It has been reported that the SHR can reflect relative glycemia and is independently related to the risks of MACEs and mortality in STEMI patients (28, 29). Nevertheless, the sensitivity of the SHR may be reduced in some patients with extremely low HbA1c levels, such as those with anemia or those who have recently undergone blood transfusion. Therefore, another biomarker is required to reflect the baseline status of patients.
Albumin, the most abundant plasma protein with highly susceptible targets for post-translational modifications, not only reflects aspects of malnutrition status (such as anemia), but is also related to DM because of the associated glycation (11, 30, 31). The progression of chronic DM leads to decreased plasma albumin levels because increased glycated albumin serves as a neo-epitope that disturbs the immune response and contributes to albuminuria. Furthermore, glycometabolism dysfunction hinders albumin synthesis (11). In addition, low albumin level is associated with increased glycated albumin and HbA1c levels in patients with DM (32, 33), some of whom may have experienced non-fatal myocardial infarction (33). Therefore, albumin serves as the denominator in the AAR index, in order to correct for malnutrition status and background glycemia.
Albumin, which is associated with STEMI progression and its treatment, has prognostic value for STEMI. Serum albumin is a negative acute-phase protein and provides antioxidant protection during inflammatory reactions. Furthermore, albumin exerts an anti-thrombotic effect via inhibition of platelet function and an anti-coagulant effect via neutralization of factor Xa, both of which are associated with the development of STEMI and with a hypercoagulable state after PCI (30, 31). Although chronic malnutrition diseases, such as cancer and liver or kidney diseases, reduce serum albumin levels, the low serum albumin level seen in patients with acute critical illnesses, such as STEMI, is caused by the increased catabolism and decreased synthesis of albumin. Several previous studies have reported that serum albumin has predictive value for STEMI, and decreased albumin level is associated with adverse outcomes after acute myocardial infarction. Serum albumin at admission is negatively correlated with risk of in-hospital mortality (13–16, 34), long-term mortality (16), and new-onset heart failure (13, 16) in STEMI patients. In addition, Kurtul et al. (35) reported that no-reflow after primary PCI is independently predicted by a low serum albumin level in STEMI patients. These associations may be attributed to the impact of albumin on ischemic events (36, 37). Therefore, the characteristics and functions of albumin can be combined with those of admission blood glucose to provide a composite biomarker for prediction of the risk of STEMI and subsequent reperfusion treatment.
Our results indicate that AAR, as a composite index based on admission blood glucose and albumin levels, has excellent prognostic value for STEMI patients undergoing PCI. In terms of comparison of the value of the composite of two indicators with that of a single indicator (Supplementary Figure S1), the results revealed that AAR was most favored in terms of evaluation of the likelihood of adverse events. Furthermore, we can observe the effects of these two separate indicators at work in this composite indicator: for one thing, the relatively stable albumin component of the AAR can indeed buffer the effect of admission blood glucose, whose level is relatively dynamic; for another, the effect of albumin may play a more critical role in AAR-based evaluation. Furthermore, time heterogeneity was also considered in our study. In particular, our results indicated that the predictive value of AAR was not disrupted either by the fluctuations in glucose levels that occurs over the course of a day or by time heterogeneity over the 10-year span of the study. Without doubt, when clinicians consider the role of nutrition, DM, and SIH in STEMI, the composite indicator AAR can help them to evaluate the status of a patient, because it reflects malnutrition, hyperglycemic status, and thrombo-inflammatory reaction during STEMI and PCI treatment. In addition, both admission blood glucose and albumin levels are cheap, easily available, and widely tested in the emergency department, meaning that measuring AAR is practicable in such acute conditions. In conclusion, the application of AAR is clinically feasible and may improve the determination of STEMI risk level at an early stage, thereby guiding STEMI treatment, particularly in developing countries.
The present study has some limitations. First, this was an observational study and therefore had inevitable bias and confounding factors. However, we attempted to minimize the bias during analysis. Second, we focused on AAR in the Chinese population. Other populations should be included in future studies. Third, we did not analyze levels of glycated albumin. Finally, considering the fact that plasma glucose levels shift dynamically over the course of a day while albumin is relatively stable over the same period, although we performed subgroup analyses with subgroups whose measurements were collected during different time periods, it would be better to monitor the dynamic glucose level of these patients. Therefore, further studies should be conducted to evaluate the effects of dynamic changes in plasma glucose on the predictive value of AAR for clinical outcomes.
In STEMI patients undergoing PCI, AAR is an independent predictor of all-cause mortality and MACEs both in hospital and during follow-up. AAR can be measured easily and rapidly for risk stratification, especially in primary hospitals.
The raw data supporting the conclusions of this article will be made available by the authors, without undue reservation.
The studies involving humans were approved by the research ethics committee of Guangdong Provincial People's Hospital. The studies were conducted in accordance with the local legislation and institutional requirements. The participants provided their written informed consent to participate in this study.
PH, YL, and NT were involved in the conception and design of the study. YL and CD performed the statistical analyses. CZ, WeiC, and WC wrote the manuscript. HF, ZiL, LZ, ZeL WH, YL, and SP contributed to the data collection and interpretation. PH is the guarantor of this article and takes responsibility for the contents of the article, such as the integrity of the data and the accuracy of the data analysis. All authors critically revised successive drafts of the paper and approved the final version.
This work was supported by the Shuangqing Talent Program Project of Guangdong Provincial People's Hospital (grant nos. KJ012019084 and KJ012019095), the High-level Hospital Construction Project (grant no. DFJH2020021), Guangdong Provincial People's Hospital Clinical Research Fund (Y012018085), the Fundamental Research Funds for the Central Universities (grant no. 2022ZYGXZR039), and the Project of Administration of Traditional Chinese Medicine of Guangdong Province (20221007).
The authors declare that the research was conducted in the absence of any commercial or financial relationships that could be construed as a potential conflict of interest.
All claims expressed in this article are solely those of the authors and do not necessarily represent those of their affiliated organizations, or those of the publisher, the editors and the reviewers. Any product that may be evaluated in this article, or claim that may be made by its manufacturer, is not guaranteed or endorsed by the publisher.
The Supplementary Material for this article can be found online at: https://www.frontiersin.org/articles/10.3389/fcvm.2023.1132685/full#supplementary-material
1. Zhao D, Liu J, Wang M, Zhang X, Zhou M. Epidemiology of cardiovascular disease in China: current features and implications. Nat Rev Cardiol. (2019) 16(4):203–12. doi: 10.1038/s41569-018-0119-4
2. Ibanez B, James S, Agewall S, Antunes MJ, Bucciarelli-Ducci C, Bueno H, et al. 2017 ESC guidelines for the management of acute myocardial infarction in patients presenting with ST-segment elevation: the Task Force for the Management of Acute Myocardial Infarction in patients presenting with ST-segment elevation of the European Society of Cardiology (Esc). Eur Heart J. (2018) 39(2):119–77. doi: 10.1093/eurheartj/ehx393
3. Forbes JM, Cooper ME. Mechanisms of diabetic complications. Physiol Rev. (2013) 93(1):137–88. doi: 10.1152/physrev.00045.2011
4. Mone P, Gambardella J, Minicucci F, Lombardi A, Mauro C, Santulli G. Hyperglycemia drives stent restenosis in STEMI patients. Diabetes Care. (2021) 44(11):e192–3. doi: 10.2337/dc21-0939
5. Demarchi A, Cornara S, Somaschini A, Fortuni F, Mandurino-Mirizzi A, Crimi G, et al. Has hyperglycemia a different prognostic role in STEMI patients with or without diabetes? Nutr Metab Cardiovasc Dis. (2021) 31(2):528–31. doi: 10.1016/j.numecd.2020.09.005
6. Tran HV, Gore JM, Darling CE, Ash AS, Kiefe CI, Goldberg RJ. Hyperglycemia and risk of ventricular tachycardia among patients hospitalized with acute myocardial infarction. Cardiovasc Diabetol. (2018) 17(1):136. doi: 10.1186/s12933-018-0779-8
7. Capes SE, Hunt D, Malmberg K, Gerstein HC. Stress hyperglycaemia and increased risk of death after myocardial infarction in patients with and without diabetes: a systematic overview. Lancet. (2000) 355(9206):773–8. doi: 10.1016/s0140-6736(99)08415-9
8. Kosiborod M, Rathore SS, Inzucchi SE, Masoudi FA, Wang Y, Havranek EP, et al. Admission glucose and mortality in elderly patients hospitalized with acute myocardial infarction: implications for patients with and without recognized diabetes. Circulation. (2005) 111(23):3078–86. doi: 10.1161/CIRCULATIONAHA.104.517839
9. Bellis A, Mauro C, Barbato E, Ceriello A, Cittadini A, Morisco C. Stress-induced hyperglycaemia in non-diabetic patients with acute coronary syndrome: from molecular mechanisms to new therapeutic perspectives. Int J Mol Sci. (2021) 22(2):1–26. doi: 10.3390/ijms22020775
10. Don BR, Kaysen G. Serum albumin: relationship to inflammation and nutrition. Semin Dial. (2004) 17(6):432–7. doi: 10.1111/j.0894-0959.2004.17603.x
11. Bhat S, Jagadeeshaprasad MG, Venkatasubramani V, Kulkarni MJ. Abundance matters: role of albumin in diabetes, a proteomics perspective. Expert Rev Proteomics. (2017) 14(8):677–89. doi: 10.1080/14789450.2017.1352473
12. Bhatt DL, Lopes RD, Harrington RA. Diagnosis and treatment of acute coronary syndromes. Jama. (2022) 327(7):662–75. doi: 10.1001/jama.2022.0358
13. Gonzalez-Pacheco H, Amezcua-Guerra LM, Sandoval J, Martinez-Sanchez C, Ortiz-Leon XA, Pena-Cabral MA, et al. Prognostic implications of serum albumin levels in patients with acute coronary syndromes. Am J Cardiol. (2017) 119(7):951–8. doi: 10.1016/j.amjcard.2016.11.054
14. Kurtul A, Murat SN, Yarlioglues M, Duran M, Ocek AH, Koseoglu C, et al. Usefulness of serum albumin concentration to predict high coronary syntax score and in-hospital mortality in patients with acute coronary syndrome. Angiology. (2016) 67(1):34–40. doi: 10.1177/0003319715575220
15. Biccire FG, Pastori D, Tanzilli A, Pignatelli P, Viceconte N, Barilla F, et al. Low serum albumin levels and in-hospital outcomes in patients with ST segment elevation myocardial infarction. Nutr Metab Cardiovasc Dis. (2021) 31(10):2904–11. doi: 10.1016/j.numecd.2021.06.003
16. Oduncu V, Erkol A, Karabay CY, Kurt M, Akgun T, Bulut M, et al. The prognostic value of serum albumin levels on admission in patients with acute ST-segment elevation myocardial infarction undergoing a primary percutaneous coronary intervention. Coron Artery Dis. (2013) 24(2):88–94. doi: 10.1097/MCA.0b013e32835c46fd
17. Steg PG, James SK, Atar D, Badano LP, Blomstrom-Lundqvist C, Borger MA, et al. Esc guidelines for the management of acute myocardial infarction in patients presenting with ST-segment elevation. Eur Heart J. (2012) 33(20):2569–619. doi: 10.1093/eurheartj/ehs215
18. Levine GN, Bates ER, Blankenship JC, Bailey SR, Bittl JA, Cercek B, et al. 2011 ACCF/AHA/SCAI guideline for percutaneous coronary intervention: executive summary: a report of the American College of Cardiology Foundation/American Heart Association Task Force on practice guidelines and the society for cardiovascular angiography and interventions. Catheter Cardiovasc Interv. (2012) 79(3):453–95. doi: 10.1002/ccd.23438
19. Alba AC, Agoritsas T, Walsh M, Hanna S, Iorio A, Devereaux PJ, et al. Discrimination and calibration of clinical prediction models: users’ guides to the medical literature. Jama. (2017) 318(14):1377–84. doi: 10.1001/jama.2017.12126
20. Lu X, Fan Z, Liu A, Liu R, Lou X, Hu J. Extended inter-meal interval negatively impacted the glycemic and insulinemic responses after both lunch and dinner in healthy subjects. Nutrients. (2022) 14(17):1–15. doi: 10.3390/nu14173617
21. Hajime M, Okada Y, Mori H, Otsuka T, Kawaguchi M, Miyazaki M, et al. Twenty-four-hour variations in blood glucose level in Japanese type 2 diabetes patients based on continuous glucose monitoring. J Diabetes Investig. (2018) 9(1):75–82. doi: 10.1111/jdi.12680
22. Sethi SS, Akl EG, Farkouh ME. Diabetes Mellitus and acute coronary syndrome: lessons from randomized clinical trials. Curr Diab Rep. (2012) 12(3):294–304. doi: 10.1007/s11892-012-0272-9
23. Rios R JR, Franchi F, Rollini F, Angiolillo DJ. Diabetes and antiplatelet therapy: from bench to bedside. Cardiovasc Diagn Ther. (2018) 8(5):594–609. doi: 10.21037/cdt.2018.05.09
24. Khetan AK, Rajagopalan S. Prediabetes. Can J Cardiol. (2018) 34(5):615–23. doi: 10.1016/j.cjca.2017.12.030
25. Acar B, Ozeke O, Karakurt M, Ozen Y, Ozbay MB, Unal S, et al. Association of prediabetes with higher coronary atherosclerotic burden among patients with first diagnosed acute coronary syndrome. Angiology. (2019) 70(2):174–80. doi: 10.1177/0003319718772420
26. Dungan KM, Braithwaite SS, Preiser J-C. Stress hyperglycaemia. Lancet. (2009) 373(9677):1798–807. doi: 10.1016/s0140-6736(09)60553-5
27. Roberts GW, Quinn SJ, Valentine N, Alhawassi T, O'Dea H, Stranks SN, et al. Relative hyperglycemia, a marker of critical illness: introducing the stress hyperglycemia ratio. J Clin Endocrinol Metab. (2015) 100(12):4490–7. doi: 10.1210/jc.2015-2660
28. Xu W, Yang YM, Zhu J, Wu S, Wang J, Zhang H, et al. Predictive value of the stress hyperglycemia ratio in patients with acute ST-segment elevation myocardial infarction: insights from a multi-center observational study. Cardiovasc Diabetol. (2022) 21(1):48. doi: 10.1186/s12933-022-01479-8
29. Yang Y, Kim TH, Yoon KH, Chung WS, Ahn Y, Jeong MH, et al. The stress hyperglycemia ratio, an index of relative hyperglycemia, as a predictor of clinical outcomes after percutaneous coronary intervention. Int J Cardiol. (2017) 241:57–63. doi: 10.1016/j.ijcard.2017.02.065
30. Rozga J, Piatek T, Malkowski P. Human albumin: old, new, and emerging applications. Ann Transplant. (2013) 18:205–17. doi: 10.12659/AOT.889188
31. Fanali G, di Masi A, Trezza V, Marino M, Fasano M, Ascenzi P. Human serum albumin: from bench to bedside. Mol Aspects Med. (2012) 33(3):209–90. doi: 10.1016/j.mam.2011.12.002
32. Rodriguez-Segade S, Rodriguez J, Mayan D, Camina F. Plasma albumin concentration is a predictor of Hba1c among type 2 diabetic patients, independently of fasting plasma glucose and fructosamine. Diabetes Care. (2005) 28(2):437–9. doi: 10.2337/diacare.28.2.437
33. Succurro E, Andreozzi F, Carnevale R, Sciacqua A, Cammisotto V, Cassano V, et al. Nox2 up-regulation and hypoalbuminemia in patients with type 2 diabetes Mellitus. Free Radic Biol Med. (2021) 168:1–5. doi: 10.1016/j.freeradbiomed.2021.03.026
34. Schalk BW, Visser M, Bremmer MA, Penninx BW, Bouter LM, Deeg DJ. Change of Serum albumin and risk of cardiovascular disease and all-cause mortality: longitudinal aging study Amsterdam. Am J Epidemiol. (2006) 164(10):969–77. doi: 10.1093/aje/kwj312
35. Kurtul A, Ocek AH, Murat SN, Yarlioglues M, Demircelik MB, Duran M, et al. Serum albumin levels on admission are associated with angiographic No-reflow after primary percutaneous coronary intervention in patients with ST-segment elevation myocardial infarction. Angiology. (2015) 66(3):278–85. doi: 10.1177/0003319714526035
36. Basili S, Carnevale R, Nocella C, Bartimoccia S, Raparelli V, Talerico G, et al. Serum albumin is inversely associated with portal vein thrombosis in cirrhosis. Hepatol Commun. (2019) 3(4):504–12. doi: 10.1002/hep4.1317
Keywords: percutaneous coronary intervention, admission blood glucose, albumin, predictor, ST-segment elevation myocardial infarction
Citation: Zhen C, Chen W, Chen W, Fan H, Lin Z, Zeng L, Lin Z, He W, Li Y, Peng S, Zeng L, Duan C, Tan N, Liu Y and He P (2023) Association between admission-blood-glucose-to-albumin ratio and clinical outcomes in patients with ST-elevation myocardial infarction undergoing percutaneous coronary intervention. Front. Cardiovasc. Med. 10:1132685. doi: 10.3389/fcvm.2023.1132685
Received: 27 December 2022; Accepted: 16 August 2023;
Published: 7 September 2023.
Edited by:
Faisal Rahman, Johns Hopkins University, United StatesReviewed by:
Yuzhou Xue, Peking University Third Hospital, China© 2023 Zhen, Chen, Chen, Fan, Lin, Zeng, Lin, He, Li, Peng, Zeng, Duan, Tan, Liu and He. This is an open-access article distributed under the terms of the Creative Commons Attribution License (CC BY). The use, distribution or reproduction in other forums is permitted, provided the original author(s) and the copyright owner(s) are credited and that the original publication in this journal is cited, in accordance with accepted academic practice. No use, distribution or reproduction is permitted which does not comply with these terms.
*Correspondence: Yuanhui Liu bGl1eXVhbmh1aUBnZHBoLm9yZy5jbg== Pengcheng He Z2RocGMxMDBAMTI2LmNvbQ==
†These authors have contributed equally to this work
Disclaimer: All claims expressed in this article are solely those of the authors and do not necessarily represent those of their affiliated organizations, or those of the publisher, the editors and the reviewers. Any product that may be evaluated in this article or claim that may be made by its manufacturer is not guaranteed or endorsed by the publisher.
Research integrity at Frontiers
Learn more about the work of our research integrity team to safeguard the quality of each article we publish.