 Xujie Zhang
 Yumin Jiang2
 Fuyou Liang
95% of researchers rate our articles as excellent or good
Learn more about the work of our research integrity team to safeguard the quality of each article we publish.
Find out more
ORIGINAL RESEARCH article
Front. Cardiovasc. Med. , 13 July 2023
Sec. General Cardiovascular Medicine
Volume 10 - 2023 | https://doi.org/10.3389/fcvm.2023.1131962
This article is part of the Research Topic Methods in General Cardiovascular Medicine View all 12 articles
Background: Arterial Velocity-pulse Index (AVI) and Arterial Pressure-volume Index (API), measured by a brachial cuff, have been demonstrated to be indicative of arterial stiffness and correlated with the risk of cardiovascular events. However, the threshold values of AVI and API for screening increased arterial stiffness in the general population are yet to be established.
Methods: The study involved 860 subjects who underwent general physical examinations (M/F = 422/438, age 53.4 ± 12.7 years) and were considered to represent the general population in China. In addition to the measurements of AVI, API and brachial-ankle pulse wave velocity (baPWV), demographic information, arterial blood pressures, and data from blood and urine tests were collected. The threshold values of AVI and API were determined by receiver operating characteristic (ROC) analyses and covariate-adjusted ROC (AROC) analyses against baPWV, whose threshold for diagnosing high arterial stiffness was set at 18 m/s. Additional statistical analyses were performed to examine the correlations among AVI, API and baPWV and their correlations with other bio-indices.
Results: The area under the curve (AUC) values in ROC analysis for the diagnosis with AVI/API were 0.745/0.819, 0.788/0.837, and 0.772/0.825 (95% CI) in males, females, and all subjects, respectively. Setting the threshold values of AVI and API to 21 and 27 resulted in optimal diagnosis performance in the total cohort, whereas the threshold values should be increased to 24 and 29, respectively, in order to improve the accuracy of diagnosis in the female group. The AROC analyses revealed that the threshold values of AVI and API increased markedly with age and pulse pressure (PP), respectively.
Conclusions: With appropriate threshold values, AVI and API can be used to perform preliminary screening for individuals with increased arterial stiffness in the general population. On the other hand, the results of the AROC analyses imply that using threshold values adjusted for confounding factors may facilitate the refinement of diagnosis. Given the fact that the study is a cross-sectional one carried out in a single center, future multi-center or follow-up studies are required to further confirm the findings or examine the value of the threshold values for predicting cardiovascular events.
Arterial stiffness is a measure of the mechanical properties of the arterial wall, which determines the systolic and pulse pressures, thereby affecting the dynamic tension of arteries and the systolic load of the left ventricle (1). The stiffness of large elastic arteries increases progressively during aging as a consequence of wall thickening, changes in wall composition, and elastin degeneration (2). Many risk factors such as diabetes mellitus, hypertension, obesity, smoking, and kidney disease can accelerate arterial stiffening (3, 4). The value of arterial stiffness in predicting the risk of cardiovascular events has been extensively proven in both clinical and community-based cohorts (5–8). Moreover, the benefits of using arterial stiffness indices to guide the treatment of hypertension have also been demonstrated (9).
Over the past few decades, various non-invasive techniques for measuring arterial stiffness have been proposed. Among them, pulse wave velocity (PWV) measurement is widely accepted as the “standard” method due to its clear biophysical meaning (10–12). Two commonly used global PWV metrics are carotid-femoral PWV (cfPWV) and brachial-ankle PWV (baPWV) (10, 13). In eastern Asia, baPWV has been more widely used than cfPWV, enabling the accumulation of a large amount of data on the clinical implications of baPWV. Moreover, there are other arterial stiffness indices, such as carotid intima-media thickness (Carotid IMT), augmentation index (AIx), and cardio-ankle vascular index (CAVI), that have been proved to have potential clinical value (14–19). However, their applications in routine clinical practice remain challenging due to technical or economic reasons. Table 1 summarizes the strengths and limitations of various existing arterial stiffness indices. In this context, economically feasible and easier-to-use devices are desired. Such devices may facilitate routine screening for increased arterial stiffness in larger populations, thereby guiding the implementation of preventive interventions for individuals at an increased risk of cardiovascular disease (35, 36).
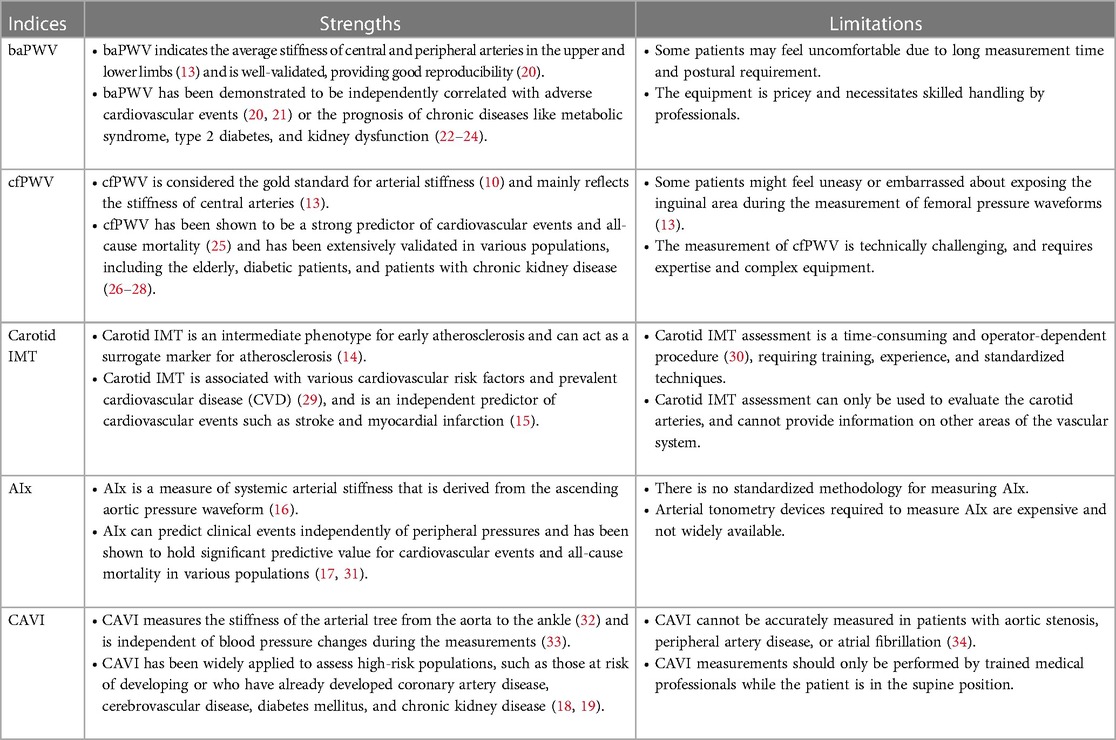
Table 1. Strengths and limitations of various arterial stiffness indices.
PASESA AVE-2000 (DAIWA Healthcare, Shenzhen, China) offers a fully automatic and rapid measurement of arterial stiffness, which can be easily implemented by clinicians or even by patients themselves. The compact and economical design of the device, which uses a single oscillatory brachial cuff to noninvasively measure physiological signals, makes it ideal for routine clinical use. The device provides two arterial stiffness indices, Arterial Velocity-pulse Index (AVI) and Arterial Pressure-volume Index (API), which respectively reflect the stiffness of the central arteries and brachial artery. The potential clinical value of AVI and API has been confirmed by many clinical studies. For example, AVI and/or API have been found to be significantly correlated with major adverse cardiac events during follow-up of outpatients (37), associated with the Framingham cardiovascular disease risk score in both outpatients and the general population (38, 39), and predicative of early coronary artery atherosclerosis in patients with suspected coronary disease (40) and cardiovascular risk in hypertensive patients (41). These studies demonstrated the clinical implications of AVI and API, but did not provide threshold values for identifying subjects with abnormally high arterial stiffness in the general population. Therefore, the main purpose of this study was to fill this gap. For this purpose, we collected data from adult participants who underwent a general health check at the physical examination center. The study cohort was comprised of individuals aged in a large range, including both healthy subjects and patients with cardiovascular diseases, and was therefore considered to be representative of the general population in China. The threshold values of AVI and API for diagnosing high arterial stiffness were determined by using baPWV as the reference. The results demonstrated that given proper threshold values, AVI and API could be utilized to identify individuals with increased arterial stiffness. On the other hand, the threshold values were gender-dependent and considerably affected by certain confounding factors.
A total of 860 subjects, who were aged between 20 and 91 years and visited the physical examination center of Shanghai Sixth People's Hospital for a general health check, were recruited. The study was approved by the ethics committee of the hospital. Each participant provided written informed consent after receiving detailed information about the study's goals and procedures. Before data collection, each participant completed a written questionnaire about their medical history, including hypertension, major cardiovascular diseases, type 2 diabetes mellitus, any other cardiovascular-related abnormalities, and medications. Notably, participants without any reported diseases on the questionnaire were categorized into a disease group if their health check results indicated the presence of cardiovascular-related diseases. In this study, healthy subjects were those who did not suffer from hypertension, type 2 diabetes mellitus, dyslipidemia, obesity, or other cardiovascular diseases based on the questionnaire and health check report.
The measurements of AVI, API and baPWV were conducted in a separate room with a controlled environmental temperature of approximate 25°C. Each participant was asked to rest for at least 10 min before the measurements were taken. Firstly, AVI and API were measured together with brachial systolic pressure, diastolic pressure, and heart rate, in a sitting position using a commercial medical device (PASESA AVE-2000, DAIWA Healthcare, Shenzhen, China). Subsequently, the participant was asked to rest in a supine position for at least 5 min, and then baPWV was measured using BP-203RPEIII (Omron, Dalian, China). The reliability and validity of the baPWV device have been confirmed by a previous study (20). In this study, a baPWV of >18 m/s, as recommended in the guidelines for non-invasive vascular function tests (42), was adopted as the threshold for diagnosing high arterial stiffness. Hereafter, we briefly introduce the measuring principles of AVI and API.
AVI is calculated by analyzing the oscillation waves measured by a brachial cuff operating under high-pressure conditions (higher than the brachial systolic pressure). Figure 1 illustrates the cuff oscillation waves and their first-order differentials measured in a middle-aged subject and an old subject, respectively. It can be observed that the second valley of the differentiated cuff oscillation wave in the old subject is lower than that in the middle-aged subject, whereas the peak is comparable between the two subjects. AVI is defined as the ratio of the magnitude of the second valley (|V2|) to that of the peak (|P|) multiplied by a constant (A).
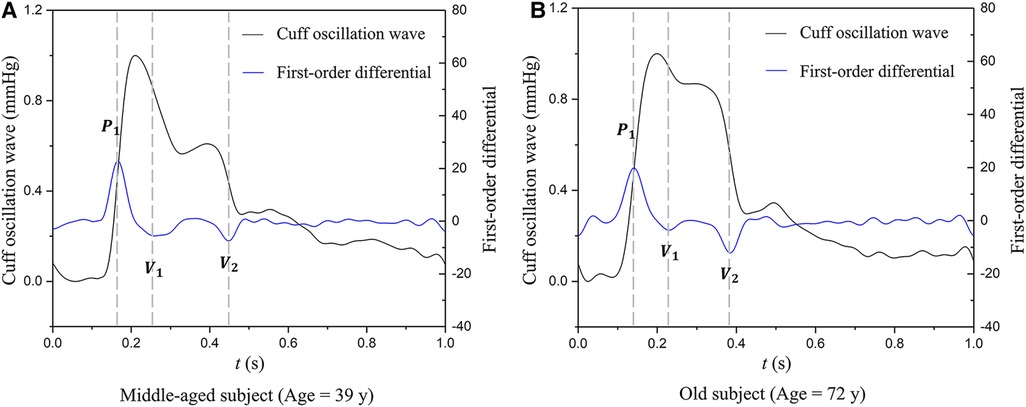
Figure 1. Examples of cuff oscillation waves (measured when the cuff operating pressure is higher than the brachial systolic pressure) and their first-order differentials used to calculate AVI: (A) data of a middle-aged subject, (B) data of an old subject. P1, the first peak; V1, the first valley; V2, the second valley.
API is calculated by analyzing the time series cuff oscillation waves monitored during the decrease of cuff pressure from a supra-systolic pressure level to a value lower than the diastolic pressure (43). The measuring principle is based on the biomechanical mechanism that the shape of the transmural pressure-area (or volume) curve of an artery is mainly determined by the stiffness of arterial wall when the transmural pressure is varied over a wide range. To construct this curve using noninvasively measured cuff signals, the following procedure was implemented: (1) digitally filter the original cuff pressure data to extract the time series baseline cuff pressure and oscillation component (i.e., oscillation waves) (Figure 2A); (2) construct the envelope curve based on the amplitudes of oscillation waves and estimate brachial blood pressures (Figure 2B); (3) calculate the local slopes of the cuff pressure—arterial volume characteristic curve (Figure 2C); and (4) reconstruct the arterial transmural pressure—volume characteristic curve by numerically integrating the slopes obtained in step 3) (Figure 2D). Finally, an arctangent function was used to fit the curve.
where the reciprocal of b was taken as an indirect measure of the vascular wall stiffness under low transmural pressure conditions. API is defined as
where X is a constant used to scale up the magnitude of API.
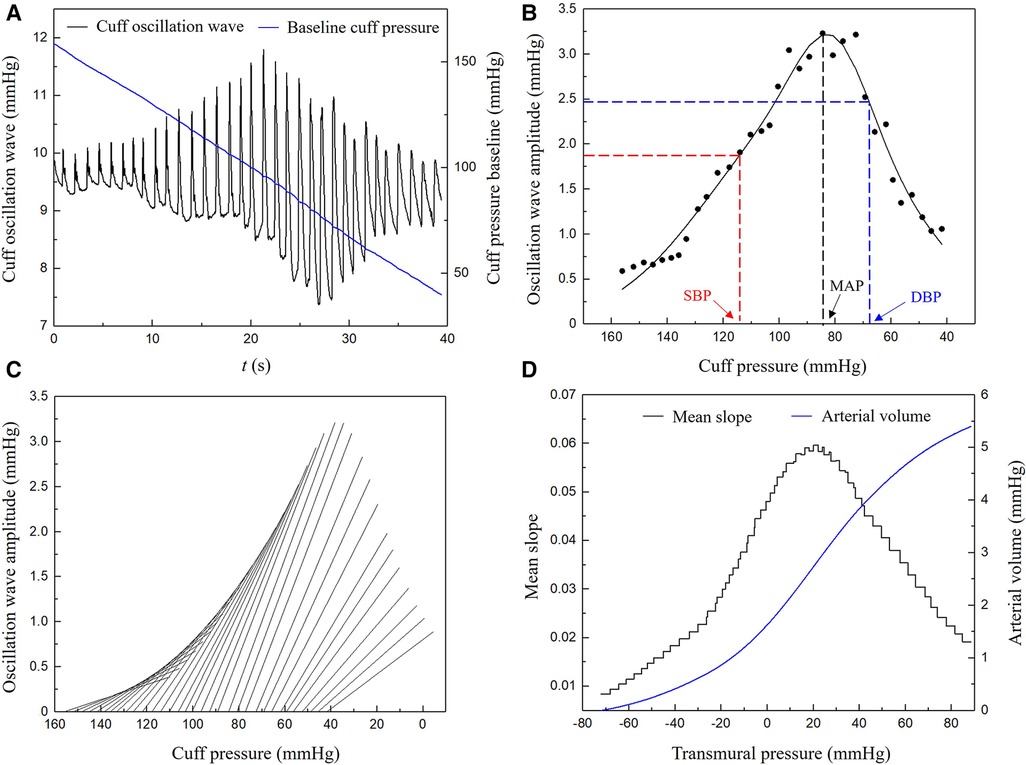
Figure 2. Procedure of deriving a pressure-vascular volume characteristic curve from measured time series cuff pressure: (A) baseline cuff pressure and cuff oscillation wave, (B) envelope curve and the estimation of brachial blood pressures, (C) local slopes of the cuff pressure-arterial volume characteristic curve, (D) arterial transmural pressure-volume characteristic curve. SBP, systolic blood pressure; DBP, diastolic blood pressure; MAP, mean blood pressure.
For a more detailed introduction of the measuring principles of AVI and API, please refer to the Supplementary Material.
All participants had their height and weight measured, and their body mass indices (BMIs) were calculated to evaluate obesity. Blood samples were collected for laboratory examinations of indices considered to be related to diabetes mellitus or cardiovascular diseases, including fasting plasma glucose (FPG), glycated hemoglobin (HbA1c), total cholesterol (TC), triglycerides (TG), high-density lipoprotein cholesterol (HDL-C) and low-density lipoprotein cholesterol (LDL-C). The lipoprotein ratios (TC/HDL-C, LDL-C/HDL-C) were also calculated. In addition, urine samples were analyzed for microalbumin (UMAlb).
Baseline characteristics were presented separately for the male, female and pooled groups in form of either median and interquartile range or percentage. Statistical analyses were implemented in SPSS 24. Comparison of percentage values was performed using the Chi-square test. When comparing the quantitative data between the male and female groups, the student's t-test was employed if the data conform to a normal distribution, otherwise, the Mann–Whitney U-test was performed. Pearson or Spearman rank correlation analysis was applied to evaluate the correlations among AVI, API, baPWV and their correlations with other variables based on the results of normality test. The stepwise multiple linear regression analyses were carried out to evaluate the independent associations of AVI, API, baPWV with other bio-indices. Moreover, receiver-operating characteristic (ROC) curve analyses and covariate-adjusted ROC (AROC) analyses (44) were carried out to seek for the threshold values of AVI and API, where the sum of sensitivity and specificity was used as the criterion for evaluating diagnosis performance. Statistical significance was defined as p < 0.05.
Table 2 shows the diagnostic criteria for diseases and the disease-specific distributions of participants. The proportions of hypertension and type 2 diabetes in the study cohort were comparable to the prevalence of these diseases in Chinese adults as reported in the “2019 Report on Cardiovascular Health and Diseases in China and a national cross-sectional study on diabetes” (45) (hypertension: 30.8% vs. 33.5%; type 2 diabetes: 11.5% vs. 12.8%). Hence, the subjects involved in our study are roughly representative of the general Chinese population. The 860 participants constituted a pooled group, which was further divided into the male and female groups. The characteristics of participants in the three groups are presented in Table 3. There were no significant differences in demographic data between the male and female groups, except for BMI, DBP, MAP and HR. Serum lipid indices differed significantly between the male and female groups, with females having higher TC and HDL-C, and lower TG and lipoprotein ratios (TC/HDL-C, LDL-C/HDL-C). Overall, the proportion of females with dyslipidemia was much smaller than that of males. In addition, males had a significantly higher prevalence of hypertension and type 2 diabetes mellitus compared to females. If the subjects with hypertension were divided into the treated and untreated subgroups, SBP [139.96 ± 19.20 vs. 146.78 ± 17.69 (mmHg), p = 0.002], MAP [100.04 ± 16.49 vs. 104.41 ± 12.89 (mmHg), p = 0.031] and the three arterial stiffness indices [baPWV: 16.63 ± 3.23 vs. 17.74 ± 3.69 (m/s), p = 0.005; AVI: 21.81 ± 7.95 vs. 26.46 ± 8.64, p < 0.0001; API: 29.79 ± 8.06 vs. 32.69 ± 7.44, p < 0.0001] were all slightly lower in the treated subgroup, indicating the role of antihypertensive treatment in reducing arterial stiffness.
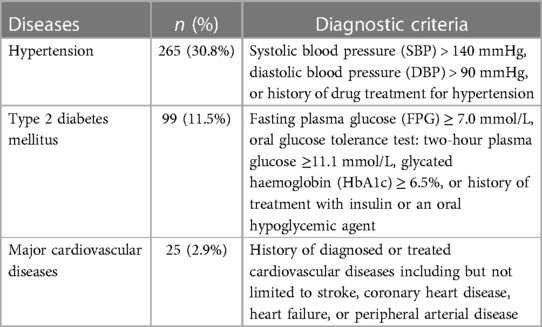
Table 2. Distributions of diseases in the studied population.

Table 3. Characteristics of the studied subjects.
The Mann–Whitney U-test was performed to compare AVI, API and baPWV between the male and female groups in different age brackets. The mean values and standard deviations (SDs) of the arterial stiffness indices grouped by sex and age brackets are presented in Figure 3. AVI, API and baPWV all increased with age. In the age bracket of <40 years, the mean values of AVI and API in the female group were significantly lower than those in the male group (AVI: p < 0.0001, API: p = 0.03), and the mean values of baPWV in the female group remained lower than those in the male group until the age increased over 50 years (<40 years: p < 0.0001, 40–49 years: p < 0.0001). In the age brackets of >50 years, all the arterial stiffness indices increased more rapidly with age in the female group, leading to obviously higher AVI, API and baPWV in older females.
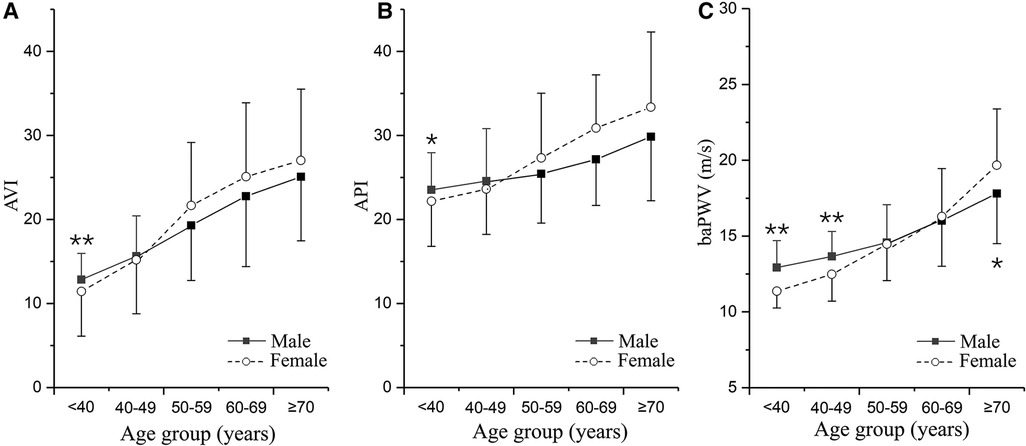
Figure 3. Changes in arterial stiffness indices with age differentiated by sex: (A) AVI, (B) API, and (C) baPWV. The plotted data are the means and standard deviations of arterial stiffness indices in different age groups. The numbers of males and females in the five age groups are as follows: <40 years, n = 56/49; 40–49 years, n = 116/116; 50–59 years, n = 113/130; 60–69 years, n = 96/100; and ≥70 years, n = 41/43. *p < 0.05, **p < 0.01 vs. male group.
In this study, since all datasets did not exhibit a strict normal distribution, the Spearman correlation analysis was performed in conjunction with Bonferroni correction for p-value thresholds to examine the pairwise correlations among AVI, API and baPWV, and their correlations with other bio-indices in the male, female and pooled groups, respectively. Figure 4 presents the results in the form of a heat map where gradually changing colors denote the strength of correlation while the white color indicates the lack of a statistically significant correlation between two indices. Herein, the statistical significance was defined as p < 0.00263 (0.05/n, where n denotes the number of selected variables in Bonferroni correction).
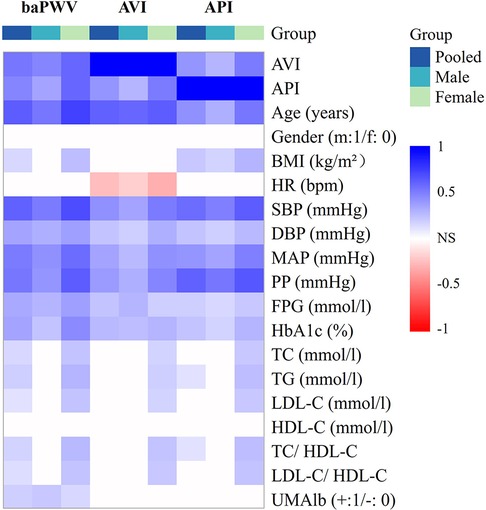
Figure 4. Heat map of the correlations among arterial stiffness indices and their correlations with other bio-indices.
AVI and API were both positively correlated with baPWV, and the correlations were especially strong in the female group. AVI, API and baPWV were most strongly correlated with age, PP, and age & SBP, respectively (r > 0.6) in the pooled population, and the strong correlations were more evident in the female group. The stepwise multiple regression analysis was carried out to further identify the associated factors of AVI, API and baPWV for the male, female and pooled groups, respectively. The results showed that SBP, age, HR and FPG were positively associated with baPWV in all groups, gender and TG were positively associated with baPWV in the pooled group, whereas UMA1b was associated with baPWV only in the male group. Age, MAP and HR were the main relevant factors of AVI, and FPG was associated with AVI only in the male group. PP, BMI and age were significantly associated with API in the male group, whereas PP, age, SBP and HDL-C were significantly associated with API in the female group (Table 4).
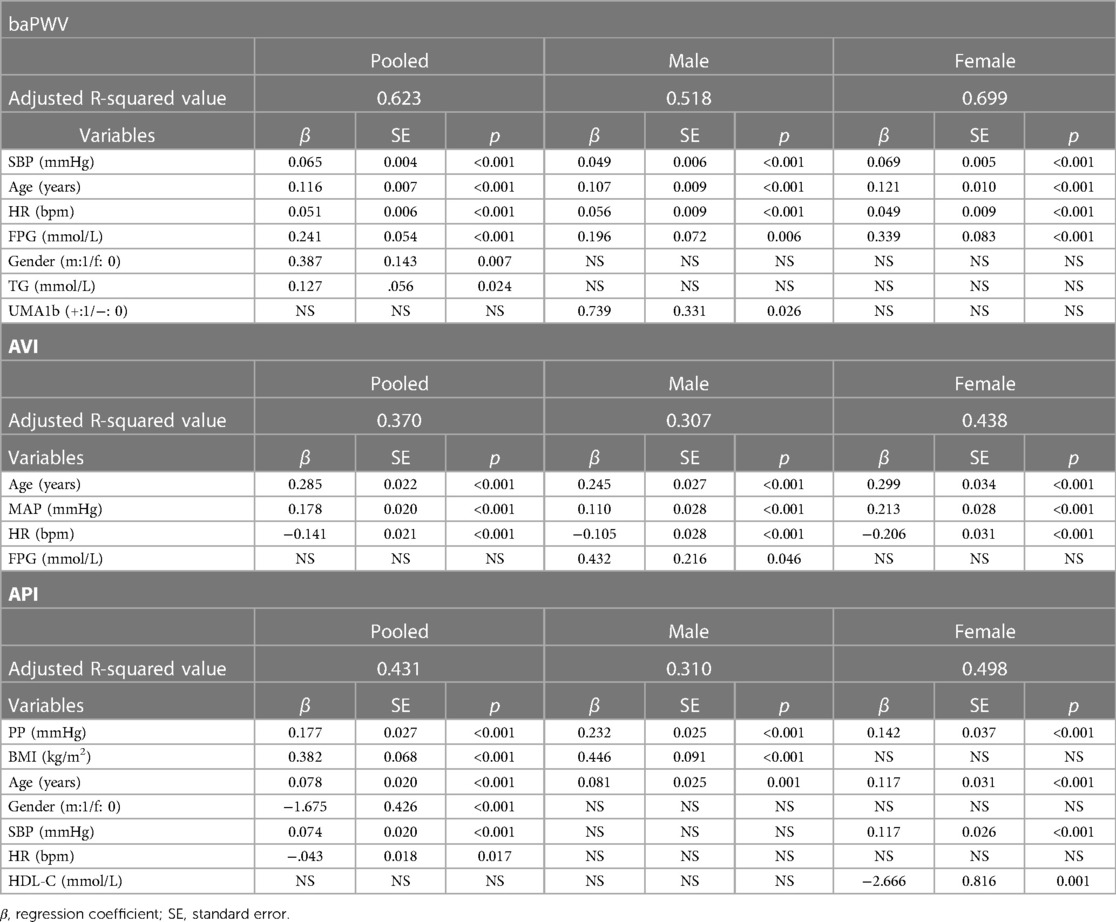
Table 4. Results of stepwise multiple regression analysis for arterial stiffness indices with respect to bio-indices.
In order to determine the optimal threshold values of AVI and API for diagnosing high arterial stiffness, we took the results of diagnosis with baPWV as the reference to perform ROC analysis. In consideration of potential sex differences, the threshold values of AVI and API were determined separately for the male, female and pooled groups. Figure 5 plots the results of ROC analyses with optimized threshold values of AVI and API, and the quantitative data are summarized in Table 5. The values of AUC (95% CI) for diagnosis with AVI/API were 0.745/0.819, 0.788/0.837, and 0.772/0.825 in males, females, and all subjects, respectively. In all groups, the larger AUC values of API indicate its better diagnosis performance than AVI, which can also be judged from the ROC curves plotted in Figure 5. In addition, the threshold values of AVI and API were both larger in females than in males, which led to mildly improved diagnosis performance for the female group. Furthermore, we carried out covariate-adjusted ROC (AROC) analysis (44) to investigate the influences of confounding factors (those identified by the multiple regression analysis for AVI or API). We set two confounding factors associated most closely with AVI or API as covariates and analyzed the data of the pooled group only. Figure 6 shows that the threshold values of AVI and API changed markedly with the variations in covariate values. Specifically, the threshold value of AVI increased markedly with age and moderately with MAP, whereas the threshold value of API increased evidently with PP and mildly with BMI.
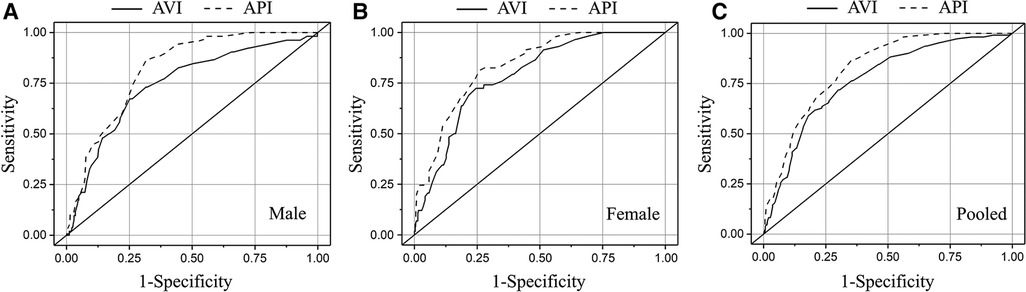
Figure 5. Results of ROC analyses on the diagnosis performances of AVI and API in different groups: (A) male, (B) female, and (C) pooled.
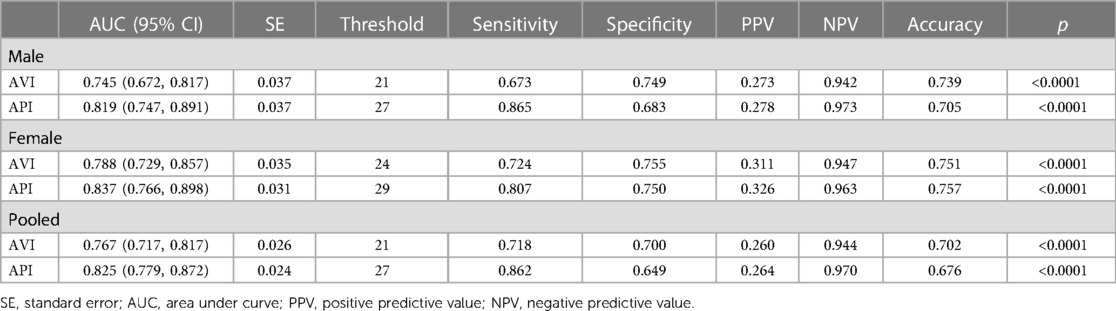
Table 5. Threshold values of AVI and API and the corresponding results of ROC analysis on the diagnosis performance.
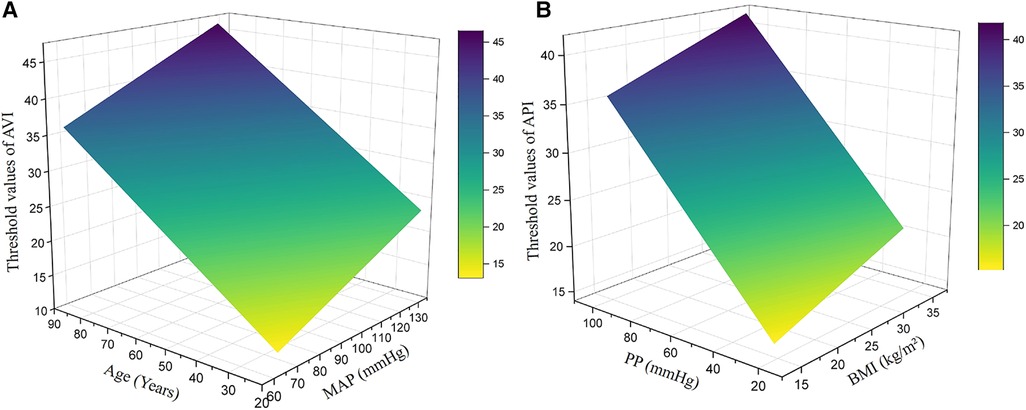
Figure 6. Threshold values of AVI and API in the pooled group after adjustment for major covariates: (A) AVI, (B) API. The major covariates were age and MAP for AVI, and PP and BMI for API.
Increased arterial stiffness, an important risk factor for cardiovascular diseases, remains under-diagnosed in the general population. Despite the existence of well-validated devices for measuring arterial stiffness indices such as baPWV or cfPWV, these devices are usually costly, require professional operations, and take over 10 min to complete measurement, which significantly hampers their wide use in routine medical practice. The present study attempted to determine the threshold values of arterial stiffness indices (i.e., AVI and API) measured by a cuff-based device (PASESA AVE-2000) in the general Chinese population by referring to the diagnosis results with baPWV. The threshold values of AVI and API giving rise to optimal diagnosis performance (evaluated by AUC values in ROC analysis) in the entire cohort were found to be 21 and 27, respectively, with corresponding AUC values of 0.767 and 0.825. If evaluated separately for the female and male groups, the diagnosis performances could be slightly improved in the female group if the threshold values of AVI and API were increased to 24 and 29, respectively. These results imply that AVI and API measured by the cuff-based device have the potential to be used as substitutes for baPWV in the assessment of arterial stiffness. In particular, since the device is portable and easy to use like a general blood pressure device, it may be employed to perform large-scale screening for individuals with high arterial stiffness in daily medical activities. Given the well-established value of arterial stiffness in predicting cardiovascular events, early diagnosis of high arterial stiffness would help initiate early preventative interventions (e.g., changes in lifestyle or medical treatment) that have been widely recognized as cost-effective strategies for reducing the risk of cardiovascular diseases (46, 47). AVI and API may also be used as complementary bio-indices for ambulatory PWV and ambulatory blood pressure (ABP), which can be measured outside the hospital and have been proved to have specific value in evaluating antihypertensive treatment or identifying individuals with an increased cardiovascular risk (48, 49), to strengthen the reliability of diagnosis.
Previous clinical studies have demonstrated the potential of threshold values of AVI and API for stratifying the cardiovascular risk of patients. For instance, setting the threshold value of AVI to 27 was found capable of predicting major adverse cardiac events (MACEs) in outpatients in Japan (37). In Japanese patients suffering from heart failure with preserved ejection fraction (HFpEF), AVI > 30 was predictive of high E/e′ ratio and high levels of high-sensitivity cardiac troponin T (hs-cTnT) (50). With respect to API, patients with API > 32 were found to suffer from a significantly increased risk of MACEs during a mean follow-up period of 769 ± 275 days (37). Similarly, a study on Chinese hypertensive patients with HFpEF (41) demonstrated that an increase in AVI over 27 or API over 31 was associated with an increased risk of total cardiovascular events during follow-up. In our study, the relatively low threshold values of AVI and API may be explained by the following reasons: (1) we used baPWV > 18 m/s as the criterion for judging high arterial stiffness, which is associated with but not equivalent to the risk of cardiovascular events, and (2) our study was focused on the general population whose heath conditions are overall better than those of the outpatients investigated by previous studies. Nevertheless, adopting relatively conservative threshold values for AVI and API may facilitate the identification of individuals with potential cardiovascular risk from the general population for whom early preventive interventions would be especially necessary and beneficial.
Our study demonstrated that AVI and API differed evidently between females and males, especially with respect to their changes with age and the threshold values. While the threshold values of AVI and API in the male group were the same with those determined for the entire cohort, they were 3 and 2 units higher respectively in the female group. Accordingly, the diagnosis performance in the female group was slightly improved if higher threshold values of AVI and API were used (see Table 5), which implies that adopting gender-specific threshold values for AVI and API may facilitate more accurate identification of females with abnormally high arterial stiffness. The results may be explained by the different sensitivities of AVI, API and baPWV to age between females and males. As shown in Figure 3, AVI and API increase more rapidly with age in females than in males, especially when ages are higher than 50 years. Such gender differences are also observed for baPWV, but are relatively small. Mechanisms underlying the observations are complex and may involve multiple factors. Hormones, especially estrogen, play an important role in modulating arterial stiffness. Estrogen has been found to stimulate the release of nitric oxide, thereby contributing to improving the elasticity of blood vessels and reducing arterial stiffness (51, 52). However, the protective role of estrogen is markedly attenuated in postmenopausal women (aged over 45–55 years) (53) due to decreased estrogen secretion, causing arterial stiffness to increase rapidly with age (54, 55). It has been found that isolated systolic hypertension (ISH) preferentially affects old women (56), which may also contribute to the increase of arterial stiffness via its roles in promoting vascular thickening and fibrosis (57). In addition, aged women are more susceptible to the decrease in muscle mass and accumulation of visceral fat, both of which have been proved to be associated with increased arterial stiffness in postmenopausal women (58, 59). These factors underline the need to take gender-related characteristics into account when diagnosing and managing arterial stiffness.
Many bio-indices were found to be correlated with AVI and API, which could be confounding factors compromising the validity of the threshold values of AVI and API determined by the general ROC analysis. To address the issue, we performed covariate-adjusted ROC (AROC) analyses on the pooled group, with major confounding factors identified by the multiple regression analysis being set as the covariates. The results revealed that age and PP were the two confounding factors that most evidently affect the threshold values of AVI and API, respectively. Specifically, the higher the age and PP were, the higher the adjusted threshold values of AVI and API became. The influence of age on the threshold value of AVI can be explained by the high sensitivity of AVI to age as indicated by the data presented in Figure 3A. As for PP, it significantly affects the threshold value of API because PP is a variable directly involved in the calculation of API (43). Therefore, adopting confounding factor-adjusted threshold values for AVI and API may be beneficial to the refinement of diagnosis. For instance, using higher threshold values for aged individuals with naturally high arterial stiffness and individuals with high brachial PP due to physiological rather than pathological factors can reduce the risk of misdiagnosis that might lead to unnecessary interventions or treatments. Despite the potential benefits, using threshold values adjusted for various confounding factors to perform diagnosis for large populations in routine medical practice could be challenging, as it significantly increases the complexity and time required for data collection and classification. In fact, current clinical guidelines or expert consensuses often recommend the use of a single threshold value for each physiological index, such as blood pressure or arterial stiffness.
The study has some potential limitations. Firstly, it was conducted in a single center and involved a relatively small population. In particular, the diagnostic accuracy of AVI and API using the threshold values was not validated in an independent sample, and hence the generalizability of our findings to other populations remains unclear. Secondly, the study, as a cross-sectional one, could not address the usefulness of the threshold values in predicting future cardiovascular events. To address the limitations, future multi-center or follow-up studies on larger populations would be required. Thirdly, in comparison with baPWV, cfPWV and carotid intima-media thickness (IMT) can provide a more specific assessment of central arterial stiffness, and hence may be better comparators of AVI. However, their measurements were not available in the physical examination center where we collected the data, and this limitation might be addressed in our future studies by introducing cfPWV devices and collaborating with clinicians in the ultrasound department. Fourthly, we fixed the threshold value of baPWV at 18 m/s for diagnosing high arterial stiffness. However, different threshold values of baPWV have been proposed in the literature (60–63). Therefore, it remains debatable whether choosing a different threshold value for baPWV might yield a more reasonable determinant for the threshold values of AVI and API.
The threshold values of AVI and API measured by a cuff-based device for diagnosing high arterial stiffness in the general Chinese population have been established through comparisons with baPWV. The performances of diagnosis (evaluated by AUC) were basically acceptable (AUC > 0.76 with AVI, and AUC > 0.82 with API) in the pooled group, which could be further improved if gender-specific threshold values were applied to the female group. In the meantime, the study revealed that age and PP had significant influences on the threshold values of AVI and API, respectively, indicating the potential of using confounding factor-adjusted threshold values to refine diagnosis. On the other hand, the findings of the study are limited by the relatively small sample and absence of follow-up data, which would be addressed by future multi-center or follow-up studies on larger populations.
The original contributions presented in the study are included in the article/Supplementary Material, further inquiries can be directed to the corresponding authors.
The studies involving human participants were reviewed and approved by the Ethics Committee of Shanghai Sixth People's Hospital. The patients/participants provided their written informed consent to participate in this study.
XZ, FL, and JL contributed to conception and design of the study. FL and JL provided administrative support. FL and JL provided study materials and samples. XZ and YJ contributed to collection and assembly of data. XZ and YJ performed the data analysis and interpretation. All authors contributed to the article and approved the submitted version.
This study was partly supported by a grant from the National Natural Science Foundation of China (12061131015) and the Interdisciplinary Program of Shanghai Jiao Tong University (grant No. YG2019ZDA03). FL was supported in part by the Ministry of Science and Higher Education of the Russian Federation within the framework of state support for the creation and development of World-Class Research Centers, “Digital biodesign and personalized healthcare” No. 075-15-2022-304.
The authors declare that the research was conducted in the absence of any commercial or financial relationships that could be construed as a potential conflict of interest.
All claims expressed in this article are solely those of the authors and do not necessarily represent those of their affiliated organizations, or those of the publisher, the editors and the reviewers. Any product that may be evaluated in this article, or claim that may be made by its manufacturer, is not guaranteed or endorsed by the publisher.
The Supplementary Material for this article can be found online at: https://www.frontiersin.org/articles/10.3389/fcvm.2023.1131962/full#supplementary-material
1. Liang F, Takagi S, Himeno R, Liu H. Biomechanical characterization of ventricular–arterial coupling during aging: a multi-scale model study. J Biomech. (2009) 42(6):692–704. doi: 10.1016/j.jbiomech.2009.01.010
2. Lee HY, Oh BH. Aging and arterial stiffness. Circ J. (2010) 74(11):2257–62. doi: 10.1253/circj.CJ-10-0910
3. Laurent S, Boutouyrie P, Asmar R, Gautier I, Laloux B, Guize L, et al. Aortic stiffness is an independent predictor of all-cause and cardiovascular mortality in hypertensive patients. Hypertension. (2001) 37(5):1236–41. doi: 10.1161/01.HYP.37.5.1236
4. Chirinos JA. Arterial stiffness: basic concepts and measurement techniques. J Cardiovasc Transl Res. (2012) 5(3):243–55. doi: 10.1007/s12265-012-9359-6
5. Mattace-Raso FU, van der Cammen TJ, Hofman A, van Popele NM, Bos ML, Schalekamp MA, et al. Arterial stiffness and risk of coronary heart disease and stroke: the rotterdam study. Circulation. (2006) 113(5):657–63. doi: 10.1161/CIRCULATIONAHA.105.555235
6. Tomiyama H, Koji Y, Yambe M, Shiina K, Motobe K, Yamada J, et al. Brachial-ankle pulse wave velocity is a simple and independent predictor of prognosis in patients with acute coronary syndrome. Circ J. (2005) 69(7):815–22. doi: 10.1253/circj.69.815
7. Boutouyrie P, Chowienczyk P, Humphrey JD, Mitchell GF. Arterial stiffness and cardiovascular risk in hypertension. Circ Res. (2021) 128(7):864–86. doi: 10.1161/CIRCRESAHA.121.318061
8. Zhou Z, Xing AJ, Zhang JN, Xia WH, Su C, Xu SY, et al. Hypertension, arterial stiffness, and clinical outcomes: a cohort study of Chinese community-based population. Hypertension. (2021) 78(2):333–41. doi: 10.1161/HYPERTENSIONAHA.121.17131
9. Laurent S, Chatellier G, Azizi M, Calvet D, Choukroun G, Danchin N, et al. Sparte study: normalization of arterial stiffness and cardiovascular events in patients with hypertension at medium to very high risk. Hypertension. (2021) 78(4):983–95. doi: 10.1161/HYPERTENSIONAHA.121.17579
10. Laurent S, Cockcroft J, Van Bortel L, Boutouyrie P, Giannattasio C, Hayoz D, et al. Expert consensus document on arterial stiffness: methodological issues and clinical applications. Eur Heart J. (2006) 27(21):2588–605. doi: 10.1093/eurheartj/ehl254
11. Liang F, Takagi S, Himeno R, Liu H. Multi-scale modeling of the human cardiovascular system with applications to aortic valvular and arterial stenoses. Med Biol Eng Comput. (2009) 47(7):743–55. doi: 10.1007/s11517-009-0449-9
12. Tang CJ, Lee PY, Chuang YH, Huang CC. Measurement of local pulse wave velocity for carotid artery by using an ultrasound-based method. Ultrasonics. (2020) 102:106064. doi: 10.1016/j.ultras.2020.106064
13. Tanaka H, Munakata M, Kawano Y, Ohishi M, Shoji T, Sugawara J, et al. Comparison between carotid-femoral and brachial-ankle pulse wave velocity as measures of arterial stiffness. J Hypertens. (2009) 27(10):2022–7. doi: 10.1097/HJH.0b013e32832e94e7
14. Lorenz MW, Markus HS, Bots ML, Rosvall M, Sitzer M. Prediction of clinical cardiovascular events with carotid intima-media thickness: a systematic review and meta-analysis. Circulation. (2007) 115(4):459–67. doi: 10.1161/CIRCULATIONAHA.106.628875
15. Cobble M, Bale B. Carotid intima-media thickness: knowledge and application to everyday practice. Postgrad Med. (2010) 122(1):10–8. doi: 10.3810/pgm.2010.01.2091
16. Wilkinson IB, MacCallum H, Flint L, Cockcroft JR, Newby DE, Webb DJ. The influence of heart rate on augmentation index and central arterial pressure in humans. J Physiol (Lond). (2000) 525(Pt 1):263. doi: 10.1111/j.1469-7793.2000.t01-1-00263.x
17. Vlachopoulos C, Aznaouridis K, O'Rourke MF, Safar ME, Baou K, Stefanadis C. Prediction of cardiovascular events and all-cause mortality with central haemodynamics: a systematic review and meta-analysis. Eur Heart J. (2010) 31(15):1865–71. doi: 10.1093/eurheartj/ehq024
18. Saiki A, Sato Y, Watanabe R, Watanabe Y, Imamura H, Yamaguchi T, et al. The role of a novel arterial stiffness parameter, cardio-ankle vascular index (CAVI), as a surrogate marker for cardiovascular diseases. J Atheroscler Thromb. (2016) 23(2):155–68. doi: 10.5551/jat.32797
19. Shirai K, Hiruta N, Song M, Kurosu T, Suzuki J, Tomaru T, et al. Cardio-ankle vascular index (CAVI) as a novel indicator of arterial stiffness: theory, evidence and perspectives. J Atheroscler Thromb. (2011) 18(11):924–38. doi: 10.5551/jat.7716
20. Munakata M. Brachial-ankle pulse wave velocity in the measurement of arterial stiffness: recent evidence and clinical applications. Curr Hypertens Rev. (2014) 10(1):49–57. doi: 10.2174/157340211001141111160957
21. Sugawara J, Hayashi K, Yokoi T, Cortez-Cooper MY, DeVan A, Anton M, et al. Brachial–ankle pulse wave velocity: an index of central arterial stiffness? J Hum Hypertens. (2005) 19(5):401–6. doi: 10.1038/sj.jhh.1001838
22. Nakanishi N, Shiraishi T, Wada M. Brachial-ankle pulse wave velocity and metabolic syndrome in a Japanese population: the minoh study. Hypertens Res. (2005) 28(2):125–31. doi: 10.1291/hypres.28.125
23. Wang R, Zhang J, Li Y, Liu T, Yu K. Neutrophil–lymphocyte ratio is associated with arterial stiffness in diabetic retinopathy in type 2 diabetes. J Diabetes Complicat. (2015) 29(2):245–9. doi: 10.1016/j.jdiacomp.2014.11.006
24. Chen SC, Chang JM, Liu WC, Tsai YC, Tsai JC, Hsu PC, et al. Brachial-ankle pulse wave velocity and rate of renal function decline and mortality in chronic kidney disease. Clin J Am Soc Nephrol. (2011) 6(4):724–32. doi: 10.2215/CJN.07700910
25. Sequi-Dominguez I, Cavero-Redondo I, Alvarez-Bueno C, Pozuelo-Carrascosa DP, de Arenas-Arroyo SN, Martinez-Vizcaino V. Accuracy of pulse wave velocity predicting cardiovascular and all-cause mortality. A systematic review and meta-analysis. J Clin Med. (2020) 9(7):2080. doi: 10.3390/jcm9072080
26. Zhang Y, Agnoletti D, Xu Y, Wang JG, Blacher J, Safar ME. Carotid–femoral pulse wave velocity in the elderly. J Hypertens. (2014) 32(8):1572–6. doi: 10.1097/HJH.0000000000000187
27. Tougaard NH, Theilade S, Winther SA, Tofte N, Ahluwalia TS, Hansen TW, et al. Carotid-femoral pulse wave velocity as a risk marker for development of complications in type 1 diabetes Mellitus. J Am Heart Assoc. (2020) 9(19):e017165. doi: 10.1161/JAHA.120.017165
28. Kong X, Ma X, Tang L, Wang Z, Li W, Cui M, et al. Arterial stiffness evaluated by carotid-femoral pulse wave velocity increases the risk of chronic kidney disease in a Chinese population-based cohort. Nephrology. (2017) 22(3):205–12. doi: 10.1111/nep.12750
29. Polak JF, Pencina MJ, Meisner A, Pencina KM, Brown LS, Wolf PA, et al. Associations of carotid artery intima-media thickness (IMT) with risk factors and prevalent cardiovascular disease: comparison of mean common carotid artery IMT with maximum internal carotid artery IMT. J Ultrasound Med. (2010) 29(12):1759–68. doi: 10.7863/jum.2010.29.12.1759
30. Faita F, Gemignani V, Bianchini E, Giannarelli C, Ghiadoni L, Demi M. Real-time measurement system for evaluation of the carotid intima-media thickness with a robust edge operator. J Ultrasound Med. (2008) 27(9):1353–61. doi: 10.7863/jum.2008.27.9.1353
31. Chirinos JA, Zambrano JP, Chakko S, Veerani A, Schob A, Willens HJ, et al. Aortic pressure augmentation predicts adverse cardiovascular events in patients with established coronary artery disease. Hypertension. (2005) 45(5):980–5. doi: 10.1161/01.HYP.0000165025.16381.44
32. Shirai K, Utino J, Otsuka K, Takata M. A novel blood pressure-independent arterial wall stiffness parameter; cardio-ankle vascular index (CAVI). J Atheroscler Thromb. (2006) 13(2):101–7. doi: 10.5551/jat.13.101
33. Shirai K, Song M, Suzuki J, Kurosu T, Oyama T, Nagayama D, et al. Contradictory effects of β1-and α1-aderenergic receptor blockers on cardio-ankle vascular stiffness index (CAVI)—CAVI is independent of blood pressure. J Atheroscler Thromb. (2011) 18(1):49–55. doi: 10.5551/jat.3582
34. Birudaraju D, Cherukuri L, Kinninger A, Chaganti BT, Haroun P, Pidikiti S, et al. Relationship between cardio-ankle vascular index and obstructive coronary artery disease. Coron Artery Dis. (2020) 31(6):550–5. doi: 10.1097/MCA.0000000000000872
35. Niiranen TJ, Kalesan B, Hamburg NM, Benjamin EJ, Mitchell GF, Vasan RS. Relative contributions of arterial stiffness and hypertension to cardiovascular disease: the framingham heart study. J Am Heart Assoc. (2016) 5(11):e004271. doi: 10.1161/JAHA.116.004271
36. Xia S, Du X, Guo L, Du J, Arnott C, Lam CS, et al. Sex differences in primary and secondary prevention of cardiovascular disease in China. Circulation. (2020) 141(7):530–9. doi: 10.1161/CIRCULATIONAHA.119.043731
37. Sasaki-Nakashima R, Ishigami T, Kino T, Teranaka-Saigo S, Chen L, Doi H, et al. Successful prediction of clinical outcomes using arterial velocity pulse index, a new non-invasive vascular index, in Japan. Vascular Failure. (2020) 3(2):43–50. doi: 10.30548/vascfail.3.2_43
38. Sasaki-Nakashima R, Kino T, Chen L, Doi H, Minegishi S, Abe K, et al. Successful prediction of cardiovascular risk by new non-invasive vascular indexes using suprasystolic cuff oscillometric waveform analysis. J Cardiol. (2017) 69(1):30–7. doi: 10.1016/j.jjcc.2016.06.004
39. Jin L, Tong L, Shen C, Du L, Mao J, Liu L, et al. Association of arterial stiffness indices with framingham cardiovascular disease risk score. Rev Cardiovasc Med. (2022) 23(8):287. doi: 10.31083/j.rcm2308287
40. Zhang Y, Yin P, Xu Z, Xie Y, Wang C, Fan Y, et al. Non-invasive assessment of early atherosclerosis based on new arterial stiffness indices measured with an upper-arm oscillometric device. Tohoku J Exp Med. (2017) 241(4):263–70. doi: 10.1620/tjem.241.263
41. Wan J, Liu S, Yang Y, Wang D, Ran F, Xia S, et al. Roles of arterial pressure volume index and arterial velocity pulse index trajectories in risk prediction in hypertensive patients with heart failure with preserved ejection fraction. Clin Exp Hypertens. (2020) 42(5):469–78. doi: 10.1080/10641963.2019.1705319
42. Tomiyama H, Matsumoto C, Shiina K, Yamashina A. Brachial-ankle pwv: current status and future directions as a useful marker in the management of cardiovascular disease and/or cardiovascular risk factors. J Atheroscler Thromb. (2016) 23(2):128–46. doi: 10.5551/jat.32979
43. Komine H, Asai Y, Yokoi T, Yoshizawa M. Non-invasive assessment of arterial stiffness using oscillometric blood pressure measurement. Biomed Eng Online. (2012) 11(1):1–12. doi: 10.1186/1475-925X-11-6
44. Janes H, Pepe M S. Adjusting for covariate effects on classification accuracy using the covariate-adjusted receiver operating characteristic curve. Biometrika. (2009) 96(2):371–82. doi: 10.1093/biomet/asp002
45. Li Y, Teng D, Shi X, Qin G, Qin Y, Quan H, et al. Prevalence of diabetes recorded in mainland China using 2018 diagnostic criteria from the American diabetes association: national cross sectional study. Br Med J. (2020) 369. doi: 10.1136/bmj.m997
46. Townsend RR, Wilkinson IB, Schiffrin EL, Avolio AP, Chirinos JA, Cockcroft JR, et al. Recommendations for improving and standardizing vascular research on arterial stiffness: a scientific statement from the American heart association. Hypertension. (2015) 66(3):698–722. doi: 10.1161/HYP.0000000000000033
47. Kerr AJ, Broad J, Wells S, Riddell T, Jackson R. Should the first priority in cardiovascular risk management be those with prior cardiovascular disease? Heart. (2009) 95:125–9. doi: 10.1136/hrt.2007.140905
48. Hermida RC, Smolensky MH, Ayala DE, Portaluppi F. Ambulatory blood pressure monitoring (ABPM) as the reference standard for diagnosis of hypertension and assessment of vascular risk in adults. Chronobiol Int. (2015) 32(10):1329–42. doi: 10.3109/07420528.2015.1113804
49. Omboni S, Posokhov IN, Kotovskaya YV, Protogerou AD, Blacher J. Twenty-four-hour ambulatory pulse wave analysis in hypertension management: current evidence and perspectives. Curr Hypertens Rep. (2016) 18:1–18. doi: 10.1007/s11906-016-0681-2
50. Hitsumoto T. Clinical significance of arterial velocity pulse index in patients with stage B heart failure with preserved ejection fraction. Cardiol Res. (2019) 10(3):142. doi: 10.14740/cr864
51. Taddei S, Virdis A, Ghiadoni L, Mattei P, Sudano I, Bernini G, et al. Menopause is associated with endothelial dysfunction in women. Hypertension. (1996) 28(4):576–82. doi: 10.1161/01.HYP.28.4.576
52. Mendelsohn ME, Karas RH. Molecular and cellular basis of cardiovascular gender differences. Science. (2005) 308(5728):1583–7. doi: 10.1126/science.1112062
53. Gold EB. The timing of the age at which natural menopause occurs. Obstet Gynecol Clin. (2011) 38(3):425–40. doi: 10.1136/bmj.m997
54. Mendelsohn ME. Protective effects of estrogen on the cardiovascular system. Am J Cardiol. (2002) 89(12):12–7. doi: 10.1016/S0002-9149(02)02405-0
55. Murphy E. Estrogen signaling and cardiovascular disease. Circ Res. (2011) 109(6):687–96. doi: 10.1161/CIRCRESAHA.110.236687
56. Martins D, Nelson K, Pan D, Tareen N, Norris K. The effect of gender on age-related blood pressure changes and the prevalence of isolated systolic hypertension among older adults: data from NHANES III. J Gend Spec Med. (2001) 4(3):10–3. 20.
57. DuPont JJ, Kenney RM, Patel AR, Jaffe IZ. Sex differences in mechanisms of arterial stiffness. Br J Pharmacol. (2019) 176(21):4208–25. doi: 10.1111/bph.14624
58. Manojlović M, Protić-Gava B, Maksimović N, Šćepanović T, Poček S, Roklicer R, et al. Effects of combined resistance and aerobic training on arterial stiffness in postmenopausal women: a systematic review. Int J Environ Res Public Health. (2021) 18(18):9450. doi: 10.3390/ijerph18189450
59. Tanaka K, Kanazawa I, Sugimoto T. Reduced muscle mass and accumulation of visceral fat are independently associated with increased arterial stiffness in postmenopausal women with type 2 diabetes Mellitus. Diabetes Res Clin Pract. (2016) 122:141–7. doi: 10.1016/j.diabres.2016.10.014
60. Kim J, Song T-J, Song D, Lee KJ, Kim EH, Lee HS, et al. Brachial-ankle pulse wave velocity is a strong predictor for mortality in patients with acute stroke. Hypertension. (2014) 64(2):240–6. doi: 10.1161/HYPERTENSIONAHA.114.03304
61. Seo H-J, Ki Y-J, Han MA, Choi D-H, Ryu S-W. Brachial-ankle pulse wave velocity and mean platelet volume as predictive values after percutaneous coronary intervention for long-term clinical outcomes in Korea: a comparable and additive study. Platelets. (2015) 26(7):665–71. doi: 10.3109/09537104.2014.978274
62. Hwang I-C, Jin KN, Kim H-L, Kim Y-N, Im M-S, Lim W-H, et al. Additional prognostic value of brachial-ankle pulse wave velocity to coronary computed tomography angiography in patients with suspected coronary artery disease. Atherosclerosis. (2018) 268:127–37. doi: 10.1016/j.atherosclerosis.2017.11.026
63. Park H-W, Kim H-R, Kang MG, Kim K, Koh J-S, Park JR, et al. Predictive value of the combination of brachial-ankle pulse wave velocity and ankle-brachial index for cardiovascular outcomes in patients with acute myocardial infarction. Coron Artery Dis. (2020) 31(2):157–65. doi: 10.1097/MCA.0000000000000777
Keywords: arterial stiffness index, brachial cuff, arterial velocity-pulse index, arterial pressure-volume index, threshold value, brachial-ankle pulse wave velocity
Citation: Zhang X, Jiang Y, Liang F and Lu J (2023) Threshold values of brachial cuff-measured arterial stiffness indices determined by comparisons with the brachial–ankle pulse wave velocity: a cross-sectional study in the Chinese population. Front. Cardiovasc. Med. 10:1131962. doi: 10.3389/fcvm.2023.1131962
Received: 26 December 2022; Accepted: 23 June 2023;
Published: 13 July 2023.
Edited by:
Serafino Fazio, Federico II University Hospital, ItalyReviewed by:
Leonidas Poulimenos, General Hospital Asklepieio Voulas, Greece© 2023 Zhang, Jiang, Liang and Lu. This is an open-access article distributed under the terms of the Creative Commons Attribution License (CC BY). The use, distribution or reproduction in other forums is permitted, provided the original author(s) and the copyright owner(s) are credited and that the original publication in this journal is cited, in accordance with accepted academic practice. No use, distribution or reproduction is permitted which does not comply with these terms.
*Correspondence: Fuyou Liang ZnV5b3VsaWFuZ0BzanR1LmVkdS5jbg== Jianping Lu MTg5MzAxNzc0NTJAMTYzLmNvbQ==
Disclaimer: All claims expressed in this article are solely those of the authors and do not necessarily represent those of their affiliated organizations, or those of the publisher, the editors and the reviewers. Any product that may be evaluated in this article or claim that may be made by its manufacturer is not guaranteed or endorsed by the publisher.
Research integrity at Frontiers
Learn more about the work of our research integrity team to safeguard the quality of each article we publish.