 Nan Peng
 Maobin Kuang
 Yi Peng
 Hang Yu
 Shuhua Zhang
 Guobo Xie
 Guotai Sheng
 Yang Zou
94% of researchers rate our articles as excellent or good
Learn more about the work of our research integrity team to safeguard the quality of each article we publish.
Find out more
ORIGINAL RESEARCH article
Front. Cardiovasc. Med., 24 April 2023
Sec. Hypertension
Volume 10 - 2023 | https://doi.org/10.3389/fcvm.2023.1129112
Objective: Triglyceride glucose body mass index (TyG-BMI) has been shown to be strongly associated with a variety of chronic diseases. However, little is known about the associations between TyG-BMI and normal-high blood pressure (BP) values and hypertension (HTN).
Method: The current study was cross-sectional in design and included 15,464 non-diabetic participants recruited between 1994 and 2016 in the NAGALA (NAfld in the Gifu Area, Longitudinal Analysis) study. Associations between TyG-BMI and normal-high BP values and HTN were assessed using multivariate logistic regression. The ability of the TyG index, BMI, and their combined index TyG-BMI to identify normal-high BP values and HTN was compared by receiver operating characteristic (ROC) curves.
Results: Among the 15,464 eligible non-diabetic participants, 28.56% (4,416/15,464) and 6.23% (964/15,464) had normal-high BP values and HTN, respectively. Multivariate logistic regression analysis showed positive correlations between BMI, TyG index, TyG-BMI and normal-high BP values/HTN; after standardized regression coefficients, TyG-BMI had the strongest association with normal-high BP values and HTN compared to BMI and TyG index. In the fully adjusted model, the odds ratio (OR) value corresponding to the relationship between TyG-BMI and HTN/normal-high BP values was 2.35; when TyG-BMI was used as a categorical variable, compared with the lowest quartile of TyG-BMI the regression coefficient for the association of the highest quartile of TyG-BMI with normal-high BP values increased by 426%, while the regression coefficient for the association with HTN increased by 527%. In further spline regression analysis, we also found that there was a linearly positive correlation between TyG-BMI and systolic BP/diastolic BP (SBP/DBP), which supported the linear trend between TyG-BMI and HTN/normal-high BP values (P-trend <0.0001). In addition, ROC analysis showed that TyG-BMI had good diagnostic values for both normal-high BP values and HTN, and TyG index combined with BMI can significantly improve the ability of a single index to identify normal-high BP values and HTN.
Conclusion: In the non-diabetic population, TyG-BMI showed a significant positive correlation with both normal-high BP values and HTN, and TyG-BMI was of higher value for the identification of both normal-high BP values and HTN compared to BMI and TyG index alone.
HTN refers to a common epidemic disease mainly characterized by increased systemic arterial BP, which can be accompanied by functional or organic damage to the heart, brain, and kidneys (1, 2), and is a major risk factor for cardiovascular disease and all-cause mortality (3, 4). According to the world's largest HTN research report, the number of adults aged 30–79 years with HTN increased from 650 million to 1.28 billion over the period 1990–2019 (5); however, nearly half of them are unaware that they have HTN (6). Furthermore, the proportion of patients with HTN who are optimally treated and controlled is low in the general population, especially in those who are in low-resource settings (6, 7). Normal-high BP value is a transitional stage between normotension and HTN; similar to HTN, it also would increase the risk of various cardiovascular diseases and bring a series of complications (8–10), but some studies have put forward different views (11). Overall, evidence based on prospective studies and meta-analyses indicated that the risk of developing chronic HTN in normal-high BP values patients was 2–3 times higher than that of normal people, and the risk of cardiovascular and cerebrovascular diseases was also significantly increased (12–14). Therefore, early identification of patients with normal-high BP values and reduction of potential risk factors to reduce the risk of developing HTN is necessary, which may be feasible and practical to reduce the burden of HTN-related diseases.
Previous studies have suggested that insulin resistance (IR) may be involved in the pathogenesis of HTN by mediating low-grade systemic inflammation (15–17). So far, researchers have proposed a variety of methods to assess IR, among which the gold standard test is the hyperinsulinemic-euglycemic clamp test (18), while the homeostatic model of IR (HOMA-IR) (19) is the most widely used indirect measurement method in clinical practice. However, considering the hyperinsulinemic-euglycemic clamp test is invasive and relatively time-consuming, expensive, and complicated (20), and HOMA-IR is easily affected by the accuracy of insulin measurement and has poor reproducibility (21). Therefore, the development of non-insulin-based IR surrogate indicators may be a more convenient, practical, and cost-effective approach, especially in primary care settings.
TyG-BMI, a recently developed IR surrogate, is an index composed of three easily measurable biochemical parameters [BMI, triglyceride (TG), and fasting plasma glucose (FPG)]. According to Er et al. TyG-BMI has a greater ability to identify IR compared to other non-insulin-based IR indices (22). Furthermore, in several recent epidemiological investigations, TyG-BMI was found to have excellent diagnostic value not only in identifying IR but also in assessing the risk of metabolic syndrome (MS), non-alcoholic fatty liver disease (NAFLD), HTN combined with hyperuricemia, pre-diabetes and diabetes (23–27). However, it remains unclear whether there is a similar relationship between TyG-BMI and normal-high BP values/HTN, and the diagnostic value of TyG-BMI for normal-high BP values and HTN in the general populations. To address these issues, this study was based on a large sample of 15,464 non-diabetic people in the NAGALA study to investigate the association between TyG-BMI and normal-high BP values and HTN, and to evaluate the accuracy of TyG-BMI in identifying normal-high BP values and HTN.
This study was a secondary analysis based on the NAGALA study to explore the associations of TyG-BMI with normal-high BP values and HTN. The NAGALA study is a chronic disease survey study conducted in Gifu Ward, Japan. Since 1994, NAGALA study has been continuously recruiting people who take part in health examinations in Murakami Memorial Hospital, aiming at investigating the potential risk factors of chronic diseases such as diabetes and NAFLD, so as to promote the development of public health. The detailed study design was carried out in a previously published article for illustration (28), and the available NAGALA study data have been uploaded to the Dryad public database by Prof. Okamura (https://doi.org/10.5061/dryad.8q0p192). According to the principle of open sharing of the Dryad database, all researchers can make full use of the datasets in it for in-depth exploratory analysis without violating the rights of the authors because the authors of the original data have transferred the ownership of the data to the Dryad database. Therefore, based on previous studies, the present study established several new research hypotheses based on the new research objectives: is there a correlation between TyG-BMI and normal-high BP values as well as HTN in the non-diabetic population? Is TyG-BMI more valuable in identifying normal-high BP values and HTN? In the current study, we extracted cross-sectional data from the NAGALA study from 1994 to 2016, continued to use the inclusion-exclusion criteria of the NAGALA study, excluding subjects with alcohol abuse, diagnosed liver disease and baseline medication, subjects whose FPG exceeded 6.1 mmol/L at baseline, subjects diagnosed with diabetes at baseline, and subjects with missing covariant data. In addition, 10 subjects who withdrew from the study for unknown reasons were also excluded, and finally, we included 15,464 subjects in the study analysis.
In the original study, the researchers obtained informed consent from each subject and the Ethics Committee of Murakami Memorial Hospital approved the previous study protocol (28). The current study was conducted as a secondary analysis of the NAGALA research data, and the Ethics Committee of Jiangxi Provincial People's Hospital reviewed and approved the current study protocol. The entire research process followed the Declaration of Helsinki.
As previously mentioned (28), the following information was recorded for each subject by trained investigators: sociodemographic characteristics (age and sex), lifestyle behaviors (smoking and drinking status, and habits of exercise), disease history (liver disease, diabetes), anthropometric parameters [weight, height, waist circumference (WC) and arterial BP], biochemical parameters [liver enzyme indicators (alanine aminotransferase: ALT, aspartate aminotransferase: AST, gamma-glutamyl transferase: GGT), blood lipid indicators (TG, total cholesterol: TC, high-density lipoprotein cholesterol: HDL-C) and blood glucose indicators (FPG, hemoglobin A1c: HbA1c)]. Blood samples for the analysis of biochemical parameters were collected at least 8 h after fasting and analyzed and determined by standard methods using an automated analyzer. Fatty liver was determined by experienced gastroenterologists based on the assessment of several sonograms under abdominal ultrasound, namely deep attenuation, hepatorenal echo contrast, vascular blurring, and liver brightness (29).
BMI was calculated as weight/height2. Based on the BMI cut-off point for Asian populations proposed by the World Health Organization expert committee, we defined BMI ≥ 25 kg/m2 as overweight/obese and BMI < 25 kg/m2 as normal weight (30). TyG index = Ln [[FPG (mg/dl)/2] × TG (mg/dl)]; TyG-BMI = BMI × TyG index (22, 31). Smoking status was categorized into three groups based on subjects' smoking status prior to the baseline survey: non, past, and current; similarly, drinking status was categorized into never (<40 g/w), light (40–139 g/w), moderate (140–209 g/w), and heavy (>280 g/w) based on the subject's weekly alcohol consumption in the previous month (32); additionally, for habits of exercise, subjects who engaged in any form of physical activity at least once per week were considered to have an exercise habit (33).
Normal-high BP values and HTN were defined according to the Japanese Society of HTN Guidelines for HTN Management (JSH 2019) (34). JSH 2019 defines office BP thresholds for HTN as SBP ≥140 and/or DBP ≥90 mmHg; normal-high BP values as SBP 120–129 mmHg and DBP <80 mmHg, or SBP 130–139 and/or DBP 80–89 mmHg.
We first used HTN and normal-high BP values as outcome variables and TyG-BMI as dependent variables, respectively, and then included the other covariates one by one in the logistic regression model, and variance inflation factors were calculated to assess the non-collinear variables that could be included in the current applied model (Supplementary Tables S1, S2) (35). Subsequently, based on the Strengthening the Reporting of Observational Studies in Epidemiology statement, we established four multivariate logistic regression models to assess the association of TyG-BMI with normal-high BP values or HTN (36), and recorded the corresponding ORs and 95% confidence intervals (CIs). In the model adjustment of multivariate logistic regression, model 1 was adjusted for sex, age, and height; model 2 was further adjusted for fatty liver, the habit of exercise, drinking status, and smoking status based on model 1; model 3 was additionally adjusted for lipid glucose-related parameters (HDL-C, TC, TG, HbA1c, and FPG) based on model 2; and model 4 was adjusted for all non-collinear variables. Based on model 4, we further fitted the dose-response relationship between TyG-BMI and SBP, DBP by 4-knot natural smoothing splines. We also constructed ROC curves to evaluate the relative diagnostic strength of TyG-BMI for normal-high BP values and HTN, calculated the area under the curve (AUC) of TyG-BMI and its optimal threshold, and the comparison between AUCs was performed by the De Long test (37). In addition, exploratory subgroup analysis was also conducted in the current study. Based on Model 4, we evaluated the relationship between TyG-BMI and normal-high BP values/HTN in subgroups of age, sex, BMI, smoking status and drinking status respectively, and examined the differences of different stratification in subgroups by the likelihood ratio test.
All analyses in this study were performed on R language version 3.4.3 and Empower(R) version 2.0. Baseline data were grouped according to TyG-BMI quartiles, among which normally distributed continuous variables were expressed as mean ± standard deviation and compared between groups using one-way analysis of variance; meanwhile, non-normally distributed variables were expressed as median (interquartile range) and compared between groups using Kruskal-Wallis H test. Categorical variables were expressed as frequency (%), and differences between groups were compared using the chi-square test. We considered statistical differences to be significant when two-sided P < 0.05.
Between 1994 and 2016, the NAGALA study recruited 20,944 people. A total of 4,339 subjects were excluded due to missing data (n = 863), known liver disease (n = 416), excessive drinking (n = 739), and oral medications at baseline (n = 2,321). In addition, in the baseline examination, 323 diabetic patients and 808 patients with FPG >6.1 mmol/L, and 10 subjects who withdrew from the study for unknown reasons were further excluded. Ultimately, 15,464 individuals were included in this study. The flow chart of subject selection was shown in Figure 1.
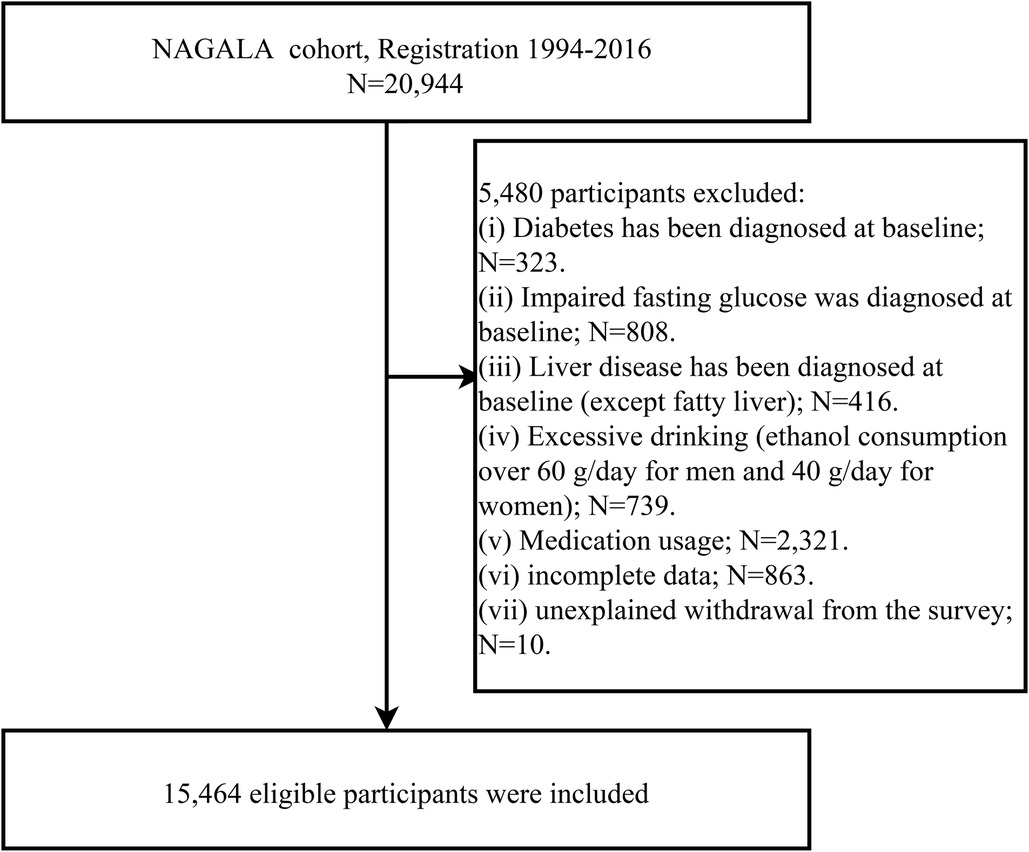
Figure 1. Flowchart of the selection process of study subjects.
Table 1 shows the baseline characteristics of the study population according to the TyG-BMI quartiles. In the quartile with the highest TyG-BMI, the levels of age, weight, height, BMI, WC, ALT, AST, GGT, SBP, DBP, TC, TG, HbA1c, FPG, and TyG index were highest, but HDL-C had the lowest level. The prevalence of normal-high BP values in the highest TyG-BMI group was 11.67%, which was much higher than that in other TyG-BMI groups (Q1: 3.07%, Q2: 5.49%, Q3: 8.33%); similarly, in the highest TyG-BMI group (Q4), the prevalence of HTN was 3.55%, which was also much higher than that in other TyG-BMI groups (Q1: 0.27%, Q2: 0.82%, Q3: 1.60%).
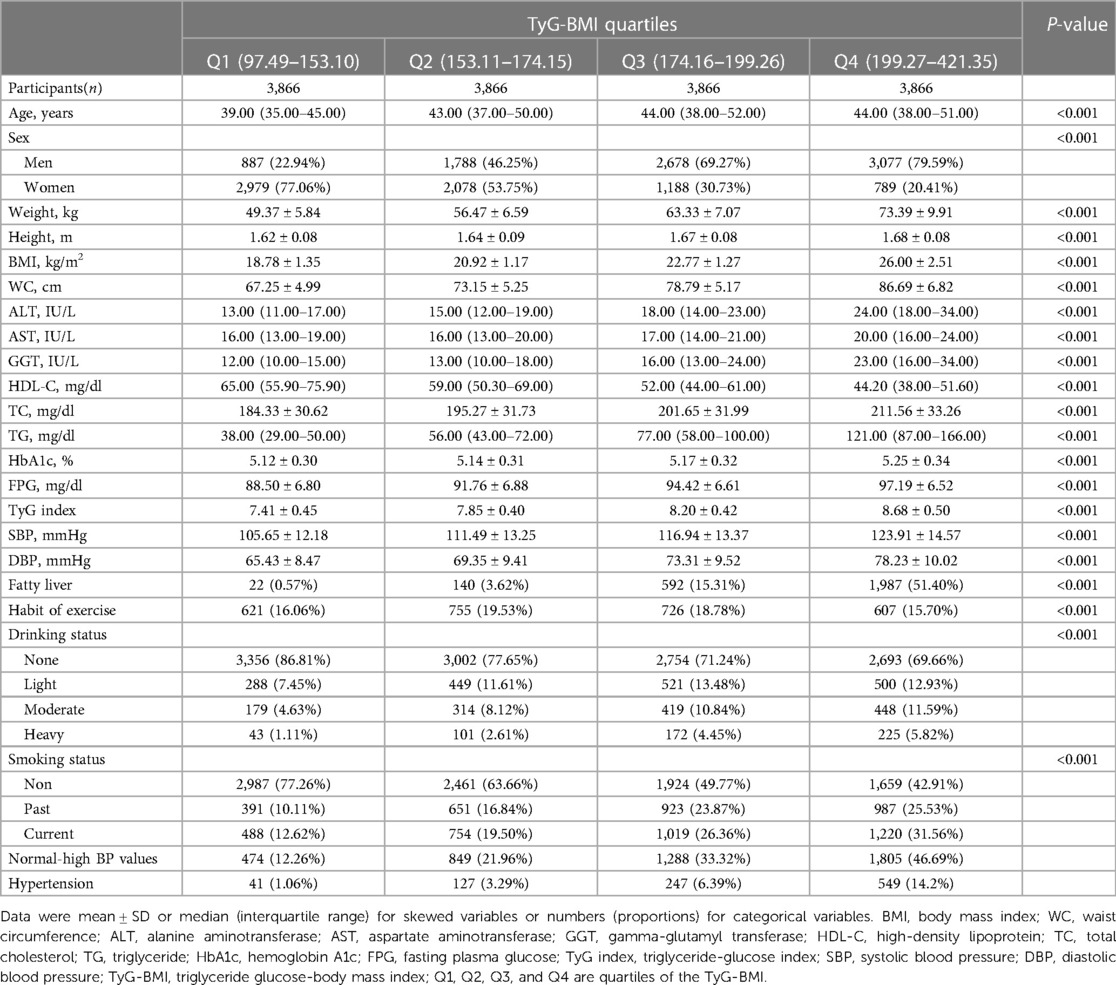
Table 1. Clinical characteristics of the study population according to TyG-BMI quartiles.
Four multivariate logistic regression models were developed to assess the independent effects of TyG-BMI on normal-high BP values and HTN (Table 2). As can be seen, the degree of associations between TyG-BMI and normal-high BP values and HTN changed slightly in each of the four stepwise adjusted models, while the direction of the relevant associations remained consistent throughout; and in the fully adjusted model (Model 4), when TyG-BMI was used as a continuous variable, the OR value corresponding to the association between TyG-BMI and normal-high BP values/HTN was 2.35; when TyG-BMI was used as a categorical variable, compared with the lowest quartile (Q1) of TyG-BMI the regression coefficient for the association of the highest quartile (Q4) of TyG-BMI with normal-high BP values increased by 426%, while the regression coefficient for the association with HTN increased by 527%; the linear trend test (P-trend <0.0001) further suggested that there may be a linear relationship between TyG-BMI and normal-high BP values and HTN. In addition, we further compared the strength of the correlation between BMI, TyG index, TyG-BMI and normal-high BP values and HTN (Supplementary Table S3). After standardized OR values (unified Z transformation and then incorporated into the multivariate regression model), the results showed that TyG-BMI had the highest standardized OR value in evaluating HTN and normal-high BP values, followed by BMI, and finally TyG index [model 4: HTN (OR): TyG-BMI 2.35 > BMI 1.96 > TyG index 1.51; normal-high BP(OR): TyG-BMI 2.35 > BMI 1.94 > TyG index 1.31].
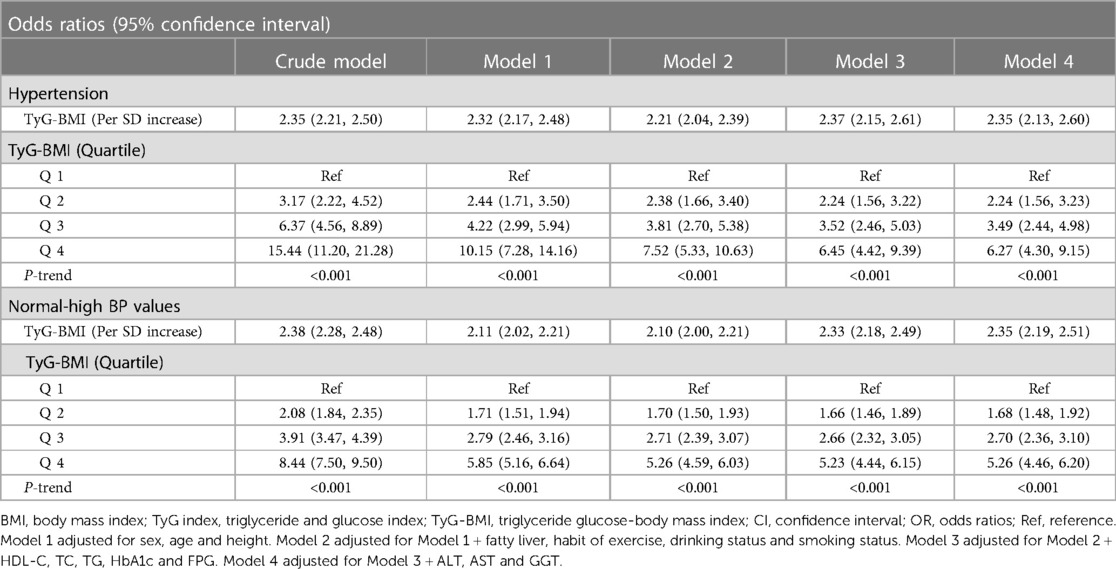
Table 2. Multivariable-adjust ORs and 95% CI of the TyG-BMI index quartiles associated with normal-high BP values and hypertension.
Based on model 4, we further fitted the dose-response relationship between TyG-BMI and SBP, DBP by natural smoothing splines. The results showed that after fully adjusting the confounding factors, TyG-BMI was linearly positively correlated with SBP and DBP (Figure 2). This result further supported the linear trend of TyG-BMI and HTN/normal-high BP values.
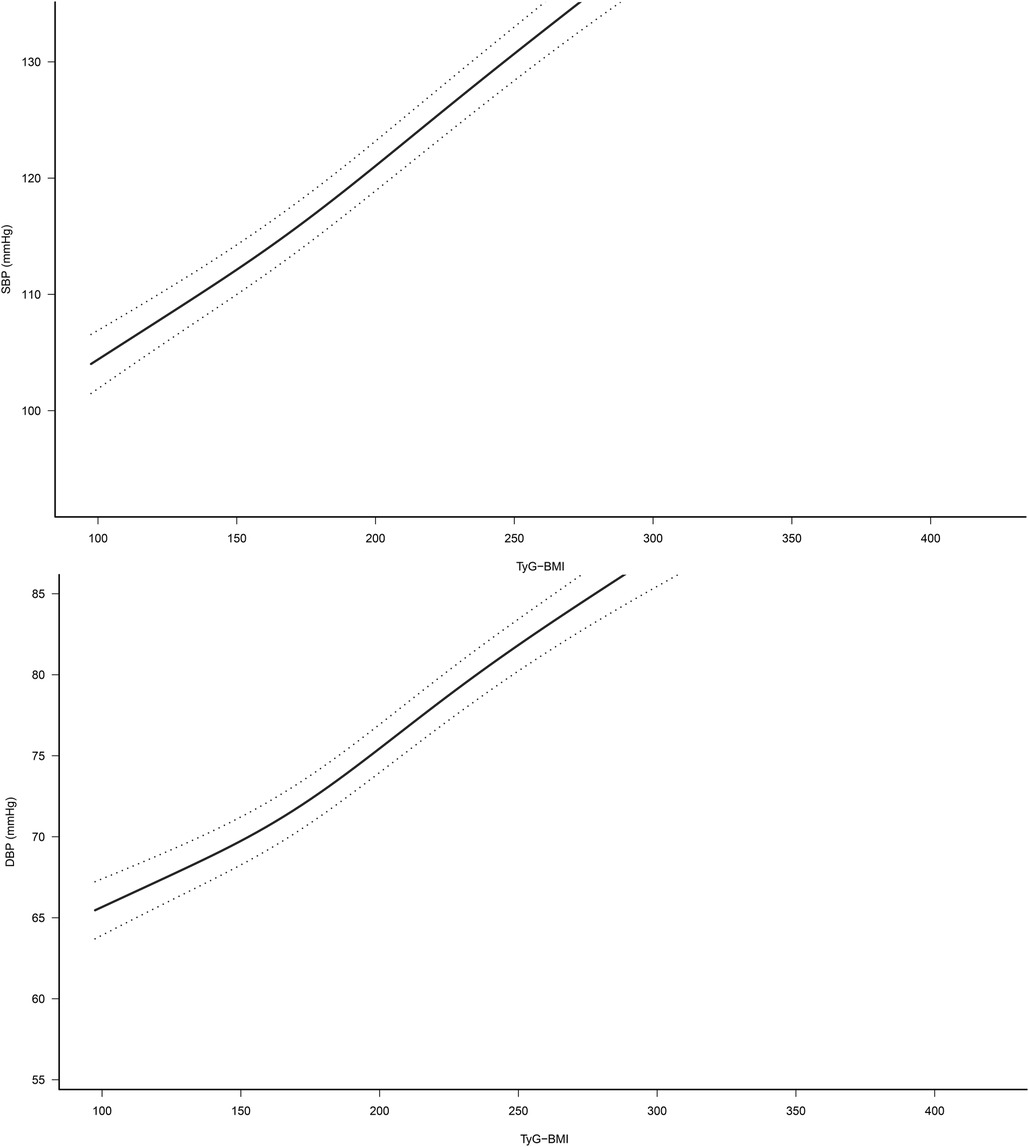
Figure 2. Dose-response relationship between TyG-BMI and SBP/DBP (95% confidence interval was shown by dashed line). Adjusted for sex, age, height, fatty liver, habit of exercise, drinking status, smoking status, HDL-C, TC, TG, HbA1c, FPG, ALT, AST and GGT. TyG-BMI, triglyceride glucose-body mass index.
To compare the ability of TyG-BMI, BMI, and TyG index for identifying normal-high BP values and HTN, we plotted the ROC curves of the three parameters (Figure 3) and calculated the corresponding AUC values, optimal cut-off values, specificity, and sensitivity (Table 3). The results showed that the AUCs of the three parameters were all greater than 0.6, among them, TyG-BMI (AUC: 0.72 and 0.75) had the highest ability to recognize normal-high BP values/HTN, followed by BMI (AUC: 0.70 and 0.73), and finally TyG index (AUC: 0.66 and 0.70) (All Delong P < 0.001). In addition, we calculated the optimal cut-off values of TyG-BMI for identifying normal-high BP values and HTN as 177.46 and 185.19, respectively.
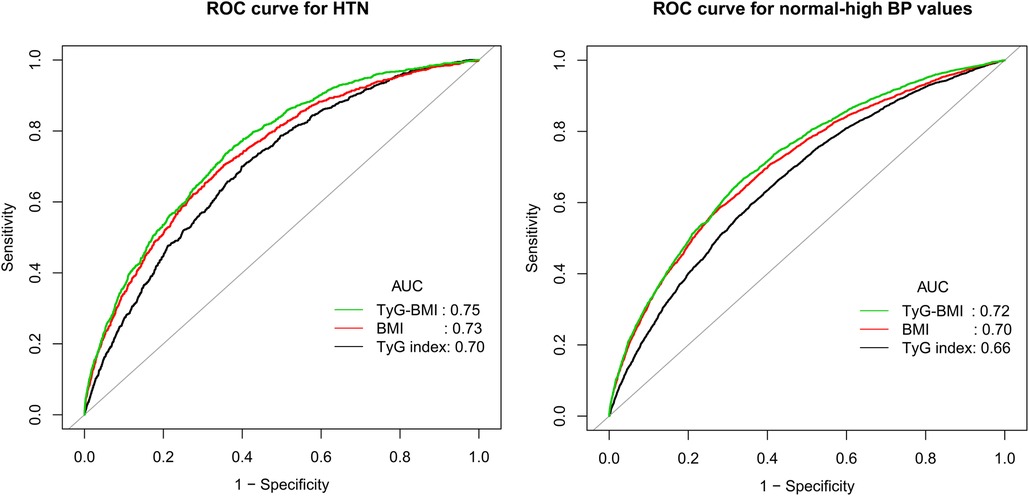
Figure 3. Receiver operating characteristic curve analyzes the value of BMI, TyG index and TyG-BMI in identifying HTN/normal-high BP values. BMI, body mass index; TyG index, triglyceride-glucose index; TyG-BMI, triglyceride glucose-body mass index; AUC, the area under the curve; HTN, hypertension.
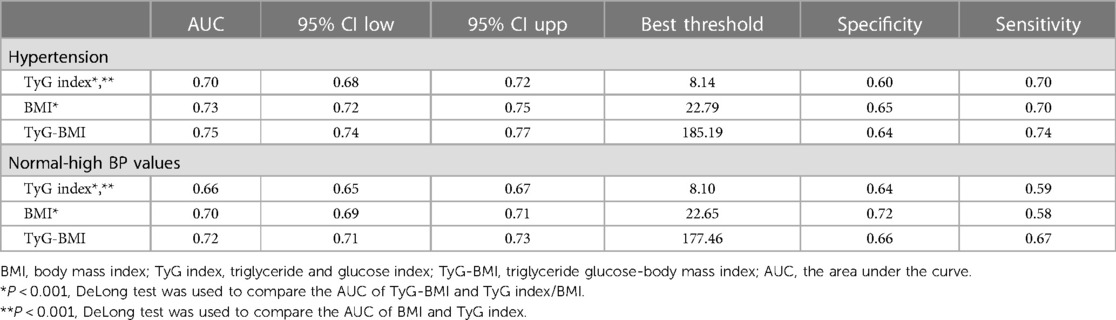
Table 3. Areas under the receiver operating characteristic curves for each evaluated parameters in identifying normal-high BP values and hypertension.
To explore whether there were differences in the association between TyG-BMI and normal-high BP values/HTN in different populations, we also performed subgroup analyses. As shown in Table 4, we found an interaction effect only in the age subgroup; it is worth mentioning that the correlation between TyG-BMI and normal-high BP values/HTN gradually decreased with aging. In contrast, we did not find significant interactions in the subgroups of sex, BMI, drinking status, and smoking status (P-interaction >0.05).
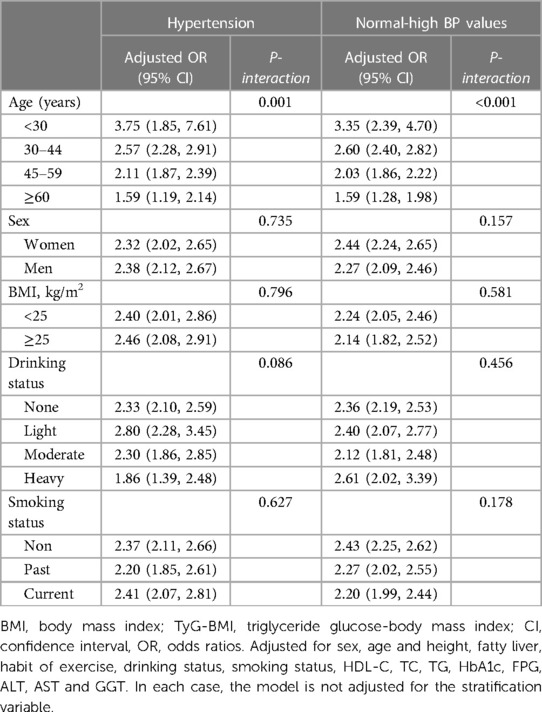
Table 4. Stratified association between TyG-BMI and HTN/normal-high BP values by age, sex, BMI, smoking status, and drinking status.
In the current epidemiological survey based on the non-diabetic population, we found that (1) BMI, TyG index, and TyG-BMI were all significantly and independently positively associated with normal-high BP values and HTN in the non-diabetic population; compared with BMI and TyG index alone, TyG-BMI had higher recognition ability for normal-high BP values and HTN. (2) TyG-BMI was more strongly associated with normal-high BP values or HTN in the youth population.
In the past two decades, slightly elevated BP within the normal range has attracted much attention due to its adverse clinical effects (8, 9). Normal-high BP values have been reported to affect approximately 25%–50% of adults worldwide and significantly increase the risk of developing HTN (10). In addition, the risk of cardiovascular disease increases further with increasing BP, and previous studies have shown that the risk of cardiovascular disease was significantly higher in people with BP in the 120–129/80–84 mmHg range and 130–139/85–89 mmHg range than those with the BP in the 120/80 mmHg range (38–40). Therefore, early detection and intervention of normal-high BP values are important to prevent HTN.
The pathogenesis of HTN is complex, and normal-high BP values and HTN individuals are often accompanied by abnormal glucose and lipid homeostasis; it has been reported that about 40% of HTN patients have dyslipidemia and impaired fasting glucose (41–43), and these abnormal glucose and lipid metabolisms will further increase the risk of cardiovascular disease. IR is a key mechanism of glycolipid metabolism (16) and an important precursor to the early stages of the disease. Generally speaking, the physiological function of insulin to lower blood glucose is somewhat limited when IR occurs, and the body then secretes as much insulin as possible. In addition, excessive secretion of insulin tends to produce hyperinsulinemia, which becomes a potential disease hazard (44, 45); hyperinsulinemia can contribute to increased renal tubular sodium reabsorption, sympathetic excitation, accelerated heart rate, increased vascular resistance, dyslipidemia, and narrowing of atherosclerosis, which in turn can increase intracellular calcium ion concentration and sensitivity to elevating substances, leading to the development of HTN (16, 46).
TyG index, a combined marker containing TG and FPG, has previously been extensively studied and is considered an alternative marker for IR (31, 47, 48). In a recent study, Professor Zeng and his team found that the TyG index can also be used to identify individuals at high risk for normal-high BP values (49), and their findings further suggested that IR was strongly associated with normal-high BP values. BMI is the most important anthropometric measure commonly used in clinical practice to evaluate obesity and is a recognized predictor of HTN (50). Obesity is often accompanied by an elevated prevalence of HTN; conversely, weight control is effective in reducing BP (50, 51). TyG-BMI is a newly developed IR surrogate in recent years, which is the product of BMI and TyG index. In one of the earliest TyG-BMI-related studies, Er et al. found that TyG-BMI could better reflect IR compared with lipid parameters, lipid ratios, glucose parameters, TyG index, and obesity-related parameters (22). Several subsequent studies further found that TyG-BMI was also strongly associated with a variety of metabolic diseases (23–27). In March 2021, Raimi et al. analyzed the relationship between TyG-BMI and MS, and they pointed out that the product combination of BMI and TyG index improved the ability to identify MS (23); in May of the same year, in a cross-sectional study by Li et al., they found that TyG-BMI had moderate discriminatory power in distinguishing HTN from hyperuricemia (26). In addition, some observational studies have further found that TyG-BMI also has the potential to predict the risk of NAFLD and diabetes, especially in young and middle-aged and non-obese people (24, 27). Similarly, in a longitudinal cohort study with a median follow-up time of 3.1 years, Jiang et al. also found similar results, in which higher TyG-BMI levels significantly increased the risk of prediabetes (26). These findings all suggested that TyG-BMI has a certain application value in metabolic diseases. However, there are relatively few studies on the associations between TyG-BMI and normal-high BP values and HTN, and in a recent cross-sectional study of Chinese lean-weight adults by Zeng et al., they found that TyG-BMI showed a strong positive correlation with normal-high BP values (49), which was similar to the results of our subgroup analysis, but in further analysis, we found that the associations between TyG-BMI and normal-high BP values/HTN were not significantly different between obese and non-obese groups, further research is needed. Compared with the research of Zeng et al., we further calculated the OR value and 95% CI of the corresponding normal-high BP values and HTN after Z-conversion of BMI, TyG index and TyG-BMI. Before and after the adjustment of the model, among the three parameters, the TyG-BMI index had the strongest correlation with normal-high BP values and HTN, followed by BMI, and finally TyG index. In addition, it is worth mentioning that the current study also found a similar trend in ROC analysis: among the three parameters, TyG-BMI has the highest accuracy in identifying normal-high BP values and HTN, followed by BMI, and finally TyG index. These results together suggested that, after a further combination of TyG index and BMI, BMI-related components may greatly improve the assessment/recognition ability for HTN and normal-high BP values. Based on the background of the current research (15–17), the reason for this result may be closely related to IR, and the combination of the TyG index and obesity index BMI improved the ability to identify IR (22), thereby enhancing the ability to identify HTN/normal-high BP values. In addition, we also constructed natural smoothing splines and found that TyG-BMI was linearly positively correlated with SBP and DBP. This further supported the linear trend of TyG-BMI with HTN/normal-high BP values. To my knowledge, the current study revealed for the first time a linear association between TyG-BMI and SBP/DBP. These new findings may be able to provide new strategies and approaches for the prevention of normal-high BP values and HTN in different populations.
We also found some interesting results in our subgroup analysis: compared with other age groups, the correlation between TyG-BMI and normal-high BP values and HTN was relatively higher in young people. We speculated that the reason for this result may be related to the increasing poor dietary habits as well as lifestyle habits of young people. It has been shown that obesity during childhood and adolescence greatly increases the risk of developing HTN in adulthood (52). Not only that, some poor lifestyles such as a high-salt diet, sedentary lifestyle, excessive alcohol consumption, lack of exercise, chronic mental stress, and sleep deprivation are problems faced by contemporary young people, which greatly contribute to the prevalence of HTN (53). In addition, longitudinal studies have reported that high BP levels measured in childhood and adolescence often transform into stable hypertension in adulthood, with significant and substantial epidemiological implications and clinical relevance, a phenomenon known as “BP tracking” (54–56).
A significant advantage of this work is that the association between TyG-BMI and normal-high BP values or HTN in the general population was revealed for the first time through a rigorous statistical analysis strategy supported by large sample data.
This study also has some limitations that have to be mentioned: (1) The relevant parameters for evaluating insulin were not included in the current dataset, so HOMA-IR was not further evaluated for result verification. (2) The study population was Japanese, so the external applicability of the findings needs to be confirmed by further studies. (3) The current study was a secondary analysis of the previous research dataset, and all the identifiable information in the analyzed data set has been deleted (including name and registration time), so we can't further evaluate the association between TyG-BMI and HTN/normal-high BP values in different years. Additionally, the covariates contained in the dataset were limited, so it was inevitably a certain residual confounding in the current study (57). (4) The cross-sectional study design limited the ability to determine causality, so we also could not determine the predictive value of TyG-BMI for normal-high BP values or HTN. (5) Because the NAGALA study set more exclusion conditions in the enrollment of subjects, this may result in more patients diagnosed with HTN not being included in the current study, which further leads to a lower prevalence of HTN in the current study. (6) Serum uric acid (UA) is an important metabolic factor that is easily overlooked; in fact, UA is closely related to the composition of TyG-BMI and HTN (58, 59), which may be an important mediating factor between TyG-BMI and normal-high BP values/HTN. However, since the parameter UA is not included in the current research data set, this potential mechanism needs to be evaluated in further research.
In the non-diabetic population, TyG-BMI was significantly and positively associated with both normal-high BP values and HTN; TyG-BMI has higher values for both normal-high BP values and HTN identification compared to BMI and TyG index alone. TyG-BMI has the potential to be a cost-effective monitoring indicator as well as a non-invasive assessment method in the individual stratified management of normal-high BP value and may serve as an accessible complementary monitoring method in the future risk stratification management of HTN.
The original contributions presented in the study are included in the article/Supplementary Material, further inquiries can be directed to the corresponding author.
The studies involving human participants were reviewed and approved by the Ethics Committee of Jiangxi Provincial People's Hospital. Written informed consent for participation was not required for this study in accordance with the national legislation and the institutional requirements.
YZ, NP, MK, YP conceived the research, drafted the manuscript, and did the statistical analysis. YZ revised the manuscript and designed the study. All authors contributed to the article and approved the submitted version.
This study was supported by the Natural Science Foundation of Jiangxi Province [No. 20192BAB205007] and Jiangxi Provincial Education Department foundation Project [No. GJJ218911] and Applied Research and Cultivation Program of Jiangxi Provincial Department of Science and Technology [No. 20212BAG70036].
Thanks to Okamura and his team for contributing available research data.
The authors declare that the research was conducted in the absence of any commercial or financial relationships that could be construed as a potential conflict of interest.
All claims expressed in this article are solely those of the authors and do not necessarily represent those of their affiliated organizations, or those of the publisher, the editors and the reviewers. Any product that may be evaluated in this article, or claim that may be made by its manufacturer, is not guaranteed or endorsed by the publisher.
The Supplementary Material for this article can be found online at: https://www.frontiersin.org/articles/10.3389/fcvm.2023.1129112/full#supplementary-material.
1. Manosroi W, Williams GH. Genetics of human primary hypertension: focus on hormonal mechanisms. Endocr Rev. (2019) 40(3):825–56. doi: 10.1210/er.2018-00071
2. Oparil S, Acelajado MC, Bakris GL, Berlowitz DR, Cífková R, Dominiczak AF, et al. Hypertension. Nat Rev Dis Primers. (2018) 4:18014. doi: 10.1038/nrdp.2018.14
3. Global Burden of Metabolic Risk Factors for Chronic Diseases Collaboration. Cardiovascular disease, chronic kidney disease, and diabetes mortality burden of cardiometabolic risk factors from 1980 to 2010: a comparative risk assessment. Lancet Diabetes Endocrinol. (2014) 2(8):634–47. doi: 10.1016/S2213-8587(14)70102-0
4. Zhou B, Perel P, Mensah GA, Ezzati M. Global epidemiology, health burden and effective interventions for elevated blood pressure and hypertension. Nat Rev Cardiol. (2021) 18(11):785–802. doi: 10.1038/s41569-021-00559-8
5. NCD Risk Factor Collaboration (NCD-RisC). Worldwide trends in hypertension prevalence and progress in treatment and control from 1990 to 2019: a pooled analysis of 1201 population-representative studies with 104 million participants. Lancet. (2021) 398(10304):957–80. doi: 10.1016/s0140-6736(21)01330-1
6. Mills KT, Bundy JD, Kelly TN, Reed JE, Kearney PM, Reynolds K, et al. Global disparities of hypertension prevalence and control: a systematic analysis of population-based studies from 90 countries. Circulation. (2016) 134(6):441–50. doi: 10.1161/circulationaha.115.018912
7. NCD Risk Factor Collaboration (NCD-RisC). Long-term and recent trends in hypertension awareness, treatment, and control in 12 high-income countries: an analysis of 123 nationally representative surveys. Lancet. (2019) 394(10199):639–51. doi: 10.1016/s0140-6736(19)31145-6
8. Lewington S, Clarke R, Qizilbash N, Peto R, Collins R. Age-specific relevance of usual blood pressure to vascular mortality: a meta-analysis of individual data for one million adults in 61 prospective studies. Lancet. (2002) 360(9349):1903–13. doi: 10.1016/s0140-6736(02)11911-8
9. Qi Y, Han X, Zhao D, Wang W, Wang M, Sun J, et al. Long-term cardiovascular risk associated with stage 1 hypertension defined by the 2017 ACC/AHA hypertension guideline. J Am Coll Cardiol. (2018) 72(11):1201–10. doi: 10.1016/j.jacc.2018.06.056
10. Egan BM, Stevens-Fabry S. Prehypertension–prevalence, health risks, and management strategies. Nat Rev Cardiol. (2015) 12(5):289–300. doi: 10.1038/nrcardio.2015.17
11. Maloberti A, Rebora P, Occhino G, Alloni M, Musca F, Belli O, et al. Prevalence of hypertension mediated organ damage in subjects with high-normal blood pressure without known hypertension as well as cardiovascular and kidney disease. J Hum Hypertens. (2022) 36(7):610–6. doi: 10.1038/s41371-021-00604-6
12. Selassie A, Wagner CS, Laken ML, Ferguson ML, Ferdinand KC, Egan BM. Progression is accelerated from prehypertension to hypertension in blacks. Hypertension. (2011) 58(4):579–87. doi: 10.1161/hypertensionaha.111.177410
13. Gu D, Wildman RP, Wu X, Reynolds K, Huang J, Chen CS, et al. Incidence and predictors of hypertension over 8 years among Chinese men and women. J Hypertens. (2007) 25(3):517–23. doi: 10.1097/HJH.0b013e328013e7f4
14. Han M, Li Q, Liu L, Zhang D, Ren Y, Zhao Y, et al. Prehypertension and risk of cardiovascular diseases: a meta-analysis of 47 cohort studies. J Hypertens. (2019) 37(12):2325–32. doi: 10.1097/hjh.0000000000002191
15. da Silva AA, do Carmo JM, Li X, Wang Z, Mouton AJ, Hall JE. Role of hyperinsulinemia and insulin resistance in hypertension: metabolic syndrome revisited. Can J Cardiol. (2020) 36(5):671–82. doi: 10.1016/j.cjca.2020.02.066
16. Mancusi C, Izzo R, di Gioia G, Losi MA, Barbato E, Morisco C. Insulin resistance the hinge between hypertension and type 2 diabetes. High Blood Press Cardiovasc Prev. (2020) 27(6):515–26. doi: 10.1007/s40292-020-00408-8
17. Ormazabal V, Nair S, Elfeky O, Aguayo C, Salomon C, Zuñiga FA. Association between insulin resistance and the development of cardiovascular disease. Cardiovasc Diabetol. (2018) 17(1):122. doi: 10.1186/s12933-018-0762-4
18. Heise T, Zijlstra E, Nosek L, Heckermann S, Plum-Mörschel L, Forst T. Euglycaemic glucose clamp: what it can and cannot do, and how to do it. Diabetes Obes Metab. (2016) 18(10):962–72. doi: 10.1111/dom.12703
19. Manley SE, Stratton IM, Clark PM, Luzio SD. Comparison of 11 human insulin assays: implications for clinical investigation and research. Clin Chem. (2007) 53(5):922–32. doi: 10.1373/clinchem.2006.077784
20. Muniyappa R, Lee S, Chen H, Quon MJ. Current approaches for assessing insulin sensitivity and resistance in vivo: advantages, limitations, and appropriate usage. Am J Physiol Endocrinol Metab. (2008) 294(1):E15–26. doi: 10.1152/ajpendo.00645.2007
21. Bala C, Gheorghe-Fronea O, Pop D, Pop C, Caloian B, Comsa H, et al. The association between six surrogate insulin resistance indexes and hypertension: a population-based study. Metab Syndr Relat Disord. (2019) 17(6):328–33. doi: 10.1089/met.2018.0122
22. Er LK, Wu S, Chou HH, Hsu LA, Teng MS, Sun YC, et al. Triglyceride glucose-body mass Index is a simple and clinically useful surrogate marker for insulin resistance in nondiabetic individuals. PloS One. (2016) 11(3):e0149731. doi: 10.1371/journal.pone.0149731
23. Raimi TH, Dele-Ojo BF, Dada SA, Fadare JO, Ajayi DD, Ajayi EA, et al. Triglyceride-glucose index and related parameters predicted metabolic syndrome in Nigerians. Metab Syndr Relat Disord. (2021) 19(2):76–82. doi: 10.1089/met.2020.0092
24. Wang R, Dai L, Zhong Y, Xie G. Usefulness of the triglyceride glucose-body mass index in evaluating nonalcoholic fatty liver disease: insights from a general population. Lipids Health Dis. (2021) 20(1):77. doi: 10.1186/s12944-021-01506-9
25. Li Y, You A, Tomlinson B, Yue L, Zhao K, Fan H, et al. Insulin resistance surrogates predict hypertension plus hyperuricemia. J Diabetes Investig. (2021) 12(11):2046–53. doi: 10.1111/jdi.13573
26. Jiang C, Yang R, Kuang M, Yu M, Zhong M, Zou Y. Triglyceride glucose-body mass index in identifying high-risk groups of pre-diabetes. Lipids Health Dis. (2021) 20(1):161. doi: 10.1186/s12944-021-01594-7
27. Wang X, Liu J, Cheng Z, Zhong Y, Chen X, Song W. Triglyceride glucose-body mass index and the risk of diabetes: a general population-based cohort study. Lipids Health Dis. (2021) 20(1):99. doi: 10.1186/s12944-021-01532-7
28. Okamura T, Hashimoto Y, Hamaguchi M, Obora A, Kojima T, Fukui M. Ectopic fat obesity presents the greatest risk for incident type 2 diabetes: a population-based longitudinal study. Int J Obes. (2019) 43(1):139–48. doi: 10.1038/s41366-018-0076-3
29. Hamaguchi M, Kojima T, Itoh Y, Harano Y, Fujii K, Nakajima T, et al. The severity of ultrasonographic findings in nonalcoholic fatty liver disease reflects the metabolic syndrome and visceral fat accumulation. Am J Gastroenterol. (2007) 102(12):2708–15. doi: 10.1111/j.1572-0241.2007.01526.x
30. WHO Expert Consultation. Appropriate body-mass index for Asian populations and its implications for policy and intervention strategies. Lancet. (2004) 363(9403):157–63. doi: 10.1016/s0140-6736(03)15268-3
31. Sánchez-García A, Rodríguez-Gutiérrez R, Mancillas-Adame L, González-Nava V, Díaz González-Colmenero A, Solis RC, et al. Diagnostic accuracy of the triglyceride and glucose Index for insulin resistance: a systematic review. Int J Endocrinol. (2020) 2020:4678526. doi: 10.1155/2020/4678526
32. Hashimoto Y, Hamaguchi M, Kojima T, Ohshima Y, Ohbora A, Kato T, et al. Modest alcohol consumption reduces the incidence of fatty liver in men: a population-based large-scale cohort study. J Gastroenterol Hepatol. (2015) 30(3):546–52. doi: 10.1111/jgh.12786
33. Ryu S, Chang Y, Kim DI, Kim WS, Suh BS. Gamma-glutamyltransferase as a predictor of chronic kidney disease in nonhypertensive and nondiabetic Korean men. Clin Chem. (2007) 53(1):71–7. doi: 10.1373/clinchem.2006.078980
34. Umemura S, Arima H, Arima S, Asayama K, Dohi Y, Hirooka Y, et al. The Japanese society of hypertension guidelines for the management of hypertension (JSH 2019). Hypertens Res. (2019) 42(9):1235–481. doi: 10.1038/s41440-019-0284-9
35. Kim JH. Multicollinearity and misleading statistical results. Korean J Anesthesiol. (2019) 72(6):558–69. doi: 10.4097/kja.19087
36. Vandenbroucke JP, von Elm E, Altman DG, Gøtzsche PC, Mulrow CD, Pocock SJ, et al. Strengthening the reporting of observational studies in epidemiology (STROBE): explanation and elaboration. Int J Surg. (2014) 12(12):1500–24. doi: 10.1016/j.ijsu.2014.07.014
37. DeLong ER, DeLong DM, Clarke-Pearson DL. Comparing the areas under two or more correlated receiver operating characteristic curves: a nonparametric approach. Biometrics. (1988) 44(3):837–45. doi: 10.2307/2531595
38. Lloyd-Jones DM, Evans JC, Levy D. Hypertension in adults across the age spectrum: current outcomes and control in the community. J Am Med Assoc. (2005) 294(4):466–72. doi: 10.1001/jama.294.4.466
39. Kokubo Y, Kamide K, Okamura T, Watanabe M, Higashiyama A, Kawanishi K, et al. Impact of high-normal blood pressure on the risk of cardiovascular disease in a Japanese urban cohort: the suita study. Hypertension. (2008) 52(4):652–9. doi: 10.1161/hypertensionaha.108.118273
40. Lee M, Saver JL, Chang B, Chang KH, Hao Q, Ovbiagele B. Presence of baseline prehypertension and risk of incident stroke: a meta-analysis. Neurology. (2011) 77(14):1330–7. doi: 10.1212/WNL.0b013e3182315234
41. Romero F, Casares SF, Rubia RG, Rubia R, Lázaro M, Calzada C. Hypertension and dyslipidemia. Rev Esp Cardiol. (1998) 51(Suppl 4):24–35. doi: 10.1016/S0021-9150(99)80573-5
42. Huang Y, Gao L, Xie X, Tan SC. Epidemiology of dyslipidemia in Chinese adults: meta-analysis of prevalence, awareness, treatment, and control. Popul Health Metr. (2014) 12(1):28. doi: 10.1186/s12963-014-0028-7
43. Yu S, Sun Z, Zheng L, Guo X, Yang H, Sun Y. Prevalence of diabetes and impaired fasting glucose in hypertensive adults in rural China: far from leveling-off. Int J Environ Res Public Health. (2015) 12(11):14764–79. doi: 10.3390/ijerph121114764
44. Lee SH, Park SY, Choi CS. Insulin resistance: from mechanisms to therapeutic strategies. Diabetes Metab J. (2022) 46(1):15–37. doi: 10.4093/dmj.2021.0280
45. Petersen MC, Shulman GI. Mechanisms of insulin action and insulin resistance. Physiol Rev. (2018) 98(4):2133–223. doi: 10.1152/physrev.00063.2017
46. Rossier BC, Bochud M, Devuyst O. The hypertension pandemic: an evolutionary perspective. Physiology. (2017) 32(2):112–25. doi: 10.1152/physiol.00026.2016
47. Guerrero-Romero F, Simental-Mendía LE, González-Ortiz M, Martínez-Abundis E, Ramos-Zavala MG, Hernández-González SO, et al. The product of triglycerides and glucose, a simple measure of insulin sensitivity. Comparison with the euglycemic-hyperinsulinemic clamp. J Clin Endocrinol Metab. (2010) 95(7):3347–51. doi: 10.1210/jc.2010-0288
48. Bastard JP, Lavoie ME, Messier V, Prud'homme D, Rabasa-Lhoret R. Evaluation of two new surrogate indices including parameters not using insulin to assess insulin sensitivity/resistance in non-diabetic postmenopausal women: a MONET group study. Diabetes Metab. (2012) 38(3):258–63. doi: 10.1016/j.diabet.2012.01.004
49. Zeng ZY, Liu SX, Xu H, Xu X, Liu XZ, Zhao XX. Association of triglyceride glucose index and its combination of obesity indices with prehypertension in lean individuals: a cross-sectional study of Chinese adults. J Clin Hypertens. (2020) 22(6):1025–32. doi: 10.1111/jch.13878
50. Heianza Y, Kodama S, Arase Y, Hsieh SD, Yoshizawa S, Tsuji H, et al. Role of body mass index history in predicting risk of the development of hypertension in Japanese individuals: toranomon hospital health management center study 18 (TOPICS 18). Hypertension. (2014) 64(2):247–52. doi: 10.1161/HYPERTENSIONAHA.113.02918
51. Tyson CC, Appel LJ, Vollmer WM, Jerome GJ, Brantley PJ, Hollis JF, et al. Impact of 5-year weight change on blood pressure: results from the weight loss maintenance trial. J Clin Hypertens. (2013) 15(7):458–64. doi: 10.1111/jch.12108
52. Fan J, Shi X, Jia X, Wang Y, Zhao Y, Bao J, et al. Birth weight, childhood obesity and risk of hypertension: a Mendelian randomization study. J Hypertens. (2021) 39(9):1876–83. doi: 10.1097/hjh.0000000000002871
53. Battistoni A, Canichella F, Pignatelli G, Ferrucci A, Tocci G, Volpe M. Hypertension in young people: epidemiology, diagnostic assessment and therapeutic approach. High Blood Press Cardiovasc Prev. (2015) 22(4):381–8. doi: 10.1007/s40292-015-0114-3
54. Bao W, Threefoot SA, Srinivasan SR, Berenson GS. Essential hypertension predicted by tracking of elevated blood pressure from childhood to adulthood: the bogalusa heart study. Am J Hypertens. (1995) 8(7):657–65. doi: 10.1016/0895-7061(95)00116-7
55. Kollias A, Pantsiotou K, Karpettas N, Roussias L, Stergiou GS. Tracking of blood pressure from childhood to adolescence in a Greek cohort. Eur J Public Health. (2012) 22(3):389–93. doi: 10.1093/eurpub/ckr082
56. Lurbe E. Childhood blood pressure: a window to adult hypertension. J Hypertens. (2003) 21(11):2001–3. doi: 10.1097/00004872-200311000-00004
57. Black N. Why we need observational studies to evaluate the effectiveness of health care. Br Med J. (1996) 312(7040):1215–8. doi: 10.1136/bmj.312.7040.1215
58. Maloberti A, Vanoli J, Finotto A, Bombelli M, Facchetti R, Redon P, et al. Uric acid relationships with lipid profile and adiposity indices: impact of different hyperuricemic thresholds. J Clin Hypertens. (2023) 25(1):78–85. doi: 10.1111/jch.14613
Keywords: hypertension, TyG-BMI, general population, triglyceride glucose body mass index, normal-high blood pressure values
Citation: Peng N, Kuang M, Peng Y, Yu H, Zhang S, Xie G, Sheng G and Zou Y (2023) Associations between TyG-BMI and normal-high blood pressure values and hypertension: cross-sectional evidence from a non-diabetic population. Front. Cardiovasc. Med. 10:1129112. doi: 10.3389/fcvm.2023.1129112
Received: 3 January 2023; Accepted: 11 April 2023;
Published: 24 April 2023.
Edited by:
Francesco Spannella, Università Politecnica delle Marche, ItalyReviewed by:
Liying Xing, CDC of Liaoning Province, China© 2023 Peng, Kuang, Peng, Yu, Zhang, Xie, Sheng and Zou. This is an open-access article distributed under the terms of the Creative Commons Attribution License (CC BY). The use, distribution or reproduction in other forums is permitted, provided the original author(s) and the copyright owner(s) are credited and that the original publication in this journal is cited, in accordance with accepted academic practice. No use, distribution or reproduction is permitted which does not comply with these terms.
*Correspondence: Yang Zou anh5eHl6eUAxNjMuY29t
†These authors have contributed equally to this work and share first authorship
Disclaimer: All claims expressed in this article are solely those of the authors and do not necessarily represent those of their affiliated organizations, or those of the publisher, the editors and the reviewers. Any product that may be evaluated in this article or claim that may be made by its manufacturer is not guaranteed or endorsed by the publisher.
Research integrity at Frontiers
Learn more about the work of our research integrity team to safeguard the quality of each article we publish.