 Xuan Deng
 Yongjian Song2†
 Xueyu Chen
 Shouling Wu
 Yong Zhou
95% of researchers rate our articles as excellent or good
Learn more about the work of our research integrity team to safeguard the quality of each article we publish.
Find out more
ORIGINAL RESEARCH article
Front. Cardiovasc. Med. , 27 March 2023
Sec. Cardiovascular Epidemiology and Prevention
Volume 10 - 2023 | https://doi.org/10.3389/fcvm.2023.1092525
This article is part of the Research Topic Lifestyle and Vascular Ageing View all 6 articles
Objective: The “trajectory” phenotype was observed in several cardiovascular risk factors with aging. We aim to identify multiple brachial-ankle Pulse Wave Velocity (baPWV) trajectory phenotypes and assess their determinants.
Methods: Among 5,182 participants with baPWV measurements (2010–2016) at no less than three time points in Kailuan Study, we derived baPWV trajectory pattern using SAS Proc Traj program. We applied the lowest Bayesian information criterion to identify the best typing model, related the identified trajectory pattern to baseline and changes in characteristics.
Results: Among 5.3 ± 1.7 years follow-up, four distinct baPWV trajectories were identified as low (1,961,37.8%), medium-low (1,846,35.6%), medium-high (1,024,19.8%), and high (351,6.8%) groups. In the stepwise models, mean arterial pressure and age were the main determinators of the trajectory patterns, with a Δpseudo-R2 of 0.335 and 0.164, respectively. With the low trajectory group as reference and multivariable adjustment, odd ratios of medium low, medium high and high associated with 1 mmHg increment of mean arterial pressure were 1.08(95%CI: 1.07–1.09), 1.13(1.12–1.14), and 1.16(1.15–1.18). The estimates for age were 1.08(1.07–1.10), 1.20(1.18–1.21) and 1.28(1.26–1.31). Additionally, baseline resting heart rate, low-density lipoprotein cholesterol, fasting blood glucose, hypersensitive C-reaction protein and uric acid, and changes in mean arterial pressure, resting heart rate, fasting blood glucose, and uric acid were positively associated with the trajectory, while BMI was negatively associated.
Conclusions: The changes in baPWV overtime followed a “trajectory” pattern, mainly determined by mean arterial pressure and age.
Aging has long been accepted as a non-modifiable risk factor and is highly associated with the progress of aging-related disease, such as arteriosclerosis (1). Arteriosclerosis is also a major hallmark of vascular aging and serves as an independent risk factor for cardiovascular and cerebrovascular diseases (CVD) (2–7). The progression of arteriosclerosis is affected by several factors, especially aging and hypertension (8, 9). However, previous studies have demonstrated that it may differ among individuals according to age, sex, and several traditional cardiovascular risk factors (8–12). Pulse wave velocity (PWV) has been used as a valuable index of arterial stiffness and as a surrogate marker for atherosclerosis (13). To date, some arteriosclerosis-related epidemiologic studies have only focused on brachial-ankle pulse wave velocity (baPWV) from one or a limited number of time-points, ignoring the dynamic changes in the baPWV index that occur over time. Hence, a life-course evaluation for arteriosclerotic progression is essential.
In some cohort studies, the “trajectory” phenotype was observed in several cardiovascular risk factors with aging (14–16), such as blood pressure, non-HDL, and body mass index (BMI), which suggests that the trajectory phenotypes of different risk factors might be a better index for CVD diagnosis and prognosis. However, the data on baPWV trajectory phenotypes in populations at high risk of cardiovascular diseases is limited. Therefore, this study aimed to identify multiple baPWV trajectory phenotypes and explore their risk factors in a Kailuan community-based cohort study with a 15-year follow-up.
The Kailuan Study (Registration Number: ChiCTR-TNC-11001489) was a community-based cohort study. Participants were recruited from Kailuan communities (Tangshan City, northern China) and follow-up information was obtained biennially from 2010 to 2016 (17). A total of 5,182 participants were involved in the final analyses after excluding those who did not complete a minimum of three assay repetitions of baPWV (n = 30,927); those with history of stroke, myocardial infarction, heart failure, or tumor (n = 100); and those with atrial fibrillation and an ankle-brachial index ≤0.9 (n = 160). This study was conducted according to the guidelines of the Helsinki Declaration and was approved by the Ethics Committee of Kailuan General Hospital. Signed informed consent was obtained from all participants.
Clinical examination and questionnaire baseline data were collected by trained research staff according to standard operating procedures. The questionnaire included items on participant age, sex, smoking and drinking history, physical activity, current prescription medication, and medical history. Clinical examination included measurements of weight, height, waist circumference, resting heart rate, systolic blood pressure (SBP), and diastolic blood pressure (DBP). BMI was calculated as weight (kg)/height (m2) (18). Blood pressure and resting heart rate were measured via an Omron® electronic automated blood pressure monitor. Hypertension was defined as a SBP ≥140 mmHg or a DBP ≥90 mmHg, a history of hypertension, or treatment with antihypertensive medications (19). Diabetes mellitus was a self-reported diagnosis, a fasting blood glucose (FBG) level of ≥7.0 mmol/L (126 mg/dl), or use of antidiabetic agents (20).
Blood samples of all participants were collected by venipuncture. FBG, low-density lipoprotein cholesterol (LDL-C), serum uric acid, and high-sensitivity C-reactive protein (Hs-CRP) were determined by the Friedewald formula (11). The estimated glomerular filtration rate (eGFR) was calculated according to the Chronic Kidney Disease Epidemiology Collaboration formula (21).
BaPWV was measured in some participants from 2010 (the third follow-up), and the baPWV of the study population was repeatedly assessed during each follow-up. It was measured by an Omron Colin BP-203RPE III device (Omron Health Care, China). Before the measurement, the participants were instructed not to smoke and had to rest for at least 5 min. The temperature of the examination room was maintained at 22–25°C. The participant was placed in a supine position, and cuffs were wrapped on both arms and ankles. The heart sound collection device was placed in the pre-heart area. The electrocardiogram (ECG) collection device was clamped on the left and right wrists and connected to the plethysmography sensor and the oscillation pressure sensor. We repeated the measurement twice for each participant, and recorded the second data as the final result; we used the larger value of baPWV on the left and right sides for analysis. We categorized the levels of baPWV into three grades: low (<14.0 m/s), intermediate (14.0–17.9 m/s), and high (≥18.0 m/s) (22).
The trajectories of baPWV were identified using PROC TRAJ in SAS® v.9.4 (SAS Institute Inc, Cary, NC, United States) (23). The best typing model was selected based on the lowest Bayesian information criterion. After the typing was determined, the highest power of each trajectory curve was determined according to the probability (>70%) that the observed object meets the trajectory curve. The Kolmogorov-Smirnov test was used to test for a normal distribution of continuous variables. Data with a normal distribution were expressed as mean ± standard deviation and analyzed by one-way analysis of variance. Categorical data were presented as frequencies and percentages (%), and differences between types were evaluated by χ2 test.
Multivariate regression analysis was used to evaluate the association of baPWV trajectory with baseline data. We adjusted covariates including age, sex, mean arterial pressure (MAP, computed as 1/3 SBP + 2/3 DBP), resting heart rate, BMI, waist circumference, FBG, LDL-C, Hs-CRP, uric acid, and eGFR. Multiple logistic regression analysis was used to explore factors associated with baPWV longitudinal trajectory. The forward stepwise method was used for multiple logistic regression (enter probability: 0.05, remove probability: 0.10). In addition, we performed a multiple analysis with adjustment of the following variables: Δ MAP, Δ resting heart rate, Δ BMI, Δ waist circumference, Δ FBG, ΔLDL-C, ΔHs-CRP, Δ uric acid, and Δ eGFR to assess their effect on the baPWV longitudinal trajectory during the follow-up. A likelihood ratio test was used to assess the significance of the model fit. The effectiveness of the model was estimated with the Nagelkerke pseudo-R2 statistic (a measure of explained variation in the model). Sensitivity analysis was performed based on baseline antihypertensive drugs, new-onset hypertension, diabetes, and participants with cardiovascular disease during the follow-up period. A two-sided p < 0.05 was considered statistically significant. Statistical analyses were performed using SAS® v.9.4 (SAS Institute Inc).
The study included totally 5,182 participants, of whom 2,445 (47.18%) were male. The average age was 46.87 ± 9.57 years at baseline. The median follow-up year is 5.66 years (Interquartile range, 4.12–6.52 years). Supplementary Table S1 summarizes the baseline and follow-up characteristics of the participants. Compared with baseline levels, the following variables significantly increased (p < 0.001): MAP, resting heart rate, LDL-C, BMI, waist circumference, FBG, and uric acid. The prevalence of hypertension and diabetes also increased. More participants during follow-up received antihypertensive medications, anti-diabetic medications, or lipid-lowering medications. In contrast, the proportion of physical exercisers, smokers, and alcohol drinkers decreased. All the above trends were statistically significant (p < 0.001). A comparison between the baseline characteristics of the included participants and the general population who only underwent a single baPWV measurement is shown in Supplementary Table S2. Compared with the general population, the participants tended to have lower levels of MAP, resting heart rate, waist circumference, BMI, LDL-C, FBG, Hs-CRP, and uric acid, with a relatively elevated eGFR level. In addition, there was a lower prevalence of high/low-density lipoproteinemia and diabetes in the study population, and relatively fewer smokers, but more alcohol drinkers.
A total of 17,331 baPWV measurements were performed among 5,182 participants, with a mean of 3.34 ± 0.48 times for each. The annual growth rate of baPWV was 0.14 ± 0.40 m/s/y. Four baPWV trajectories were identified, including a low group, medium-low group, medium-high group, and high group. In the low group (1,961 cases, 37.84%), the mean baPWV increased from 11.70 to 12.24 m/s, with an increase of 0.54 m/s and an annual growth rate of 0.10 m/s/y. In the medium-low group (1,846 cases, 35.62%), the mean baPWV increased from 14.07 to 14.94 m/s, with an increase of 0.87 m/s and an annual growth rate of 0.16 m/s/y. In the medium-high group (1,024 cases, 19.76%), the mean baPWV increased from 16.53 to 17.75 m/s, with an increase of 1.22 m/s and an annual growth rate of 0.21 m/s/y. In the high group (351 cases, 6.77%), the mean value of baPWV increased from 19.90 to 21.09 m/s, with an increase of 1.19 m/s and an annual growth rate of 0.15 m/s/y. The probability of each type (low group, medium-low group, medium-high group, and high group) meeting the trajectory curve was 90.72%, 84.86%, 87.33%, and 91.93%, respectively (Figure 1 and Table 1). The trajectories of males and females were consistent with that of the total participants. The initial baPWV of each trajectory type in females was lower than that in males, while there was no difference observed in the baPWV annual growth rate (0.14 m/s/y) (Supplementary Figure S1 and Tables S3, S4).
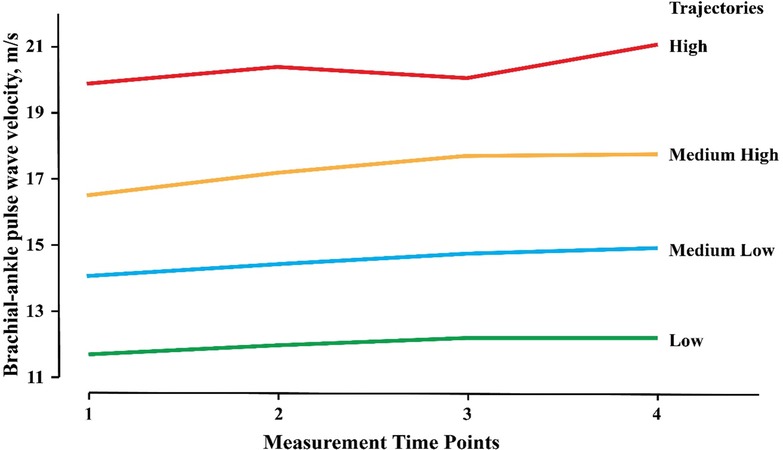
Figure 1. Trajectories of baPWV among 5182 participants. The baPWV Trajectories derived from 17,331 consecutive baPWV measurements in 5,182 participants enrolled in the Kailuan Study and had at least three times of measurements. baPWV, brachial-ankle pulse wave velocity.
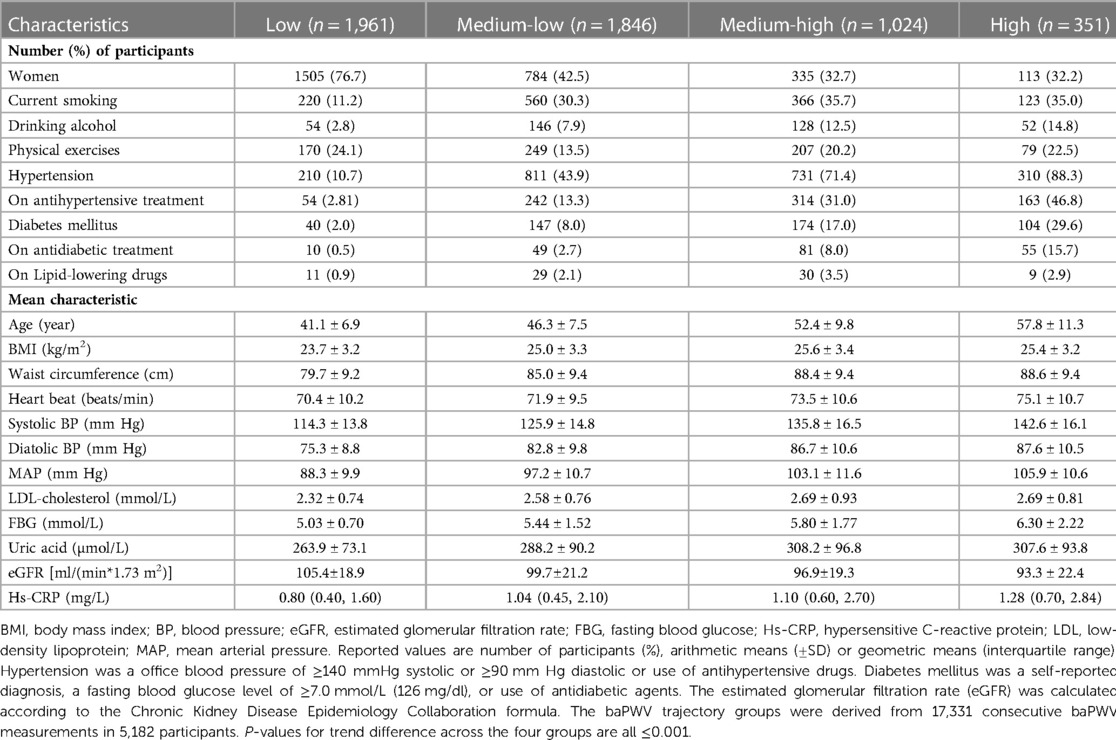
Table 1. Baseline characteristics by baPWV trajectory groups.
A comparison of the baseline characteristics among different baPWV trajectory groups is shown in Table 2. With an increasing baPWV longitudinal trajectory level, the following covariates showed an upward trend: age; male proportion; SBP; DBP; MAP; resting heart rate; BMI; waist circumference; LDL-C; FBG; Hs-CRP; uric acid; proportion of smokers, alcohol drinkers, and physical exercisers; and participants with history of hypertension and diabetes, and antihypertensive, anti-diabetic, and lipid-lowering medications. In contrast, the level of eGFR decreased. All the above trends were statistically significant (p < 0.001). Changes in the main independent variable parameters among different trajectory groups during follow-up are presented in Table 3. Δ FBG and Δ uric acid significantly increased (p < 0.01), and the percentage of participants with new-onset hypertension, diabetes, and cardiovascular disease also increased (p < 0.001). However, levels of Δ BMI, Δ waist circumference, Δ LDL-C, and Δ eGFR significantly decreased during follow-up (p < 0.001).
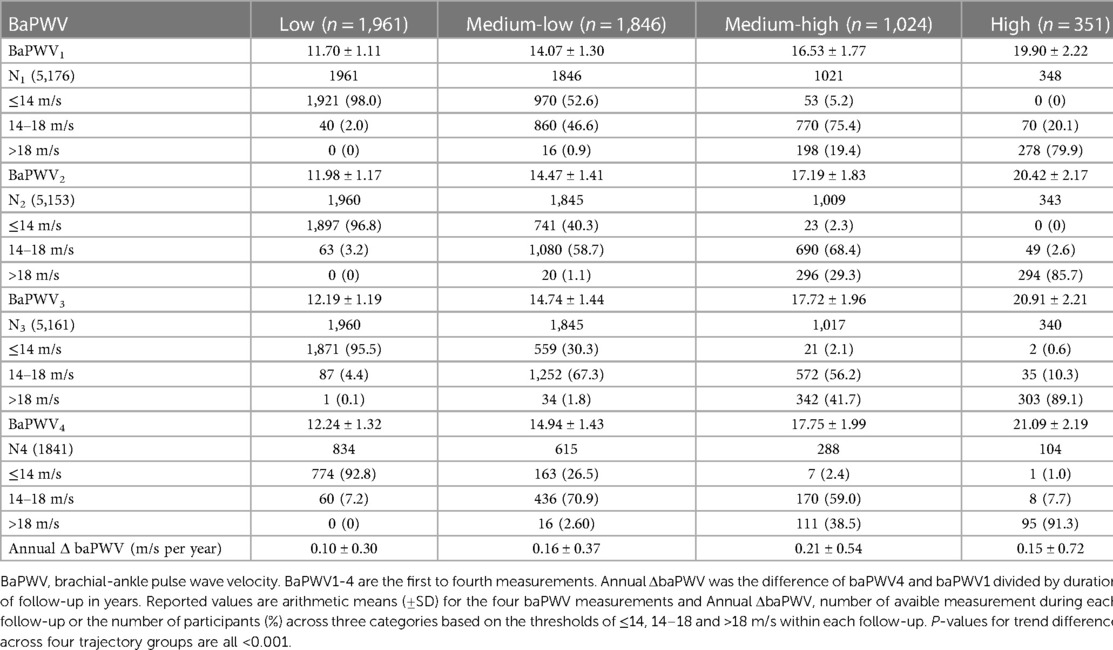
Table 2. Consecutive baPWV measurements across four trajectory groups.

Table 3. Changes in variables across baPWV trajectory groups.
We also explored the factors relevant to the baPWV longitudinal trajectory. Compared to the low trajectory group, older participants, males, alcohol drinkers, and those with higher levels of MAP, resting heart rate, FBG, LDL-C, Hs-CRP, and uric acid tended to have a higher risk of inclusion in the high trajectory groups. We further investigated the effect of changes in the above-mentioned variables on the baPWV longitudinal trajectory during the follow-up. After fully adjusting, baseline MAP, resting heart rate, FBG, and uric acid were positively associated with the baPWV trajectory. In addition, the participants with increased ΔMAP, Δ resting heart rate, ΔFBG, and Δ uric acid had an increased risk of inclusion into the higher trajectory group. The fitting degree of the model increased by 5.1%–59.1% after adjustment (Table 4).
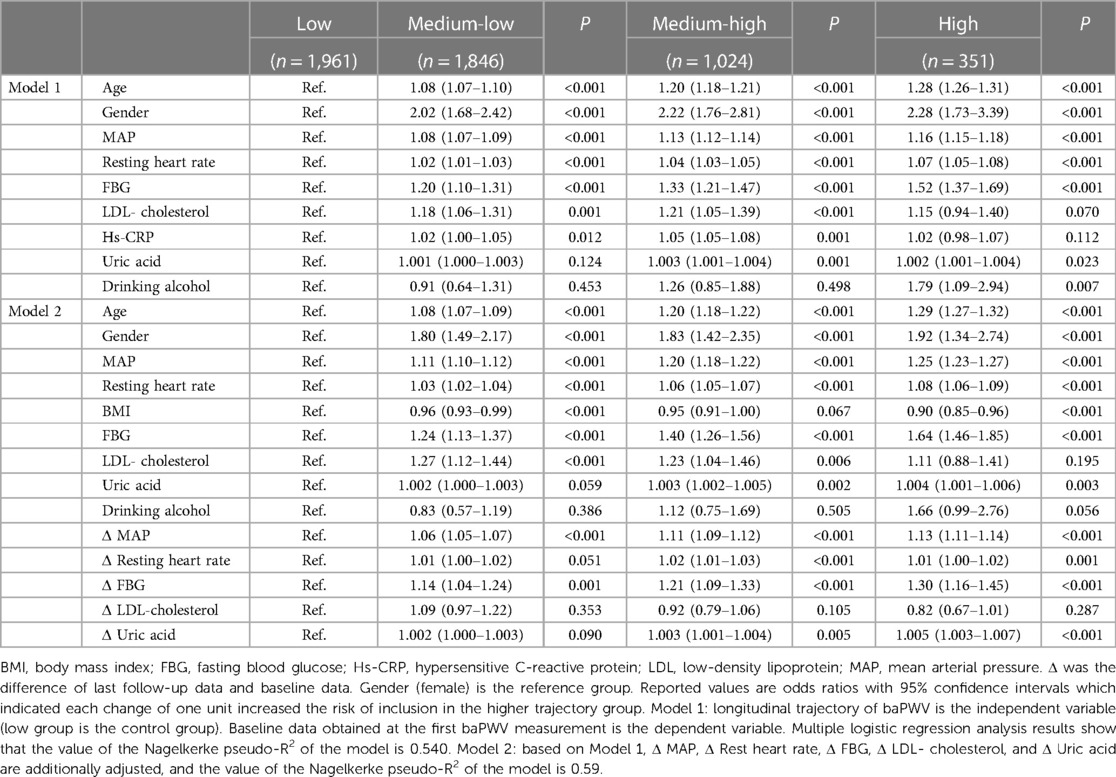
Table 4. Association of baseline measurements and changes in variables with baPWV trajectories.
The 54% variation of the baPWV trajectory was interpreted by baseline data: 33.5% by MAP, 16.4% by age, 1.3% by sex, and 1.3% by resting heart rate. The rest of the variation was interpreted by a combination of FBG, uric acid, Hs-CRP, LDL-C, and drinking. After adding the adjusted value of the independent variable, the interpretation degree of the variation of the baPWV trajectory increased by 5.1%, of which 49.9% was still interpreted by MAP (33.5%) and age (16.4%), while the rest was interpreted by ΔMAP (5.4%), resting heart rate (1.2%), and other variables (Supplementary Table S5). In addition, the effect relationship between age and baPWV was found by restricted cubic spline plot (RCS). A positive correlation exists between age and baPWV, and the baPWV value gradually increases with age (Supplementary Figure S3).
A sensitivity analysis was conducted on baseline antihypertensive medication, new-onset hypertension, new-onset diabetes, and new-onset CVD population. We found that advanced age; male sex; high levels of MAP, resting heart rate, FBG, LDL-C, and uric acid; low BMI; and increased MAP, resting heart rate, FBG, and uric acid remained risk factors for high baPWV level (Supplementary Table S6).
This longitudinal study indicated that there were four trajectories of arteriosclerosis progression in middle-aged participants: low, medium-low, medium-high, high trajectories. These trajectories had good intra-type homogeneity and inter-type heterogeneity. They were independent and did not overlap. There was a significant difference in the baPWV baselines and growth rates of trajectories. The trajectory curve fitted well. The majority of participants with a healthy condition (92.8%) belonged to the low group and those with arteriosclerosis (79.89%) were mainly in the high group. The number of participants in the high group accounted for about 7.0%. The probability of meeting the trajectory in the medium-low type was the lowest (85.0%). The trajectories determined in our study met the trajectory standard proposed by Nagin et al. (23). Hence, the trajectory was relatively objective and might not be caused by random errors or confounding factors.
The study showed that advanced age and high MAP were the main risk factors for high baPWV. Our findings are consistent with previous studies that have suggested an association between advanced age and arteriosclerosis in the general population, diabetic population, and hypertensive population (2, 24–26). Considering the complex association between blood pressure and arteriosclerosis, we used MAP as an independent variable to observe its effect on the trajectories of arteriosclerosis. Our findings are consistent with previous studies that have indicated an association between baseline and changes in MAP, and the progression of arteriosclerosis. Furthermore, antihypertensive treatment could only slow down the progression of arteriosclerosis caused by advanced age (27). In our previous study, we also found that the hypertension caused by aging could be mediated by arteriosclerosis (24). The high MAP might be the result of the high trajectory of arteriosclerosis. Therefore, we suggested that the relationship between hypertension and arteriosclerosis is bidirectional, and arteriosclerosis plays a leading role. In addition, We also found that baPWV increases with age, especially between 45 and 55 years old, which means that the change of baPWV will accelerate after 45 years old. Our result is comparable to a cross-sectional study (28).
Compared with age and MAP, factors including baseline resting heart rate, FBG, L-DLC, hs-CRP, and uric acid had less effect on the trajectories of arteriosclerosis. Our findings are consistent with previous studies. Some studies have found that resting heart rate or hs-CRP were risk factors for arteriosclerosis in males (29–31). Nevertheless, the effects of glucose and lipid metabolic abnormalities on the progression of arteriosclerosis are inconsistent (32–35). Apart from different study populations, these inconsistencies also might be caused by the weak effect of these factors on arteriosclerosis. Changes in risk factors during follow-up also influenced the trajectories. An increase in MAP, resting heart rate, FBG, or uric acid during follow-up increased the risk of inclusion into the high group, while this increase of risk was less than that caused by baseline data. Baseline data represents the exposure of risk factors accumulated in the decades before the measurement of baPWV. Therefore, it has a large impact on the trajectories. While the increase in MAP, resting heart rate, FBG, and uric acid during follow-up could only represent the exposure level of risk factors during follow-up. This explains why it had little effect on the trajectories. Although we included traditional cardiovascular risk factors and possible influencing factors in the model, the whole model could only explain a portion (59.1%) of the trajectories. We speculated that the unexplained part is determined by individual genetic factors (36).
We also explored the baPWV trajectory in different sexes, and the trajectories are similar to the total population. Compared with males, the initial bapwv of females in each trajectory group is slightly smaller. However, we did not observe the significant difference in the annual growth rate between males and females. In other studies, there is also no significant difference of baPWV was observed between the sexes (37). However, the gender difference some studies have proposed the differences in relative young population aged from 4 to 29 years (38). We speculated this inconsistency might be caused the different age range of the study population.
Our study has some limitations. First, baPWV is currently recognized as a good indicator of arterial stiffness, but it is not the gold standard for the diagnosis of arteriosclerosis. Second, although we incorporated traditional cardiovascular risk factors and other possible risk factors in the model, we did not consider the influence of genetic factors on baPWV. In addition, consideration of the adjusted blood pressure effect on baPWV levels was missing in this study. In our study, the observation about the trajectory change of baPWV and the intervention of baPWV level is missing, which might be more valuable to predict the future atherosclerotic disease. Finally, the trajectories of baPWV change in a middle-aged population in this study are limited to 5 years.
To our knowledge, the current study is the first to demonstrate the dynamic changes in the baPWV. We observed the change of baPWV showed a “trajectory” pattern in the middle-aged population, and we also explored the factors associated with baPWV trajectory and identified that age and MAP were the two main determinants of baPWV trajectory.
The datasets used and/or analyzed during the current study are available from the corresponding author on reasonable request.
The studies involving human participants were reviewed and approved by This study was conducted according to the guidelines of the Helsinki Declaration and was approved by the Ethics Committee of Kailuan General Hospital. Signed informed consent was obtained from all participants. The patients/participants provided their written informed consent to participate in this study.
YZ and SW conceived and designed the study and analyses. XD and YS analyzed data and drafted the paper. Material preparation and data collection were performed by XH and XC. WY revised it critically for important intellectual content. XD and YS contributed equally. All authors listed have made a substantial, direct, and intellectual contribution to the work and approved it for publication. All authors contributed to the article and approved the submitted version.
This work was supported by the National Key R&D Program of China (Grant Numbers 2021YFC2500500); National Natural Science Foundation of China (Grant Numbers 81973112, 92049302, U22A20364).
The authors thank all the survey teams of the Kailuan study group for their contribution and the study participants who contributed their information.
The authors declare that the research was conducted in the absence of any commercial or financial relationships that could be construed as a potential conflict of interest.
All claims expressed in this article are solely those of the authors and do not necessarily represent those of their affiliated organizations, or those of the publisher, the editors and the reviewers. Any product that may be evaluated in this article, or claim that may be made by its manufacturer, is not guaranteed or endorsed by the publisher.
The Supplementary Material for this article can be found online at: https://www.frontiersin.org/articles/10.3389/fcvm.2023.1092525/full#supplementary-material.
1. Al-Shaer MH, Choueiri NE, Correia ML, Sinkey CA, Barenz TA, Haynes WA. Effects of aging and atherosclerosis on endothelial and vascular smooth muscle function in humans. Int J Cardiol. (2006) 109(2):201–6. doi: 10.1016/j.ijcard.2005.06.002
2. Mitchell GF, Parise H, Benjamin EJ, Larson MG, Keyes MJ, Vita JA, et al. Changes in arterial stiffness and wave reflection with advancing age in healthy men and women: the framingham heart study. Hypertension. (2004) 43:1239–45. doi: 10.1161/01.HYP.0000128420.01881.aa
3. Benjamin EJ, Blaha MJ, Chiuve SE, Cushman M, Das SR, Deo R, et al. Heart disease and stroke statistics-2017 update: a report from the American heart association. Circulation. (2017) 135:e146–e603. doi: 10.1161/CIR.0000000000000485
4. Ohkuma T, Ninomiya T, Tomiyama H, Kario K, Hoshide S, Kita Y, et al. Brachial-ankle pulse wave velocity and the risk prediction of cardiovascular disease: an individual participant data meta-analysis. Hypertension. (2017) 69:1045–52. doi: 10.1161/HYPERTENSIONAHA.117.09097
5. Kaess BM, Rong J, Larson MG, Hamburg NM, Vita JA, Levy D, et al. Aortic stiffness, blood pressure progression, and incident hypertension. JAMA. (2012) 308:875–81. doi: 10.1001/2012.jama.10503
6. Ford ML, Tomlinson LA, Chapman TP, Rajkumar C, Holt SG. Aortic stiffness is independently associated with rate of renal function decline in chronic kidney disease stages 3 and 4. Hypertension. (2010) 55(5):1110–5. doi: 10.1161/HYPERTENSIONAHA.109.143024
7. Waldstein SR, Rice SC, Thayer JF, Najjar SS, Scuteri A, Zonderman AB. Pulse pressure and pulse wave velocity are related to cognitive decline in the Baltimore Longitudinal Study of Aging. Hypertension. (2008) 51(1):99–104. doi: 10.1161/HYPERTENSIONAHA.107.093674
8. O’Rourke MF, Nichols WW. Aortic diameter, aortic stiffness, and wave reflection increase with age and isolated systolic hypertension. Hypertension. (2005) 45(4):652–8. doi: 10.1161/01.HYP.0000153793.84859.b8
9. Cecelja M, Chowienczyk P. Dissociation of aortic pulse wave velocity with risk factors for cardiovascular disease other than hypertension: a systematic review. Hypertension. (2009) 5(6):1328–36. doi: 10.1161/HYPERTENSIONAHA.109.137653
10. Benetos A, Adamopoulos C, Bureau JM, Temmar M, Labat C, Bean K, et al. Determinants of accelerated progression of arterial stiffness in normotensive subjects and in treated hypertensive subjects over a 6-year period. Circulation. (2002) 105(10):1202–7. doi: 10.1161/hc1002.105135
11. AlGhatrif M, Strait JB, Morrell CH, Canepa M, Wright J, Elango P, et al. Longitudinal trajectories of arterial stiffness and the role of blood pressure: the Baltimore Longitudinal Study of Aging. Hypertension. (2013) 62(5):934–41. doi: 10.1161/HYPERTENSIONAHA.113.01445
12. Terentes-Printzios D, Vlachopoulos C, Xaplanteris P, Ioakeimidis N, Aznaouridis K, Baou K, et al. Cardiovascular risk factors accelerate progression of vascular aging in the general population: results from the CRAVE study (cardiovascular risk factors affecting vascular age). Hypertension. (2017) 70(5):1057–64. doi: 10.1161/HYPERTENSIONAHA.117.09633
13. Park SU, Jung WS, Moon SK, Ko CN, Cho KH, Kim YS, et al. Chunghyul-dan (Qingxie-dan) improves arterial stiffness in patients with increased baPWV. Am J Chin Med. (2006) 34(4):553–63. doi: 10.1142/S0192415X06004090
14. Allen NB, Siddique J, Wilkins JT, Shay C, Lewis CE, Goff DC, et al. Blood pressure trajectories in early adulthood and subclinical atherosclerosis in middle age. JAMA. (2014) 311(5):490–7. doi: 10.1001/jama.2013.285122
15. Buscot MJ, Thomson RJ, Juonala M, Sabin MA, Burgner DP, Lehtimäki T, et al. Distinct child-to-adult body mass index trajectories are associated with different levels of adult cardiometabolic risk. Eur Heart J. (2018) 39(24):2263–70. doi: 10.1093/eurheartj/ehy161
16. Pencina KM, Thanassoulis G, Wilkins JT, Vasan RS, Navar AM, Peterson ED, et al. Trajectories of non-HDL cholesterol across midlife: implications for cardiovascular prevention. J Am Coll Cardiol. (2019) 74(1):70–9. doi: 10.1016/j.jacc.2019.04.047
17. Wang C, Yuan Y, Zheng M, Pan A, Wang M, Zhao M, et al. Association of age of onset of hypertension with cardiovascular diseases and mortality. J Am Coll Cardiol. (2020) 75:2921–30. doi: 10.1016/j.jacc.2020.04.038
18. Lu Y, Hajifathalian K, Ezzati M, Woodward M, Rimm EB, Danaei G. Metabolic mediators of the effects of body-mass index, overweight, and obesity on coronary heart disease and stroke: a pooled analysis of 97 prospective cohorts with 1.8 million participants. Lancet. (2014) 383(9921):970–83. doi: 10.1016/S0140-6736(13)61836-X
19. Williams B, Mancia G, Spiering W, Agabiti Rosei E, Azizi M, Burnier M, et al. [2018 ESC/ESH guidelines for the management of arterial hypertension]. Kardiol Pol. (2019) 77(2):71–159. doi: 10.5603/KP.2019.0018
20. American Diabetes A. 2. Classification and diagnosis of diabetes: standards of medical care in diabetes-2019. Diabetes Care. (2019) 42(Suppl 1):S13–S28. doi: 10.2337/dc19-S002
21. Levey AS, Stevens LA, Schmid CH, Zhang YL, Castro AF 3rd, Feldman HI, et al. A new equation to estimate glomerular filtration rate. Ann Intern Med. (2009) 1509:604–12. doi: 10.7326/0003-4819-150-9-200905050-00006
22. Takashima N, Turin TC, Matsui K, Rumana N, Nakamura Y, Kadota A, et al. The relationship of brachial-ankle pulse wave velocity to future cardiovascular disease events in the general Japanese population: the Takashima study. J Hum Hypertens. (2014) 285:323–7. doi: 10.1038/jhh.2013.103
23. Nagin DS, Odgers CL. Type-based trajectory modeling in clinical research. Annu Rev Clin Psychol. (2010) 6:109–38. doi: 10.1146/annurev.clinpsy.121208.131413
24. Sun Z. Aging, arterial stiffness, and hypertension. Hypertension. (2015) 65(2):252–6. doi: 10.1161/HYPERTENSIONAHA.114.03617
25. Ferreira MT, Leite NC, Cardoso CR, Salles GF. Correlates of aortic stiffness progression in patients with type 2 diabetes: importance of glycemic control: the Rio de Janeiro type 2 diabetes cohort study. Diabetes Care. (2015) 38(5):897–904. doi: 10.2337/dc14-2791
26. Avolio AP, Deng FQ, Li WQ, Luo YF, Huang ZD, Xing LF, et al. Effects of aging on arterial distensibility in populations with high and low prevalence of hypertension: comparison between urban and rural communities in China. Circulation. (1985) 71(2):202–10. doi: 10.1161/01.CIR.71.2.202
27. Gepner AD, Korcarz CE, Colangelo LA, Hom EK, Tattersall MC, Astor BC, et al. Longitudinal effects of a decade of aging on carotid artery stiffness: the multiethnic study of atherosclerosis. Stroke. (2014) 45(1):48–53. doi: 10.1161/STROKEAHA.113.002649
28. Bia D, Zócalo Y. Physiological age- and sex-related profiles for local (aortic) and regional (carotid-femoral, carotid-radial) pulse wave velocity and center-to-periphery stiffness gradient, with and without blood pressure adjustments: reference intervals and agreement between methods in healthy subjects (3-84 years). J Cardiovasc Dev Dis. (2021) 8(1):3. doi: 10.3390/jcdd8010003
29. Scuteri A, Morrell CH, Orrù M, Strait JB, Tarasov KV, Ferreli LA, et al. Longitudinal perspective on the conundrum of central arterial stiffness, blood pressure, and aging. Hypertension. (2014) 64(6):1219–27. doi: 10.1161/HYPERTENSIONAHA.114.04127
30. McEniery CM, Spratt M, Munnery M, Yarnell J, Lowe GD, Rumley A, et al. An analysis of prospective risk factors for aortic stiffness in men: 20-year follow-up from the Caerphilly prospective study. Hypertension. (2010) 56(1):36–43. doi: 10.1161/HYPERTENSIONAHA.110.150896
31. Johansen NB, Vistisen D, Brunner EJ, Tabák AG, Shipley MJ, Wilkinson IB, et al. Determinants of aortic stiffness: 16-year follow-up of the Whitehall II study. PLoS One. (2012) 7(5):e37165. doi: 10.1371/journal.pone.0037165
32. Henry RM, Kostense PJ, Spijkerman AM, Dekker JM, Nijpels G, Heine RJ, et al. Arterial stiffness increases with deteriorating glucose tolerance status: the Hoorn study. Circulation. (2003) 107(16):2089–95. doi: 10.1161/01.CIR.0000065222.34933.FC
33. Zachariah JP, Rong J, Larson MG, Hamburg NM, Benjamin EJ, Vasan RS, et al. Metabolic predictors of change in vascular function: prospective associations from a community-based cohort. Hypertension. (2018) 71(2):237–42. doi: 10.1161/HYPERTENSIONAHA.117.10054
34. Birru MS, Matthews KA, Thurston RC, Brooks MM, Ibrahim S, Barinas-Mitchell E, et al. African-American ethnicity and cardiovascular risk factors are related to aortic pulse-wave velocity progression. Am J Hypertens. (2011) 24(7):809–15. doi: 10.1038/ajh.2011.57
35. Muhammad IF, Borné Y, Östling G, Kennbäck C, Gottsäter M, Persson M, et al. Arterial stiffness and incidence of diabetes: a population-based cohort study. Diabetes Care. (2017) 40(12):1739–45. doi: 10.2337/dc17-1071
36. Mitchell GF, DeStefano AL, Larson MG, Benjamin EJ, Chen MH, Vasan RS, et al. Heritability and a genome-wide linkage scan for arterial stiffness, wave reflection, and mean arterial pressure: the Framingham Heart Study. Circulation. (2005) 112(2):194–9. doi: 10.1161/CIRCULATIONAHA.104.530675
37. Chen L, Liu X, Jia L, Dong Z, Wang Q, Chen Y, et al. Factors associated with brachial-ankle pulse wave velocity in an apparently healthy Chinese population. Biomed Res Int. (2020) 2020:9795240. doi: 10.1155/2020/9795240
38. Curcio S, García-Espinosa V, Castro JM, Peluso G, Marotta M, Arana M, et al. High blood pressure states in children, adolescents, and young adults associate accelerated vascular aging, with a higher impact in Females’ arterial properties. Pediatr Cardiol. (2017) 38(4):840–52. doi: 10.1007/s00246-017-1591-z
Keywords: pulse wave velocity, arterial stiffness, arteriosclerosis, risk factor, trajectory
Citation: Deng X, Song Y, Han X, Chen X, Yang W, Wu S and Zhou Y (2023) Brachial-ankle pulse wave velocity trajectories in a middle-aged population. Front. Cardiovasc. Med. 10:1092525. doi: 10.3389/fcvm.2023.1092525
Received: 8 November 2022; Accepted: 6 March 2023;
Published: 27 March 2023.
Edited by:
Yanina Zócalo, Centro Hospitalario Pereira Rossell (University of the Republic), UruguayReviewed by:
Daniel Bia, Universidad de la República, Uruguay© 2023 Deng, Song, Han, Chen, Yan, Wu and Zhou. This is an open-access article distributed under the terms of the Creative Commons Attribution License (CC BY). The use, distribution or reproduction in other forums is permitted, provided the original author(s) and the copyright owner(s) are credited and that the original publication in this journal is cited, in accordance with accepted academic practice. No use, distribution or reproduction is permitted which does not comply with these terms.
*Correspondence: Wenyi Yang d2VueWkueWFuZ0BzaGdoLmNu Shouling Wu ZHJ3dXNsQDE2My5jb20= Yong Zhou eW9uZ3pob3U3ODIxNEAxNjMuY29t
†These authors have contributed equally to this work
Specialty Section: This article was submitted to Cardiovascular Epidemiology and Prevention, a section of the journal Frontiers in Cardiovascular Medicine
Disclaimer: All claims expressed in this article are solely those of the authors and do not necessarily represent those of their affiliated organizations, or those of the publisher, the editors and the reviewers. Any product that may be evaluated in this article or claim that may be made by its manufacturer is not guaranteed or endorsed by the publisher.
Research integrity at Frontiers
Learn more about the work of our research integrity team to safeguard the quality of each article we publish.