 Minggang Huang
 Tingting Han
- Shaanxi Provincial People’s Hospital, Xi'an, China
Purpose: To explore the potential of perivascular fat attenuation index (FAI) and coronary computed tomography angiography (CCTA) derived fractional flow reserve (CT-FFR) in the identification of culprit lesion leading to subsequent acute coronary syndrome (ACS).
Methods: Thirty patients with documented ACS event who underwent invasive coronary angiography (ICA) from February 2019 to February 2021 and had received CCTA in the previous 6 months were collected retrospectively. 40 patients with stable angina pectoris (SAP) were matched as control group according to sex, age and risk factors. The study population has a mean age of 59.3 ± 12.3 years, with a male prevalence of 81.4%. The plaque characteristics, perivascular fat attenuation index (FAI), and coronary computed tomography angiography-derived fractional flow reserve (CT-FFR) of 32 culprit lesions and 30 non-culprit lesions in ACS patients and 40 highest-grade stenosis lesions in SAP patients were statistically analyzed.
Results: FAI around culprit lesions was increased significantly (−72.4 ± 3.2 HU vs. −79.0 ± 7.7 HU, vs. −80.4 ± 7.0HU, all p < 0.001) and CT-FFR was decreased for culprit lesions of ACS patients [0.7(0.1) vs. 0.8(0.1), vs.0.8(0.1), p < 0.001] compared to other lesions. According to multivariate analysis, diameter stenosis (DS), FAI, and CT-FFR were significant predictors for identification of the culprit lesion. The integration model of DS, FAI, and CT-FFR showed the significantly highest area under the curve (AUC) of 0.917, compared with other single predictors (all p < 0.05).
Conclusions: This study proposes a novel integrated prediction model of DS, FAI, and CT-FFR that enhances the diagnostic accuracy of traditional CCTA for identifying culprit lesions that trigger ACS. Furthermore, this model also provides improved risk stratification for patients and offers valuable insights for predicting future cardiovascular events.
Introduction
Coronary computed tomography angiography (CCTA) is a first-line imaging method to exclude obstructive coronary artery disease (CAD) and characterize the high-risk plaque features (1, 2). Vascular inflammation is a driving factor of atherosclerotic plaque progression and high-risk plaque rupture might lead to acute coronary syndrome(ACS) (3). ACS (Acute Coronary Syndrome) is a collection of clinical syndromes resulting from the rupture or erosion of coronary atherosclerotic plaques, which leads to partial or complete occlusive thrombosis of the coronary arteries. The three main types of ACS are ST elevation myocardial infarction (STEMI), non-ST elevation myocardial infarction (NSTEMI), and unstable angina (UA). Recent studies revealed that there was an interaction mechanism between the perivascular adipose tissue (PCAT) and vascular wall (4). When adipose tissue was dysfunctional, it would release a large number of pro-inflammatory cytokines through endocrine or paracrine pathways, which would affect the development and destabilization of plaque. Therefore, the perivascular fat attenuation index (FAI) as a new imaging biomarker could reflect coronary inflammatory activity using quantification of adipose tissue attenuation gradient of conventional CCTA. CRISP-CT studies showed perivascular FAI improved the ability of cardiac risk prediction and re-stratification of traditional CCTA, the higher the perivascular FAI value [cutoff ≥ −70.1 Hounsfield Units, (HU)], the higher the risk of cardiogenic mortality and poor prognosis, which suggested that the change of perivascular fat attenuation was closely related to plaque stability (5).
Meanwhile, CTA-derived fractional flow reserve(CT-FFR) is developed as a non-invasive hemodynamic assessment of coronary artery stenosis. Several clinical trials confirmed that CT-FFR could be used to identify lesion specific ischemia, and with good diagnostic performance compared with the gold standard invasive FFR (6–9). Moreover, studies revealed that the integration of CT-FFR and conventional CCTA could greatly improve the identification of culprit lesions that subsequently lead to ACS (10–12).
It is worth noting that plaque rupture is a complex biomechanical process affected by the plaque anatomical structure and composition, as well as the external mechanical and hemodynamic forces acting on the plaque (13). However, the traditional CCTA based on anatomical stenosis assessment lacks functional evaluation of lesions and cannot accurately guide clinical decision-making, resulting in delayed treatment and even subsequent major adverse cardiovascular events (MACE) in some patients. Therefore, this study was conducted to assess the value of indicators derived from CCTA (FAI and CT-FFR) and their integration in the identification of culprit lesions that caused subsequent ACS.
Materials and methods
Study population
Thirty patients with documented ACS event who underwent ICA from February 2019 to February 2021 and received at least once CCTA in the previous 6 months were collected retrospectively. Compared with 40 patients with SAP were matched as control group according to sex, age and risk factors, the controls also underwent coronary CTA followed by invasive angiography. The inclusion criterion as follows:(i) the interval between the CCTA examination and ICA within 6 months; (ii) patients with imaging evidence of CAD; (iii) Electrocardiogram (ECG) or Cardiac biomarkers showed no abnormalities. The exclusion criteria were as follows: (i) the interval between CCTA and ICA was longer than 6 months; and ICA was longer than 6 months; (ii) patients with the previous history of coronary artery bypass graft surgery or coronary stent implement; (iii) insufficient image quality of CCTA examination; (iv)The diameter stenosis <50% with CCTA (Figure 1. Study Flow Chart). The study was in accordance with the regulations of the institutional review committee.
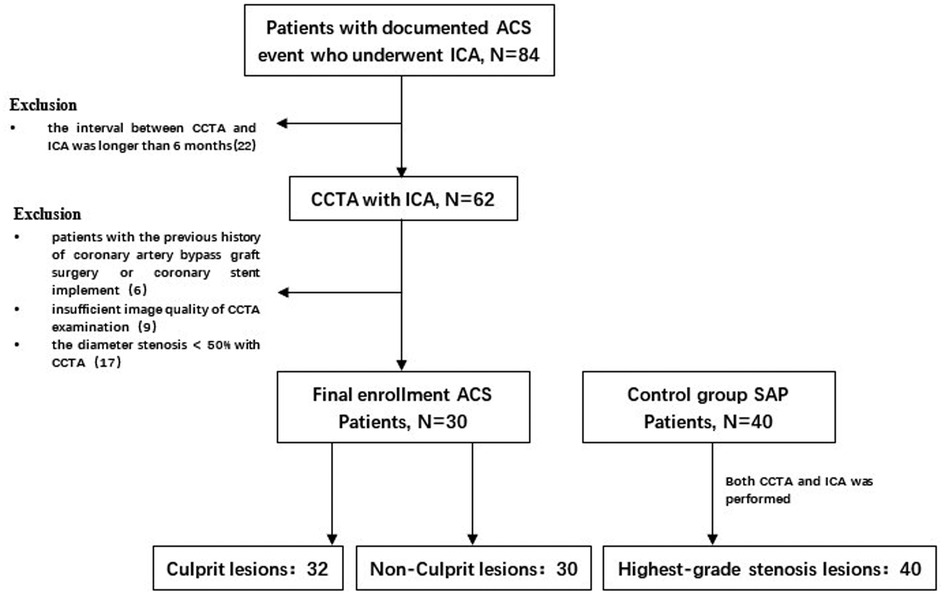
Figure 1. Study flow chart. After screening of enrollment criteria and image quality, a total of 102 lesions in 30 patients with ACS and 40 patients with SAP in the control group were analyzed. ACS, acute coronary syndrome; SAP, stable angina pectoris; ICA, invasive coronary angiography; CCTA, coronary computed tomography angiography.
CCTA acquisition
All patients underwent CT imaging with a 320-row wide area detector CT scanner (Acquilion ONE VISION Edition). Prospective or retrospective ECG-triggered sequential acquisition according to the patient's heart rate were applied. The detailed scanning parameters were as follows: the scanning range was from the tracheal bifurcation level to the diaphragmatic surface of the heart, and the cross-section of the aortic root was set as the monitoring section. The trigger scan was carried out by using Sure Start contrast medium tracking software, and the threshold was 300∼330HU; collimation was 320 × 0.5 mm;100 kv tube voltage; tube current modulated with automatic exposure control (AEC) technology with noise index (SD = 26); rotation speed 0.275 rot/s; images were reconstructed with AIDR3D with standard kernel (FC = 09), thickness was 0.5 mm with interval 0.25 mm. Two-barrel high-pressure syringe was used to inject 60 ml nonionic contrast agent iopromide (370 mg/ml) or iodixanol (320 mg/ml) and 30 ml normal saline through the right elbow vein at 4.5∼5.5 ml/s flow rate.
Plaque characteristics
The images with the good image quality were selected for further postprocessing and plaque analysis (Vitrea Advanced FX3.0, Canon Medical Systems). The plaques'characterization included: (1) remodeling index (RI) defined as the ratio of the cross-sectional vessel lesion area to the proximal reference vessel area; positive reconstruction (PR) was defined as a RI > 1.0; (2) the diameter stenosis (DS) calculated as: (reference diameter-minimal lumen diameter)/reference diameter; (3) total plaque (TP) burden (PB%) calculated as follows: PB = plaque volume × 100%/vessel volume; (4) calcified plaque [CP, 376 to 1300(HU)] burden; (5) non-calcified burden [NCP, −30 to 375(HU)] burden. As previously described (14), NCP was further divided into three types: low-attenuation NCP [L-NCP, −30 to 30(HU)], intermediate-attenuation [I-NCP, 31 to 130(HU)], and high-attenuation NCP [H-NCP, 131 to 375(HU)] volumes, and their corresponding plaque burden.
Perivascular FAI
FAI was defined as the average CT attenuation of perivascular adipose tissue within a radial distance from the outer vessel wall equal to the diameter of the target vessel (4, 5). A dedicated FAI analysis software (EasyFAI Intelligent Evaluation system of perivascular Fat, version 1.2.0, Shukun, China) was used for quantification. As described previously (4), the average CT attenuation between −190HU and −30HU of perivascular adipose tissue with the edge of vascular wall extending outward by 4 mm was measured. The longitudinal range was 40 mm from the distal end of left anterior descending branch (LAD) and left circumflex branch (LCX). To avoid the effects of the aortic wall, we excluded the most proximal 10 mm of the right coronary artery (RCA) and analyzed the proximal 10 mm to 50 mm of the vessel.
CT-FFR
An artificial intelligent based CT-FFR software DEEPVESSEL (KEYA Medical, China), which was approved for commerical use by Chinese National Medical Products Administration (NMPA), was used to calculate the CT-FFR values. The software was fully valdidated with multiple clinical trials and the reported accuracy ranged from 87.3% to 90.4% using the invasive FFR as the reference (15, 16). The software utilize deep learning alogirhtms for CT-FFR calculation, which uses an advanced neural network architecture that was trained offline to learn the complex mapping between the embedded anatomatical and lesion features and its corresponding hemodynamics from the coronary artery tree. It takes the centerline and images as inputs and calculates CT-FFR for the whole artery tree. The model fully considers the artery tree structure, lesion-specific information, spatial relationship, and the influences of other branches for the blood flow dynamics. Please refer to (17) for detailed descriptions. The CT-FFR value at the distal 2–3 cm of the stenosis was recorded.
Statistical analysis
Statistical analysis was performed using SPSS (version 25.0, IBM Corp., Armonk,N.Y., USA, and MedCalc Statistical Software). Shapiro-Wilk test was used to check the assumption of normal distribution. Quantitative variables with normal distribution were expressed as mean ± standard deviation (SD) while median and quartile spacing were used for variables that were not normally distributed. T-test and Pearson test were used for data with normal distribution while Mann–Whitney U-test was used otherwise. Categorical variables were reported as count (%). To determine the optimal model for identifying culprit lesions, a multivariable logistic regression analysis was conducted with the “enter” approach. The model consisted of variables with p < 0.10 in the univariate analysis. Variables that were statistically significant in univariate analysis were included for further receiver operating characteristic (ROC) curve analysis. The optimal cutoff values for various parameters were determined using the maximum sum of sensitivity and specificity in ROC curve analysis. The area under the curve (AUC) was compared using the DeLong method (18). A two-tail probability value of p < 0.05 was considered statistically significant.
Results
Clinical characteristics
The clinical characteristics of the study population were listed in Table 1. In total 70 patients with 102 lesions (30 patients with ACS, including 9 patients with non-ST segment elevation myocardial infarction, 6 patients with ST segment elevation myocardial infarction, 15 patients with unstable angina pectoris, and 40 patients with SAP) were finally included (mean age: 59.3 ± 12.3, 81.4% of males and an average BMI of 23.8 ± 2.7 kg/m2). There were no significant differences in age, sex, BMI, coronary risk factors, laboratory indexes between patients with ACS and SAP (all p > 0.05). Since there were patients with non-ST segment elevation acute coronary syndrome with multivessel coronary artery disease in the study cohort, we included 32 culprit lesions and 30 non-culprit lesions with less stenosis than culprit lesions in patients with ACS. 40 highest-grade stenosis lesions in SAP patients were further analyzed. The culprit lesion often arise from non-obstructive plaque due to acute plaque rupture, and were defined as that subsequently lead to acute coronary syndrome in this study. To identify the potential culprit lesion site, information derived from angiographic images and ECGs was integrated as per common clinical practice. Culprit coronary lesions were determined on the angiographic findings suggestive of plaque rupture according to ESC guidelines for the management of acute coronary syndrome patients (19).
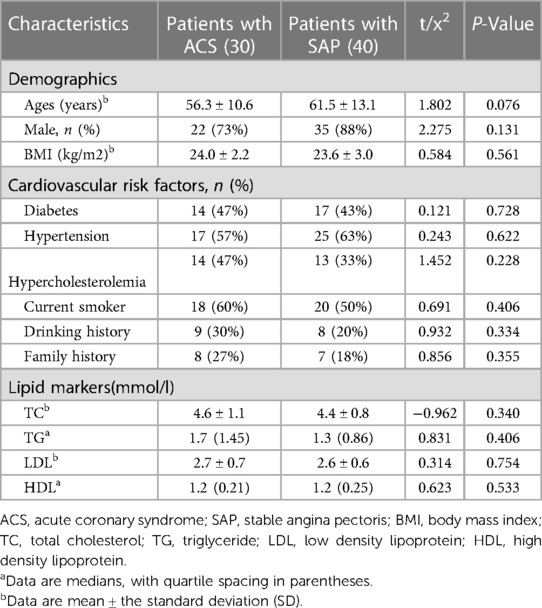
Table 1. Clinical characteristics.
Plaque characteristics
Table 2 showed the comparison of plaque characteristics in different lesion types. The burden of TP, L-NCP and I-NCP were significantly increased in culprit lesions compared with non-culprit lesions in patients with ACS (66.5% vs. 57.7%, 12.3% vs. 11. 1%, 35.7% vs. 30.2%, all p < 0.05). (Table 2) The burden of TP, NCP and TP volume were significantly increased in culprit lesions compared with highest-grade stenosis lesions in patients with SAP (66.5% vs. 58.9%, 63.4% vs. 57.3%, 237.0 mm3 vs. 178.0 mm3, all P < 0.05). It is worth noting that the culprit lesions with ACS had higher DS, and RI, and longer lesion length compared with other lesions. (Table 2) In addition, perivascular FAI of culprit lesions was significantly higher than the non-culprit lesions of patients with ACS and the highest-grade stenosis lesions in SAP patients (−72.4 ± 3.2 vs. −79.0 ± 7.7, vs. −80.4 ± 7.0, p < 0.001), while the CT-FFR of culprit lesions was significantly lower than that of other two groups[0.7(0.1) vs.0.8(0.1), vs.0.8(0.1), p < 0.001].
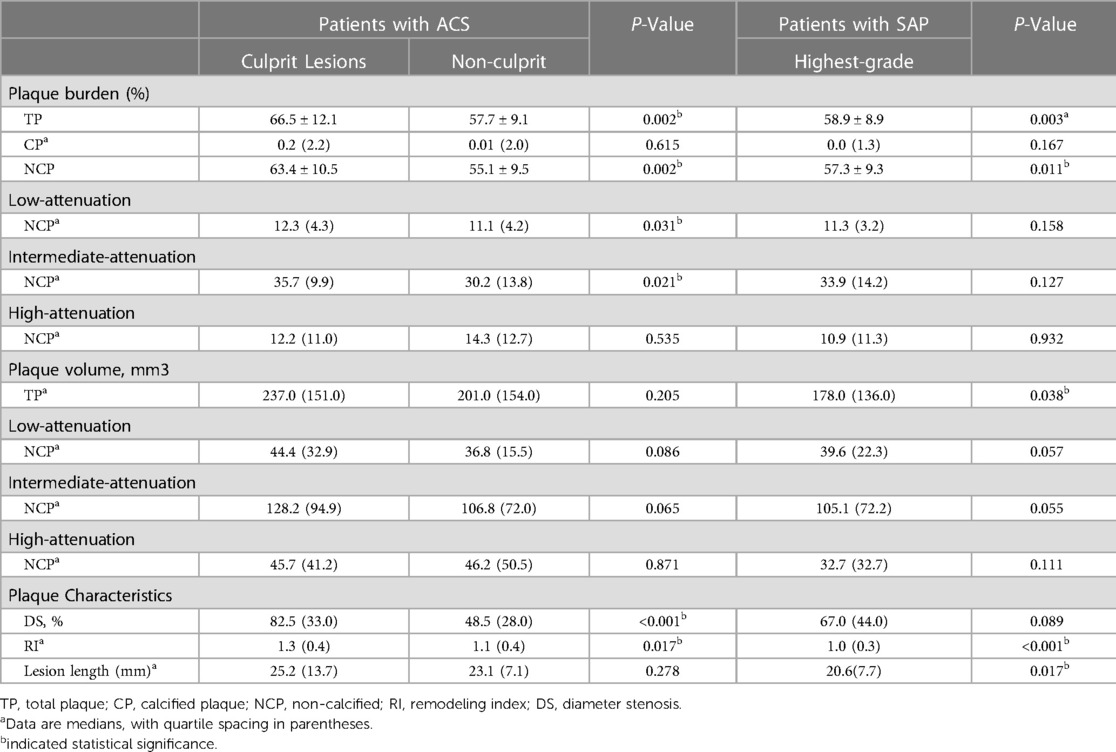
Table 2. Plaque characteristics of culprit lesion and non-culprit lesion in patients with ACS and the highest-grade stenosis in patients with SAP.
Identification of culprit lesions that caused subsequent ACS
In univariate analysis, perivascular FAI, CT-FFR, RI, DS, and the burden of TP, NCP, L-NCP and I-NCP were significantly related to the presence of culprit lesions (p < 0.05 for all). Further multivariate logistic regression analysis showed that DS, CT- FFR, and perivascular FAI were still independent predictors of culprit lesions (all p < 0.05) (Table 3).
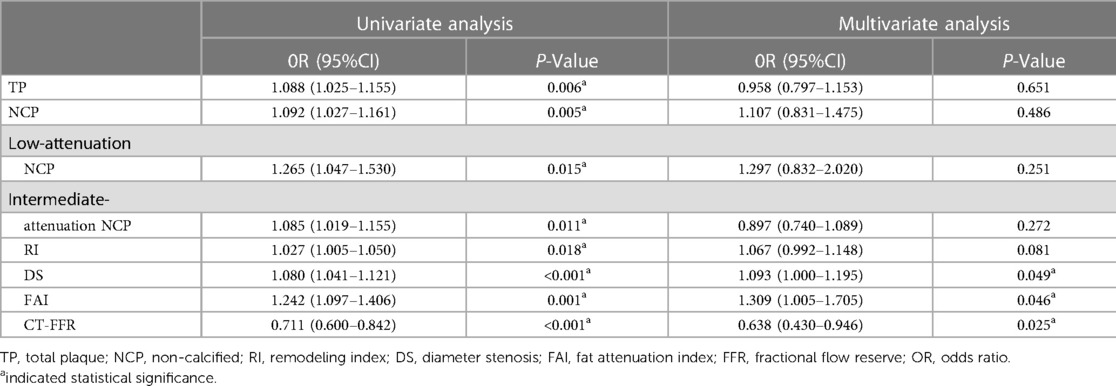
Table 3. Univariate and multivariate analyses of culprit lesions.
Predictive value of markers for the identification of ACS
According to ROC curve analysis, the AUC of DS in culprit lesions was 0.72 (95%CI, 0.623–0.817), with the best cut-off value of 54.5%, a sensitivity of 90.6% and a specificity of 51.4%. The AUC of FAI in culprit lesions was 0.817(95%CI: 0.737–0.898), with the best cut-off value of −74.8HU, a sensitivity of 81.3% and a specificity of 77.1%. For single parameters, CT-FFR showed the highest AUC (AUC = 0.849, 95%CI: 0.778–0.921) for identification of culprit lesions of subsequent ACS, with the best cut-off value of 0.795, a sensitivity of 87.5% and a specificity of 70% (Table 4). The frequency of CT-FFR ≤ 0.795 in culprit lesions was higher than that of non-culprit lesions (87.5% vs. 30%). When incoprating DS, CT-FFR, and perivascular FAI, the AUC of the combined model increased to 0.917, with sensitivity of 96.6%, and specificity of 74.3% (Table 4). In addition, combined approach had was revealed to have the significant larger AUC than any other single parameters for identification of culprit lesions of subsequent ACS (both p < 0.05) (Figure 2).
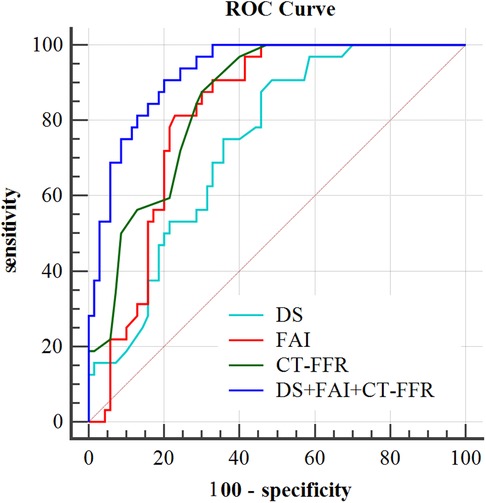
Figure 2. Incremental value of single factor and integrated model detection for ACS.
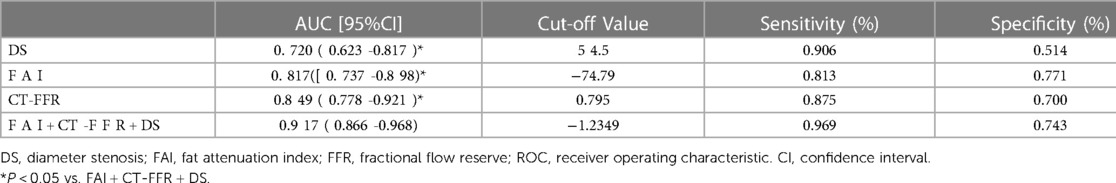
Table 4. Performance comparison of ROC curve analysis for identifying the culprit lesions leading to subsequent ACS events.
Discussion
This study investigated the ability of comprehensive evaluation using FAI and CT-FFR in the identification of culprit lesions that caused subsequent ACS. The major finding of this study was that perivascular FAI and CT-FFR are independent risk factors for culprit lesions in patients with ACS and the integration model of DS, FAI, and CT-FFR significantly improved the traditional CCTA for identification of culprit lesions that subsequently lead to ACS, with highest AUC.
Previous study found that perivascular FAI changes dynamically with plaque progression in patients with ACS (4, 20). The reason was inflammation of coronary artery can inhibit the formation of perivascular adipose tissue and increase the CT attenuation of local adipose tissue. Therefore, FAI was considered to be a vessel wall thermometer which promoted the non-invasive assessment of coronary artery inflammation phenotype. The results of this study showed that FAI increased around culprit vessels compared with non-culprit vessels, which was consistent with the results of previous studies (14, 21). The vessel wall could release a large number of inflammatory signals through the paracrine pathway to affect the biological processes such as adipocyte differentiation, proliferation, and lipolysis, leading to the local fat-water phase transition, which is finally manifested by the increase of fat attenuation density around the coronary artery in CCTA (22).
CCTA can be used as an ideal imaging method for non-invasive monitoring of the anatomical characteristics of high-risk coronary plaque, specifically positive remodeling and/or low attenuation plaque are occasionally regarded as similar to those of the culprit plaque once an ACS has occurred (23–25). A recent study found that dynamic changes of plaque might be highly related to subsequent ACS events. A machine learning approach considering comprehensive lesion characteristics (e.g., CT-FFR, necrotic core, remodeling index, plaque volume, and calcium) could improve the ability for predicting risks of ACS events (26). In addition, study found that the low attenuation plaques (LAP) volume of thin-cap fibroatheroma (TCFA) lesions quantified by CCTA was significantly higher than that of non-TCFA lesions, and IVUS confirmed that LAP volume was the strongest predictor of TCFA lesions (27). Williams et al. found that low attenuation NCP burden is the main predictor of prognosis, and patients with stable chest pain with low attenuation NCP burden > 4% are 5 times more likely to develop fatal or non-fatal myocardial infarction than the control group (28). In our study, the burden and volume of TP, L-and I- NCP were increased in culprit lesions compared with both non-culprit lesions in patients with ACS and highest-grade stenosis lesions, with a higher degree of stenosis and remodeling index. It was further confirmed that plaque characteristics were more closely related to culprit lesions that subsequently led to the risk of ACS, which was consistent with previous studies (29, 30). Interestingly, Motoyama et al. reported that about 83.7% of high-risk plaques did not cause ACS events (24). The reason is that plaque rupture is an extremely complex biomechanical process, which is not only related to the plaque structure and components, but also the comprehensive influence of external mechanical force and hemodynamic force acting on the plaque. When the internal structural stress of the plaque exceeds the plaque strength, it will rupture (31, 32).
FFR is currently the gold standard for the hemodynamic evaluation of coronary lesions, which limited in clinical application due to its expensive examination cost and invasive examination procedures. It is worth noting that, as a derivative parameter of conventional CCTA, CT-FFR showed better diagnostic performance than CCTA alone. It can add functional information to the traditional CCTA plaque morphological evaluation and realize the early identification of coronary artery stenosis and ischemic lesions. In our study, the CT-FFR value of culprit lesions in ACS patients was significantly lower than that of non-culprit lesions and the highest-grade stenosis of SAP, and the frequency of decreased in culprit lesions CT-FFR (≤0.795) was higher, which was consistent with the results of Lee JM et al. (11). Therefore, we further explore whether the construction of a combined model can improve the diagnostic performance of subsequent ACS risk culprit lesions.
It has been reported that the perivascular FAI of flow-limited lesions was significantly higher than that of non-flow-limiting lesions, and the combined use of FAI, TP volume and DS could predict ischemic coronary stenosis with high diagnostic accuracy (33, 34). In our study, multivariate analysis showed that DS, FAI, and CT-FFR were independent risk factors for culprit lesions. Compared with single variable, the combined application of FAI, CT-FFR and DS can significantly improve the identify culprit lesions in subsequent ACS events. Our results support that the combination of FAI and CT-FFR assessment could improve the ability to identify culprit lesions in subsequent ACS events compared to traditional CCTA, and provide a one-stop non-invasive comprehensive evaluation of coronary morphology and function without any other further examination.
So far, CAD is still the first killer endangering human health, although it has been quite mature in diagnosis, treatment decision-making and prognosis evaluation. However, relying only on clinical evaluation has some limitations, for example, when patients were in low to intermediate chest pain risk category with normal initial cardiac biomarkers and none had evidence of ischemia on initial ECGs and acute myocardial infarction was subsequently diagnosed in 10% of patients (35). Therefore, there is an urgent need for a comprehensive evaluation system integrating plaque stability and non-invasive hemodynamics to guide clinical decision-making and avoid subsequent adverse events. More importantly, with the increasing global health expenditures, this simple and non-invasive technique might help to control medical costs and reduce many unnecessary and expensive invasive procedures.
Despite the above findings, our study had several limitations. First, this was a single-center retrospective observational study, the sample size was relatively small, and there was a certain selection bias, which limited the clinical applicability and reliability of the conclusion to a certain extent. Second, this study observed that the diagnostic performance of the combined model was significantly improved and the sensitivity was reduced, which may be related to the small sample size, large-scale prospective studies would be needed to verify it in the future. Third, there were no statistics on the use of statins in our study, which may affect the relationship between FAI and plaque vulnerability, which should be further investigated.
In conclusion, the perivascular FAI of culprit lesions in ACS patients was significantly increased and CT-FFR decreased compare to other lesions of ACS and SAP. The integration of DS, FAI, and CT-FFR could significantly improve the ability of traditional CCTA to identify the culprit lesions that caused subsequently lead to ACS. It is plausible that AI-based intelligent technology can furnish additional physiological information regarding coronary artery disease, thereby facilitating personalized risk assessment and identification of coronary atherosclerotic heart disease and ACS.
Data availability statement
The original contributions presented in the study are included in the article, further inquiries can be directed to the corresponding author.
Ethics statement
This study was reviewed and approved by the institutional review committee of Shaanxi Provincial People’s Hospital. Written informed consent was obtained from the patients/participants for their participation in this study.
Author contributions
TH, YM, DY and MH was involved in image data analysis, statistical analysis, and report writing, and was responsible for clinical and imaging data collection, linguistic and grammatical checking of the manuscript, statistical analysis, writing review, and editing. XN, SZ and YZ provided scientific guidance for report writing. All authors contributed to the article and approved the submitted version.
Conflict of interest
The authors declare that the research was conducted in the absence of any commercial or financial relationships that could be construed as a potential conflict of interest.
Publisher's note
All claims expressed in this article are solely those of the authors and do not necessarily represent those of their affiliated organizations, or those of the publisher, the editors and the reviewers. Any product that may be evaluated in this article, or claim that may be made by its manufacturer, is not guaranteed or endorsed by the publisher.
References
1. Ferencik M, Mayrhofer T, Bittner DO, Emami H, Puchner SB, Lu MT, et al. Use of high-risk coronary atherosclerotic plaque detection for risk stratification of patients with stable chest pain: a secondary analysis of the PROMISE randomized clinical trial. JAMA Cardiol. (2018) 3(2):144–52. doi: 10.1001/jamacardio.2017.4973
2. Bittner DO, Mayrhofer T, Puchner SB, Lu MT, Maurovich-Horvat P, Ghemigian K, et al. Coronary computed tomography angiography- specific definitions of high-risk plaque features improve detection of acute coronary syndrome. Circ Cardiovasc Imaging. (2018) 11(8):e007657. doi: 10.1161/circimaging.118.007657
3. Ross R. Atherosclerosis–an inflammatory disease. N Engl J Med. (1999) 340(2):115–26. doi: 10.1056/NEJM199901143400207
4. Antonopoulos AS, Sanna F, Sabharwal N, Thomas S, Oikonomou EK, Herdman L, et al. Detecting human coronary inflammation by imaging perivascular fat. Sci Transl Med. (2017) 9(398):eaal2658. doi: 10.1126/scitranslmed.aal2658
5. Oikonomou EK, Marwan M, Desai MY, Mancio J, Alashi A, Hutt Centeno E, et al. Non-invasive detection of coronary inflammation using computed tomography and prediction of residual cardiovascular risk (the CRISP CT study): a posthoc analysis of prospective outcome data. Lancet. (2018) 392(10151):929–39. doi: 10.1016/s0140-6736(18)31114-0
6. Nakazato R, Park HB, Berman DS, Gransar H, Koo BK, Erglis A. Noninvasive fractional flow reserve derived from computed tomography angiography for coronary lesions of intermediate stenosis severity: results from the DeFACTO study. Circ Cardiovasc Imaging. (2013) 6(6):881–9. doi: 10.1161/circimaging.113.000297
7. Nørgaard BL, Leipsic J, Gaur S, Seneviratne S, Ko BS, Ito H. Diagnostic performance of noninvasive fractional flow reserve derived from coronary computed tomography angiography in suspected coronary artery disease: the NXT trial (analysis of coronary blood flow using CT angiography: next steps). J Am Coll Cardiol. (2014) 63(12):1145–55. doi: 10.1016/j.jacc.2013.11.043
8. Koo BK, Erglis A, Doh JH, Daniels DV, Jegere S, Kim HS, et al. Diagnosis of ischemia-causing coronary stenoses by noninvasive fractional flow reserve computed from coronary computed tomographic angiograms. Results from the prospective multicenter DISCOVER-FLOW (diagnosis of ischemia-causing stenoses obtained via noninvasive fractional flow reserve) study. J Am Coll Cardiol. (2011) 58(19):1989–97. doi: 10.1016/j.jacc.2011.06.066
9. Patel MR, Nørgaard BL, Fairbairn TA, Nieman K, Akasaka T, Berman DS, et al. 1-Year Impact on medical practice and clinical outcomes of FFR(CT): the ADVANCE registry. JACC Cardiovasc Imaging. (2020) 13(1 Pt 1):97–105. doi: 10.1016/j.jcmg.2019.03.003
10. Gaur S, Øvrehus KA, Dey D, Leipsic J, Bøtker HE, Jensen JM, et al. Coronary plaque quantification and fractional flow reserve by coronary computed tomography angiography identify ischaemia-causing lesions. Eur Heart J. (2016) 37(15):1220–7. doi: 10.1093/eurheartj/ehv690
11. Lee JM, Choi G, Koo BK, Hwang D, Park J, Zhang J, et al. Identification of high-risk plaques destined to cause acute coronary syndrome using coronary computed tomographic angiography and computational fluid dynamics. JACC Cardiovasc Imaging. (2019) 12(6):1032–43. doi: 10.1016/j.jcmg.2018.01.023
12. Duguay TM, Tesche C, Vliegenthart R, De Cecco CN, Lin H, Albrecht MH, et al. Coronary computed tomographic angiography-derived fractional flow reserve based on machine learning for risk stratification of non-culprit coronary narrowings in patients with acute coronary syndrome. Am J Cardiol. (2017) 120(8):1260–6. doi: 10.1016/j.amjcard.2017.07.008
13. Bentzon JF, Otsuka F, Virmani R, Falk E. Mechanisms of plaque formation and rupture. Circ Res. (2014) 114(12):1852–66. doi: 10.1161/circresaha.114.302721
14. Goeller M, Achenbach S, Cadet S, Kwan AC, Commandeur F, Slomka PJ, et al. Pericoronary adipose tissue computed tomography attenuation and high-risk plaque characteristics in acute coronary syndrome compared with stable coronary artery disease. JAMA Cardiol. (2018) 3(9):858–63. doi: 10.1001/jamacardio.2018.1997
15. Wang ZQ, Zhou YJ, Zhao YX, Shi DM, Liu YY, Liu W, et al. Diagnostic accuracy of a deep learning approach to calculate FFR from coronary CT angiography. J Geriatr Cardiol. (2019) 16:42–8. doi: 10.11909/j.issn.1671-5411.2019.01.010
16. Li Y, Qiu H, Hou Z, Zheng J, Li J, Yin Y, et al. Additional value of deep learning computed tomographic angiography-based fractional flow reserve in detecting coronary stenosis and predicting outcomes. Acta Radiol. (2022) 63(1):133–40. doi: 10.1177/0284185120983977
17. Gao ZF, Wang X, Sun SH, Wu D, Bai J, Yin Y, et al. Learning physical properties in complex visual scenes : an intelligent machine for perceiving blood flow dynamics from static CT angiography imaging. Neural Netw. (2020) 123(3):82–93. doi: 10.1016/j.neunet.2019.11.017
18. DeLong ER, DeLong DM, Clarke-Pearson DL. Comparing the areas under two or more correlated receiver operating characteristic curves: a nonparametric approach. Biometrics. (1988) 44(3):837–45. doi: 10.2307/2531595
19. Roffi M, Patrono C, Collet JP, Mueller C, Valgimigli M, Andreotti F, et al. 2015 ESC guidelines for the management of acute coronary syndromes in patients presenting without persistent ST-segment elevation: task force for the management of acute coronary syndromes in patients presenting without persistent ST-segment elevation of the European society of cardiology (ESC). Eur Heart J. (2016) 37(3):267–315. doi: 10.1093/eurheartj/ehv320
20. Ebersberger U, Bauer MJ, Straube F, Fink N, Schoepf UJ, Varga-Szemes A, et al. Gender differences in epicardial adipose tissue and plaque composition by coronary CT angiography: association with cardiovascular outcome. Diagnostics. (2023) 13(4):624. doi: 10.3390/diagnostics13040624
21. Tesche C, Bauer MJ, Straube F, Rogowski S, Baumann S, Renker M, et al. Association of epicardial adipose tissue with coronary CT angiography plaque parameters on cardiovascular outcome in patients with and without diabetes mellitus. Atherosclerosis. (2022) 363:78–84. doi: 10.1016/j.atherosclerosis.2022.10.006
22. Grant RW, Stephens JM. Fat in flames: influence of cytokines and pattern recognition receptors on adipocyte lipolysis. Am J Physiol Endocrinol Metab. (2015) 309(3):E205–13. doi: 10.1152/ajpendo.00053.2015
23. Hell MM, Motwani M, Otaki Y, Cadet S, Gransar H, Miranda-Peats R, et al. Quantitative global plaque characteristics from coronary computed tomography angiography for the prediction of future cardiac mortality during long-term follow-up. Eur Heart J Cardiovasc Imaging. (2017) 18(12):1331–9. doi: 10.1093/ehjci/jex183
24. Motoyama S, Ito H, Sarai M, Kondo T, Kawai H, Nagahara Y, et al. Plaque characterization by coronary computed tomography angiography and the likelihood of acute coronary events in mid-term follow-up. J Am Coll Cardiol. (2015) 66(4):337–46. doi: 10.1016/j.jacc.2015.05.069
25. Tesche C, Caruso D, De Cecco CN, Shuler DC, Rames JD, Albrecht MH, et al. Coronary computed tomography angiography-derived plaque quantification in patients with acute coronary syndrome. Am J Cardiol. (2017) 119(5):712–8. doi: 10.1016/j.amjcard.2016.11.030
26. Wang Y, Chen H, Sun T, Li A, Wang S, Zhang J, et al. Risk predicting for acute coronary syndrome based on machine learning model with kinetic plaque features from serial coronary computed tomography angiography. Eur Heart J Cardiovasc Imaging. (2022) 23(6):800–10. doi: 10.1093/ehjci/jeab101
27. Yuan M, Wu H, Li R, Yu M, Dai X, Zhang J. The value of quantified plaque analysis by dual-source coronary CT angiography to detect vulnerable plaques: a comparison study with intravascular ultrasound. Quant Imaging Med Surg. (2020) 10(3):668677. doi: 10.21037/qims.2020.01.13
28. Williams MC, Kwiecinski J, Doris M, McElhinney P, D'Souza MS, Cadet S, et al. Low-Attenuation noncalcified plaque on coronary computed tomography angiography predicts myocardial infarction: results from the multicenter SCOT-HEART trial (Scottish computed tomography of the HEART). Circulation. (2020) 141(18):1452–62. doi: 10.1161/CIRCULATIONAHA.119.044720
29. Kwiecinski J, Dey D, Cadet S, Lee SE, Tamarappoo B, Otaki Y, et al. Predictors of 18F-sodium fluoride uptake in patients with stable coronary artery disease and adverse plaque features on computed tomography angiography. Eur Heart J Cardiovasc Imaging. (2020) 21(1):5866. doi: 10.1093/ehjci/jez152
30. Ihdayhid AR, Goeller M, Dey D, Nerlekar N, Yap G, Thakur U, et al. Comparison of coronary atherosclerotic plaque burden and composition as assessed on coronary computed tomography angiography in east Asian and European-origin caucasians. Am J Cardiol. (2019) 124(7):1012–9. doi: 10.1016/j.amjcard.2019.06.020
31. Maurovich-Horvat P, Ferencik M, Voros S, Merkely B, Hoffmann U. Comprehensive plaque assessment by coronary CT angiography. Nat Rev Cardiol. (2014) 11(7):390–402. doi: 10.1038/nrcardio.2014.60
32. Brown AJ, Teng Z, Calvert PA, Rajani NK, Hennessy O, Nerlekar N, et al. Plaque structural stress estimations improve prediction of future Major adverse cardiovascular events after intracoronary imaging. Circ Cardiovasc Imaging. (2016) 9(6):e004172. doi: 10.1161/circimaging.115.004172
33. Yu M, Dai X, Deng J, Lu Z, Shen C, Zhang J. Diagnostic performance of perivascular fat attenuation index to predict hemodynamic significance of coronary stenosis: a preliminary coronary computed tomography angiography study. Eur Radiol. (2019) 30(2):673681. doi: 10.1007/s00330-019-06400-8
34. Brandt V, Decker J, Schoepf UJ, Varga-Szemes A, Emrich T, Aquino G, et al. Additive value of epicardial adipose tissue quantification to coronary CT angiography-derived plaque characterization and CT fractional flow reserve for the prediction of lesion-specific ischemia. Eur Radiol. 32:4243–52. doi: 10.1007/s00330-021-08481-w
35. Meier D, Skalidis I, De Bruyne B, Qanadli SD, Rotzinger D, Eeckhout E, et al. Ability of FFR-CT to detect the absence of hemodynamically significant lesions in patients with high-risk NSTE-ACS admitted in the emergency department with chest pain, study design and rationale. Int J Cardiol Heart Vasc. (2020) 27(4):100496. doi: 10.1016/j.ijcha.2020.100496
Keywords: coronary computed tomography angiography, acute coronary syndrome, fat attenuation index, fraction flow reserve, plaque characteristics
Citation: Huang M, Han T, Nie X, Zhu S, Yang D, Mu Y and Zhang Y (2023) Clinical value of perivascular fat attenuation index and computed tomography derived fractional flow reserve in identification of culprit lesion of subsequent acute coronary syndrome. Front. Cardiovasc. Med. 10:1090397. doi: 10.3389/fcvm.2023.1090397
Received: 5 November 2022; Accepted: 16 May 2023;
Published: 2 June 2023.
Edited by:
Edoardo Conte, University of Milan, ItalyReviewed by:
Davide Marchetti, Università degli Studi di Milano, ItalyChristian Tesche, Augustinum Klinik München, Germany
© 2023 Huang, Han, Nie, Zhu, Yang, Mu and Zhang. This is an open-access article distributed under the terms of the Creative Commons Attribution License (CC BY). The use, distribution or reproduction in other forums is permitted, provided the original author(s) and the copyright owner(s) are credited and that the original publication in this journal is cited, in accordance with accepted academic practice. No use, distribution or reproduction is permitted which does not comply with these terms.
*Correspondence: Minggang Huang bWcuaHVhbmdAMTYzLmNvbQ==