- 1Heart Center, Cheng Hsin General Hospital, Taipei, Taiwan
- 2Department of Internal Medicine, School of Medicine, College of Medicine, National Yang Ming Chiao Tung University, Taipei, Taiwan
- 3TaiVeCoron Study Group, Taipei Veterans General Hospital Coronary Intervention Study Group, Taipei, Taiwan
- 4Department of Internal Medicine, Taipei Hospital, Ministry of Health and Welfare, Taipei, Taiwan
- 5Division of Cardiology, Department of Internal Medicine, Taipei Veterans General Hospital, Taipei, Taiwan
- 6Division of Nephrology, Department of Internal Medicine, MacKay Memorial Hospital, Taipei, Taiwan
- 7Department of Medicine and Therapeutics, The Chinese University of Hong Kong, Shatin, Hong Kong SAR, China
- 8Department of Health Care Center, Taipei Veterans General Hospital, Taipei, Taiwan
Background: Serum 1,5-anhydro-D-glucitol (1,5-AG) is a novel biomarker for short-term glycemic status and postprandial hyperglycemia. The association between serum 1,5-AG levels and coronary artery calcification (CAC) through a quantitative assessment using optical coherence tomography (OCT) is unclear. We aimed to evaluate this association using OCT in patients with diabetes mellitus (DM).
Methods: From June 2016 to December 2019, we prospectively enrolled 256 patients who underwent OCT-guided percutaneous coronary intervention (PCI). Half of the patients had diabetes. Patients were followed up for a mean period of 1.8 ± 0.8 years (median: 2.2 years). The relative calcium index and relative lipid core index measured by quantitative OCT analysis were used to evaluate the intra-plaque calcium and lipid levels of culprit plaques. We also analyzed the correlation between serum 1,5-AG levels and long-term major adverse cardiovascular events.
Results: Serum 1,5-AG levels were significantly lower in diabetic patients than in non-diabetic patients (DM vs. non-DM: 55.6 ± 27.9 μg/mL vs. 63.7 ± 26.1 μg/mL, p = 0.016), and lower in fibrocalcified lesions than in fibrotic or fibrolipidic lesions (fibrocalcified vs. fibrotic or fibrolipidic: 42.8 ± 19.1 vs. 72.9 ± 25.2 or 66.4 ± 27.5 μg/mL, p < 0.001, respectively). In addition, we found a significant inverse correlation between serum 1,5-AG levels and relative calcium index (r = −0.729, p < 0.001). In multivariate Cox regression analysis, low serum 1,5-AG level was identified as an independent predictor for major adverse cardiovascular events in diabetic patients (p = 0.043), but not in non-diabetic patients (p = 0.748) after adjusting for age and sex.
Conclusion: This study revealed that low serum 1,5-AG levels were associated with an increased risk of CAC as assessed by OCT, especially in diabetic patients. Low serum 1,5-AG levels may predict future major adverse cardiovascular events in diabetic patients undergoing OCT-guided PCI.
Introduction
Coronary artery calcification (CAC), an important marker of coronary artery disease (CAD), is known to correlate with advanced atherosclerosis (1, 2), and cardiovascular outcomes in CAD patients with or without percutaneous coronary intervention (PCI) (3–6). Among patients with diabetes mellitus (DM), CAC tends to be higher and serves as an independent risk factor for subsequent major adverse cardiac events (MACE) (7). In contrast, hyperglycemia may lead to a pre-atherogenic effect, resulting in the development of calcified coronary plaques. Moreover, elevated glycosylated hemoglobin (HbA1c) independently contributes to severe CAC and its progression, suggesting that poor glycemic control may play an essential role in CAC pathophysiology (8). Notably, serum 1,5-anhydro-D-glucitol (1,5-AG) is a novel biomarker for short-term glycemic status and postprandial hyperglycemia, which may be more sensitive than HbA1c as a marker of postprandial glycemic control (9, 10). In patients undergoing elective PCI, low pre-procedural and follow-up serum 1,5-AG levels have been reported to be associated with MACE, even in patients with HbA1c < 7.0% (11, 12). All current evidence suggests that serum 1,5-AG levels may be a novel risk factor for coronary atherosclerosis.
Several studies on intravascular imaging, including intravascular ultrasound (IVUS) and optical coherence tomography (OCT), have shown a close relationship between CAC and the extent of atherosclerotic plaques (2, 13, 14). Recently, an IVUS study reported that a low 1,5-AG level, indicating postprandial hyperglycemia, is associated with the severity of CAC (15). However, calcium obstructs ultrasound penetration, meaning IVUS is unable to measure calcium thickness, area, or volume (16, 17). In contrast, OCT has an extraordinarily higher resolution than IVUS (10–20 vs. 100–200 μm, respectively) and has been suggested as a preferred imaging modality for the detailed in vivo assessment of atherosclerotic plaques. It can provide detailed information on plaque morphology and tissue composition, including intra-plaque lipidic arc and calcium thickness, area, volume (18). Therefore, in this study, we aimed to evaluate the relationship between serum 1,5-AG levels and CAC assessed by OCT in diabetic patients.
Materials and methods
Study design and objectives
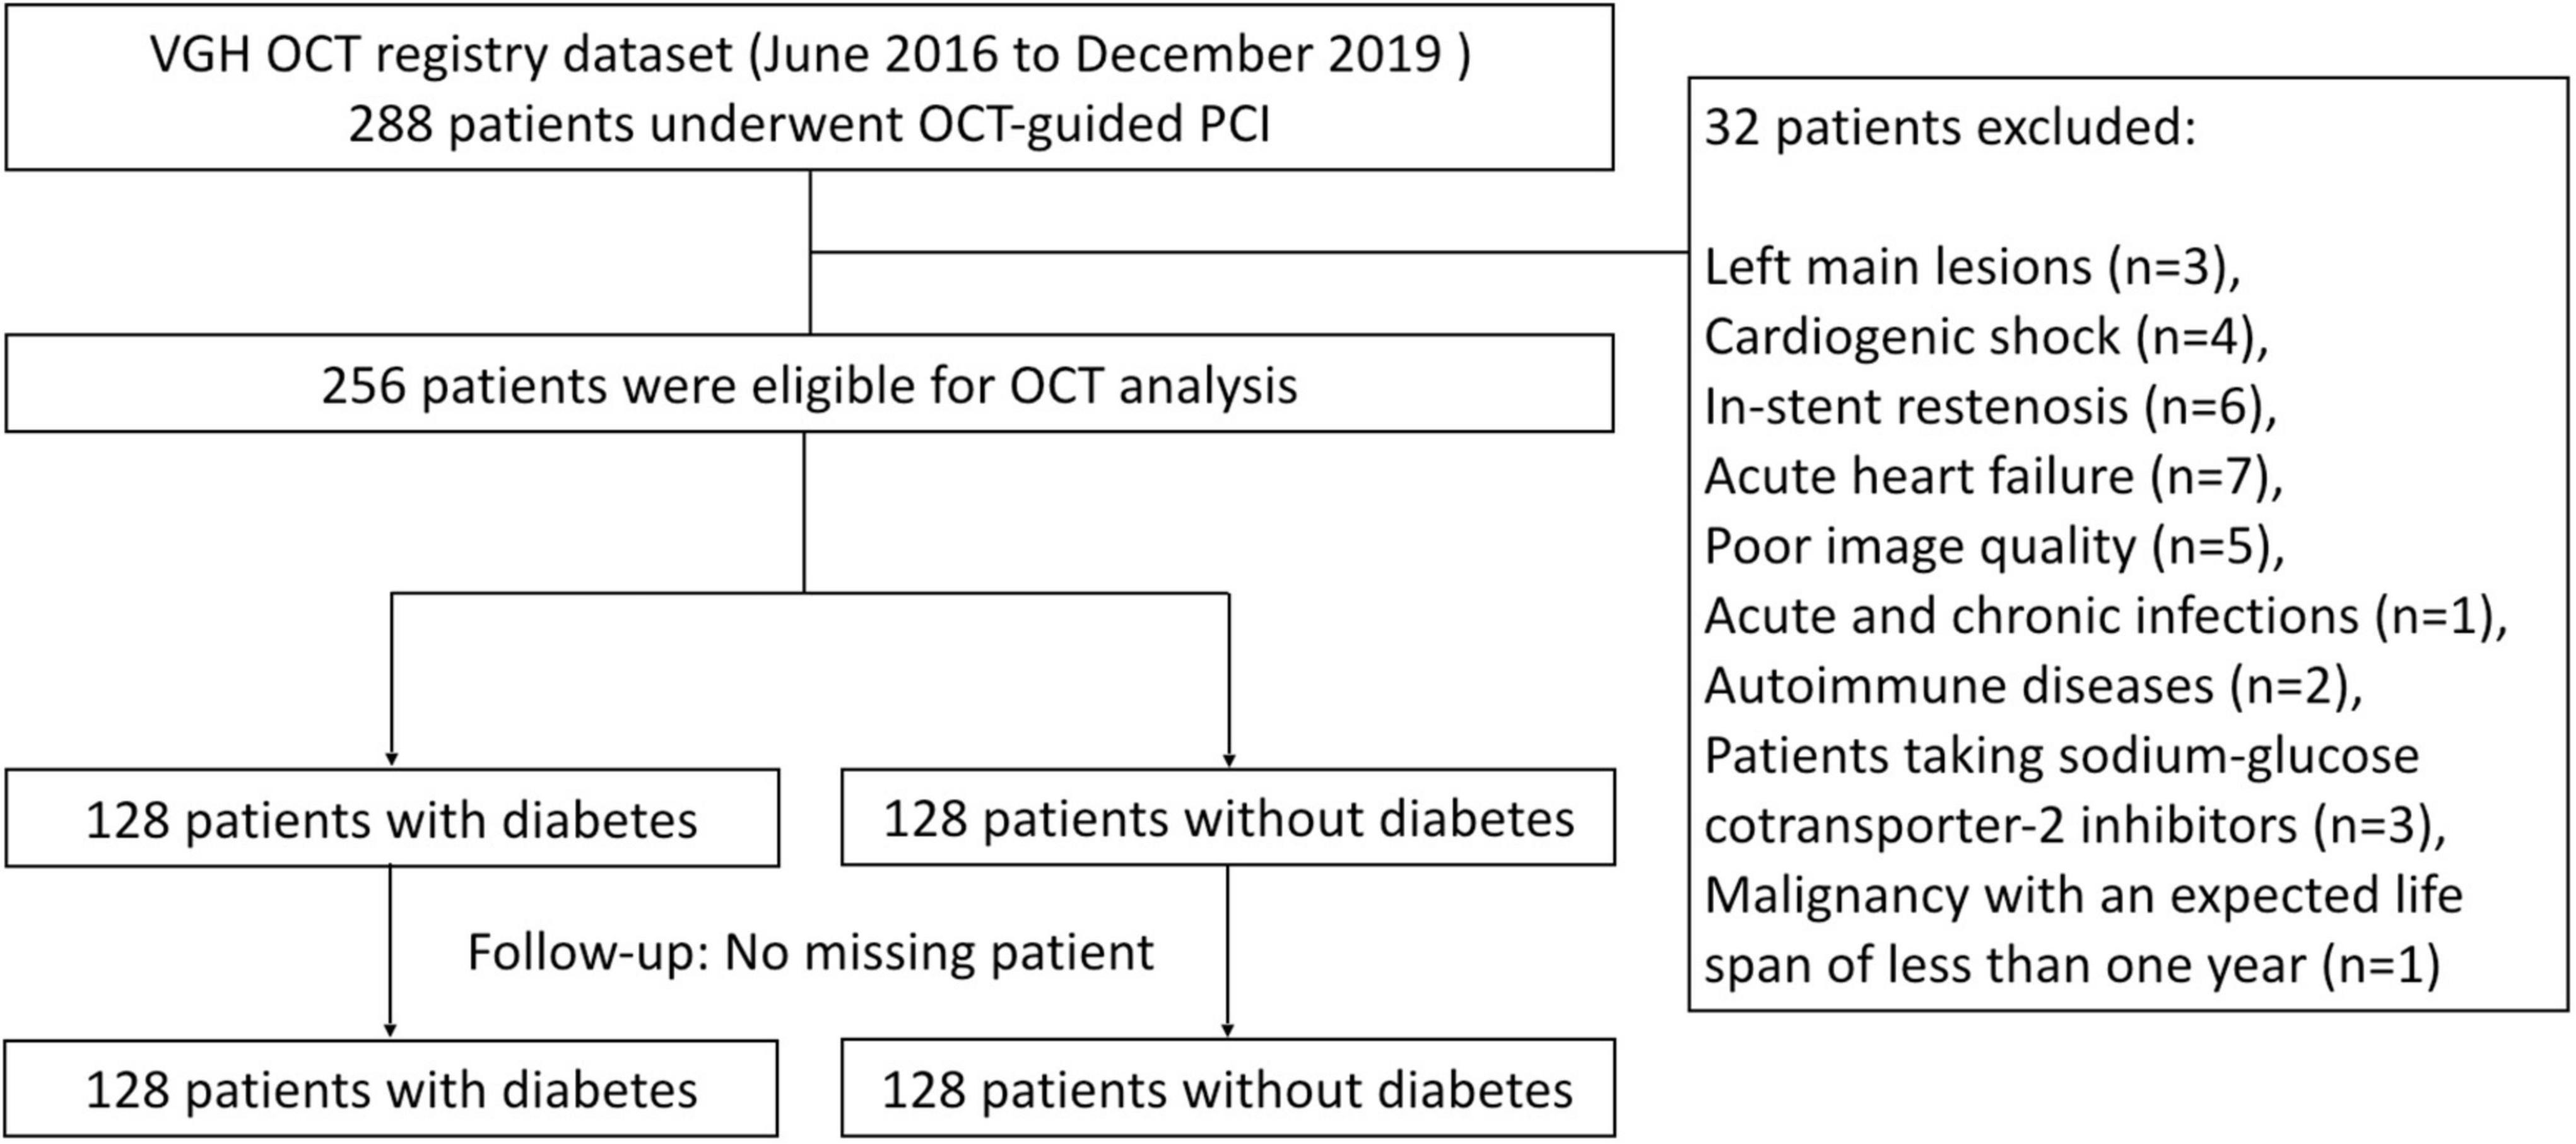
From June 2016 to December 2019, 288 patients with symptomatic angiographically significant stenotic coronary lesions (defined as lumen diameter stenosis ≥ 70%) were enrolled in the study. Patients consented to the use of their medical information prior to investigation. We selected the most severe lesion as the target lesion for OCT analysis in patients with multiple vessel diseases. Of enrolled patients, 256 patients were eligible for OCT analysis. The other 32 patients were excluded according to the exclusion criteria. The exclusion criteria for this study were patients with in-stent restenosis, left main lesions, cardiogenic shock, acute decompensated congestive heart failure, poor image quality, acute and chronic infections, autoimmune diseases, and malignancy with an expected life span of less than 1 year. Patients taking sodium-glucose cotransporter 2 inhibitors were also excluded to reduce possible interference, avoiding falsely low serum 1,5-AG levels (19, 20) (Figure 1). This specific research question was developed post hoc. However, data were collected prospectively for the purpose of analyses such as this. DM was defined according to the American Diabetes Association criteria or medical records and the treatment with insulin or glucose-lowering medication. Hypertension was diagnosed as systolic blood pressure ≥ 140 mmHg or diastolic blood pressure ≥ 90 mmHg or the use of oral antihypertensive medicines. Hyperlipidemia was defined according to the modified National Cholesterol Education Program-Adult Treatment Panel III. According to 2014 ACC/AHA guideline for Non–ST-Elevation Acute Coronary Syndromes (ACS) and 2017 Guidelines on Management of Acute Myocardial Infarction in Patients Presenting with ST-Segment Elevation, ACS was defined as a composite of unstable angina pectoris, non-ST-segment elevation myocardial infarction (NSTEMI) and ST-segment elevation myocardial infarction (STEMI). The estimated glomerular filtration rate (eGFR) was calculated using the Modification of Diet in Renal Disease (MDRD) formula (21). The study conformed to the principles outlined in the Declaration of Helsinki and was approved by relevant ethical bodies. The Institutional Review Board approved the study protocol at the Taipei-Veterans General Hospital, and all participants gave their written informed consent for their data to be used for research.
Procedural details and angiographic analysis
During PCI procedures, selecting the imaging modality or not was dependent on the operator’s preference and clinical scenario. Only if OCT was chosen as the imaging modality would patients be enrolled. All enrolled patients underwent OCT imaging prior to PCI. If the OCT catheter could not cross the target lesion, predilation with a 1.5 mm or 2.0 mm balloon would be performed. A total of 256 patients were eligible for OCT analysis, and all of them underwent successful OCT-guided PCI. OCT-guided PCI was considered successful if the stent optimization criteria were met: (1) minimal stent area of ≥ 4.5 mm2; (2) minimal stent area of ≥ 80% of the average reference lumen area; (3) stent-adjacent vessel lumen distance of ≤ 200 μm; (4) edge dissection with a width of < 200 μm adjacent (<5 mm) to a stent edge; (5) intrastent plaque/thrombus protrusion of < 500 μm in thickness; and (6) reference luminal narrowing of ≥ 4.5 mm2. Coronary thrombolysis in myocardial infarction (TIMI) grade 3 flow was obtained at the end of the procedure without major complications. Dual antiplatelet therapy was started after the procedure, and all patients received aspirin (100 mg per day) indefinitely and clopidogrel (300 mg loading dose, and 75 mg maintenance per day) for 12 months. Medication for the treatment of angina pectoris (calcium channel blockers, beta-blockers, and nitrates) were also continued. The operation records and medical records were thoroughly reviewed, and all demographic and procedural variables were recorded in the data collection sheet. The following angiographic parameters were obtained by quantitative coronary analysis (QCA): minimal lumen diameter (MLD, mm), reference vessel diameter (RVD, mm), and percentage diameter stenosis (% DS).
Optical coherence tomography image analysis
The target plaque lesion was evaluated by pre-intervention OCT in all enrolled patients. By comparing pre- and post-PCI OCT findings, a target lesion segment was defined as the lesion that was stented. We performed OCT pullbacks with the ILUMIEN OPTIS™ imaging system and Dragonfly™ (Abbott Vascular, Santa Clare, CA, United States) OCT catheters. Two independent investigators (WC Huang and HY Chen) analyzed the OCT images using the offline ORW software (Abbott Vascular, Santa Clare, CA, United States). If the results differed between the two investigators, a third independent investigator was consulted to act as an umpire. OCT imaging was assessed at 0.1-mm intervals, and longitudinal cross-sections were analyzed within the stented lesion, 5 mm proximally and distally to the stent edge.
According to the OCT analysis, atherosclerotic plaques were classified as fibrotic, fibrolipidic, or fibrocalcified (22). The detailed OCT definitions were as follows: (1) fibrotic type, maximum lipid core arc ≤ 90° and maximum calcium arc ≤ 90°; (2) fibrolipidic type, which is sub-classified as fibroatheroma, maximum lipid core arc > 90°, minimal fibrous cap thickness > 65 μm, and thin-cap fibroatheroma (TCFA), maximum lipid core arc > 90° and minimal fibrous cap thickness ≤ 65 μm at the thinnest part; and (3) fibrocalcific type, maximum calcium arc > 90° with maximum lipid core arc ≤ 90°. Quantitative analysis of the calcium content in native vessels was performed using cross-sectional OCT images at 0.1-mm intervals. The minimal lumen area, maximal calcium arc, and thickness of the calcification were recorded. We measured the relative calcium index [RCI = (mean calcium arc × calcium length)/(360 × analyzed length)] and relative lipid core index [RLCI = (mean lipid core arc × lipid core length)/(360 × analyzed length)] as the relative volumetric indices of intra-plaque calcium and lipid content. A calcium nodule was defined as an accumulation of multiple small protruding nodular calcifications with a superficial thrombus or fibrin.
Laboratory measurements
Blood samples were collected prior to the PCI procedure and immediately centrifuged at 3,000 rpm for 10 min at 4°C. Plasma samples were kept frozen at −80°C until analysis. Serum 1,5-AG was measured using a commercial competitive ELISA kit (Cloud-Clone Corp., Houston, United States) with a standard range of 1.9–150 μg/mL. The detection limit was 0.7 μg/mL.
Clinical follow-up and outcomes
All patients were followed up by medical records review and telephone interviews. MACE was defined as the composite endpoint consisting of cardiovascular (CV) death, non-fatal myocardial infarction (MI), target vessel revascularization (TVR), and non-target vessel revascularization (Non-TVR). CV death was diagnosed as any death with a definite CV cause or death that is not clearly attributed to a non-CV cause. Non-fatal myocardial infarction was defined as the presence of significant new Q waves in at least two electrocardiography leads or symptoms compatible with MI associated with an increase in creatinine kinase-MB fraction ≥ 3 times the upper limit of the reference range. TVR referred to clinically driven repeat revascularization in the follow-up period due to restenosis within the target lesion or the same epicardial coronary artery. No patients were lost to follow-up.
Statistical analysis
All continuous variables are presented as mean ± standard deviation (SD) or 95% confidence interval (CI) and median [interquartile range (IQR)]. Categorical variables are described as frequencies. The unpaired t-test or Mann–Whitney U-test were used for comparing continuous variables, as appropriate. Pearson’s correlation coefficients were calculated to examine the possible correlations between continuous variables. Comparison of serum 1,5-AG levels among plaque types was performed by analysis of variance (ANOVA). Post hoc comparisons were performed by the Bonferroni test. Univariate and multivariate Cox regression models were used to examine the association between clinical outcomes and OCT plaque characteristics. Hazard ratios (HRs) and 95% CIs were calculated. Statistical significance was defined at p < 0.05. All statistical analyses were performed using the SPSS statistical software (IBM SPSS Statistics for Windows, Version 22.0. Armonk, NY: IBM Corp.).
Results
Baseline characteristics of the study population
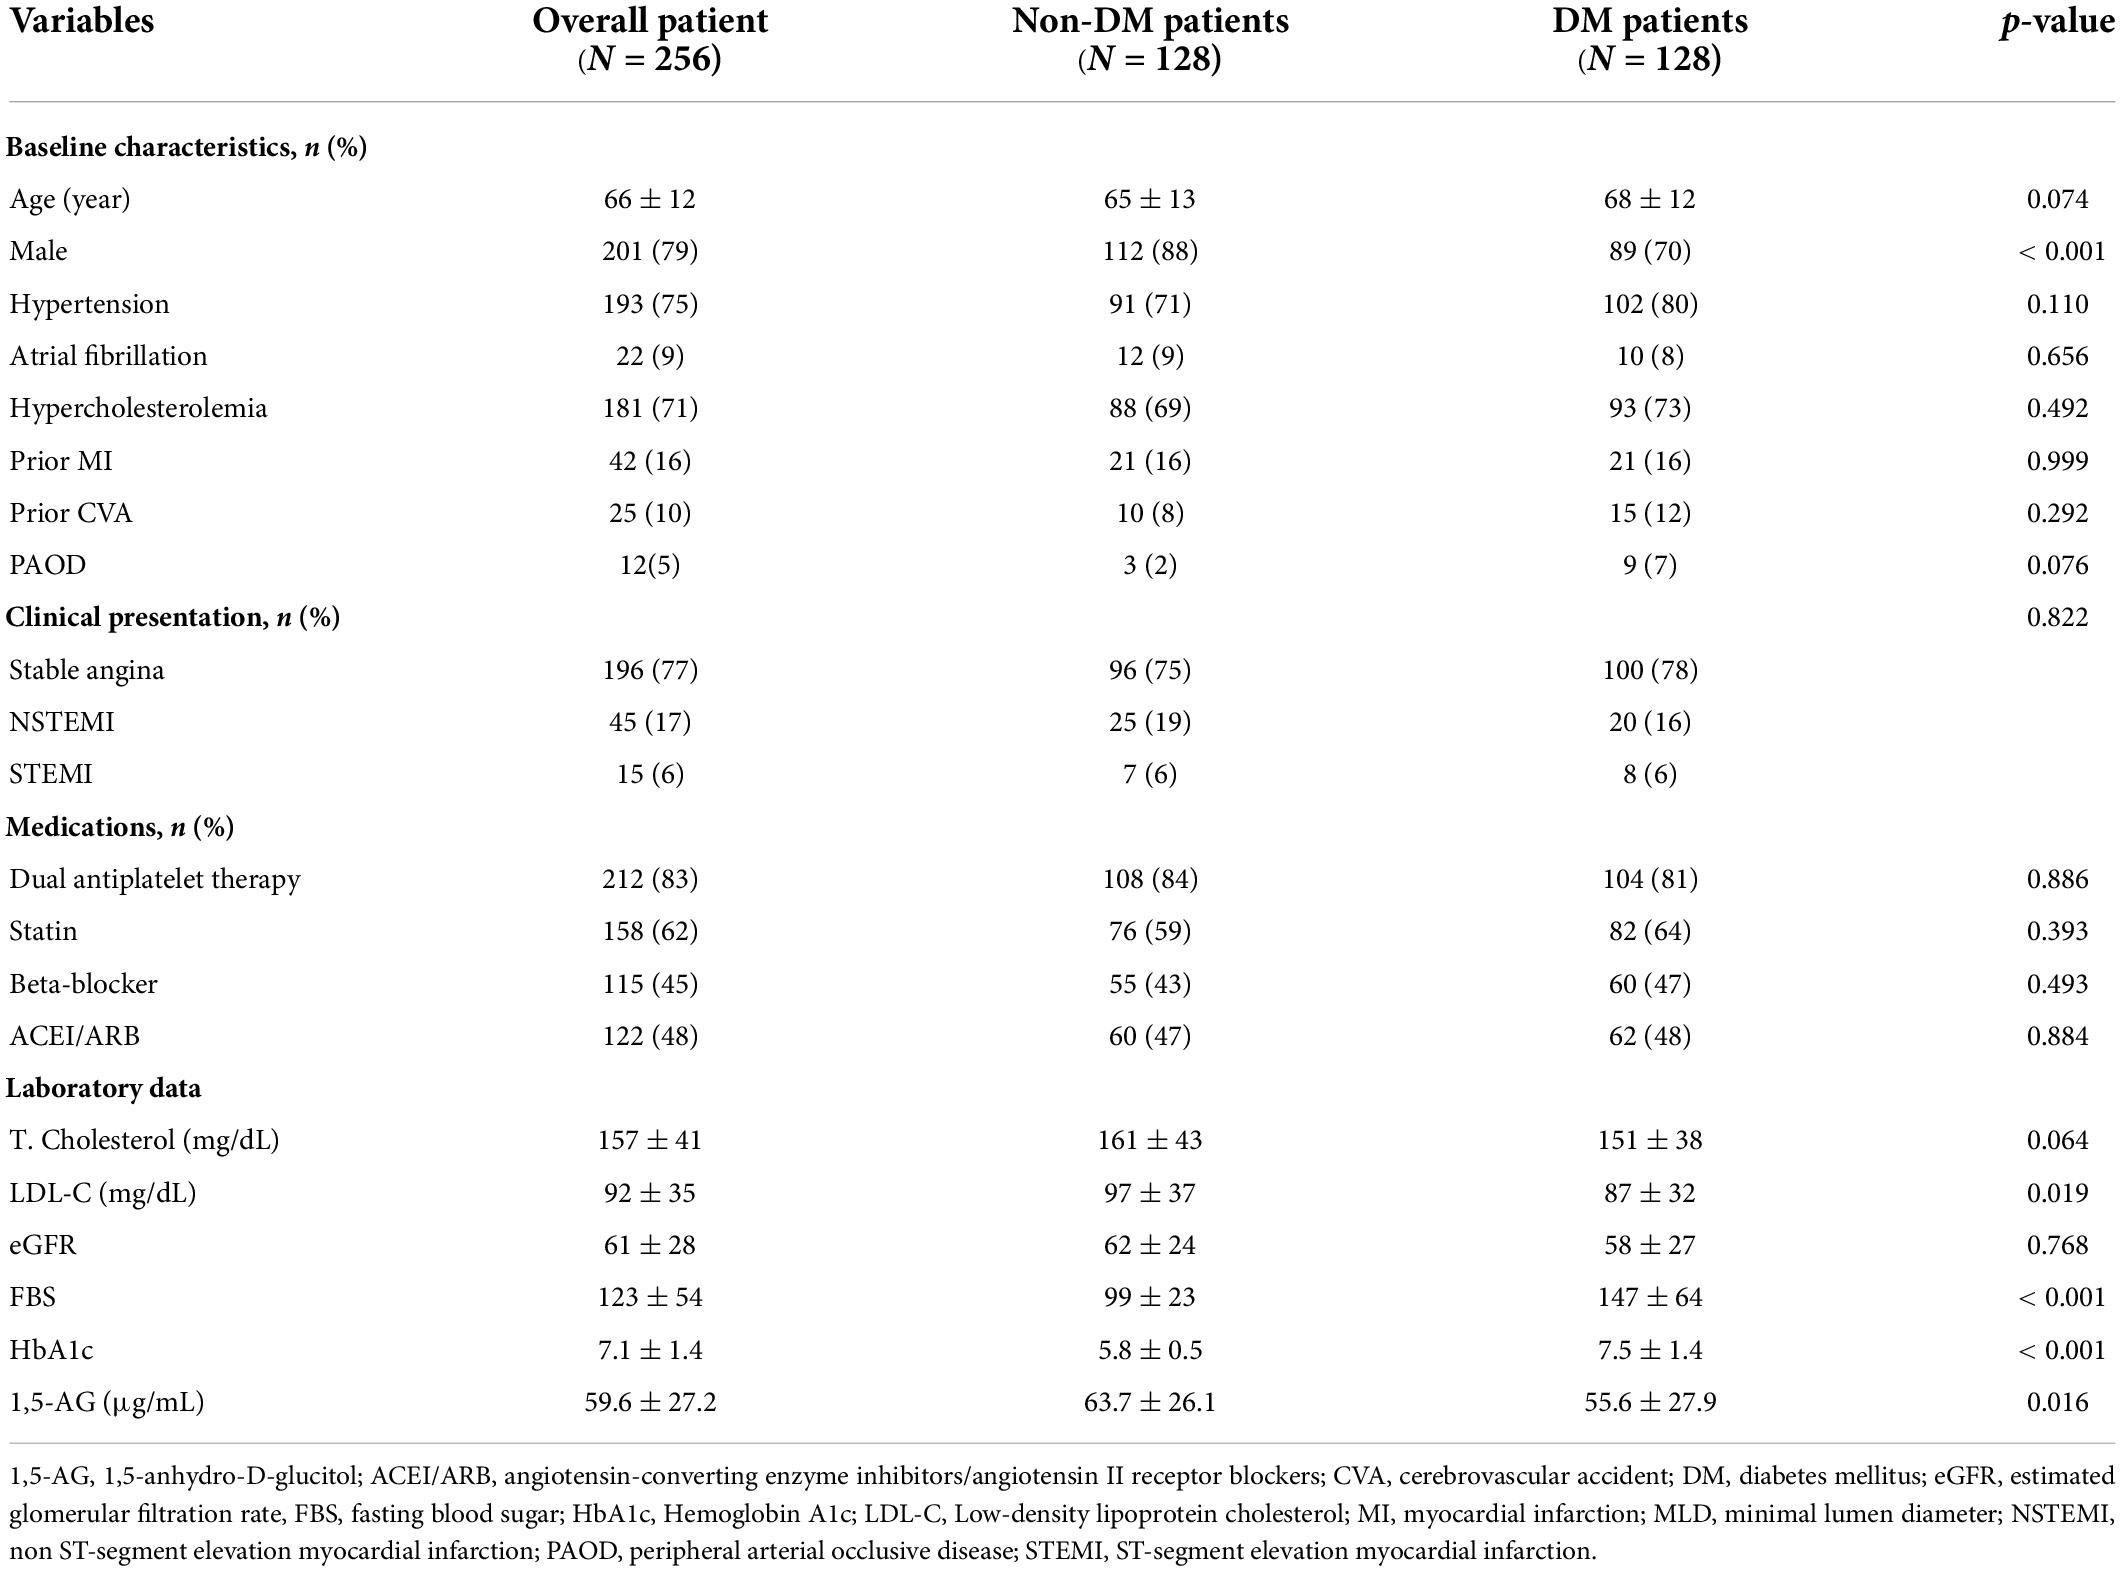
From June 2016 to December 2019, 288 patients with symptomatic angiographically significant stenotic coronary lesions who underwent OCT-guided PCI were enrolled in the study. Of them, 256 patients were eligible for OCT analysis. 32 patients were excluded according to the exclusion criteria. Baseline characteristics of the 256 patients stratified by DM are summarized in Table 1. The mean age of the patients was 66 ± 12 years. Half of the patients had DM (50%, 128/256), and the majority of patients were male (79%, 201/256). The mean serum 1,5-AG level of the total population was 59.6 ± 27.2 μg/mL. Moreover, serum 1,5-AG level was significantly lower in DM patients than in non-DM patients (DM vs. non-DM: 55.6 ± 27.9 μg/mL vs. 63.7 ± 26.1 μg/mL, p = 0.016, Figure 2A).
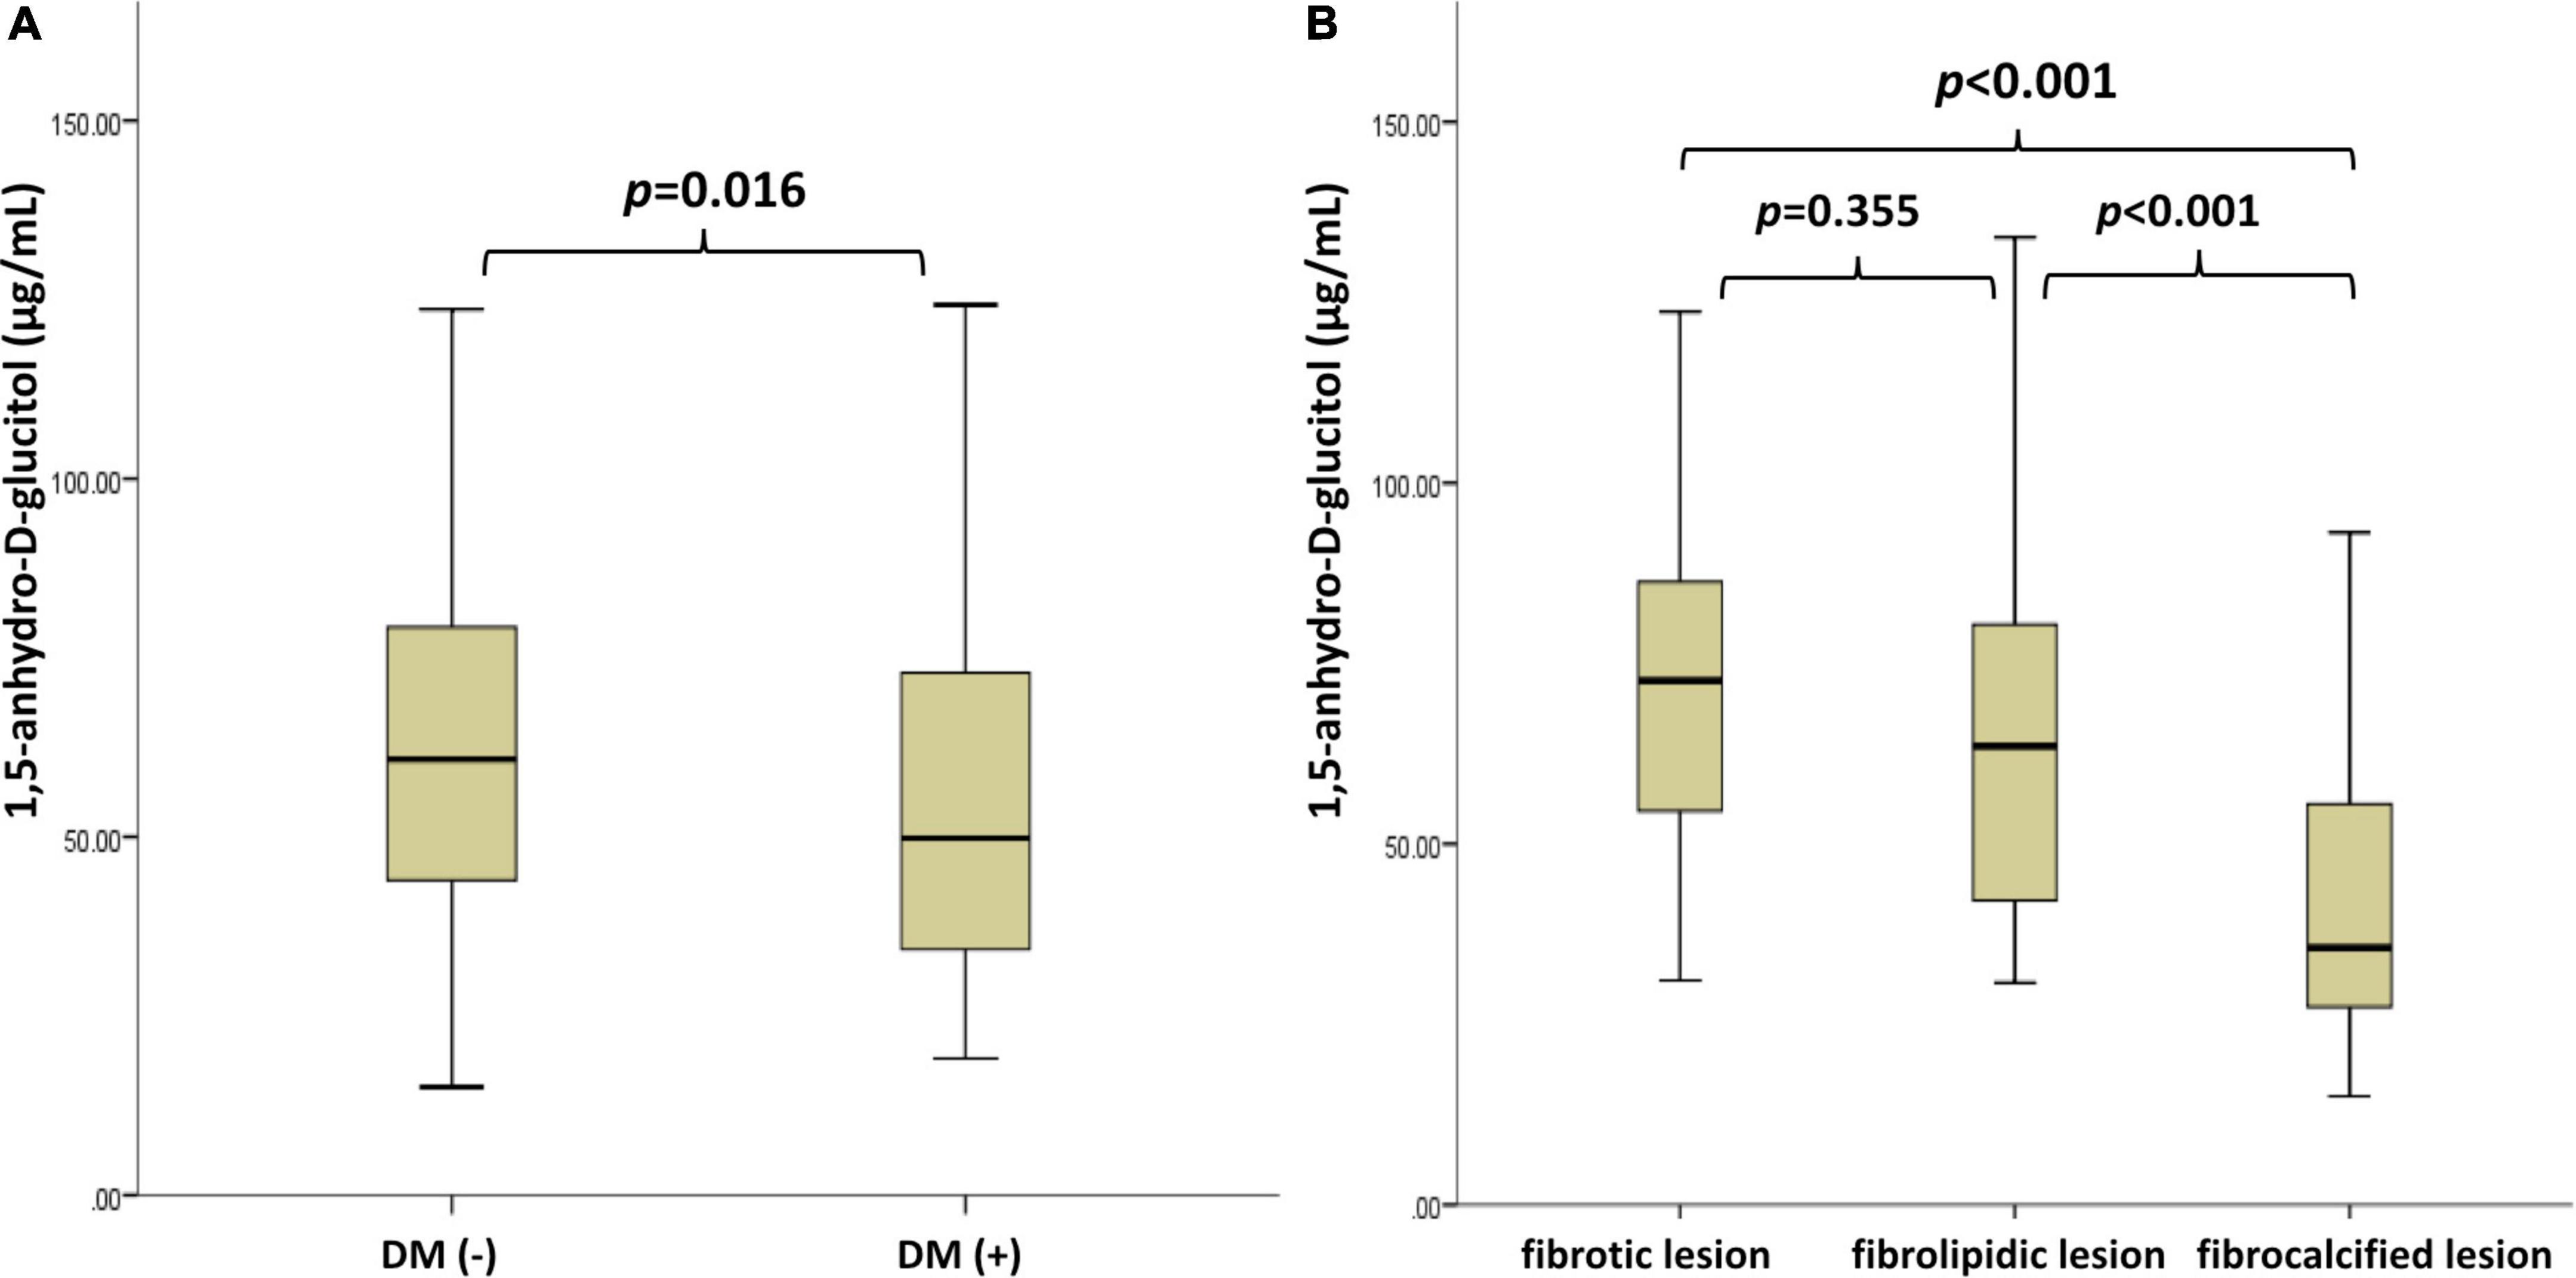
Figure 2. Serum 1,5-AG levels were stratified by DM and plaque characteristics. p-values by analysis of variance (ANOVA and Chi-square) were shown. Post hoc comparisons were performed by the Bonferroni test. (A) Serum 1,5-AG level was significantly lower in DM patients than in non-DM patients (DM vs. non-DM: 55.6 ± 27.9 μg/mL vs. 63.7 ± 26.1 μg/mL, p = 0.016). (B) Serum 1,5-AG levels were significantly lower in fibrocalcified lesions than in fibrotic or fibrolipidic lesions (fibrocalcified vs. fibrotic or fibrolipidic: 42.8 ± 19.1 vs. 72.9 ± 25.2 or 66.4 ± 27.5 μg/mL, p < 0.001). 1,5-AG, 1,5-anhydro-D-glucitol, DM, diabetes mellitus.
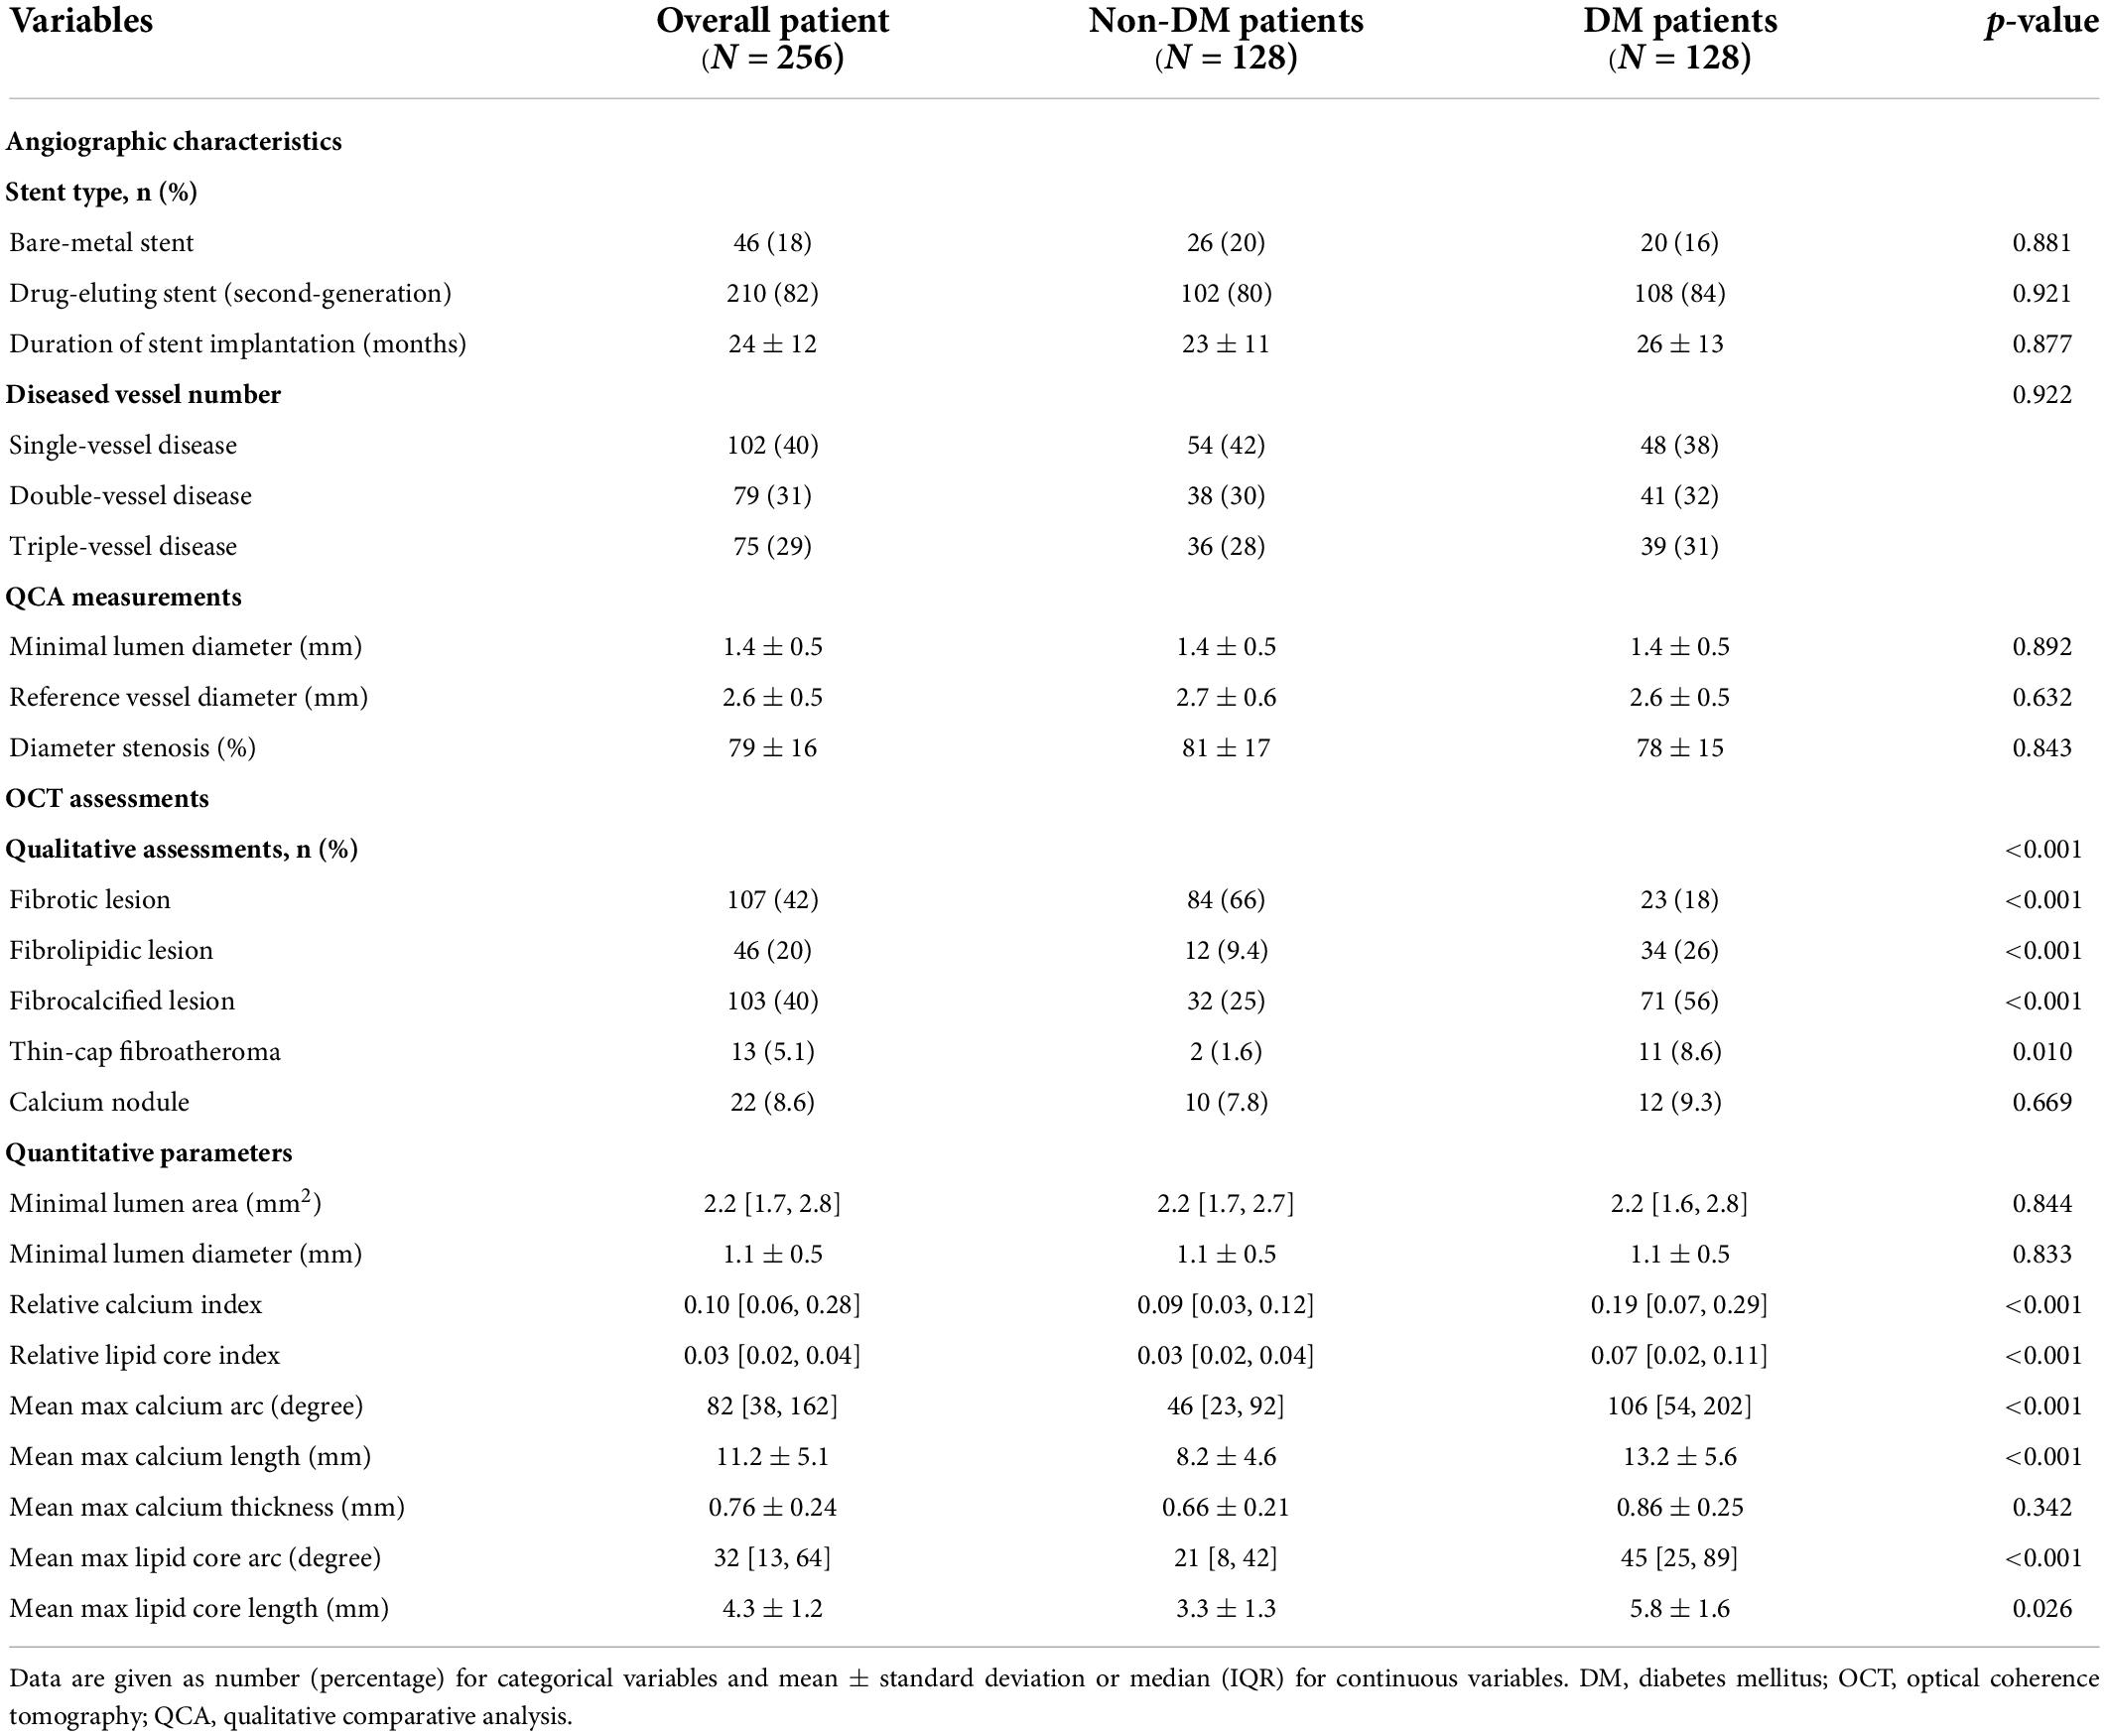
OCT characteristics of the lesions are summarized in Table 2. According to the OCT analysis, the evaluated atherosclerotic lesions were classified as fibrotic plaque (41.8%, 107/256), fibrolipidic plaque (20.0%, 46/256), and fibrocalcific plaque (40.2%, 103/256). TCFAs were present in 13 patients (5.1%), while calcium nodules were present in 22 patients (8.6%). Complex lesions, defined as fibrolipidic and fibrocalcified lesions, were more common among patients with DM. In addition, calcium and lipid contents (RCI = 0.18 ± 0.12, RLCI = 0.065 ± 0.067, p < 0.001, respectively), TCFA (8.6%, p = 0.01), calcium arc (98.2 ± 42.1°, p < 0.001), and calcium length (13.2 ± 5.62 mm, p < 0.001) were higher in DM patients.
Levels of serum 1,5-AG were significantly lower in fibrocalcified lesions than in fibrotic or fibrolipidic lesions (fibrocalcified vs. fibrotic or fibrolipidic: 42.8 ± 19.1 vs. 72.9 ± 25.2 or 66.4 ± 27.5 μg/mL, p < 0.001, respectively, Figure 2B). Furthermore, we found a strong inverse correlation between serum 1,5-AG level and the RCI (r = −0.729, p < 0.001, Figure 3). In contrast, serum 1,5-AG levels correlated significantly to the RLCI in ACS patients (r = −0.358, p < 0.001), but not in non-ACS patients (r = −0.062, p = 0.322). Three representative cases with different correlations between plaque type and serum 1,5-AG levels are shown in Figure 4.
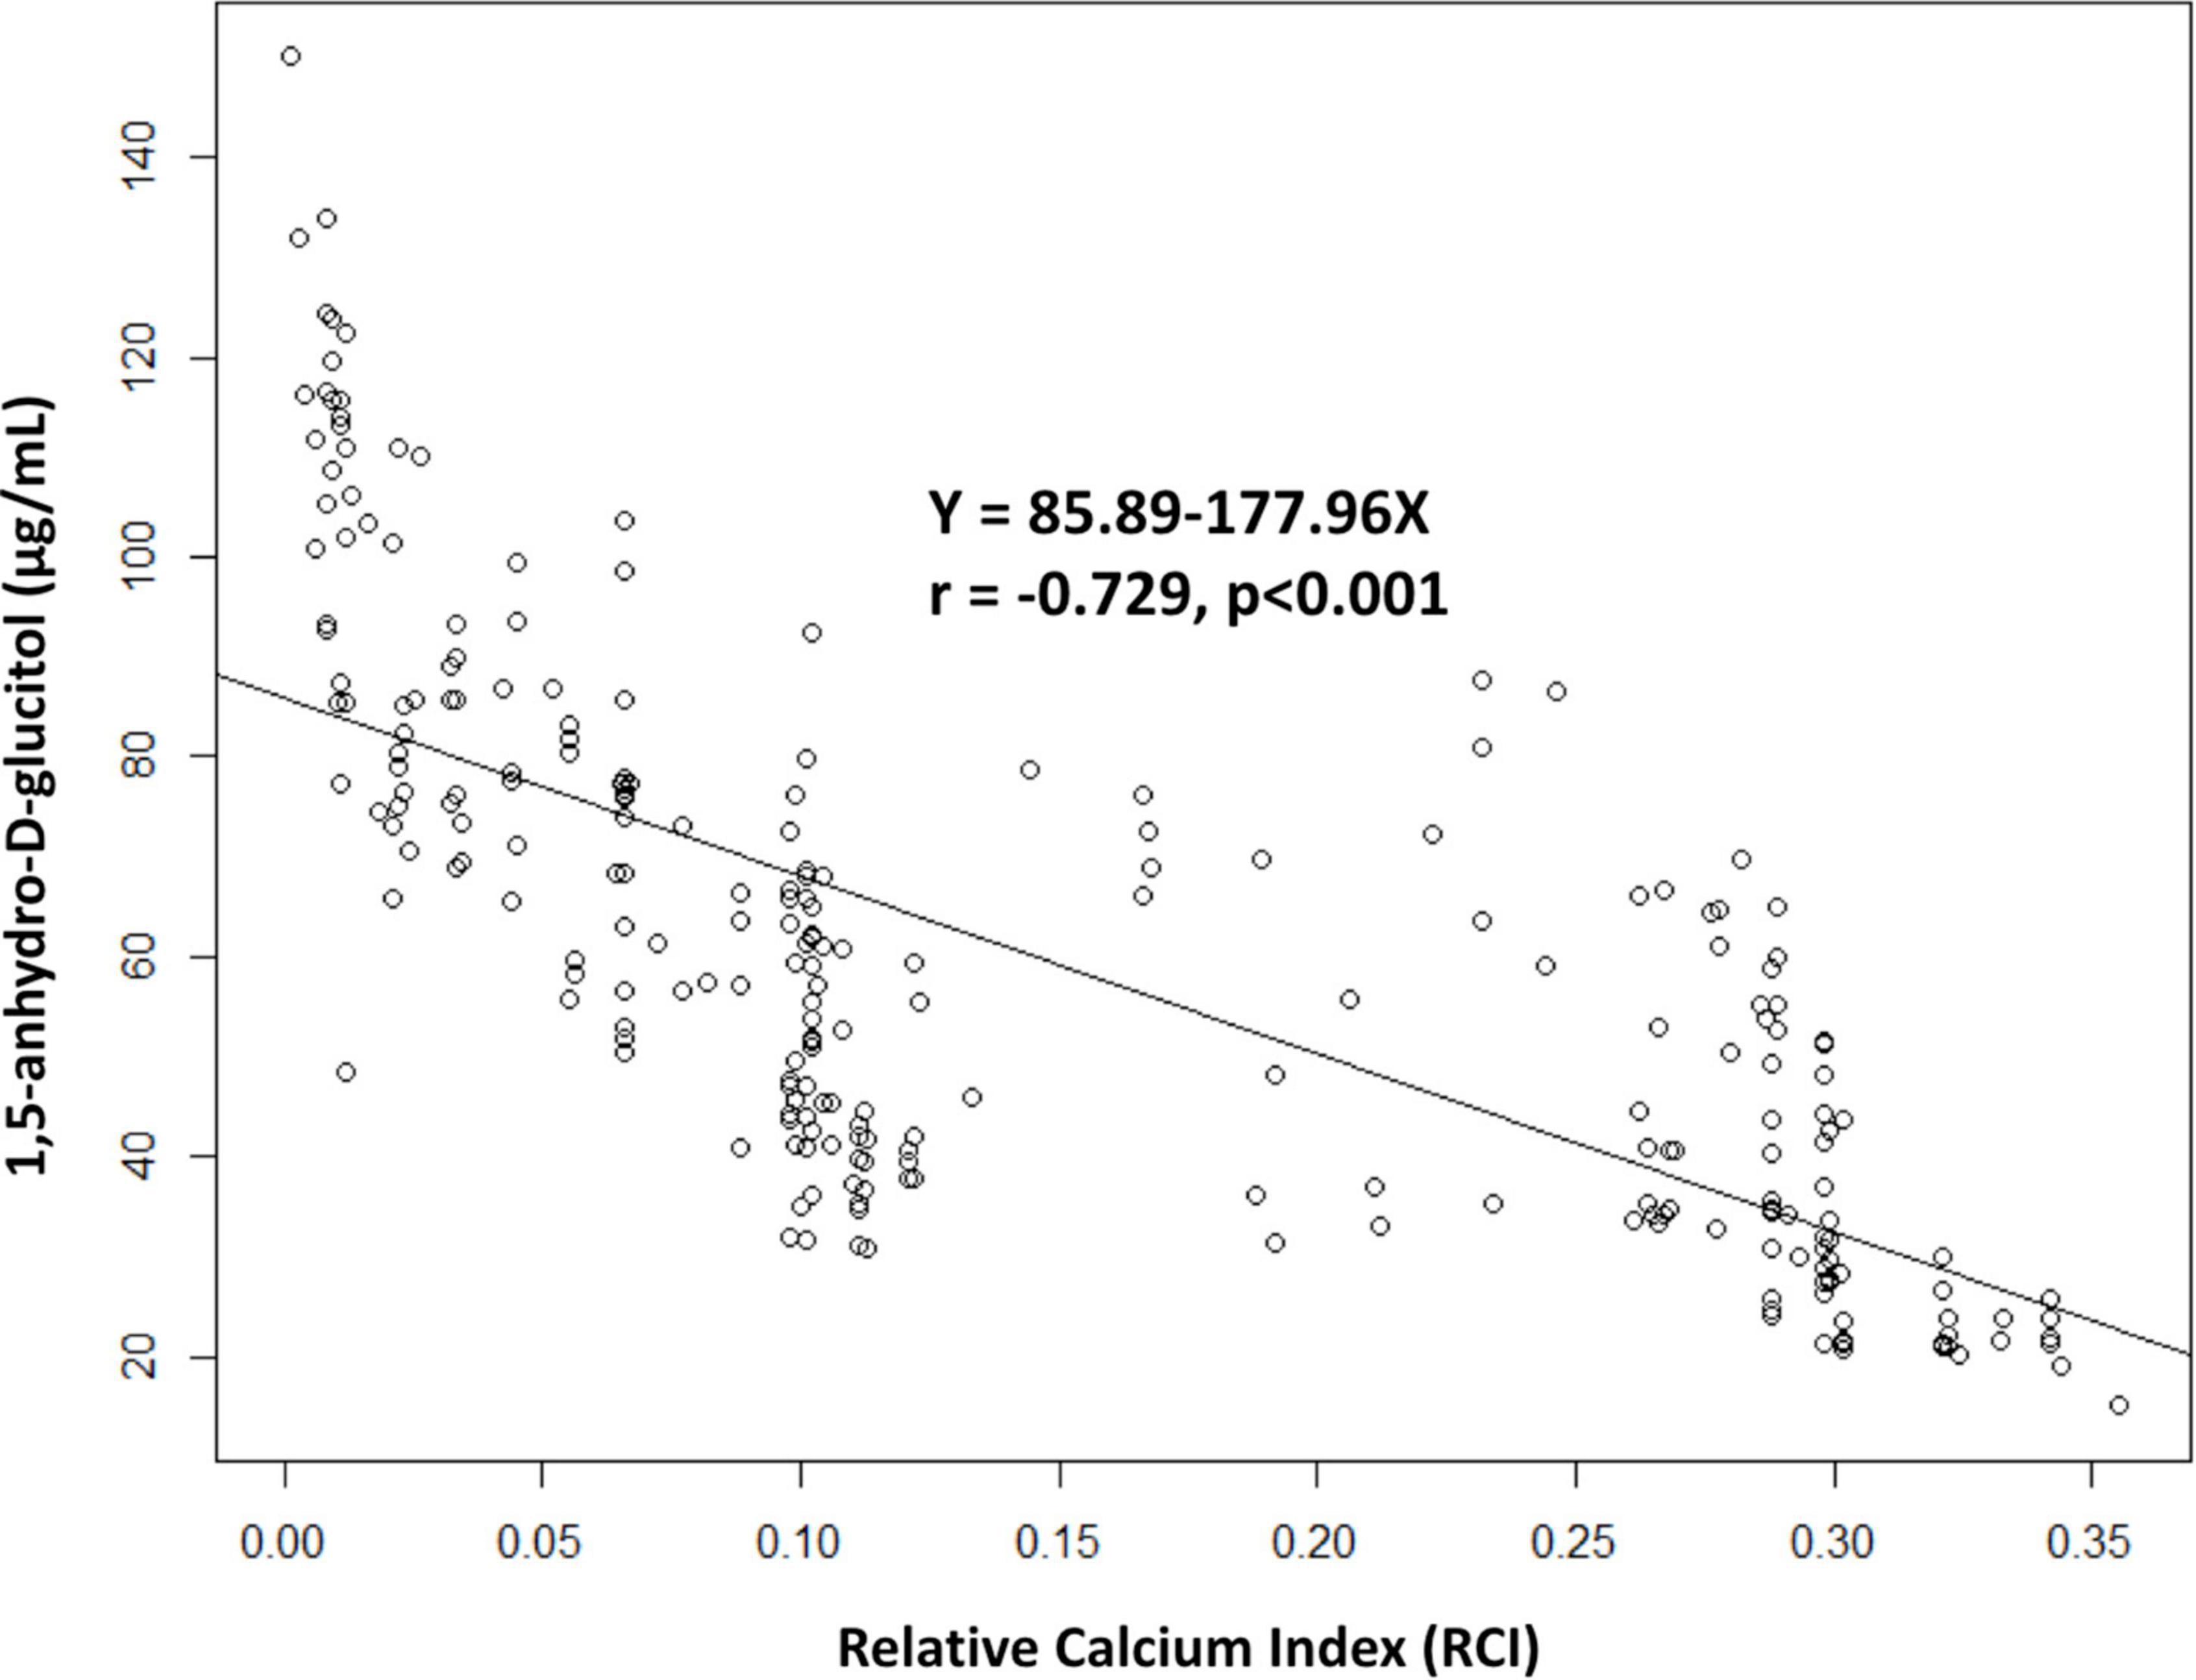
Figure 3. Correlations between serum 1,5-AG level and relative calcium index. 1,5-AG, 1,5-anhydro-D-glucitol.
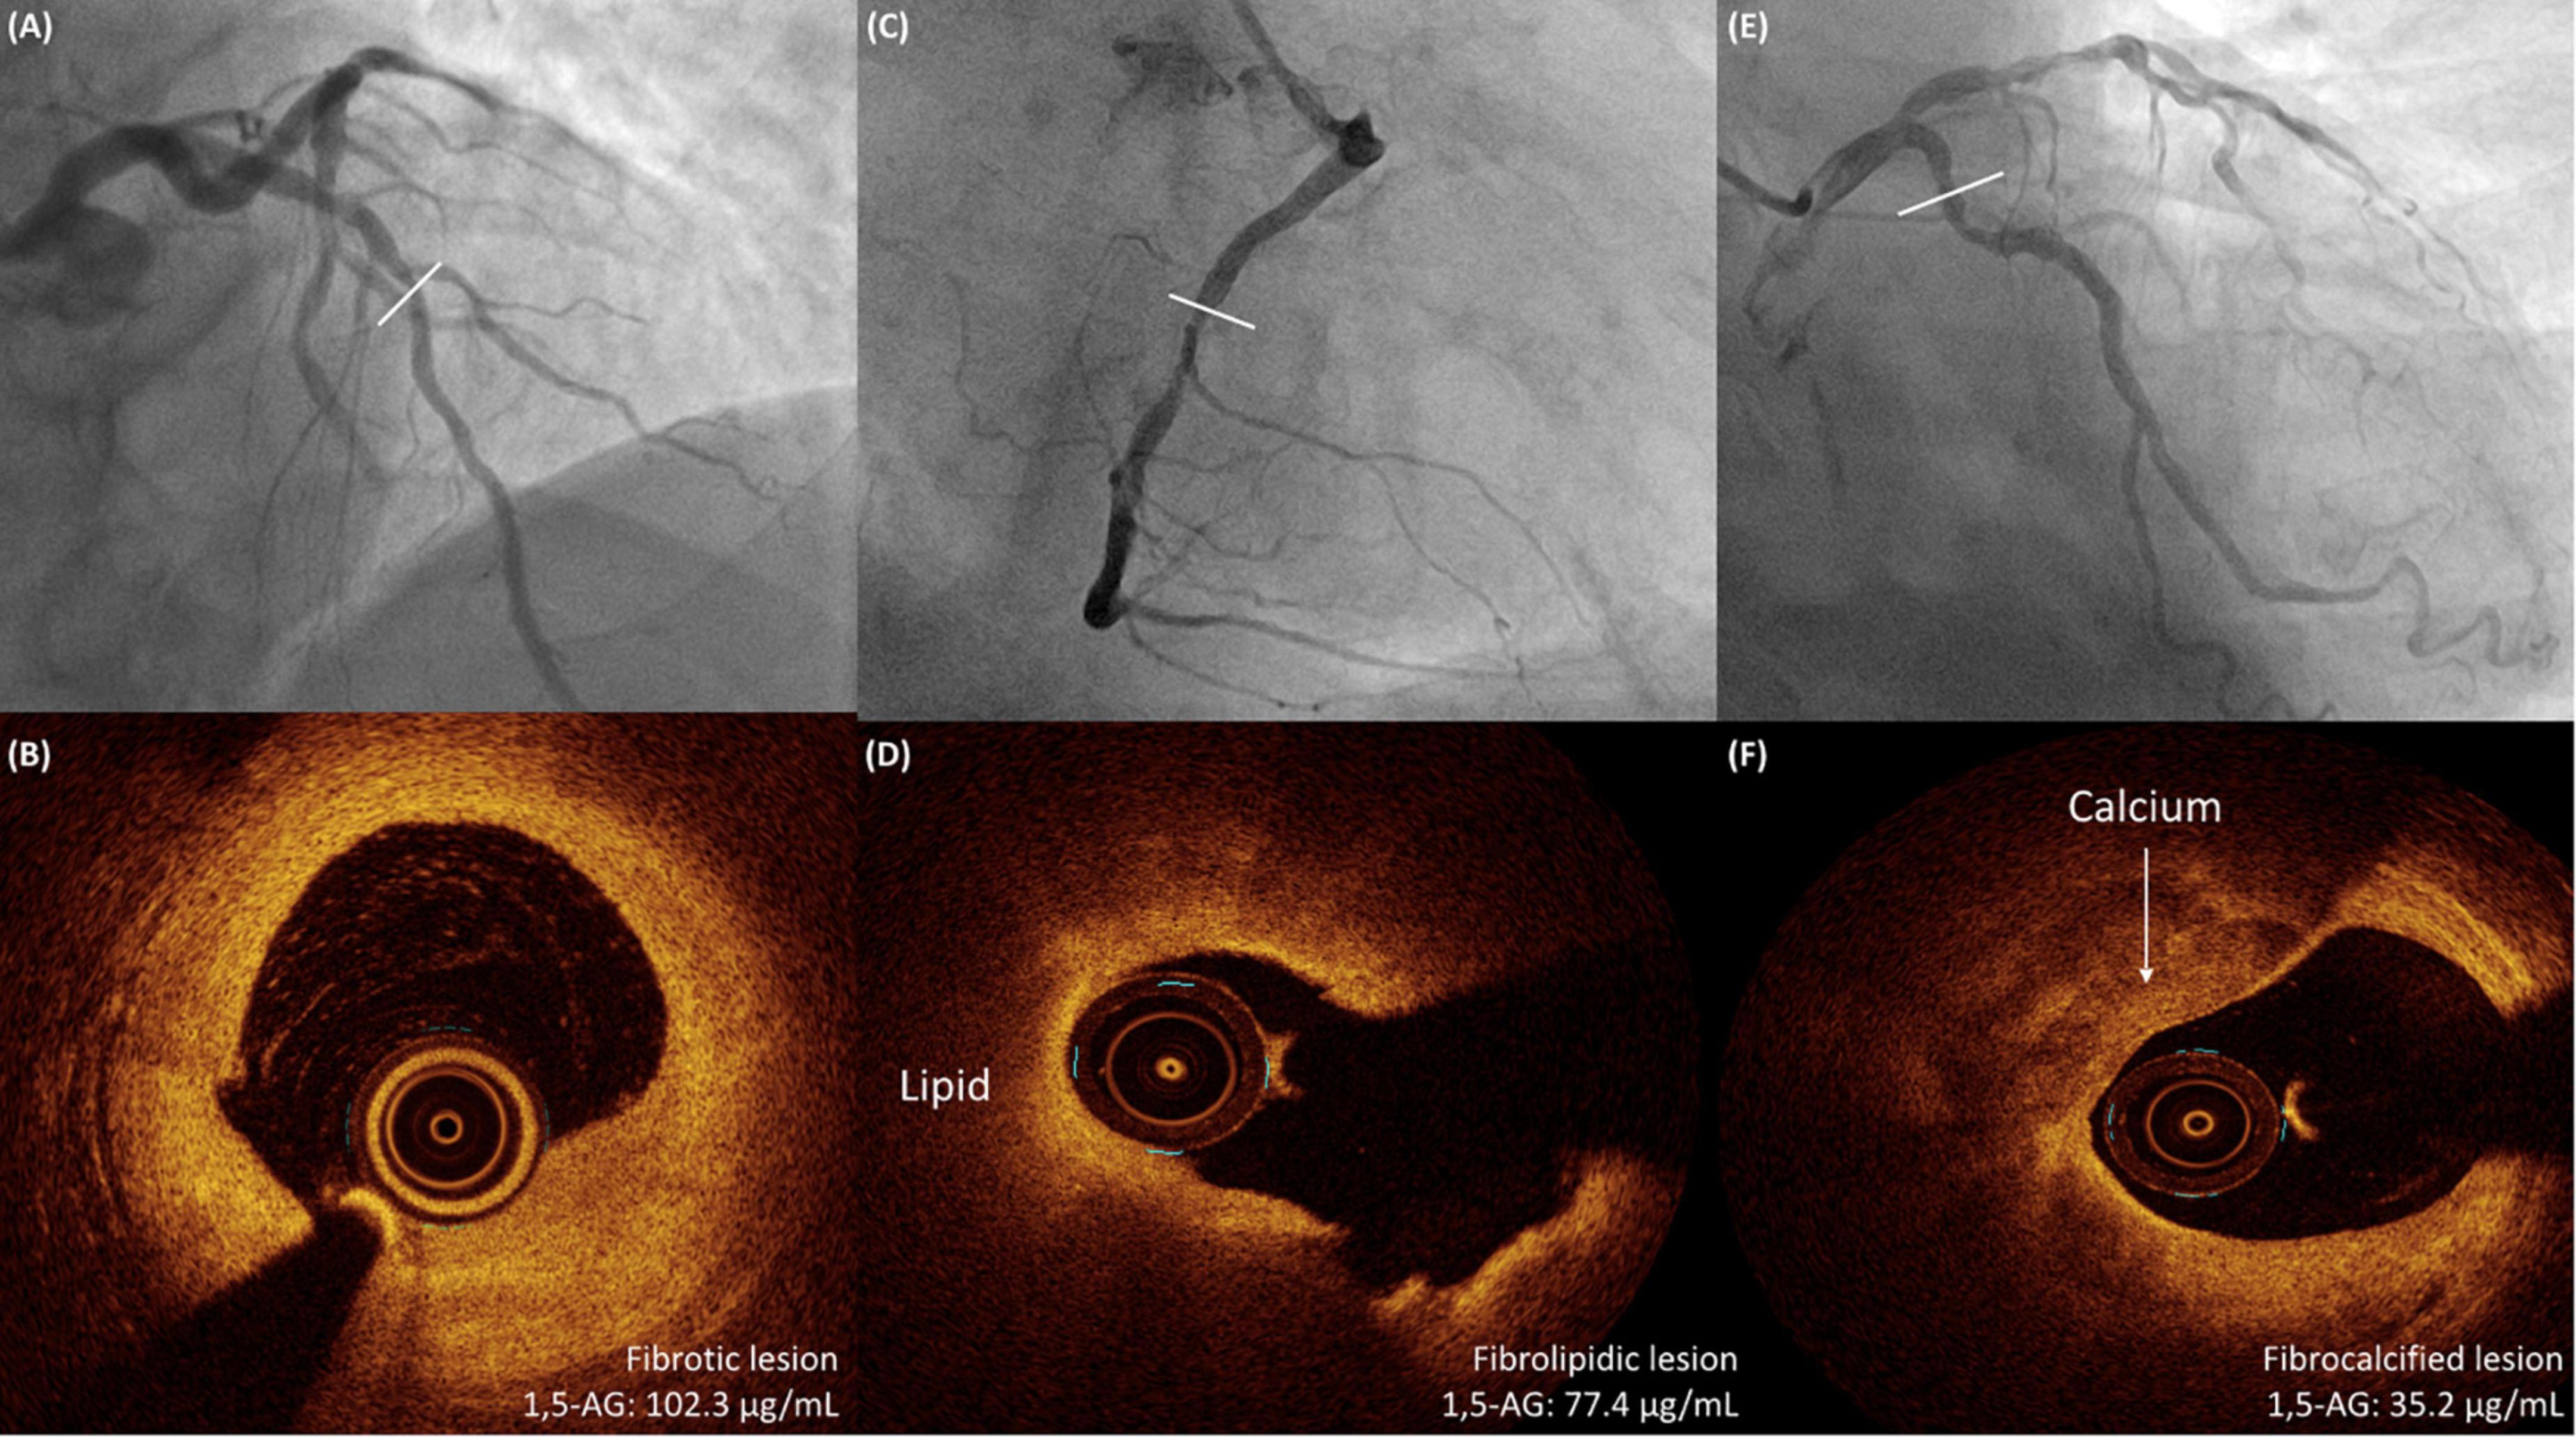
Figure 4. Three representative cases with different correlations between OCT-detected plaque type and serum 1,5-AG levels. (A,B) A 68-year-old man with hypertension and stable angina is shown to have a lesion in the middle LAD on angiography. OCT examination shows a fibrotic lesion. The serum 1,5-AG level is 102.3 μg/mL. (C,D) A 72-year-old man with DM and NSTEMI is shown to have a severe lesion in the middle RCA on angiography. OCT examination shows a fibrolipidic lesion. The serum 1,5-AG level is 77.4 μg/mL. (E,F) A 68-year-old man with DM and stable angina is shown to have a diffuse lesion in the proximal LCX on angiography. OCT examination shows a fibrocalcified lesion. The serum 1,5-AG level is 35.2 μg/mL. 1,5-AG, 1,5-anhydro-D-glucitol; DM, diabetes mellitus; LAD, left anterior descending artery; LCX, left circumflex artery; NSTEMI, non ST-segment elevation myocardial infarction; OCT, optical coherence tomography; RCA, right coronary artery.
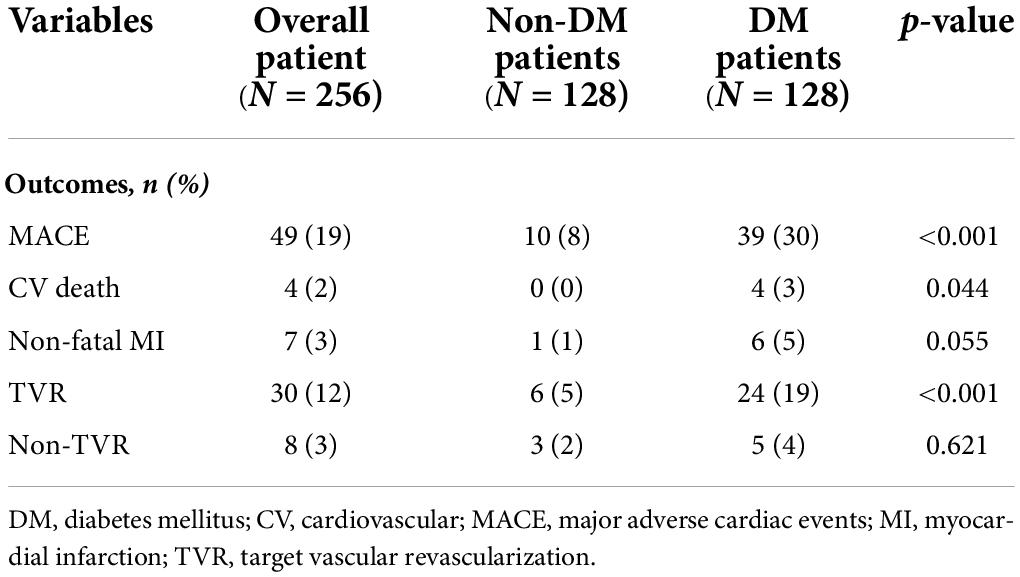
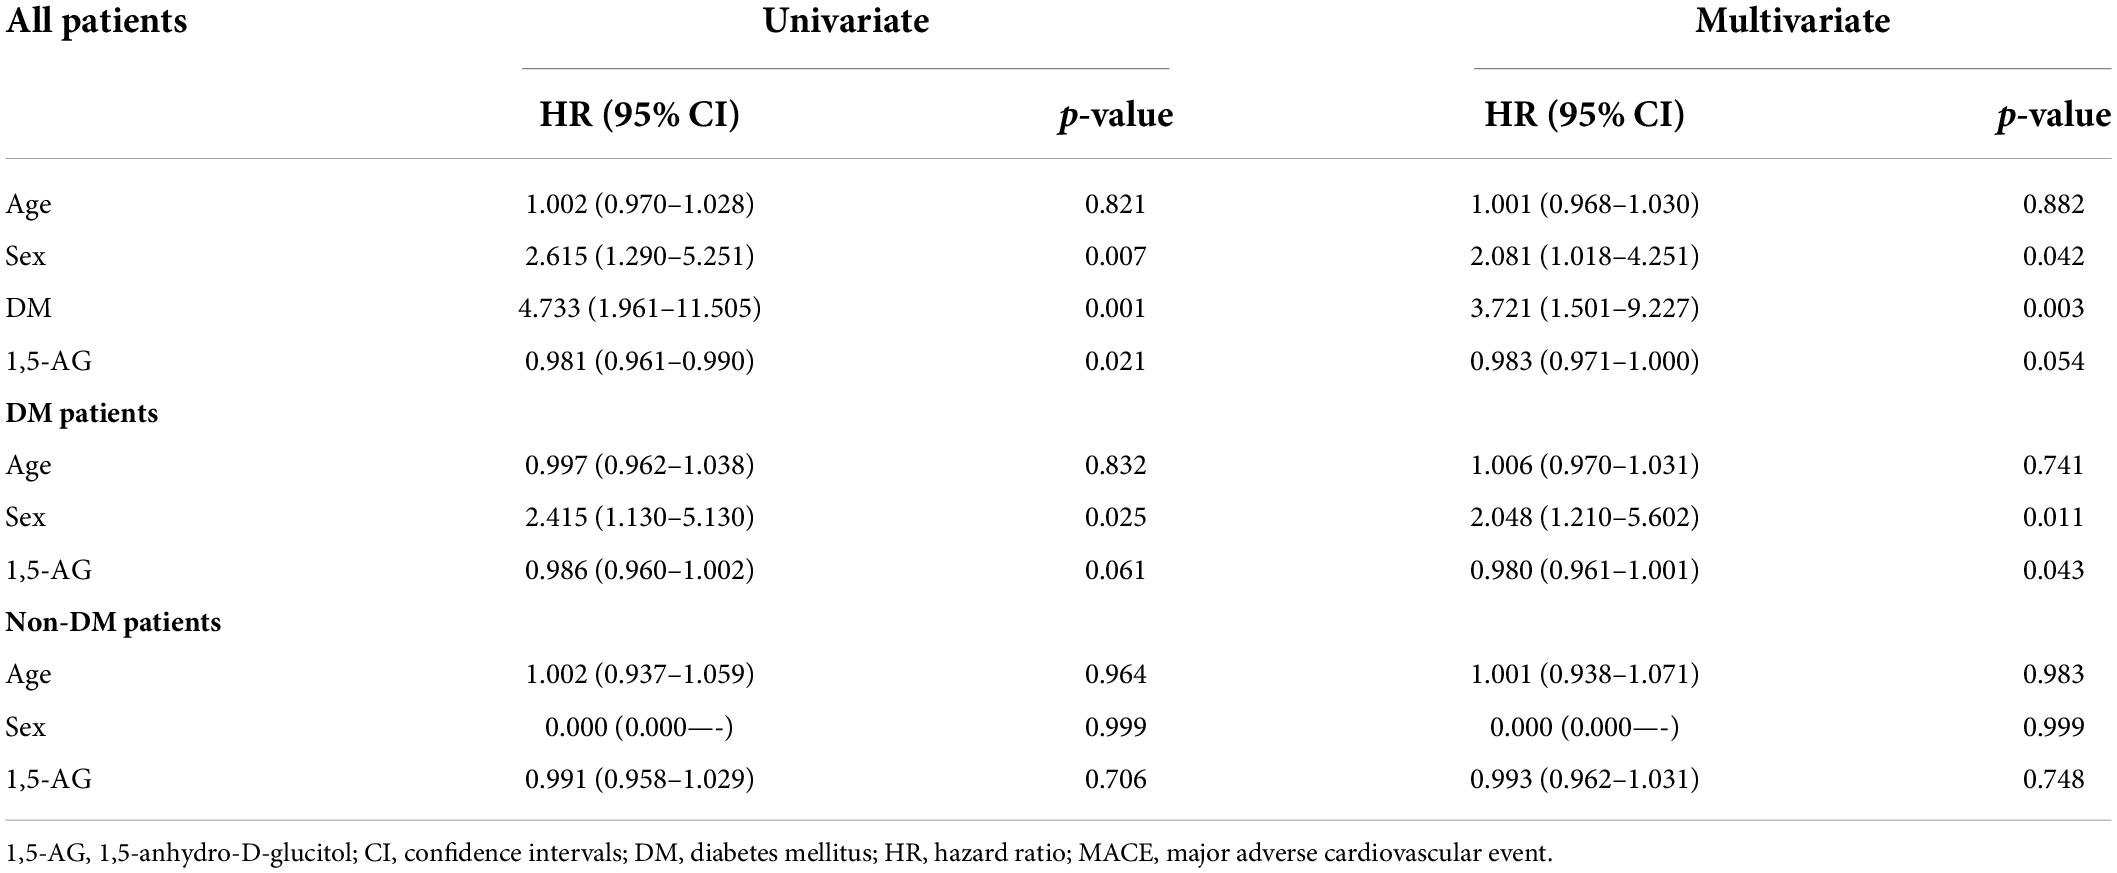
All patients were followed up completely for a mean period of 1.8 ± 0.8 years (median: 2.2 years, IQR: 1.0–2.5 years). During the follow-up period, 49 patients experienced MACE (19.1%), including 4 CV deaths (1.6%), 7 non-fatal MIs (2.7%), 30 TVRs (11.7%), and 8 Non-TVRs (3.1%) (Table 3). A significantly lower 1,5-AG level was found in patients who experienced MACE compared to those who did not (47.3 vs. 61.9 μg/mL, p = 0.006). The best cut-off value of serum 1,5-AG for discrimination between patients with and without MACE was 34.67 μg/mL (area under the curve = 0.636). In the multivariate Cox regression analysis, low serum 1,5-AG levels remained an independent predictor of MACE in DM patients (p = 0.043, Table 4), but not in non-DM patients (p = 0.748) after adjusting for age and sex.
Discussion
Our study demonstrated that low serum 1,5-AG is associated with an increased risk of CAC, as assessed by OCT, especially in patients with DM. Moreover, serum 1,5-AG levels may predict future MACE in patients with DM undergoing OCT-guided PCI. To the best of our knowledge, this study is the first to investigate the correlation between serum 1,5-AG and CAC in DM patients using OCT analysis.
Increasing evidence has shown that postprandial hyperglycemia and glucose fluctuations affect coronary atherosclerosis progression (23–25). 1,5-AG is a natural 1-deoxy form of glucose in the diet. Most 1,5-AG, filtered in the glomerulus, is reabsorbed in the renal tubules, which is competitively inhibited by glucose. Therefore, as serum glucose levels exceed the renal threshold for glucosuria, the resorption of 1,5-AG is suppressed, leading to a rapid reduction in serum 1,5-AG (26). Recent studies have suggested that serum 1,5-AG concentration may be a useful clinical marker of postprandial hyperglycemia and glycemic excursions (9, 27–29), and therefore a better glycemic biomarker than HbA1c in reflecting glycemic excursions (9). Growing in vitro and in vivo evidence has linked postprandial glucose (PPG) excursions to diabetic calcification, likely through the mechanisms of oxidative stress generation, inflammatory mediator activation, and endothelial dysfunction (30, 31). Therefore, we hypothesized that 1,5-AG may be associated with coronary calcification. Wada et al. demonstrated that low serum 1,5-AG levels were a significant predictor of a greater calcification angle assessed by IVUS (15). However, volumetric indices based on calcium length were not available in Wada’s IVUS study. Compared with IVUS, OCT can assess calcium length, thickness, area, and volumetric indices of calcium content (RCI) (22, 32–34). This is because, compared to IVUS, OCT has a higher resolution and can also penetrate calcified deposits (32). Moreover, OCT has exhibited even higher accuracy for diagnosing calcium with excellent sensitivity and specificity in a histological validation study (35). Taking advantage of the superiority of OCT in image analysis, our data showed that low serum 1,5-AG levels were associated with fibrocalcified lesions and strongly inversely correlated with the RCI, especially in DM patients.
CAC tended to be higher in diabetic patients (7), which was concomitant with the increase in total plaque volume (36, 37) and represented an independent risk factor for adverse cardiovascular events (3–6), even independent of diabetic status (7). In addition, the prevalence of TCFA seems to be higher in both culprit and non-culprit lesions among diabetic patients with or without ACS at presentation and may lead to a higher rate of MACE (38–43). Our study showed consistently a higher percentage of CAC and TCFA in DM group. However, the management of calcified vessels remains clinically challenging. Severe CAC may increase complication rates of interventional procedures, and patients with heavily calcified lesions have been shown to have a poor prognosis (4, 44). On the other hand, accumulating evidence has reported the prognostic value of 1,5-AG for long-term complications in patients with DM. Low serum 1,5-AG levels may identify patients at high cardiovascular risk for de novo CAD (45) and predict adverse cardiac and cerebrovascular events in patients with diabetes with or without PCI (11, 46, 47). During the follow-up period in the present study, serum 1,5-AG levels were associated with adverse clinical events, including all-cause death, CV death, and TVR. In addition to the recent report that 1,5-AG may be related to plaque rupture in diabetic patients with ACS (48), we hypothesized that the relationship between 1,5-AG and CAC in our study may be another important contributing factor supporting the hypothesis that low serum 1,5-AG levels could predict adverse outcomes. Interestingly, recent studies have reported that an intensive glucose-lowering intervention may increase serum 1,5-AG levels (49) and attenuate the progression of CAC in patients with DM (50). These findings have uncovered the possibility of early detection of CAC with serum 1,5-AG and may reflect a need for aggressive risk reduction in high-risk patients with low serum 1,5-AG levels. Further investigations regarding whether the regulation of serum 1,5-AG levels would lead to improved outcomes remain to be established.
Our study has several limitations. First, this was a single-center study with a limited sample size. Therefore, a selection bias and potential confounding factors may exist. Second, the cross-sectional nature of our study precludes cause-effect inferences on the links between 1,5-AG and atherosclerotic plaque characteristics. Third, this study was not a follow-up interventional study, and the relationship between 1,5-AG and plaque progression remains unclear. Fourth, whether the regulation of 1,5-AG would lead to improved outcomes remains to be established. A follow-up study with a larger sample size is required to determine the predictive value of 1,5-AG for plaque progression and to examine long-term outcomes after the regulation of 1,5-AG. Finally, we do not have any in vitro data that would help support the results of the present study.
In summary, this study revealed that low 1,5-AG levels were associated with an increased risk of CAC, as assessed by OCT, especially in DM patients. Moreover, serum 1,5-AG levels may predict future MACE in patients with DM undergoing OCT-guided PCI. These findings revealed that the measurement of serum 1,5-AG may be valuable not only in the early detection of coronary artery calcium, but also in reflecting aggressive risk reduction in high-risk patients with low 1,5-AG levels.
Data availability statement
The raw data supporting the conclusions of this article will be made available by the authors, without undue reservation.
Ethics statement
The studies involving human participants were reviewed and approved by the Institutional Review Board of the Taipei-Veterans General Hospital. The patients/participants provided their written informed consent to participate in this study.
Membership of the Taipei Veterans General Hospital Coronary Intervention Study Group (TaiVeCoron)
Chuan-Tsai Tsai; Wei-Chieh Huang; Shao-Sung Huang; Tse-Min Lu (Taipei Veterans General Hospital); Chung Yu Chen (National Yang Ming Chiao Tung University Hospital); Hsin-I Teng (Cheng Hsin General Hospital); Li-Wei Chen (New Taipei City Hospital, New Taipei City Government); Hsiang-Yao Chen (Taipei Hospital, Ministry of Health and Welfare); Yen-Fu Hsu (Kinmen Hospital, Ministry of Health and Welfare); and Ying-Ying Chen (MacKay Memorial Hospital).
Author contributions
H-IT and W-CH contributed to the conception of the study and the writing of the manuscript. H-YC, W-CH, C-TT, Y-YC, and C-HH contributed in acquiring and analyzing the data. H-IT and T-ML contributed in revising the manuscript. All authors approved the final manuscript.
Acknowledgments
We are grateful to the staff of the Division of Cardiology at the Taipei-Veterans General Hospital. We are also indebted to Ms. Pei-Chen Chiang for her excellent technical assistance.
Conflict of interest
The authors declare that the research was conducted in the absence of any commercial or financial relationships that could be construed as a potential conflict of interest.
Publisher’s note
All claims expressed in this article are solely those of the authors and do not necessarily represent those of their affiliated organizations, or those of the publisher, the editors and the reviewers. Any product that may be evaluated in this article, or claim that may be made by its manufacturer, is not guaranteed or endorsed by the publisher.
References
1. Otsuka F, Sakakura K, Yahagi K, Joner M, Virmani R. Has our understanding of calcification in human coronary atherosclerosis progressed? Arterioscler Thromb Vasc Biol. (2014) 34:724–36.
2. Rumberger JA, Simons DB, Fitzpatrick LA, Sheedy PF, Schwartz RS. Coronary artery calcium area by electron-beam computed tomography and coronary atherosclerotic plaque area. A histopathologic correlative study. Circulation. (1995) 92:2157–62.
3. Williams MC, Moss AJ, Dweck M, Adamson PD, Alam S, Hunter A, et al. Coronary artery plaque characteristics associated with adverse outcomes in the SCOT-HEART study. J Am Coll Cardiol. (2019) 73:291–301. doi: 10.1016/j.jacc.2018.10.066
4. Bourantas CV, Zhang YJ, Garg S, Iqbal J, Valgimigli M, Windecker S, et al. Prognostic implications of coronary calcification in patients with obstructive coronary artery disease treated by percutaneous coronary intervention: a patient-level pooled analysis of 7 contemporary stent trials. Heart. (2014) 100:1158–64. doi: 10.1136/heartjnl-2013-305180
5. Budoff MJ, Young R, Lopez VA, Kronmal RA, Nasir K, Blumenthal RS, et al. Progression of coronary calcium and incident coronary heart disease events: MESA (Multi-Ethnic Study of Atherosclerosis). J Am Coll Cardiol. (2013) 61:1231–9.
6. Budoff MJ, Shaw LJ, Liu ST, Weinstein SR, Mosler TP, Tseng PH, et al. Long-term prognosis associated with coronary calcification: observations from a registry of 25,253 patients. J Am Coll Cardiol. (2007) 49:1860–70. doi: 10.1016/j.jacc.2006.10.079
7. Raggi P, Shaw LJ, Berman DS, Callister TQ. Prognostic value of coronary artery calcium screening in subjects with and without diabetes. J Am Coll Cardiol. (2004) 43:1663–9.
8. Carson AP, Steffes MW, Carr JJ, Kim Y, Gross MD, Carnethon MR, et al. Hemoglobin A1c and the progression of coronary artery calcification among adults without diabetes. Diabetes Care. (2015) 38:66–71.
9. Dungan KM, Buse JB, Largay J, Kelly MM, Button EA, Kato S, et al. 1,5-anhydroglucitol and postprandial hyperglycemia as measured by continuous glucose monitoring system in moderately controlled patients with diabetes. Diabetes Care. (2006) 29:1214–9. doi: 10.2337/dc06-1910
10. Yamanouchi T, Moromizato H, Shinohara T, Minoda S, Miyashita H, Akaoka I. Estimation of plasma glucose fluctuation with a combination test of hemoglobin A1c and 1,5-anhydroglucitol. Metabolism. (1992) 41:862–7. doi: 10.1016/0026-0495(92)90168-a
11. Takahashi S, Shimada K, Miyauchi K, Miyazaki T, Sai E, Ogita M, et al. Low and exacerbated levels of 1,5-anhydroglucitol are associated with cardiovascular events in patients after first-time elective percutaneous coronary intervention. Cardiovasc Diabetol. (2016) 15:145. doi: 10.1186/s12933-016-0459-5
12. Ikeda N, Hara H, Hiroi Y. 1,5-anhydro-D-glucitol predicts coronary artery disease prevalence and complexity. J Cardiol. (2014) 64:297–301. doi: 10.1016/j.jjcc.2014.02.014
13. Baumgart D, Schmermund A, Goerge G, Haude M, Ge J, Adamzik M, et al. Comparison of electron beam computed tomography with intracoronary ultrasound and coronary angiography for detection of coronary atherosclerosis. J Am Coll Cardiol. (1997) 30:57–64.
14. Katayama Y, Kubo T, Akasaka T. [In vivo detection of coronary artery calcification by optical coherence tomography.]. Clin Calcium. (2019) 29:199–205.
15. Wada H, Dohi T, Miyauchi K, Takahashi N, Endo H, Kato Y, et al. Impact of serum 1,5-anhydro-D-glucitol level on the prediction of severe coronary artery calcification: an intravascular ultrasound study. Cardiovasc Diabetol. (2019) 18:69. doi: 10.1186/s12933-019-0878-1
16. Kawasaki M, Bouma BE, Bressner J, Houser SL, Nadkarni SK, MacNeill BD, et al. Diagnostic accuracy of optical coherence tomography and integrated backscatter intravascular ultrasound images for tissue characterization of human coronary plaques. J Am Coll Cardiol. (2006) 48:81–8.
17. Friedrich GJ, Moes NY, Muhlberger VA, Gabl C, Mikuz G, Hausmann D, et al. Detection of intralesional calcium by intracoronary ultrasound depends on the histologic pattern. Am Heart J. (1994) 128:435–41.
18. Kubo T, Tanaka A, Ino Y, Kitabata H, Shiono Y, Akasaka T. Assessment of coronary atherosclerosis using optical coherence tomography. J Atheroscler Thromb. (2014) 21:895–903.
19. Balis DA, Tong C, Meininger G. Effect of canagliflozin, a sodium-glucose cotransporter 2 inhibitor, on measurement of serum 1,5-anhydroglucitol. J Diabetes. (2014) 6:378–80. doi: 10.1111/1753-0407.12116
20. Fortuna D, McCloskey LJ, Stickle DF. Model analysis of effect of canagliflozin (Invokana), a sodium-glucose cotransporter 2 inhibitor, to alter plasma 1,5-anhydroglucitol. Clin Chim Acta. (2016) 452:138–41. doi: 10.1016/j.cca.2015.11.010
21. National Kidney F. K/DOQI clinical practice guidelines for chronic kidney disease: evaluation, classification, and stratification. Am J Kidney Dis. (2002) 39(2 Suppl. 1):S1–266.
22. Zhang BC, Karanasos A, Gnanadesigan M, van der Sijde JN, van Ditzhuijzen N, Witberg K, et al. Qualitative and quantitative evaluation of dynamic changes in non-culprit coronary atherosclerotic lesion morphology: a longitudinal OCT study. EuroIntervention. (2018) 13:e2190–200. doi: 10.4244/EIJ-D-17-00161
23. Watanabe M, Kawai Y, Kitayama M, Akao H, Motoyama A, Wakasa M, et al. Diurnal glycemic fluctuation is associated with severity of coronary artery disease in prediabetic patients: possible role of nitrotyrosine and glyceraldehyde-derived advanced glycation end products. J Cardiol. (2017) 69:625–31. doi: 10.1016/j.jjcc.2016.07.001
24. Li S, Tang X, Luo Y, Wu B, Huang Z, Li Z, et al. Impact of long-term glucose variability on coronary atherosclerosis progression in patients with type 2 diabetes: a 2.3 year follow-up study. Cardiovasc Diabetol. (2020) 19:146. doi: 10.1186/s12933-020-01126-0
25. Kataoka S, Gohbara M, Iwahashi N, Sakamaki K, Nakachi T, Akiyama E, et al. Glycemic variability on continuous glucose monitoring system predicts rapid progression of non-culprit lesions in patients with acute coronary syndrome. Circ J. (2015) 79:2246–54. doi: 10.1253/circj.CJ-15-0496
26. Akanuma Y, Morita M, Fukuzawa N, Yamanouchi T, Akanuma H. Urinary excretion of 1,5-anhydro-D-glucitol accompanying glucose excretion in diabetic patients. Diabetologia. (1988) 31:831–5. doi: 10.1007/BF00277486
27. Dworacka M, Winiarska H, Szymanska M, Kuczynski S, Szczawinska K, Wierusz-Wysocka B. 1,5-anhydro-D-glucitol: a novel marker of glucose excursions. Int J Clin Pract Suppl. (2002) 129:40–4.
28. Sun J, Dou JT, Wang XL, Yang GQ, Lu ZH, Zheng H, et al. Correlation between 1,5-anhydroglucitol and glycemic excursions in type 2 diabetic patients. Chin Med J (Engl). (2011) 124:3641–5.
29. Kim MJ, Jung HS, Hwang-Bo Y, Cho SW, Jang HC, Kim SY, et al. Evaluation of 1,5-anhydroglucitol as a marker for glycemic variability in patients with type 2 diabetes mellitus. Acta Diabetol. (2013) 50:505–10.
30. Yahagi K, Kolodgie FD, Lutter C, Mori H, Romero ME, Finn AV, et al. Pathology of human coronary and carotid artery atherosclerosis and vascular calcification in diabetes mellitus. Arterioscler Thromb Vasc Biol. (2017) 37:191–204.
31. Burgos-Moron E, Abad-Jimenez Z, Maranon AM, Iannantuoni F, Escribano-Lopez I, Lopez-Domenech S, et al. Relationship between oxidative stress, er stress, and inflammation in type 2 diabetes: the battle continues. J Clin Med. (2019) 8:1385. doi: 10.3390/jcm8091385
32. Mehanna E, Bezerra HG, Prabhu D, Brandt E, Chamie D, Yamamoto H, et al. Volumetric characterization of human coronary calcification by frequency-domain optical coherence tomography. Circ J. (2013) 77:2334–40. doi: 10.1253/circj.cj-12-1458
33. Krishnamoorthy P, Vengrenyuk Y, Ueda H, Yoshimura T, Pena J, Motoyama S, et al. Three-dimensional volumetric assessment of coronary artery calcification in patients with stable coronary artery disease by OCT. EuroIntervention. (2017) 13:312–9. doi: 10.4244/EIJ-D-16-00139
34. Fujino A, Mintz GS, Matsumura M, Lee T, Kim SY, Hoshino M, et al. A new optical coherence tomography-based calcium scoring system to predict stent underexpansion. EuroIntervention. (2018) 13:e2182–9. doi: 10.4244/EIJ-D-17-00962
35. Yabushita H, Bouma BE, Houser SL, Aretz HT, Jang IK, Schlendorf KH, et al. Characterization of human atherosclerosis by optical coherence tomography. Circulation. (2002) 106:1640–5.
36. Mori H, Torii S, Kutyna M, Sakamoto A, Finn AV, Virmani R. Coronary artery calcification and its progression: what does it really mean? JACC Cardiovasc Imaging. (2018) 11:127–42.
37. Sangiorgi G, Rumberger JA, Severson A, Edwards WD, Gregoire J, Fitzpatrick LA, et al. Arterial calcification and not lumen stenosis is highly correlated with atherosclerotic plaque burden in humans: a histologic study of 723 coronary artery segments using nondecalcifying methodology. J Am Coll Cardiol. (1998) 31:126–33.
38. Sheng Z, Zhou P, Liu C, Li J, Chen R, Zhou J, et al. Relationships of coronary culprit-plaque characteristics with duration of diabetes mellitus in acute myocardial infarction: an intravascular optical coherence tomography study. Cardiovasc Diabetol. (2019) 18:136. doi: 10.1186/s12933-019-0944-8
39. Kedhi E, Berta B, Roleder T, Hermanides RS, Fabris E, Ajj IJ, et al. Thin-cap fibroatheroma predicts clinical events in diabetic patients with normal fractional flow reserve: the COMBINE OCT-FFR trial. Eur Heart J. (2021) 42:4671–9. doi: 10.1093/eurheartj/ehab433
40. Kedhi E, Kennedy MW, Maehara A, Lansky AJ, McAndrew TC, Marso SP, et al. Impact of TCFA on unanticipated ischemic events in medically treated diabetes mellitus: insights from the PROSPECT study. JACC Cardiovasc Imaging. (2017) 10:451–8. doi: 10.1016/j.jcmg.2015.12.023
41. Kato K, Yonetsu T, Kim SJ, Xing L, Lee H, McNulty I, et al. Comparison of nonculprit coronary plaque characteristics between patients with and without diabetes: a 3-vessel optical coherence tomography study. JACC Cardiovasc Interv. (2012) 5:1150–8. doi: 10.1016/j.jcin.2012.06.019
42. Nasu K, Tsuchikane E, Katoh O, Fujita H, Surmely JF, Ehara M, et al. Plaque characterisation by virtual histology intravascular ultrasound analysis in patients with type 2 diabetes. Heart. (2008) 94:429–33. doi: 10.1136/hrt.2007.118950
43. Ueyama H, Yasumura K, Okamoto N, Vengrenyuk Y, Barman N, Benhuri B, et al. Relationship between hemoglobin A1C and characteristics of plaque vulnerability in stable coronary disease: an optical coherence tomography study. Int J Cardiovasc Imaging. (2022) 38:473–82.
44. Bourantas CV, Zhang YJ, Garg S, Mack M, Dawkins KD, Kappetein AP, et al. Prognostic implications of severe coronary calcification in patients undergoing coronary artery bypass surgery: an analysis of the SYNTAX study. Catheter Cardiovasc Interv. (2015) 85:199–206. doi: 10.1002/ccd.25545
45. Fujiwara T, Yoshida M, Yamada H, Tsukui T, Nakamura T, Sakakura K, et al. Lower 1,5-anhydroglucitol is associated with denovo coronary artery disease in patients at high cardiovascular risk. Heart Vessels. (2015) 30:469–76. doi: 10.1007/s00380-014-0502-y
46. Ouchi S, Shimada K, Miyazaki T, Takahashi S, Sugita Y, Shimizu M, et al. Low 1,5-anhydroglucitol levels are associated with long-term cardiac mortality in acute coronary syndrome patients with hemoglobin A1c levels less than 7.0. Cardiovasc Diabetol. (2017) 16:151. doi: 10.1186/s12933-017-0636-1
47. Selvin E, Rawlings A, Lutsey P, Maruthur N, Pankow JS, Steffes M, et al. Association of 1,5-anhydroglucitol with cardiovascular disease and mortality. Diabetes. (2016) 65:201–8.
48. Su G, Gao MX, Shi GL, Dai XX, Yao WF, Zhang T, et al. Effect of 1,5-anhydroglucitol levels on culprit plaque rupture in diabetic patients with acute coronary syndrome. Cardiovasc Diabetol. (2020) 19:71. doi: 10.1186/s12933-020-01045-0
49. Selvin E, Wang D, McEvoy JW, Juraschek SP, Lazo M, Hamet P, et al. Response of 1,5-anhydroglucitol level to intensive glucose- and blood-pressure lowering interventions, and its associations with clinical outcomes in the ADVANCE trial. Diabetes Obes Metab. (2019) 21:2017–23. doi: 10.1111/dom.13755
Keywords: 1, 5-anhydro-D-glucitol, coronary artery calcification, optical coherence tomography, diabetes mellitus, 1,5-AG
Citation: Teng H-I, Chen H-Y, Tsai C-T, Huang W-C, Chen Y-Y, Hsueh C-H, Hau WK and Lu T-M (2022) The clinical impact of serum 1,5-anhydro-D-glucitol levels on coronary artery calcification and adverse outcomes assessed by coronary optical coherence tomography in diabetic patients. Front. Cardiovasc. Med. 9:997649. doi: 10.3389/fcvm.2022.997649
Received: 19 July 2022; Accepted: 09 August 2022;
Published: 30 August 2022.
Edited by:
István Ferenc Édes, Semmelweis University, HungaryReviewed by:
Attila Thury, University of Szeged, HungaryKosei Terada, Wakayama Medical University, Japan
Copyright © 2022 Teng, Chen, Tsai, Huang, Chen, Hsueh, Hau and Lu. This is an open-access article distributed under the terms of the Creative Commons Attribution License (CC BY). The use, distribution or reproduction in other forums is permitted, provided the original author(s) and the copyright owner(s) are credited and that the original publication in this journal is cited, in accordance with accepted academic practice. No use, distribution or reproduction is permitted which does not comply with these terms.
*Correspondence: Tse-Min Lu,, dG1sdUBraW1vLmNvbQ==
 Hsin-I Teng
 Hsiang-Yao Chen
 Chuan-Tsai Tsai
 Wei-Chieh Huang
 Ying-Ying Chen
 Chien-Hung Hsueh
 William K. Hau
 Tse-Min Lu