
95% of researchers rate our articles as excellent or good
Learn more about the work of our research integrity team to safeguard the quality of each article we publish.
Find out more
ORIGINAL RESEARCH article
Front. Cardiovasc. Med. , 23 September 2022
Sec. Heart Failure and Transplantation
Volume 9 - 2022 | https://doi.org/10.3389/fcvm.2022.980625
This article is part of the Research Topic Machine Learning and Data Science in Heart Failure and Stroke View all 11 articles
 Timothy Burton1Shyam Ramchandani1Sanjeev P. Bhavnani2Rola Khedraki2Travis J. Cohoon2Thomas D. Stuckey3John A. Steuter4Frederick J. Meine5Brett A. Bennett6William S. Carroll7Emmanuel Lange1Farhad Fathieh1Ali Khosousi1
 Mark Rabbat8
 William E. Sanders9,10*
Introduction: Elevated left ventricular end diastolic pressure (LVEDP) is a consequence of compromised left ventricular compliance and an important measure of myocardial dysfunction. An algorithm was developed to predict elevated LVEDP utilizing electro-mechanical (EM) waveform features. We examined the hierarchical clustering of selected features developed from these EM waveforms in order to identify important patient subgroups and assess their possible prognostic significance.
Materials and methods: Patients presenting with cardiovascular symptoms (N = 396) underwent EM data collection and direct LVEDP measurement by left heart catheterization. LVEDP was classified as non-elevated ( ≤ 12 mmHg) or elevated (≥25 mmHg). The 30 most contributive features to the algorithm output were extracted from EM data and input to an unsupervised hierarchical clustering algorithm. The resultant dendrogram was divided into five clusters, and patient metadata overlaid.
Results: The cluster with highest LVEDP (cluster 1) was most dissimilar from the lowest LVEDP cluster (cluster 5) in both clustering and with respect to clinical characteristics. In contrast to the cluster demonstrating the highest percentage of elevated LVEDP patients, the lowest was predominantly non-elevated LVEDP, younger, lower BMI, and males with a higher rate of significant coronary artery disease (CAD). The next adjacent cluster (cluster 2) to that of the highest LVEDP (cluster 1) had the second lowest LVEDP of all clusters. Cluster 2 differed from Cluster 1 primarily based on features extracted from the electrical data, and those that quantified predictability and variability of the signal. There was a low predictability and high variability in the highest LVEDP cluster 1, and the opposite in adjacent cluster 2.
Conclusion: This analysis identified subgroups of patients with varying degrees of LVEDP elevation based on waveform features. An approach to stratify movement between clusters and possible progression of myocardial dysfunction may include changes in features that differentiate clusters; specifically, reductions in electrical signal predictability and increases in variability. Identification of phenotypes of myocardial dysfunction evidenced by elevated LVEDP and knowledge of factors promoting transition to clusters with higher levels of left ventricular filling pressures could permit early risk stratification and improve patient selection for novel therapeutic interventions.
An elevated left ventricular end diastolic pressure (LVEDP), indicative of increased left-sided filling pressures of the heart, represents a critical and sensitive measurement used to aid in the identification of impending as well as decompensated heart failure (HF) (1–3). Cardiac performance, with regard to ventricular contractility, is one critical determinant of elevated LVEDP; however, ejection fraction (EF) alone rarely elucidates the accurate clinical status of a heart failure patient (4). Patients with diminished ventricular function are the cohort most frequently encountered with elevated LVEDP, but an increased filling pressure may be the manifestation of multiple myocardial disease states including cardiomyopathies of ischemic, constrictive, restrictive, or valvular origin (5). Thus, higher filling pressures typically precede clinical deterioration in heart failure with reduced ejection fraction (HFrEF) as well as heart failure with preserved ejection fractions (HFpEF) (6). An elevated LVEDP does not indicate a specific diagnosis but provides important information that serves as a guide regarding the need for further evaluations or testing and affords data necessary for the development of an appropriate patient care plan. In addition, elevated LVEDP is predictive of morbidity and mortality (7–11).
Awareness of possible impending or new onset heart failure (HF) as indicated by an elevation in LVEDP may aid in diagnosis and risk stratification of the patient and help inform optimal clinical care pathways. The available therapeutic modalities for HF have doubled in the last decade and new pharmacologic agents for the treatment of hypertrophic cardiomyopathy (HCM) and infiltrative diseases, such as amyloid, conditions associated with elevated LVEDP, are rapidly emerging (12, 13). However, there exists limited information regarding the risks of transition from early asymptomatic or mildly symptomatic stages (Stages A to B) to later overtly symptomatic stages (Stages C-D), thus complicating initiation of drug interventions at the times when such therapies might prove most beneficial (14).
Risk stratification in heart failure remains a significant challenge despite the development of multiple scoring models, many of which are designed to predict survival with a few attempting to predict future morbidity (15–19). These scoring models were primarily derived from highly selected cohorts of patients, with an established diagnosis of heart failure, recruited for randomized clinical trials occurring over the last several decades (20). Most have required input data that includes echocardiographic determination of EF, multiple blood analyses (recently biomarkers), and a significant number of clinical parameters (15–21). Predicting outcomes in those with known moderate to severe disease allows modification and testing of current therapies but provides little information that might permit interventions at early stages of heart failure to prevent progression. Machine learning affords the opportunity with a single rapid test to detected features of similarities between groups with early stage LVEDP elevation and those not yet manifesting hemodynamic changes (22). ML clustering techniques that identify such features facilitate the development and future validation of new risk models.
The clinical diagnosis of HF encompasses a broad and heterogeneous population of patients with complex pathophysiology, various etiologic mechanisms, and diverse genetic triggers. Unsupervised clustering analysis has permitted phenotyping in cardiomyopathies identifying subgroups which may have similar mechanisms and outcomes (23, 24). Clustering is a useful approach to detect patterns in variables that aid in decrypting the heterogeneity present in datasets (24, 25). To date, the evaluation of cardiomyopathies based on clustering has focused on patient with diagnosed HF and those recently or in the past hospitalized for the HF, clearly in later stages of the disease (23, 24). In this trial, we recruited a cohort with new onset symptoms and no previously known HF. The goal was to detect changes in the features that differentiate between clusters, which might indicate the risk of transition from one cluster to an adjacent cluster with a higher prevalence of elevated LVEDP. Identification of distinct subtypes of myocardial dysfunction evidenced by elevated LVEDP and knowledge of factors that promote transition to clusters with higher levels of left ventricular filling pressures could permit early risk stratification and improve patient selection for novel therapeutic interventions, thus facilitating precision medicine.
An algorithm was previously developed to predict LVEDP elevation status based on manually engineered features calculated from CorVista Capture signals (22). The signal acquisition modality was previously described (26), but briefly, is the simultaneous acquisition of orthogonal voltage gradient (OVG) data via electrodes placed on the torso, and photoplethysmogram using transmission of red and infrared light via a clip placed on the finger. The acquisition configuration is shown in Figure 1. The OVG signal is related to the electrocardiogram (ECG) signal in that both measure the voltage changes within the myocardium that occur during the cardiac cycle, but OVG differs from ECG in its three-dimensional perspective of the heart, as well as its high frequency bandwidth (Figure 2).
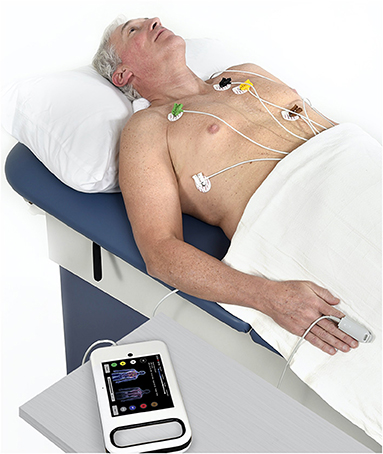
Figure 1. Signal acquisition using the CorVista Capture, with the electrodes placed on the torso (electrode on the back not visible), and the PPG clip placed on the finger.
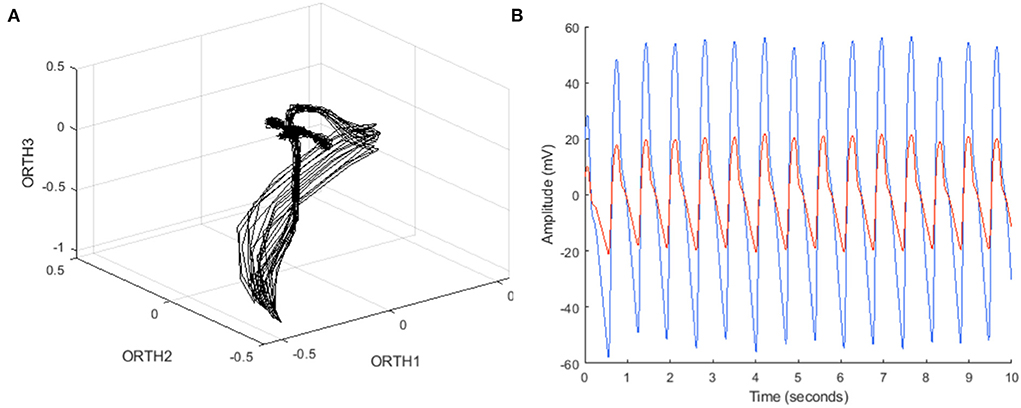
Figure 2. (A) Example OVG data in phase space, with coordinates from each bipolar channel (ORTH1, ORTH2, ORTH3) represented as a three-dimensional coordinate in that space, and (B) example PPG data in the time domain, containing both red and infrared time series.
The contribution of these features to the LVEDP algorithm were assessed using a permutation analysis, enabling the ranking of the features from most to least contributive. The permutation analysis was a generalization of the methodology first proposed by Breiman for use in Random Forests (27). The top 30 most contributive features were selected for use in this clustering exploration.
The clinical population analyzed in the present work were subjects with symptoms suggestive of cardiovascular disease who were referred to cardiac catheterization for the assessment of coronary artery disease using angiography. Specifically, the cohort was patients in whom the treating physician chose to measure the LVEDP during the catheterization. LVEDP measurement was performed using standard catheterization laboratory procedures. Subjects with mid-range LVEDPs were removed, preserving subjects with definitive LVEDP non-elevation of ≤ 12 mmHg and subjects with definitive LVEDP elevation of ≥25 mmHg. The subjects were enrolled within the CADLAD and IDENTIFY (Group 2) studies, the records for which are available on clinicaltrials.gov (NCT02784197 and NCT03864081, respectively). Both studies have identical inclusion and exclusion criteria and are multi-center in nature. CADLAD is closed, and IDENTIFY enrollment is ongoing. Finally, subjects without a signal passing a series of automated signal quality assessment tests (11%) were excluded. Signal quality assessment was previously described (26), but included quantification of powerline interference and excessive high-frequency content in the OVG signal, and the presence of jumps, dropouts, and railing in the PPG signal.
The features were pre-processed prior to clustering by applying the box-cox transformation to each feature individually, which is a monotonic power transform intended to approximate a normal distribution across the data (28). While deviations from normality occur frequently in realistic data, many statistical approaches rely on an assumption of normality, and therefore benefit from distribution transformations such as box-cox. For instance, nearest neighbor classification has been shown to improve considerably when the features are pre-processed using box-cox, as compared to classification using the raw feature values (29). While the intent of the present work is not nearest neighbor classification (or classification by any methodology), clustering similarly necessitates pairwise distance measurements across the dataset, and can therefore realize a similar benefit from box-cox. After box-cox transformation, the features were normalized using the z-score transformation to set the mean and standard deviation of each feature to zero and one, respectively.
Next, hierarchical clustering was applied to the processed data. While there exist a variety of clustering algorithms, hierarchical clustering was chosen to facilitate visual discovery of the appropriate numbers of clusters from the clustering result, rather than requiring pre-specification of the number of clusters, or quantitative evaluation of the optimal number of clusters. Hierarchical cluster is agglomerative, meaning that initially each subject is initially its own cluster, then clusters are merged in an agglomerative manner, until the end state is reached where all the subjects belong to the same cluster. Therefore, a cluster merger strategy, also known as linkage, must be selected. Possibilities include “single” (smallest pairwise distance between the subjects in one cluster and the subjects in another), “complete” (the largest pairwise difference between the subjects in one cluster and the subjects in another), and “average” (the average pairwise difference between the subjects in one cluster and the subjects in another). Note that the linkages are equivalent when considering clusters containing only one subject. Given that average considers all subjects in both clusters, it was chosen for the present work. However, as described for all linkage methods, average linkage requires the definition of a distance metric between subjects, which are represented herein by the values of 30 features. A distance metric increases in magnitude as subjects become more dissimilar, and must meet specific mathematical criteria to quality as a proper metric (30). Correlation distance (more precisely, 1-Pearson correlation) was shown to generally perform well across a variety of datasets and clustering algorithms, and so was chosen herein (31).
The output of hierarchical clustering is a dendrogram, which is a visual representation of subjects beginning in their own clusters, and iterative merging of clusters until all the subjects belong to a single cluster. The dendrogram was inspected, and an appropriate number of clusters chosen based on both the structure of the dendrogram and the appropriate amount of data in each cluster.
A total of 396 subjects were included in the clustering, composed of 92 (23%) subjects with LVEDP≥25 mmHg and 304 (77%) subjects with LVEDP ≤ 12 mmHg. Of the top 30 features from the LVEDP algorithm included in the clustering, 22 were derived from the OVG signal and had an average rank in the contribution of 17, and eight were derived from the PPG signal with an average rank of 10.
Figure 3 shows the dendrogram, with five clusters (labeled 1–5) chosen to segment the dataset, which for simplicity and recognition are colored (Purple=cluster 1, Green=cluster 2, Red=cluster 3, Yellow=cluster 4, Blue=cluster 5). In Figure 3A, the dendrogram is associated to a heatmap visualizing the magnitude of the feature values for each subject, with vertical lines delineating the boundary between adjacent clusters, and subjects aligning between the dendrogram and the heatmap. Banding in the heatmap that differs between clusters is a visual manifestation of the feature values differing across clusters. In Figure 3B, the dendrogram is associated to the pairwise distance matrix across the dataset, with the bold boxes along the diagonal defining each cluster, and the dotted lines delineating between adjacent clusters. Similar to Figure 3A, the subjects are aligned between the dendrogram and the distance matrix. As expected, the pairwise distances within clusters (i.e., within bolded boxes, occurring along the diagonal of the distance matrix) are low, showing that the distance between subjects within the same cluster is generally low. Therefore, subjects are cohesive within the clusters. The off-diagonal boxes defined by dashed lines in the distance matrix represent the distances between subjects not belonging to the same cluster, and as expected, exhibit larger distances on average than subjects belonging to the same cluster. Further, the distance between the cluster 1 (Purple) and cluster 2 (Green) is relatively low, as is supported by the dendrogram, which indicates that the next level of linkage would join these two clusters. Similarly, large distances in the heatmap are concentrated in the region comparing cluster 2 (Green) to cluster 3 (Red), which would not be joined together until the top linkage level, where all subjects are joined in a single cluster.
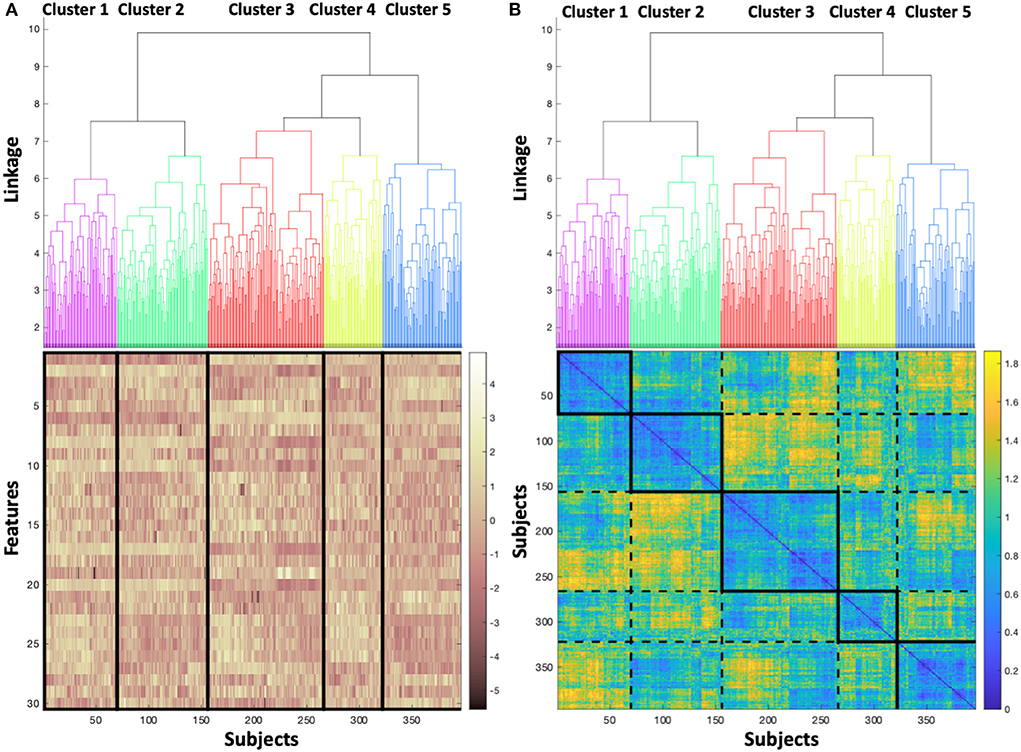
Figure 3. (A) Dendrogram colored to identify each cluster, associated to a heatmap visualizing the magnitude of the feature values for each subject, and (B) colored dendrogram associated with the pairwise distance matrix across the dataset, with bold boxes defining each cluster, and dotted lines delineating between adjacent clusters.
After the clustering was complete, clinical metadata was overlaid on the resultant clusters, as shown in Table 1. The overlaid clinical metadata can then be considered in conjunction with the observations from the feature clustering, as shown in Figure 3.
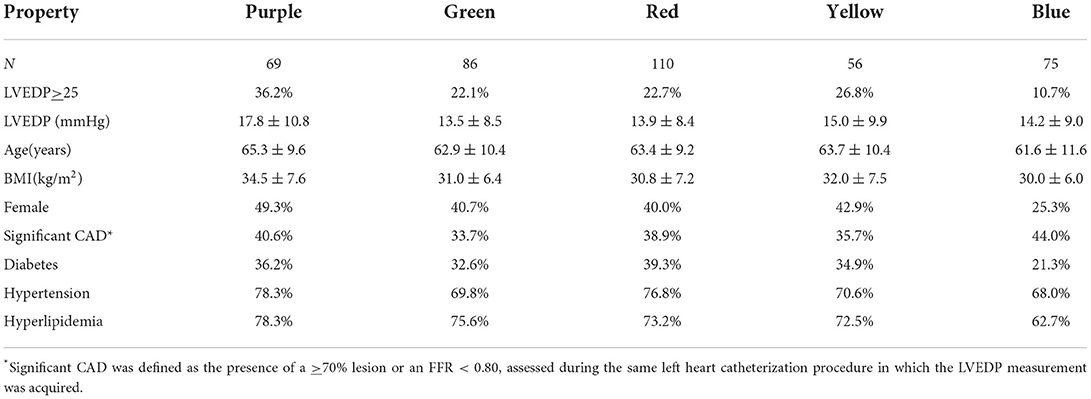
Table 1. Clusters demographics and measured parameters.
Cluster 1, with the highest LVEDP of all clusters, is the most dissimilar from the cluster 5 in both the clustering and with respect to the clinical properties of the subjects in each cluster. In contrast to cluster 1, cluster 5 is predominantly non-elevated LVEDP, younger, lower BMI, male and has a higher rate of significant coronary artery disease. The most substantial feature differences between cluster 1 and cluster 5 are those calculated from the PPG signal. Given the gender and age differences between these clusters, a plausible explanation of the PPG differentiation may be the vasculature changes that occur in post-menopausal women.
Cluster 1 is closest in the clustering to cluster 2 (i.e., the next cluster that would be joined to cluster 1 in the dendrogram is cluster 2), with the second lowest LVEDP of all clusters. To explore the mechanism underlying the difference between these clusters, the feature values were normalized across the full dataset using z-score (i.e., mean set to zero, and standard deviation set to one), and the normalized values mapped on to the clusters. The feature values were averaged within cluster 1 and cluster 2, then the averages differenced across these two clusters. The largest differences between cluster 1 and cluster 2 were found in features extracted from the electrical data, and specifically those that quantify predictability and variability of the signal. There is low ability to predict the signal (occurring as high feature values) and high signal variability (occurring as high feature values) in the cluster 1, and the opposite in the cluster 2 (occurring with low feature values). The predictability functions by fitting a model to a portion of the OVG data and evaluating the performance of that model on the remaining data. Should the ability of the model to predict on the withheld data be poor, then the resultant error between the signal and the model will be high, resulting in a high feature value. The variability feature derives a representative cardiac cycle for the subject based on the acquired data and compares that representative cardiac cycle to each acquired cycle to calculate the disparity – should it be high, then the representative cycle cannot sufficiently capture the variability in the signal, which is then represented as a high feature value.
The relationship between these features and clusters is shown in Figure 4, which visualizes the feature values for clusters 1 and 2, with the mean of each feature for each cluster marked with dashed lines. The mean predictability feature was −0.74 and 0.80, for cluster 2 and cluster 1, respectively. The mean variability feature was −0.58 and 0.64, for cluster 2 and cluster 1 respectively.
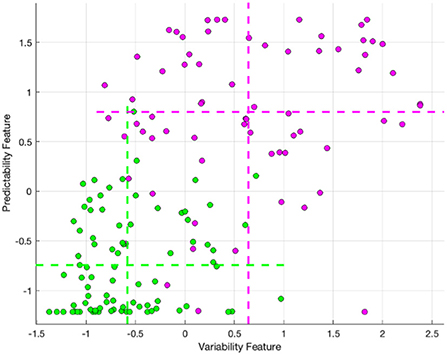
Figure 4. The variability and lack of predictability feature values for cluster 2 (Green) and cluster 1 (Purple), with the mean of each feature for each cluster marked with dashed lines.
Machine-learned algorithms now permeate many facets of medical practice and the magnitude of these techniques' utility and their diverse applications are rapidly being adapted to challenges in cardiology (32, 33). Cluster analysis of datasets identifies patterns and trends by using the relationships between variables to uncover hidden structure (34). In the past, the heterogeneous nature of HF populations and the complexity of the pathophysiologic mechanisms operative in specific HF disease states have made identification of similar phenotypes difficult. The utilization of clustering analysis allows detection of small unique phenogroups by examining the similarities and differences among quantitative variables (34). This type of unsupervised ML has be applied to populations of HF including HFpEF (23, 35), HFrEF (36), and acute HF (37). These studies have elucidated phenotype clusters and demonstrated subsequent clinical outcomes of patients previously diagnosed with HF as well as those acutely admitted with that diagnosis. This approach is useful for risk stratification and prognostic prediction in later stages of the disease but does little for targeting early transition into pathophysiologic states at risk for progression to significant disease or to facilitate precision interventions at times when remodeling might be prevented.
In our trial, we identify novel phenotypes with varying prevalences of elevated LVEDP within a population presenting with new onset cardiovascular symptoms. Elevated LVEDP has served as a direct measurement of myocardial dysfunction as well as a marker indicative of pathophysiologic changes ultimately resulting in the remodeling observed in later stages of HF (38). The goal of this investigation was to analyze the phenotypes and determine if features within the clusters varied in a fashion that could be followed to predict transition to adjacent clusters with increased risk of LVEDP elevation.
This trial demonstrates five clusters resulting from the analysis of 396 subjects (Figure 3), composed of 92 (23%) subjects with LVEDP≥25 mmHg and 304 (77%) subjects with LVEDP ≤ 12 mmHg. The heatmap of the magnitude of feature values (Figure 3A) illustrates the similarity of cluster 1 and cluster 2 (purple and green) phenogroups with regard to each of the 30 features. The degree of similarity can be appreciated visually, with the density of yellow and brown being closest between cluster 1 and 2 (purple and green). When moving from cluster 1 (shown in column 1) to cluster 5 (column 5), the coloration representing feature values becomes progressively more discrepant to cluster 1.
Correspondingly, the pairwise distance matrix (Figure 3B) showing the distance between pairs of subjects yields a diagonal line that elucidates the basis behind the formation of each cluster. Each solid box on the diagonal line starting with cluster 1 (top left, column 1) and progressing down the diagonal to bottom right to arrive at cluster 5, indicates very similar distancing between points in each cluster (high intensity of blue coloring). The dotted rectangle boxes permit comparison between the clusters with reference to the distance between subjects. In addition, this provides confirmation of the appropriateness and accuracy of the resultant clusters.
Cluster 1 and the adjacent cluster 2 demonstrate the closest feature values, but interestingly, have the widest divergence of prevalence of elevated LVEDP. Their proximity suggests that modest changes in feature values could result in transition of a subject in cluster 2 to cluster 1, and consequently may result in increased risk of elevation in LVEDP.
Of the top 30 features from the LVEDP algorithm included in the clustering, 22 were derived from the OVG signal, and eight were derived from the PPG signal. We found that features quantifying predictability and variability exhibited the most substantial differences between the cluster with the highest rate of LVEDP elevation (cluster 1) and the adjacent cluster 2, which presented with the second lowest rate of LVEDP elevation across the clusters. This feature difference suggests that it may be possible to follow subjects initially belonging to the cluster 2 phenotype to determine whether the signal properties shift over time to increased variability and decreased predictability, indicating that they may be transitioning to the adjacent cluster 1, with the associated higher prevalence, and therefore risk of, LVEDP elevation. Validation of the described phenotypes can be achieved through clinical follow-up to detect outcomes. In addition, opportunities exist to further characterize the phenotypes by inclusion of supplementary clinical data, including biomarkers such as BNP.
An approach to stratify the likelihood of movement between clusters and the possible progression of myocardial dysfunction for an individual patient could include changes in the features that differentiate these clusters; specifically, reductions in electrical signal predictability and increases in variability. Identification of distinct subtypes of myocardial dysfunction evidenced by elevated LVEDP and knowledge of factors that promote transition to clusters with higher levels of left ventricular filling pressures may permit early risk stratification and improve patient selection for novel therapeutic interventions thereby facilitating precision medicine.
The datasets presented in this article are not readily available because signals obtained by proprietary device, not yet FDA approved. Requests to access the datasets should be directed to d3NhbmRlcnNAY29ydmlzdGEuY29t.
The studies involving human participants were reviewed and approved by the Western Institutional Review Board, Inc. The patients provided their written informed consent to participate in this study. Written informed consent was obtained from the individual for the publication of any potentially identifiable images or data included in this article.
Concept and design: SB, WS, TB, RK, and SR. Drafting of the manuscript: WS, TB, SB, MR, FF, AK, and EL. Statistical analysis: HG, EL, TB, AK, and FF. Literature search: WS, TB, FF, AK, SR, and MR. Obtained funding and final approval of the version to be published: WS. Administrative, technical, and material support: WS and TB. Supervision: WS. Acquisition, analysis, interpretation of data, and critical revision of the manuscript for important intellectual content: All authors. All authors contributed to the article and approved the submitted version.
This study was supported by CorVista Health.
The authors would like to thank the contributing clinical centers and their research teams, as well as Horace R. Gillins and Charles Bridges MD ScD for their support, leadership, and insight.
CorVista Health funded the collection of subject data. Authors WS, HG, TB, FF, AK, EL, and SR are employees of CorVista Health. MR is a member of the Medical Advisory Board for CorVista Health.
The remaining authors declare that the research was conducted in the absence of any commercial or financial relationships that could be construed as a potential conflict of interest.
All claims expressed in this article are solely those of the authors and do not necessarily represent those of their affiliated organizations, or those of the publisher, the editors and the reviewers. Any product that may be evaluated in this article, or claim that may be made by its manufacturer, is not guaranteed or endorsed by the publisher.
The Supplementary Material for this article can be found online at: https://www.frontiersin.org/articles/10.3389/fcvm.2022.980625/full#supplementary-material
1. Reddy YN V, El-Sabbagh A, Nishimura RA. Comparing pulmonary arterial wedge pressure and left ventricular end diastolic pressure for assessment of left-sided filling pressures. JAMA Cardiol. (2018) 3:453–4. doi: 10.1001/jamacardio.2018.0318
2. Kern MJ, Christopher T. Hemodynamic rounds series II: the LVEDP. Cathet Cardiovasc Diagn. (1998) 44:70–4. - doi: 10.1002/(SICI)1097-0304(199805)44:1%3C70::AID-CCD17%3E3.0.CO;2-T
3. Bouchard JR, Gault HJ, Ross J. Evaluation of pulmonary arterial end-diastolic pressure as an estimate of left ventricular end-diastolic pressure in patients with normal and abnormal left ventricular performance. Circulation. (1971) 44:1072–9 doi: 10.1161/01.CIR.44.6.1072
4. Iskandrian AS, Segal BL, Hamid HAKKI A. Left ventricular end-diastolic pressure in evaluating left ventricular function. Clin Cardiol. (1981) 4:28–33. doi: 10.1002/clc.4960040107
5. Paulus WJ, Tschöpe C, Sanderson JE, Rusconi C, Flachskampf FA, Rademakers FE, et al. How to diagnose diastolic heart failure: a consensus statement on the diagnosis of heart failure with normal left ventricular ejection fraction by the Heart Failure and Echocardiography Associations of the European Society of Cardiology. Eur Heart J. (2007) 28:2539–50. doi: 10.1093/eurheartj/ehm037
6. Pahlevan NM, Matthews R V. Cardiac triangle mapping: a new systems approach for noninvasive evaluation of left ventricular end diastolic pressure. Fluids. (2019) 4:16. doi: 10.3390/fluids4010016
7. Uriel N, Sayer G, Annamalai S, Kapur NK, Burkhoff D. Mechanical unloading in heart failure. J Am Coll Cardiol. (2018) 72:569–80. doi: 10.1016/j.jacc.2018.05.038
8. Basir MB, Schreiber TL, Grines CL, Dixon SR, Moses JW, Maini BS, et al. Effect of early initiation of mechanical circulatory support on survival in cardiogenic shock. Am J Cardiol. (2017) 119:845–51. doi: 10.1016/j.amjcard.2016.11.037
9. Salem R, Denault AY, Couture P, Bélisle S, Fortier A, Guertin MC, et al. Left ventricular end-diastolic pressure is a predictor of mortality in cardiac surgery independently of left ventricular ejection fraction. Br J Anaesth. (2006) 97:292–7. doi: 10.1093/bja/ael140
10. Mielniczuk LM, Lamas GA, Flaker GC, Mitchell G, Smith SC, Gersh BJ, et al. Left ventricular end-diastolic pressure and risk of subsequent heart failure in patients following an acute myocardial infarction. Congest Hear Fail. (2007) 13:209–14. doi: 10.1111/j.1527-5299.2007.06624.x
11. Brienesse SC, Davies AJ, Khan A, Boyle AJ. Prognostic value of LVEDP in acute myocardial infarction: a systematic review and meta-analysis. J Cardiovasc Transl Res. (2018) 11:33–5. doi: 10.1007/s12265-017-9776-7
12. Masri A, Olivotto I. Cardiac myosin inhibitors as a novel treatment option for obstructive hypertrophic cardiomyopathy: addressing the core of the matter. J Am Heart Assoc. (2022) 11:e024656. doi: 10.1161/JAHA.121.024656
13. Kittleson MM, Maurer MS, Ambardekar AV, Bullock-Palmer RP, Chang PP, Eisen HJ, et al. American Heart Association Heart Failure and Transplantation Committee of the Council on Clinical Cardiology. Cardiac amyloidosis: evolving diagnosis and management: a scientific statement from the American Heart Association. Circulation. (2020) 142:e7–22. doi: 10.1161/CIR.0000000000000792
14. Hershberger RE, Zareba KM. Dilated cardiomyopathy: new distinct phenotypes or temporal phases of disease? J Am Coll Cardiol. (2022) 79:2233–5. doi: 10.1016/j.jacc.2022.04.008
15. Aaronson KD, Schwartz JS, Chen T-M, Wong K-L, Goin JE, Mancini DM. Development and prospective validation of a clinical index to predict survival in ambulatory patients referred for cardiac transplant evaluation. Circulation. (1997) 95:2660–7. doi: 10.1161/01.CIR.95.12.2660
16. Pocock SJ, Wang D, Pfeffer MA, Yusuf S, McMurray JJ V, Swedberg KB, et al. Predictors of mortality and morbidity in patients with chronic heart failure. Eur Heart J. (2006) 27:65–75. doi: 10.1093/eurheartj/ehi555
17. Levy WC, Mozaffarian D, Linker DT, Sutradhar SC, Anker SD, Cropp AB, et al. The Seattle heart failure model: prediction of survival in heart failure. Circulation. (2006) 113:1424–33. doi: 10.1161/CIRCULATIONAHA.105.584102
18. Pocock SJ, Ariti CA, McMurray JJ V, Maggioni A, Køber L, Squire IB, et al. Predicting survival in heart failure: a risk score based on 39 372 patients from 30 studies. Eur Heart J. (2013) 34:1404–13. doi: 10.1093/eurheartj/ehs337
19. Rich JD, Burns J, Freed BH, Maurer MS, Burkhoff D, Shah SJ. Meta-Analysis Global Group in Chronic (MAGGIC) heart failure risk score: validation of a simple tool for the prediction of morbidity and mortality in heart failure with preserved ejection fraction. J Am Heart Assoc. (2018) 7:e009594. doi: 10.1161/JAHA.118.009594
20. Lupón J, De Antonio M, Vila J, Peñafiel J, Galán A, Zamora E, et al. Development of a novel heart failure risk tool: the Barcelona bio-heart failure risk calculator (BCN bio-HF calculator). PLoS ONE. (2014) 9:e85466. doi: 10.1371/journal.pone.0085466
21. Vazquez R, Bayes-Genis A, Cygankiewicz I, Pascual-Figal D, Grigorian-Shamagian L, Pavon R, et al. The MUSIC Risk score: a simple method for predicting mortality in ambulatory patients with chronic heart failure. Eur Heart J. (2009) 30:1088–96. doi: 10.1093/eurheartj/ehp032
22. Bhavnani S, Khedraki R, Cohoon T, et al. Multicenter validation of a machine learning phase space electro-mechanical pulse wave analysis to predict elevated left ventricular end diastolic pressure at the point-of-care. PloS ONE.
23. Shah SJ, Katz DH, Selvaraj S, Burke MA, Yancy CW, Gheorghiade M, et al. Phenomapping for novel classification of heart failure with preserved ejection fraction. Circulation. (2015) 131:269–79. doi: 10.1161/CIRCULATIONAHA.114.010637
24. Verdonschot JAJ, Merlo M, Dominguez F, Wang P, Henkens MTHM, Adriaens ME, et al. Phenotypic clustering of dilated cardiomyopathy patients highlights important pathophysiological differences. Eur Heart J. (2021) 42:162–74. doi: 10.1093/eurheartj/ehaa841
25. Hinton GE, Salakhutdinov RR. Reducing the dimensionality of data with neural networks. Science. (2006) 313:504–7. doi: 10.1126/science.1127647
26. Fathieh F, Paak M, Khosousi A, Burton T, Sanders WE, Doomra A, et al. Predicting cardiac disease from interactions of simultaneously-acquired hemodynamic and cardiac signals. Comput Methods Programs Biomed. (2021) 202:105970. doi: 10.1016/j.cmpb.2021.105970
28. Box GEP, Cox DR. An analysis of transformations. J R Stat Soc Ser B. (1964) 26:211–43. doi: 10.1111/j.2517-6161.1964.tb00553.x
29. Van Der Heiden R, Groen FCA. The Box-Cox metric for nearest neighbor classification improvement. Pattern Recognit. (1997) 30:273–9. doi: 10.1016/S0031-3203(96)00077-5
30. Chen S, Ma B, Zhang K. On the similarity metric and the distance metric. Theor Comput Sci. (2009) 410:2365–76. doi: 10.1016/j.tcs.2009.02.023
31. Kumar V, Chhabra JK, Kumar D. Performance evaluation of distance metrics in the clustering algorithms. INFOCOMP J Comput Sci. (2014) 13:38–52.
32. Quer G, Arnaout R, Henne M, Arnaout R. Machine learning and the future of cardiovascular care: JACC state-of-the-art review. J Am Coll Cardiol. (2021) 77:300–13. doi: 10.1016/j.jacc.2020.11.030
33. Krittanawong C, Johnson KW, Rosenson RS, Wang Z, Aydar M, Baber U, et al. Deep learning for cardiovascular medicine: a practical primer. Eur Heart J. (2019) 40:2058–73. doi: 10.1093/eurheartj/ehz056
34. Shalev-Shwartz S, Ben-David S. Understanding machine learning: From theory to algorithms. Cambridge university press. (2014). doi: 10.1017/CBO9781107298019
35. Kao DP, Lewsey JD, Anand IS, Massie BM, Zile MR, Carson PE, et al. Characterization of subgroups of heart failure patients with preserved ejection fraction with possible implications for prognosis and treatment response. Eur J Heart Fail. (2015) 17:925–35. doi: 10.1002/ejhf.327
36. Ahmad T, Lund LH, Rao P, Ghosh R, Warier P, Vaccaro B, et al. Machine learning methods improve prognostication, identify clinically distinct phenotypes, and detect heterogeneity in response to therapy in a large cohort of heart failure patients. J Am Heart Assoc. (2018) 7:e008081. doi: 10.1161/JAHA.117.008081
37. Horiuchi Y, Tanimoto S, Latif AHMM, Urayama KY, Aoki J, Yahagi K, et al. Identifying novel phenotypes of acute heart failure using cluster analysis of clinical variables. Int J Cardiol. (2018) 262:57–63. doi: 10.1016/j.ijcard.2018.03.098
Keywords: machine learning, risk stratification, left ventricular filling pressures, artificial intelligence, digital health
Citation: Burton T, Ramchandani S, Bhavnani SP, Khedraki R, Cohoon TJ, Stuckey TD, Steuter JA, Meine FJ, Bennett BA, Carroll WS, Lange E, Fathieh F, Khosousi A, Rabbat M and Sanders WE (2022) Identifying novel phenotypes of elevated left ventricular end diastolic pressure using hierarchical clustering of features derived from electromechanical waveform data. Front. Cardiovasc. Med. 9:980625. doi: 10.3389/fcvm.2022.980625
Received: 28 June 2022; Accepted: 22 August 2022;
Published: 23 September 2022.
Edited by:
Qingpeng Zhang, City University of Hong Kong, Hong Kong SAR, ChinaReviewed by:
Hamayak Sisakian, Yerevan State Medical University, ArmeniaCopyright © 2022 Burton, Ramchandani, Bhavnani, Khedraki, Cohoon, Stuckey, Steuter, Meine, Bennett, Carroll, Lange, Fathieh, Khosousi, Rabbat and Sanders. This is an open-access article distributed under the terms of the Creative Commons Attribution License (CC BY). The use, distribution or reproduction in other forums is permitted, provided the original author(s) and the copyright owner(s) are credited and that the original publication in this journal is cited, in accordance with accepted academic practice. No use, distribution or reproduction is permitted which does not comply with these terms.
*Correspondence: William E. Sanders, d3NhbmRlcnNAY29ydmlzdGEuY29t
Disclaimer: All claims expressed in this article are solely those of the authors and do not necessarily represent those of their affiliated organizations, or those of the publisher, the editors and the reviewers. Any product that may be evaluated in this article or claim that may be made by its manufacturer is not guaranteed or endorsed by the publisher.
Research integrity at Frontiers
Learn more about the work of our research integrity team to safeguard the quality of each article we publish.