
95% of researchers rate our articles as excellent or good
Learn more about the work of our research integrity team to safeguard the quality of each article we publish.
Find out more
ORIGINAL RESEARCH article
Front. Cardiovasc. Med. , 27 July 2022
Sec. Hypertension
Volume 9 - 2022 | https://doi.org/10.3389/fcvm.2022.932480
This article is part of the Research Topic Hypertensive Disorders of Pregnancy and the Cardiovascular System: Causes, consequences, prevention and therapy View all 18 articles
 Kaspar Ratnik1,2
 Kristiina Rull1,3,4
 Oliver Aasmets5
 Triin Kikas1Ele Hanson3,4Kalle Kisand6
 Krista Fischer5,7
 Maris Laan1*
Preeclampsia (PE) is a common pregnancy-linked disease, causing preterm births, complicated deliveries, and health consequences for mothers and offspring. We have previously developed 6PLEX, a multiplex assay that measures PE-related maternal serum biomarkers ADAM12, sENG, leptin, PlGF, sFlt-1, and PTX3 in a single test tube. This study investigated the potential of 6PLEX to develop novel PE prediction models for early pregnancy. We analyzed 132 serum samples drawn at 70–275 gestational days (g days) from 53 pregnant women (PE, n = 22; controls, n = 31). PE prediction models were developed using a machine learning strategy based on the stepwise selection of the most significant models and incorporating parameters with optimal resampling. Alternative models included also placental FLT1 rs4769613 T/C genotypes, a high-confidence risk factor for PE. The best performing PE prediction model using samples collected at 70–98 g days comprised of PTX3, sFlt-1, and ADAM12, the subject's parity and gestational age at sampling (AUC 0.94 [95%CI 0.84–0.99]). All cases, that developed PE several months later (onset 257.4 ± 15.2 g days), were correctly identified. The model's specificity was 80% [95%CI 65–100] and the overall accuracy was 88% [95%CI 73–95]. Incorporating additionally the placental FLT1 rs4769613 T/C genotype data increased the prediction accuracy to 93.5% [AUC = 0.97 (95%CI 0.89–1.00)]. However, 6PLEX measurements of samples collected at 100–182 g days were insufficiently informative to develop reliable PE prediction models for mid-pregnancy (accuracy <75%). In summary, the developed model opens new horizons for first-trimester PE screening, combining the easily standardizable 6PLEX assay with routinely collected antenatal care data and resulting in high sensitivity and specificity.
Preeclampsia (PE) is considered a disease of the placenta, caused by impaired remodeling of spiral arteries during the first half of pregnancy and/or suboptimal placental capacity to support the maternal-fetal needs until natural delivery. As a result of insufficient modulation of the uterine vasculature in the beginning of the pregnancy, hypertension (HTN) and other signs of organ dysfunction, the characteristics of PE, manifest during the second half of pregnancy (1, 2). This is mediated by hypoxic placenta releasing biomolecules into maternal circulation that causes endothelial damage and generalized inflammatory vascular stress. PE is a sudden and severe complication with a prevalence of 4.6% worldwide and in Europe alone affecting annually ~400,000 cases. Currently, the most effective management of PE is delivery that can occur preterm. PE can also cause fetal growth restriction or even intrauterine or maternal death in extreme cases (3). In addition, hypertensive pregnancy complications result in a greater risk of developing cardiovascular and metabolic diseases, stroke, and end-stage renal disease later in life (4).
It has been recently shown that low-dose aspirin has a protective effect in the prevention of PE in high-risk cases (up to 82% for early PE, onset before 34 gestational weeks (g week)) if prophylaxis is started before g week 16 (5, 6). The development of effective screening tools for PE to be applied in the 1st trimester of pregnancy has been sought for and advised by professional organizations (4, 7–9). Traditionally, evaluation of PE risk is based on the assessment of maternal prepregnancy characteristics, such as maternal age >40 years, nulliparity, obesity, previous or family history of PE, diabetes mellitus, chronic HTN, and renal or autoimmune diseases. Although it is a maternal risk factor-based model that is easy to perform, it has a low detection rate (~40%) for the subsequent manifestation of PE (10). Therefore, the application of other parameters to be measured during pregnancy has been proposed for the estimation of the PE risk. These include mean arterial pressure (MAP) and uterine arteries pulsatility index (UtA PI), a single or combination of biochemical serum markers (11). The predictive rate of these algorithms has been reported up to 96.3% [false-positive rate (FPR) 10%] for early PE with the onset before 34th g week, but remains lower (up to 76.6%) for late PE that represents the major fraction of PE cases (12, 13). The modest prediction rate of late PE has limited the investigation of its early preventive measures. For example, pravastatin, administered after 35–37 g week for high-risk women, did not prevent the manifestation of disease (14). It indicates either the ineffectiveness of pravastatin or suboptimal selection of high-risk patients destined to develop term PE.
We have recently developed an innovative, single-tube multimarker 6PLEX assay for the Luminex® xMAP platform to measure simultaneously six PE-related biomarkers in the sera of pregnant women, namely, soluble fms-like tyrosine kinase 1 (sFlt-1), placental growth factor (PlGF), soluble endoglin (sENG), leptin, disintegrin, and metalloproteinase domain-containing protein 12 (ADAM12), and Pentraxin 3 (PTX3) (15). Combining 6PLEX measurements of serum samples collected in the second half of pregnancy with gestational age and maternal weight at sampling generated a clinically applicable and effective prediction formula for PE development regardless of gestational age at its clinical manifestation. The new solution exhibited superior prognostic yield compared to the currently used sFlt-1/PlGF ratio in the diagnosis confirmation of symptomatic women in late pregnancy (96.5% vs. 73.7%) (15, 16).
This study aimed to investigate the potential of 6PLEX to develop novel PE prediction models for early pregnancy. We analyzed serum samples from pregnant women drawn during either 70–98 or 100–182 gestational days (g days), including cases who later experienced PE and controls with an uneventful pregnancy until delivery. Combining biomarker measurements with maternal data enabled the generation of new PE prediction models with high specificity and sensitivity to correctly identify PE onset many months later. Innovatively, the developed 1st trimester PE prediction models were further improved by incorporating the placental genotypes of the genetic variant rs4769613 T/C. This variant is localized upstream of the FLT1 gene, and the carriership of the C-allele, especially CC-homozygosity, represents a high-confident genetic risk factor for late-onset PE (17, 18).
The study patients were recruited, and the clinical data and biomaterials were collected during a prospective observational “Happy Pregnancy” project (full name: “Development of novel non-invasive biomarkers for fertility and healthy pregnancy', PI: M.L.). The project has been approved by the Ethics Committee of Human Research of the University Clinic of Tartu, Estonia (permission no. 221/T-6, 17.12.2012, and 286/M-18, 15.10.2018) and was carried out in compliance with the Helsinki Declaration. Written informed consent to participate in the study was obtained from everyone prior to recruitment. All participants were of white European ancestry and lived in Estonia.
The pregnant women had been enrolled at their first antenatal visit at the Women's Clinic, Tartu University Hospital, Estonia in 2013–2015. The pregnancy follow-up was based on the national guidelines of the Estonian Gynaecologists' Society (19). The collected clinical and epidemiological data are specified in the Supplementary Methods. The diagnosis of PE followed the international guidelines at the time of recruitment and included co-occurrence of a new-onset HTN (blood pressure ≥140/ ≥90 mmHg) after 20 g week and proteinuria (PTN), or other signs of maternal organ dysfunction (3). Diagnosis of small-for-gestational-age (SGA) newborn was assigned at the delivery based on national guidelines (20).
For research purposes, serum samples were collected in parallel with blood samples for routine clinical tests. Each Happy Pregnancy study subject had been drawn a blood sample 2–5 times during the pregnancy. Serum was separated (centrifugation at 1,800 g for 10 min at room temperature, RT) within 2 h after sampling and kept at −80°C before further aliquoting and subsequent analysis.
Preeclampsia patients (n = 22, age 28.0 ± 5.2 years; prepregnancy body mass index (BMI) 26.8 ± 6.2 kg/m2) and non-PE controls (n = 31; 28.5 ± 5.1 years; BMI 25.7 ± 4.8 kg/m2) analyzed in this study were selected from the Happy Pregnancy biobank based on available gestational-age matched serum samples in both, PE case and control groups (Supplementary Table S1). The included pregnancies had been drawn from a total of 132 serum samples (Table 1). Early pregnancy was represented by 14 samples from women who later developed PE (drawn 88.8 ± 7.0; 70–98 g days) and 20 samples from healthy gestations (88.2 ± 5.8; 76–96 g days). Within this time window, one PE pregnancy and two control cases were represented by two sera, drawn at 70th and 96th, 76th and 92nd, 90th, and 93rd g days, respectively. Mid-pregnancy sample set comprised 18 PE and 21 non-PE pregnancy sera, sampled between 100–180 (150.7 ± 25.7) and 109–182 (136.1 ± 24.1) g days, respectively. During mid-gestation, one woman in the PE and three in the control group had been sampled two times, at 117th and 180th, 111th and 182nd; 118th and 139th; and 121st and 147th g days, respectively. All 53 women, irrespective of the final pregnancy outcome (PE or non-PE), were normotensive at blood draw during early and mid-pregnancy blood sampling. The age at the onset of PE in cases with early- and mid-pregnancy serum samples was 257.4 ± 15.2 and 249.3 ± 25.3 g days, respectively.
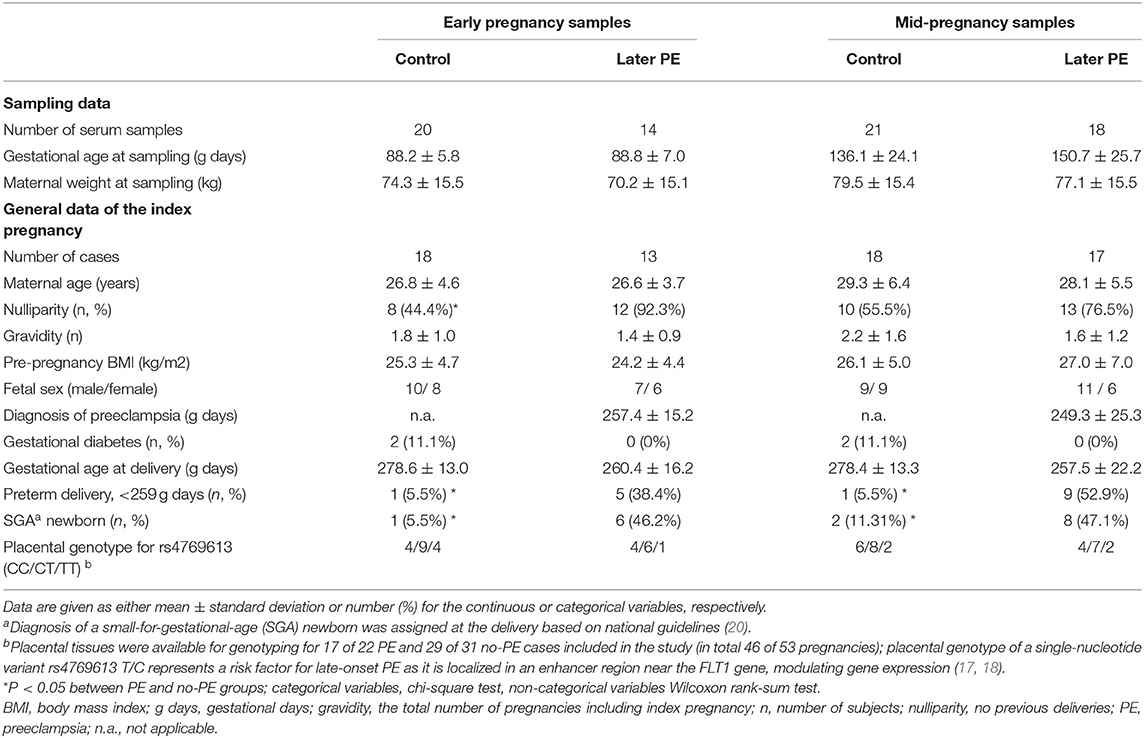
Table 1. Maternal and pregnancy characteristics of the cases involved in PE prediction modeling.
Late pregnancy serum samples of these 53 cases (28 PE, 206–275 g days; 31 controls, 210–274 g days) have been utilized in our recent study reporting PE prediction models based on 6PLEX assay measurements of late pregnancy serum samples (15). Two serum samples (one PE and one control, 182 and 180 g days, respectively) from this seminal publication were reallocated in this study to the mid-pregnancy sample set, as more appropriate.
The Luminex® xMAP platform offers advanced immunoassay-based technology that allows rapid simultaneous analyses of a large number of biomarkers in a single test tube (21). Luminex® xMAP-based approach and development of the methodology for multiplex measurement of sFlt-1, PlGF, sENG, leptin, ADAM12, and PTX3 in a single test tube is detailed in a previously published study (15). Briefly, Luminex® magnetic microspheres (#MC100) and antibody coupling kit for covalent linking of antibodies and microspheres (Antibody Coupling Kit, #40–50016) were purchased directly from Luminex® Corporation (Austin TX, USA). Capture and detection antibodies and reference proteins were purchased from R&D Systems (Minneapolis, MN, USA) (Supplementary Table S2). The applied Luminex® sandwich immunoassay protocol followed the manufacturer's guidelines (The xMAP Cookbook, https://www.luminexcorp.com/). All serum samples were analyzed in one batch in duplicate using a 1:20 dilution factor. All dilutions of reference proteins and tested samples were prepared in General Assay Diluent (GAD; #620; ImmunoChemistry Technologies, LLC, Minnesota, USA). Details of Luminex® xMAP technology used equipment, reagents, and their dilutions are provided in the Supplementary Methods and our seminal methodological publication (15).
Placental tissues were collected after cesarean section or vaginal delivery, were washed with 1 × PBS (phosphate-buffered saline, pH~7.4) to remove maternal blood, and stored in a dry tube at −80°C until DNA extraction. DNA from the placental samples was extracted using the NucleoSpin Tissue kit (MACHEREY-NAGEL GmbH & Co. KG, Düren, Germany) according to the manufacturer's protocol. For genotyping of placental rs4769613 T/C, premade TaqMan Genotyping Assay was used according to the manufacturer's protocol (Applied Biosystems, Foster City; Assay ID: C__32231378_10). Placental tissue was available for 17 of 22 PE cases and 29 of 31 controls (in 46 of 53 pregnancies). Genotyping details have been described in the Supplementary Methods and a recent publication (18).
Summary estimates of the data were calculated, and all statistical tests were implemented using the STATA software version 13.1 (StataCorp, TX, USA) or the R 3.3.3 language and environment (Free Software Foundation, Boston, MA, USA, http://www.r-project.org). To compare groups, the Mann-Whitney rank-sum test was used for continuous variables and the chi-square test for categorical variables. P < 0.05 was considered statistically significant.
Logistic regression models (GLM) were used to investigate associations between biomarker measurements and the clinical onset of PE during the index pregnancy. All biomarker values were centered and scaled before modeling for data normalization and standardization. First automated computational pre-filtration for the identification of the optimal prediction model has performed modeling with the stepAIC selection method (generalized linear model with stepwise feature selection) in package CARET (short for Classification And REgression Training). This machine learning strategy, in combination with leave-one-out cross-validation (LOOCV), allows to select statistically most significant prediction model and to pick the complexity parameters that are associated with the optimal resampling statistics. Pre-filtration was carried out by using the following input variables: measured concentrations of six biomarkers (ADAM12, Leptin, Pentraxin3, sENG, sFlt-1, and PlGF) and maternal characteristics of blood sampling time in gestational days, maternal weight at blood draw, and parity as a binary variable (nulliparity defined as 0 and multiparity defined as 1). As an output of this procedure, all possible models generated from these input parameters were automatically ranked based on their area under the curve (AUC) estimates. The best-predicted model by the LOOCV + stepAIC approach was developed further by alternatively replacing and/or adding biomarker measurements to trial the model performance using the GLM package in R. Additionally, statistical models were built combining parameter combinations with the placental genotypes of the single-nucleotide polymorphism (SNP) rs4769613 T/C (in an additive manner, defined as variables 0, 1, or 2 according to genotypes TT, CT, and CC) either by replacing parity with the SNP data or considering them both.
The predictive power of the models was assessed using the ROC curve (receiver operating characteristic curve) and the area under the ROC curve (AUC). For every fitted model, model-based individual predictions were obtained, as estimated probabilities of PE (during the index pregnancy until term), denoted as p(i) with Epi::ROC. The p(i) represents the probability thresholds at the maximum Youden's J index on the curve. The p(i) equal or superior to a fitted model optimal cutoff point value indicates that the subject will develop PE or has PE, whereas the p(i) inferior to a fitted model optimal cutoff point value predicts that PE will not develop.
Luminex® 6PLEX multiplex assay measurements of 132 serum samples (drawn from 53 pregnant women between 70 and 275 g days; Table 1) revealed different gestational dynamics of the analyzed PE-linked biomarkers ADAM12, PTX3, PlGF, sFlt-1, sENG, and leptin (Figure 1, Table 2). In normal pregnancy, ADAM12 and PlGF levels gradually increase through all three trimesters. PTX3 serum concentrations maintained stable levels during early and mid-pregnancy with a significant decrease toward the term. In contrast, both sFlt-1 and sENG have an increasing trend specifically in late pregnancy. During early pregnancy, three biomarkers showed significantly (P < 0.05) increased serum levels in cases with a later onset of PE compared to controls: PTX3, ADAM12, and sENG, whereas only ADAM12 maintained higher concentration in the PE group also in mid-pregnancy (Figures 1, 2). In late pregnancy serum samples from future PE cases, increased sENG and sFlt-1, and decreased PlGF were measured (PE vs. non-PE serum levels, P < 0.001).
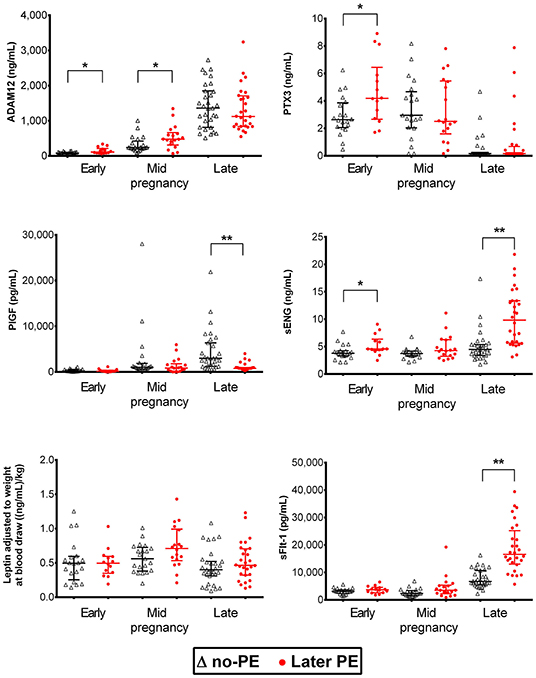
Figure 1. Dynamics of preeclampsia-related biomarkers throughout gestation in healthy and preeclamptic pregnancies. Luminex® 6PLEX assay measurement data of concentrations of ADAM12, PTX3, PlGF, sENG, and sFlt-1 in 132 serum samples collected from pregnant women. The early pregnancy group was comprised of 14 samples drawn at 70–98 g days from women that later developed PE and 20 samples from controls collected at 76–96 g days. The mid-pregnancy sample set comprised 18 PE and 21 control pregnancy sera, sampled at 100–180 and 109–182 g days, respectively. Data of late pregnancy samples representing 28 PE (206–275 g days) and 31 control sera (210–274 g days) were obtained from our recent study (15). All women, irrespective of the pregnancy outcome (PE or no-PE), were normotensive at blood draw. The whiskers on the plot show the median with an interquartile range. The statistical difference in biomarker distributions between PE and control cases was compared using the Mann-Whitney U-test, * representing P < 0.05 and ** P < 0.0001. ADAM12, ADAM Metallopeptidase Domain 12; g days, gestational days; PlGF, placental growth factor; PTX3, Pentraxin3; sENG, endoglin; sFlt-1, soluble fms-like tyrosine kinase 1.
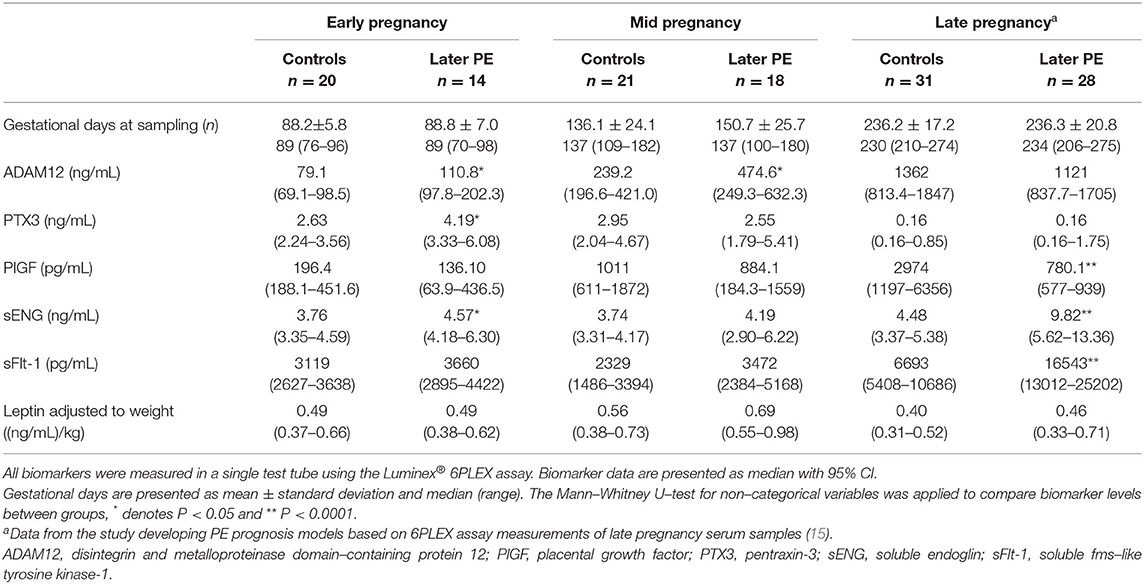
Table 2. Measured concentrations of biomarkers in maternal sera sampled in early, mid, and late pregnancy.
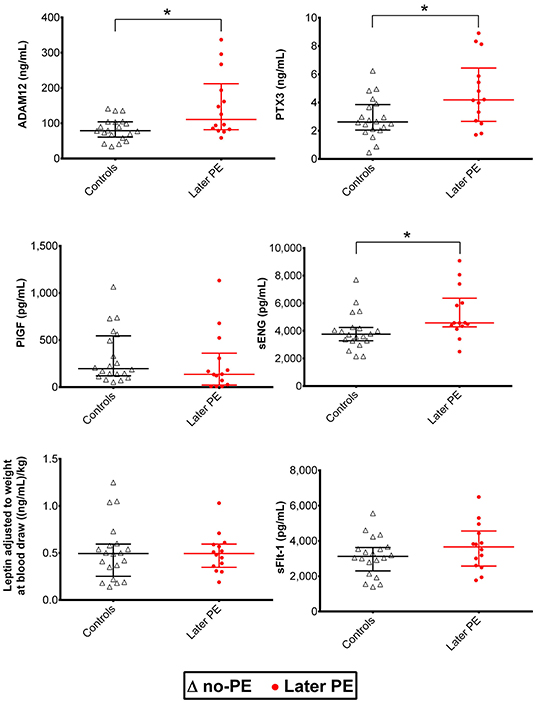
Figure 2. Distribution of maternal serum biomarkers measured with the Luminex® 6PLEX assay during early pregnancy, stratified by the later onset of preeclampsia (PE). Samples from women that later developed PE (n = 14, drawn at 70–98 gestational days) were compared to samples representing uncomplicated gestations until term (n = 20, 76–96 gestational days; Table 1). The whiskers on the plot show the median with an interquartile range. The statistical difference in biomarker distributions between PE and control cases was compared using the Mann-Whitney U-test, * representing P<0.05. ADAM12, disintegrin and metalloproteinase domain-containing protein 12; PlGF, placental growth factor; PTX3, pentraxin-3; sENG, soluble endoglin; sFlt-1, soluble fms-like tyrosine kinase-1.
Placental tissues from 46 women (17 PE and 29 non-PE) analyzed in this study were available for placental genotyping of FLT1 rs4769613 T/C. No statistically significant differences were observed in serum sFlt-1 levels in early, mid, or late pregnancy between women with alternative genotypes CC, CT, and TT (Table 3).
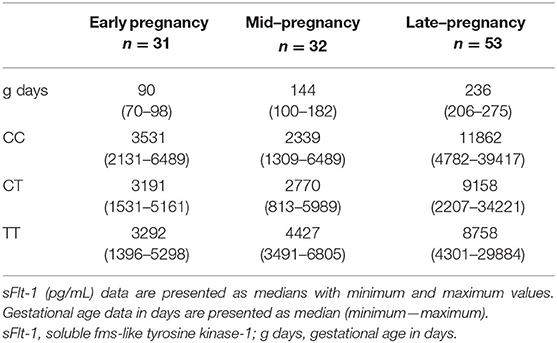
Table 3. Detailed data of sFlt-1 (pg/mL) measurements stratified into fetal FLT1 rs4769613 T/C genotype of the 116 serum samples drawn during early, mid, and late pregnancy.
Preeclampsia prediction models applicable in early pregnancy were developed by combining Luminex® 6PLEX multiplex-assay measurements of PE biomarkers in maternal serum (70-98 g days) with informative clinical data (Figures 3A,B; Tables 4, 5; Supplementary Table S3). According to the machine-learning approach (LOOCV + stepAIC), the best performing PE prediction model comprised of PTX3, sFlt-1, and ADAM12 measurements, the subject's parity, and gestational age at sampling [model 1A: AUC 0.936 (95%CI 0.843–0.993)]. PTX3 concentration and parity information had a statistically significant contribution to the model (P < 0.05). This model correctly “ruled in” or “ruled out” the onset of PE for 30 of 34 analyzed samples (accuracy 88.2%; 95%CI 73.4–95.3). The PE prediction model 1A exhibited 100% sensitivity in identifying all 14 cases who developed PE several months later (onset 257.4 ± 15.2 g days). The specificity of this model was 80.0%. Four of 20 cases progressing healthy pregnancy until delivery received a false-positive outcome regarding the PE prediction.
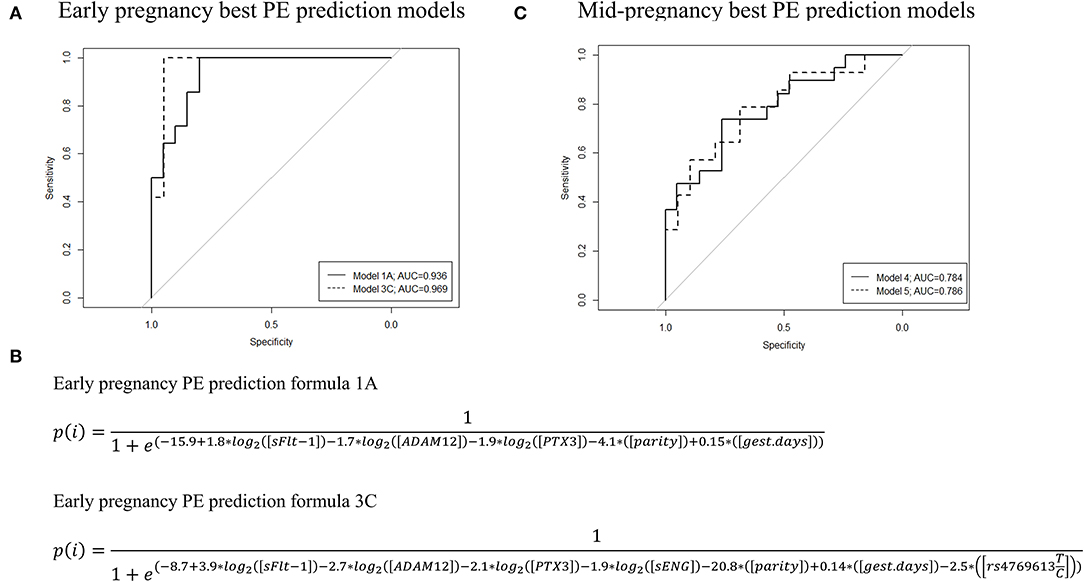
Figure 3. ROC curves, AUC values, and the formulas of the best performing preeclampsia (PE) prediction models were developed based on the Luminex® 6PLEX assay data. The best PE prediction models are based on the analysis of serum samples collected during either (A) 70th-98th or (C) 100th−182nd g days. Early pregnancy model 1A incorporated data from three biomarkers (sFlt-1, ADAM12, and PTX3) and model 3C four markers (sFlt-1, sEng, ADAM12, and PTX3), whereas mid-pregnancy models 4 and 5 are based on only PlGF measurements. Model 3C and model 5 additionally included placental genotype data of the FLT1 rs4769613 T/C variant. All models were adjusted for gestational days (gest. days) at sampling and maternal parity (nulliparity or multiparity). (B) PE prediction formulae for models 1A and 3C. Details are presented in Tables 4, 5 and Supplementary Table S3. AUC, the area under the curve; ROC, receiver operating characteristics.
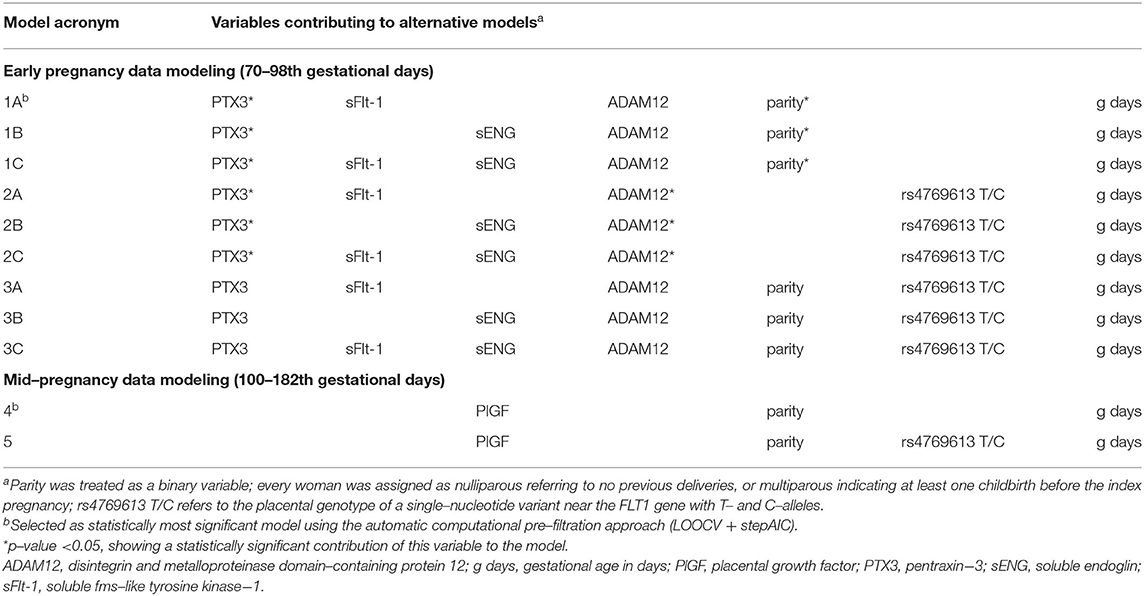
Table 4. Developed PE prognosis models and contributing variables.
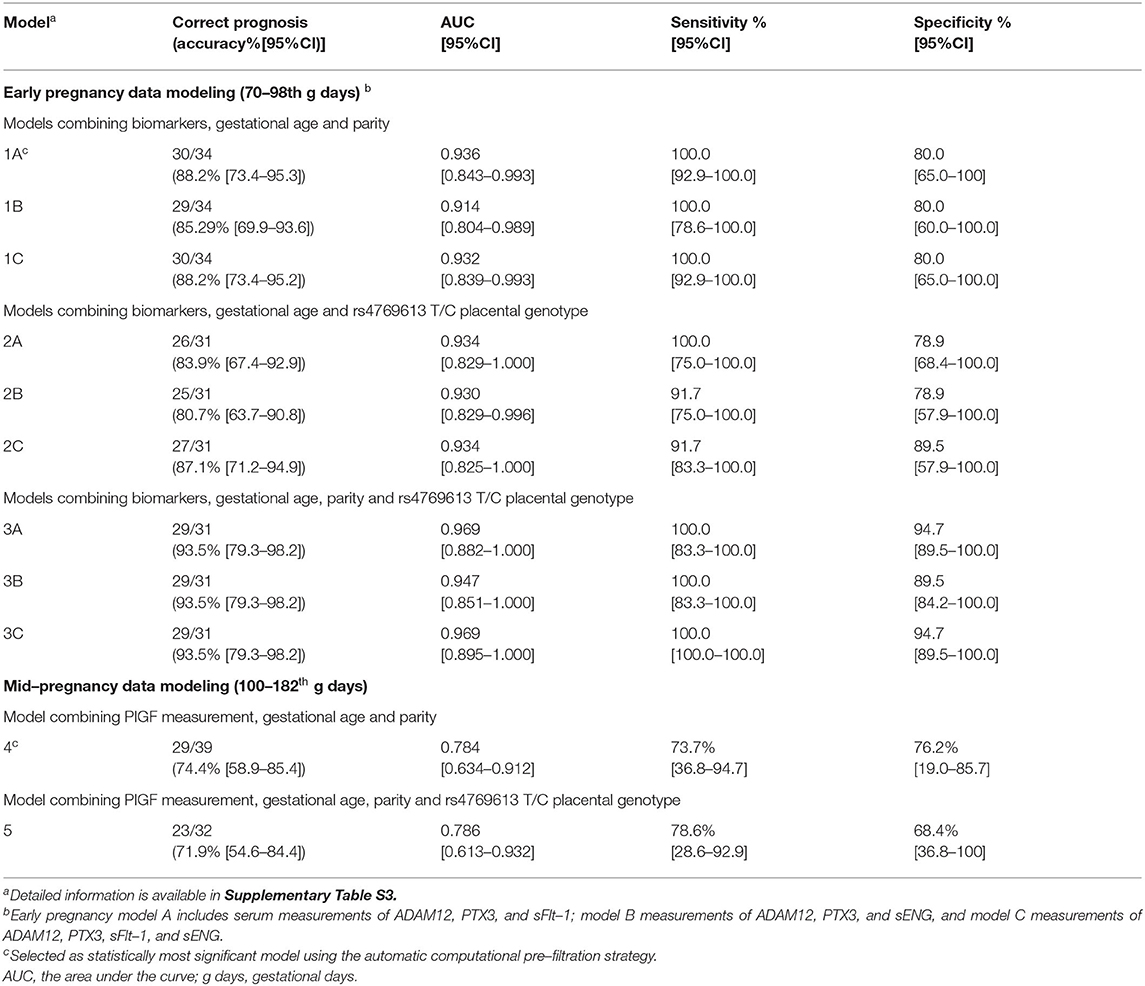
Table 5. Characteristics of PE prediction models.
Early pregnancy sFlt-1 and sENG serum levels were highly correlated (Figure 4). When sFlt-1 was replaced with sENG (model 1B) or both biomarkers were incorporated (model 1C), these alternative formulas showed equivalent properties in predicting PE as the model 1A (Tables 4, 5).
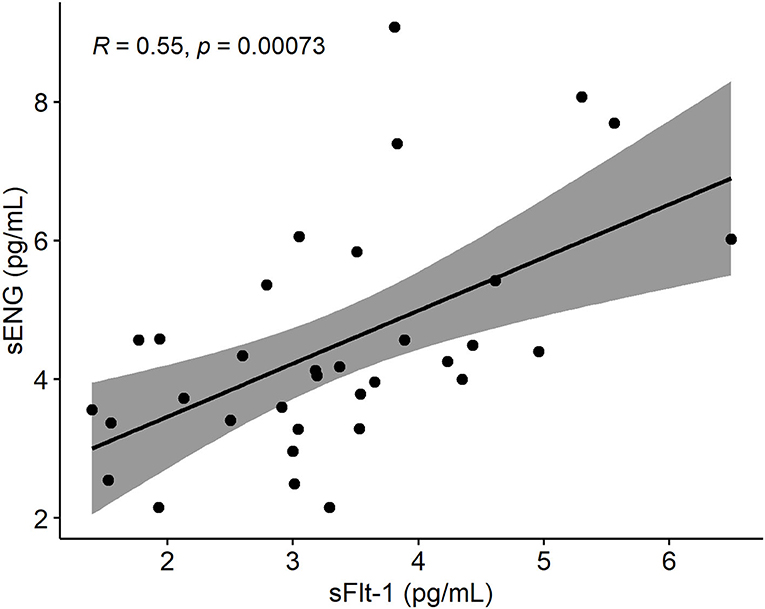
Figure 4. Spearman's rank correlation plot between sENG and sFlt-1 measurements of sera drawn from pregnant women within 70 and 98 gestational days. Gray around the linear regression line (y = 0.7651x + 1,931.4) indicates the 95% confidence region. sENG, soluble endoglin; sFlt-1, soluble fms-like tyrosine kinase-1.
We explored the added value of placental FLT1 rs4769613 T/C, confidently associated with late-onset PE (17, 18), in the PE prediction models excluding (2A–2C) or including (3A−3C) the parity data (Figures 3A,B; Tables 4, 5; Supplementary Table S3). The overall PE prediction accuracy in early pregnancy was the highest when combining gestational age-adjusted PTX3, sFlt-1, sENG, and ADAM12 measurements with the parity and placental FLT1 rs4769613 additive genotype data [model 3C: AUC 0.969 (95%CI 0.895–1.000)]. This model yielded a correct “rule in” or “rule out” PE in 29 out of 31 cases (93.5%; 95%CI 79.3–98.2%). In the series of models 3A–3C and model 2A, none of the true PE cases were missed. Models 3A–3C yielded only two false-positive PE predictions for pregnancies that remained normotensive. Taken together, including placental FLT1 rs4769613 T/C genotype data further improved the specificity of PE prediction from 80% to 94.7% (model 1A vs. 3A, model 1C vs. 3C, Table 5).
The development of PE prediction models using 6PLEX assay measurement data in mid-pregnancy (100–182 g days) was less informative compared to early pregnancy (Figure 3C, Tables 4, 5, Supplementary Table S3). The best performing model selected by the stepwise logistic regression model combined gestational age-adjusted PlGF measurements with parity data [Model 4: AUC 0.784 (95%CI 0.634–0.912)]. In total, 29 of 39 pregnancies [74.4% (95%CI 58.9–85.4)] received correctly “ruled in” or “ruled out” PE development. Including genotype data of the placental variant FLT1 rs4769613 T/C (model 5) did not improve the prediction [accuracy 71.9% (95%CI 54.6–84.4)].
We have recently developed a maternal serum-based 6PLEX assay implemented on the Luminex® xMAP platform that measures six PE biomarkers in a single test tube and has shown its potential as an informative screening test (prediction accuracy of 96.5%) for PE prediction during the second half of pregnancy (15). This study demonstrated that 6PLEX assay measurements of serum samples collected in early pregnancy are also informative for developing sensitive and accurate PE prediction models applicable already during 70–98 g days (Figure 3, Table 5, Supplementary Table S3). Further innovative aspects in the study were the exploitation of an unbiased machine learning approach to select statistically most significant PE prediction models (22–24), adjusting biomarker measurements for the gestational day at sampling, and incorporation of the placental genotypes of the FLT1 rs4769613 T/C variant, confidently associated with PE susceptibility (17, 18). The prediction model combining gestational age-adjusted 6PLEX measurements of PTX3, sFlt-1, sENG, and ADAM12 with parity and placental FLT1 rs4769613 T/C genotype data yielded a correct prediction of PE in 93.5% of analyzed cases with no false-negative predictions.
This is the first time a PE prediction model incorporated a genetic risk factor to be combined with maternal serum biomarker measurements and clinical data into a disease risk prediction algorithm. The proposed placental FLT1 rs4769613 T/C genotyping that increased the predictive accuracy from 88.2% to 93.5% (Figure 3, Table 5) is a novel entry into the currently protein-based biomarker-ruled PE prediction landscape. The utility of the non-invasive prenatal screening (NIPS) approach that is based on cell-free fetal DNA (cffDNA) is rapidly developing, currently focusing on detecting large chromosomal aberrations in the fetus (25, 26). However, there are already available technological solutions that allow single gene variant detection using the cffDNA (27). Thus, using cffDNA to screen the placental FLT1 rs4769613 T/C genotypes to be incorporated into the PE prediction models may soon be a feasible approach. In this perspective, the most rational solution would be the inclusion of this variant in gene panels developed for NIPS targeting fetal single gene defects. Simultaneous blood sampling and screening of pregnant women for fetal chromosomal and monogenic conditions, as well as for their risk to develop PE, is also a cost-effective, time-saving, and patient-friendly approach. Although currently available NIPS-based tests for fetal monogenic disorders cost hundreds of euros and are expensive for screening purposes, the prices are expected to drop in long run with possible new competitive technological and cost-effective solutions arriving on the market.
The developed 6PLEX assay-based PE prediction models performed at least equally or even better than most PE prediction algorithms that are currently implemented in early pregnancy (12, 13). One of the most widely used and validated algorithms for detecting PE is based on combining maternal factors, uterine arteries pulsatility index (UtA Pl), mean arterial pressure (MAP), maternal serum PlGF, and/or PAPP-A (10). This algorithm can predict 90% of PE onset <32 g weeks, 75% of preterm PE (<37 g weeks), but only <50% for term PE cases. As three of four PE pregnancies develop ≥37th g week, this algorithm has its limitation. Further shortcomings of the currently used solution include a high false-positive rate (10, 28). In addition, the requirement of certified costly apparatus and trained personnel for the measurement of UtA PI is not a routine procedure in the management of pregnant women in many countries (11).
Combined data from this study and our previous report (15) provide strong evidence that placental biomarkers circulating in maternal serum have individual gestational dynamics that must be considered in PE prediction models. 6PLEX data are consistent with the published observations on the measurements of the same biomarkers using conventional single marker assays (29, 30). There is enough accumulated evidence that during each gestational period, the set of maternal serum metabolites reflecting placental and/or maternal pathology varies. For example, well-established PE biomarkers of late pregnancy sFlt-1 and PlGF (8, 11, 12, 16) show early pregnancy serum levels that are individually not equivocally discriminative for the PE onset during the 3rd trimester (Figures 1, 2). In contrast, circulating levels of PTX3 in early pregnancy were shown as an informative biomarker for later PE development in this study and by others (31, 32).
The development of a potentially applicable predictive model using mid-pregnancy serum biomarker data has appeared to be a challenging task. In the current study, 6PLEX measurements of samples collected at 100–182 g days were insufficiently informative to develop reliable PE prediction models for mid-pregnancy (accuracy <75%). Further studies are needed to discover maternal serum biomarkers that are specific to the 2nd trimester of pregnancy.
Possible limitations of our study have to be acknowledged, including the moderate sample size that does not cover the real-life variability of pregnancy scenarios (e.g., twin pregnancies) and the narrow demographic origin of patients. Large-scale follow-up studies in independent pregnancy cohorts, both retrospective and prospective, are needed to validate the developed PE prediction models and evaluate their performance in clinical practice.
Despite all the research efforts and clinical advances, PE has remained a severe and rather common pregnancy complication with significant harm to maternal and perinatal morbidity. Timely surveillance and management of at-risk patients is the key approach to reducing its morbidities and most severe outcomes. Therefore, further early prediction tools, especially for late-onset PE, are needed to combine reliable screening performance with easily applicable protocols that do not need expensive infrastructure and special training and will be accessible to a large number of clinical centers. The developed model opens new horizons for first-trimester PE screening, combining the easily standardizable 6PLEX assay with routinely collected antenatal care data and resulting in high sensitivity and specificity of the test.
The original contributions presented in the study are included in the article/Supplementary Material, further inquiries can be directed to the corresponding author.
The studies involving human participants were reviewed and approved by Ethics Committee of Human Research of the University Clinic of Tartu, Estonia (permissions no. 221/T-6, 17.12.2012 and 286/M-18, 15.10.2018). The patients/participants provided their written informed consent to participate in this study.
Conception: ML. Design: KRa, KRu, and ML. Provision of study materials: ML and KRu. Clinical data collection: KRu and EH. Experimental conduct: KRa and TK. Experimental guidance: KK and ML. Data analysis: KRa, OA, TK, and KF. Data interpretation: KRa, KRu, OA, TK, EH, KK, KF, and ML. Manuscript writing: KRa and ML. Critical reading and commenting on the article: KRu, EH, TK, KK, OA, and KF. All authors contributed to the article and approved the submitted version.
ML and KRu, EU European Regional Development Fund (project no. 3.2.0701.12-0047); ML, Estonian Research Council (grant no. IUT34-12, PRG1021, EAG112); KF, Estonian Research Council (project no. PRG1197).
The authors declare that the research was conducted in the absence of any commercial or financial relationships that could be construed as a potential conflict of interest.
All claims expressed in this article are solely those of the authors and do not necessarily represent those of their affiliated organizations, or those of the publisher, the editors and the reviewers. Any product that may be evaluated in this article, or claim that may be made by its manufacturer, is not guaranteed or endorsed by the publisher.
We thank the Happy Pregnancy study participants. The clinical and laboratory personnel at the Women's Clinic, Tartu University Hospital, and the Chair of Human Genetics, Institute of Biomedicine and Translational Medicine, University of Tartu, are acknowledged for their assistance in recruitment, phenotyping, sample logistics, and aliquoting.
The Supplementary Material for this article can be found online at: https://www.frontiersin.org/articles/10.3389/fcvm.2022.932480/full#supplementary-material
1. Redman CW, Sargent IL, Staff AC. IFPA senior award lecture: making sense of pre-eclampsia - two placental causes of preeclampsia? Placenta. (2014) 35:S20–25. doi: 10.1016/j.placenta.2013.12.008
2. Staff AC. The two-stage placental model of preeclampsia: an update. J Reprod Immunol. (2019) 134–135:1–10. doi: 10.1016/j.jri.2019.07.004
3. Tranquilli AL, Dekker G, Magee L, Roberts J, Sibai BM, Steyn W, et al. The classification, diagnosis and management of the hypertensive disorders of pregnancy: a revised statement from the ISSHP. Pregnancy Hypertens. (2014) 4:97–104. doi: 10.1016/j.preghy.2014.02.001
4. Webster K, Fishburn S, Maresh M, Findlay SC, Chappell LC. Guideline committee. diagnosis and management of hypertension in pregnancy: summary of updated NICE guidance. BMJ. (2019) 366:l5119. doi: 10.1136/bmj.l5119
5. Rolnik DL, Wright D, Poon LC, O'Gorman N, Syngelaki A, de Paco Matallana C, et al. Aspirin versus placebo in pregnancies at high risk for preterm preeclampsia. N Engl J Med. (2017) 377:613–22. doi: 10.1056/NEJMoa1704559
6. Bujold E, Roberge S, Lacasse Y, Bureau M, Audibert F, Marcoux S, et al. Prevention of preeclampsia and intrauterine growth restriction with aspirin started in early pregnancy: a meta-analysis. Obstet Gynecol. (2010) 116:402–14. doi: 10.1097/AOG.0b013e3181e9322a
7. Sotiriadis A, Hernandez-Andrade E, da Silva Costa F, Ghi T, Glanc P, Khalil A, et al. ISUOG Practice Guidelines: role of ultrasound in screening for and follow-up of pre-eclampsia. Ultrasound Obstet Gynecol. (2019) 53:7–22. doi: 10.1002/uog.20105
8. Brown MA, Magee LA, Kenny LC, Karumanchi SA, McCarthy FP, Saito S, et al. The hypertensive disorders of pregnancy: ISSHP classification, diagnosis & management recommendations for international practice. Pregnancy Hypertens. (2018) 13:291–310. doi: 10.1016/j.preghy.2018.05.004
9. Poon LC, Shennan A, Hyett JA, Kapur A, Hadar E, Divakar H, et al. The International Federation of Gynecology and Obstetrics (FIGO) initiative on pre-eclampsia: a pragmatic guide for first-trimester screening and prevention. Int J Gynaecol Obstet. (2019) 145:1–33. doi: 10.1002/ijgo.12802
10. O'Gorman N, Wright D, Poon LC, Rolnik DL, Syngelaki A, Wright A, et al. Accuracy of competing-risks model in screening for pre-eclampsia by maternal factors and biomarkers at 11-13 weeks' gestation. Ultrasound Obstet Gynecol. (2017) 49:751–5. doi: 10.1002/uog.17399
11. Stepan H, Hund M, Andraczek T. Combining biomarkers to predict pregnancy complications and redefine preeclampsia: the angiogenic-placental syndrome. Hypertension. (2020) 75:918–26. doi: 10.1161/HYPERTENSIONAHA.119.13763
12. Wright D, Syngelaki A, Akolekar R, Poon LC, Nicolaides KH. Competing risks model in screening for preeclampsia by maternal characteristics and medical history. Am J Obstet Gynecol. (2015) 213:62.e1–2.e10. doi: 10.1016/j.ajog.2015.02.018
13. Mosimann B, Amylidi-Mohr SK, Surbek D, Raio L. First trimester screening for preeclampsia – a systematic review. Hypertens Pregnancy. (2020) 39:1–11. doi: 10.1080/10641955.2019.1682009
14. Döbert M, Varouxaki AN, Mu AC, Syngelaki A, Ciobanu A, Akolekar R, et al. Pravastatin versus placebo in pregnancies at high risk of term preeclampsia. Circulation. (2021) 144:670–9. doi: 10.1161/CIRCULATIONAHA.121.053963
15. Ratnik K, Rull K, Hanson E, Kisand K, Laan M. Single-Tube multimarker assay for estimating the risk to develop preeclampsia. J Appl Lab Med. (2020) 5:1156–71. doi: 10.1093/jalm/jfaa054
16. Zeisler H, Llurba E, Chantraine F, Vatish M, Staff AC, Sennström M, et al. Predictive value of the sFlt-1:PlGF ratio in women with suspected preeclampsia. N Engl J Med. (2016) 374:13–22. doi: 10.1056/NEJMoa1414838
17. McGinnis R, Steinthorsdottir V, Williams NO, Thorleifsson G, Shooter S, Hjartardottir S, et al. Variants in the fetal genome near FLT1 are associated with risk of preeclampsia. Nat Genet. (2017) 49:1255–60. doi: 10.1038/ng.3895
18. Kikas T, Inno R, Ratnik K, Rull K, Laan M. C-allele of rs4769613 Near FLT1 represents a high-confidence placental risk factor for preeclampsia. Hypertension. (2020) 76:884–91. doi: 10.1161/HYPERTENSIONAHA.120.15346
19. Vaas P, Rull K, Põllumaa S, Kirss A, Meiga D. Raseduse jälgimise juhend (Guidelines for pregnancy monitoring), Estonian Gynaecologists Society 2011;v4. Available Online at: https://rasedajalgimine.weebly.com [in Estonian].
20. Sildver K, Veerus P, Lang K. Sünnikaalu kõverad Eestis ja sünnikaalu mõjutavad tegurid: registripõhine uuring (Birth weight curves and factors affecting birth weight in Estonia: a registry-based study). Eesti Arst. (2015) 94:465–70. Available online at: http://ojs.utlib.ee/index.php/EA/article/view/12296
21. Ellington AA, Kullo IJ, Bailey KR, Klee GG. Antibody-based protein multiplex platforms: technical and operational challenges. Clin Chem. (2010) 56:186–93. doi: 10.1373/clinchem.2009.127514
22. Jhee JH, Lee S, Park Y, Lee SE, Kim YA, Kang SW, et al. Prediction model development of late-onset preeclampsia using machine learning-based methods. PLoS ONE. (2019) 14:e0221202. doi: 10.1371/journal.pone.0221202
23. Marić I, Tsur A, Aghaeepour N, Montanari A, Stevenson DK, Shaw GM, et al. Early prediction of preeclampsia via machine learning. Am J Obstet Gynecol MFM. (2020) 2:100100. doi: 10.1016/j.ajogmf.2020.100100
24. Bertini A, Salas R, Chabert S, Sobrevia L, Pardo F. Using machine learning to predict complications in pregnancy: a systematic review. Front Bioeng Biotechnol. (2022) 9:780389. doi: 10.3389/fbioe.2021.780389
25. Van Den Bogaert K, Lannoo L, Brison N, Gatinois V, Baetens M, Blaumeiser B, et al. Outcome of publicly funded nationwide first-tier noninvasive prenatal screening. Genet Med. (2021) 23:1137–42. doi: 10.1038/s41436-021-01101-4
26. van Prooyen Schuurman L, Sistermans EA, Van Opstal D, Henneman L, Bekker MN, Bax CJ, et al. Dutch NIPT consortium. Clinical impact of additional findings detected by genome-wide non-invasive prenatal testing: Follow-up results of the TRIDENT-2 study. Am J Hum Genet. (2022) 109:1140–52. doi: 10.1016/j.ajhg.2022.04.018
27. Zhang J, Li J, Saucier JB, Feng Y, Jiang Y, Sinson J, et al. Non-invasive prenatal sequencing for multiple Mendelian monogenic disorders using circulating cell-free fetal DNA. Nat Med. (2019) 25:439–47. doi: 10.1038/s41591-018-0334-x
28. Chaemsaithong P, Sahota DS, Poon LC. First trimester preeclampsia screening and prediction. Am J Obstet Gynecol. (2022) 226(2S):S1071–97.e2. doi: 10.1016/j.ajog.2020.07.020
29. Petzold K, Jank A, Faber R, Stepan H. Relation between maternal angiogenic factors and utero-placental resistance in normal first- and second-trimester pregnancies. Hypertens Pregnancy. (2011) 30:401–7. doi: 10.3109/10641955.2010.506234
30. Faupel-Badger JM, Staff AC, Thadhani R, Powe CE, Potischman N, Hoover RN, et al. Maternal angiogenic profile in pregnancies that remain normotensive. Eur J Obstet Gynecol Reprod Biol. (2011) 158:189–93. doi: 10.1016/j.ejogrb.2011.05.001
31. Xiong Z, Wang X, Jiang S, Jin M, Chen W. Association between pentraxin-3 and the risk of preeclampsia: A meta-analysis. Medicine (Baltimore). (2020) 99:e20744. doi: 10.1097/MD.0000000000020744
Keywords: Preeclampsia, early pregnancy, biomarkers, PTX3, multiplex immunoassay, risk prediction, statistical modeling, 6PLEX
Citation: Ratnik K, Rull K, Aasmets O, Kikas T, Hanson E, Kisand K, Fischer K and Laan M (2022) Novel Early Pregnancy Multimarker Screening Test for Preeclampsia Risk Prediction. Front. Cardiovasc. Med. 9:932480. doi: 10.3389/fcvm.2022.932480
Received: 29 April 2022; Accepted: 17 June 2022;
Published: 27 July 2022.
Edited by:
Rossana Orabona, ASST Spedali Civili, ItalyReviewed by:
Enrico Vizzardi, University of Brescia, ItalyCopyright © 2022 Ratnik, Rull, Aasmets, Kikas, Hanson, Kisand, Fischer and Laan. This is an open-access article distributed under the terms of the Creative Commons Attribution License (CC BY). The use, distribution or reproduction in other forums is permitted, provided the original author(s) and the copyright owner(s) are credited and that the original publication in this journal is cited, in accordance with accepted academic practice. No use, distribution or reproduction is permitted which does not comply with these terms.
*Correspondence: Maris Laan, bWFyaXMubGFhbkB1dC5lZQ==
Disclaimer: All claims expressed in this article are solely those of the authors and do not necessarily represent those of their affiliated organizations, or those of the publisher, the editors and the reviewers. Any product that may be evaluated in this article or claim that may be made by its manufacturer is not guaranteed or endorsed by the publisher.
Research integrity at Frontiers
Learn more about the work of our research integrity team to safeguard the quality of each article we publish.