- 1The Key Laboratory of Cardiovascular Remodeling and Function Research, Chinese Ministry of Education, Chinese National Health Commission and Chinese Academy of Medical Sciences, The State and Shandong Province Joint Key Laboratory of Translational Cardiovascular Medicine, Department of Cardiology, Qilu Hospital of Shandong University, Cheeloo College of Medicine, Shandong University, Jinan, China
- 2Department of Cardiology, People’s Hospital of Qihe County, Dezhou, China
Background: Insulin resistance (IR) has emerged as a risk factor for coronary heart disease (CAD), but there is currently insufficient data on the association of non-insulin-based IR indexes [triglyceride (TG)/high-density lipoprotein cholesterol (HDL-C) ratio, triglyceride and glucose (TyG) index, and metabolic score for IR (METS-IR)] with the presence and severity of CAD. Thus, the present study aimed to examine the relationship between these three non-insulin-based IR indexes and CAD, as well as to further compare the predictive values of each index.
Materials and methods: In total, 802 consecutive patients who underwent coronary angiography for suspected CAD from January 2016 to April 2017 were included in this study and were divided into the control group (n = 149) and CAD group (n = 653) according to the angiography results. The triglyceride to high-density lipoprotein cholesterol (TG/HDL-C) ratio, triglyceride and glucose index (TyG index), and METS-IR were calculated according to the corresponding formulas. The severity of CAD was evaluated using the Gensini score (GS). The relationship of the TG/HDL-C ratio, TyG index, and METS-IR with CAD was analyzed, and the predictive values of the indexes were compared.
Results: The TG/HDL-C ratio, TyG index, and METS-IR in the CAD group were significantly higher than those in the control group. The TG/HDL-C ratio and METS-IR in the high GS group were significantly higher than those in the non-high GS group. Multivariate logistic regression analysis showed that the TG/HDL-C ratio and METS-IR were independent predictors for the presence of CAD {adjusted odds ratio (OR) [95% confidence interval (CI)]: 1.32 (1.02–1.70) and 1.65 (1.32–2.05), respectively}, whereas only the METS-IR was an independent predictor of the severity of CAD [adjusted OR (95% CI): 1.22 (1.02–1.47)]. Further subgroup analysis indicated that statistical significance was observed only among men, younger patients (≤ 60), and patients with prediabetes mellitus (PDM). Receiver operator characteristic (ROC) analysis showed that the METS-IR had the highest predictive value for the prediction of both the presence and severity of CAD.
Conclusion: The TG/HDL-C ratio, TyG index, and METS-IR are valuable predictors of the presence and severity of CAD, and the METS-IR has the highest predictive value among the three non-insulin-based IR indexes.
Introduction
Despite ongoing advances in the prevention, diagnosis, and treatment of atherosclerosis, coronary artery disease (CAD) remains one of the leading causes of death, disability, and high healthcare costs worldwide (1, 2). Therefore, it is crucial to identify novel predictors for CAD. There is a growing body of evidence showing that insulin resistance (IR), which is a prominent characteristic of the metabolic syndrome and type 2 diabetes mellitus (T2DM), may also be involved in the pathogenesis of CAD (3–5). The gold standard for the assessment of insulin action in vivo is the hyperinsulinemic–euglycemic clamp technique (6), but its clinical use is limited due to experimental complexity and high cost (7). The most widely used method for the evaluation of insulin sensitivity is homeostasis model assessment for IR (HOMA-IR) (8), which is easily affected by the limited precision of insulin measurements (7). In this regard, some non-insulin-based IR indexes, such as the triglyceride to high-density lipoprotein cholesterol (TG/HDL-C) ratio, triglyceride and glucose index (TyG index), and the metabolic score for IR (METS-IR), have been evaluated as surrogates for IR (9–11). These novel indicators are calculated using simple routine biochemical tests, and they compensate for the shortcomings of traditional IR assessment methods. Previous studies have shown that non-insulin-based IR indexes are associated with multiple risk factors of cardiovascular disease (CVD), such as hypertension, diabetes, obesity, and metabolic syndrome, and they also predict the incidence and prognosis of CVD (12–16). To our knowledge, no research has specifically focused on the relationship between these three non-insulin-based IR indexes and the severity of CAD. Therefore, we aimed to investigate the value of the TG/HDL-C ratio, TyG index, and METS-IR in predicting the risk and severity of CAD in this cross-sectional study.
Materials and methods
Study population
The present study complied with the Declaration of Helsinki and was approved by the Ethics Review Committee of Qilu Hospital of Shandong University. All patients provided informed consent.
This was an observational study involving patients with known or suspected CAD who underwent coronary angiography at Qilu Hospital of Shandong University between January 2016 and April 2017. A total of 1,137 consecutive patients were examined. The exclusion criteria were as follows: history of previous coronary intervention or coronary artery bypass graft, severe valvular heart disease, decompensated heart failure, non-ischemic dilated cardiomyopathy, cerebrovascular disease, symptomatic peripheral arterial disease, renal or hepatic disease (serum creatinine > 1.4 mg/dl or liver function parameters > 3 times the upper normal value), acute or chronic infection and/or inflammation, chronic obstructive lung disease, thyroid and adrenal cortex dysfunction, malignancy, hematologic disease, autoimmune disease, or incomplete medical records. Finally, a total of 802 patients were enrolled in the present study. According to our pre-experimental results, we selected the research factor with the smallest OR (the TyG index) to calculate the sample size. Considering α = 0.05, β = 0.20, and OR = 1.30, a sample size of 603 was required. The sample size of the present study exceeded the calculated sample size.
Data collection
Clinical data, including patients’ demographic data, medical history, laboratory tests, and basic cardiovascular medication information, were collected from medical records by trained clinicians. Resting systolic blood pressure (SBP) and diastolic blood pressure (DBP) were measured three times on the right arm and the mean value was considered as the participant’s blood pressure. All blood samples of subjects were collected in the morning after overnight fasting (8 h minimum). The levels of fasting plasma glucose (FPG), glycated hemoglobin (HbA1c), total cholesterol (TC), triglyceride (TG), low-density lipoprotein cholesterol (LDL-C), high-density lipoprotein cholesterol (HDL-C), serum creatinine (SCr), and uric acid (UA) were measured using an automatic biochemical analyzer.
Definition of terms
Body mass index (BMI) was calculated as weight (kg) divided by the square of height (m2). Family history of CAD (FH-CAD) was defined as a history of CAD in a first-degree relative < 55 years (male) or <65 years (female). Hypertension was defined as either repeated blood pressure measurements of a SBP≥140 mmHg and/or a DBP≥90 mmHg at rest or the use of antihypertensive medication. According to the American Diabetes Association’s Standards of Medical Care in Diabetes (17), diabetes mellitus (DM) was defined as FPG≥7.0 mmol/L, random blood glucose (RBG)≥11.1 mmol/L, 2 h plasma glucose after oral glucose tolerance test (OGTT)≥11.1 mmol/L, plasma HbA1c of ≥ 6.5%, or the use of insulin or oral hypoglycemic agents, and prediabetes mellitus (PDM) was defined as 5.6 mmol/L≤FPG < 7.0 mmol/L, 7.8 mmol/L≤2 h plasma glucose < 11.1 mmol/L, or plasma HbA1c of ≥ 5.7% but <6.5%. The estimated glomerular filtration rate (eGFR) was calculated using SCr according to the Chinese modified Modification of Diet in Renal Disease equation as follows (18): eGFR(mL/min/1.73m2) = 175×SCr(mg/dL)−1.234×age(year)−0.179×0.79(iffemale). Non-insulin-based IR indexes were calculated by the following formulas: TyG=Ln[fastingTG(mg/dL)×FPG(mg/dL)÷2] (19); TG/HDL−C=TG(mg/dL)÷HDL−C(mg/dL) (10); and METS−IR=ln[(2×FPG(mg/dL)) + fastingTG(mg/dL)]×BMI(kg/m2)÷Ln[HDL−C(mg/dL)] (11).
Coronary angiography
Standard Judkins technique was used for coronary angiography. At least two different plane images were taken for each coronary artery. The results were analyzed by at least two experienced interventional cardiologists. CAD was defined as the presence of obstructive stenosis of >50% of the vessel lumen diameter in any of the main coronary arteries, including the left main coronary artery (LM), left anterior descending artery (LAD), left circumflex coronary artery (LCX), and right coronary artery (RCA), or main branches of the vascular system. The severity of CAD was evaluated by the Gensini score (GS) (20) according to the following scale: 1 point, <25% narrowing; 2 points, 26–50% narrowing; 4 points, 51–75% narrowing; 8 points, 76–90% narrowing; 16 points, 91–99% narrowing; and 32 points, total occlusion. Each segment was followed by a multiplying factor depending on the functional significance of the area supplied by that segment as follows: 5 for LM; 2.5 for the proximal segment of LAD and LCX; 1.5 for the middle segment of LAD; 1 for the distal segment of LAD, LCX, first diagonal branch, first obtuse marginal branch, RCA, and posterior descending artery; and 0.5 for other segments. The patients with angiographically defined CAD were divided into three groups based on the tertile of the GS as follows: low GS, <32 points (n = 221); intermediate GS, 32–64 points (n = 215); and high GS, 32–64 points (n = 217).
Statistical analysis
Statistical analysis was performed using SPSS version 25.0 (SPSS, Chicago, IL, United States) and R software version 4.1.3 (R Foundation for Statistical Computing, Vienna, Austria). Receiver operator characteristic (ROC) curves were generated by MedCalc software version 19.6.4 (MedCalc Software Ltd., Ostend, Belgium). PASS version 15.0.1 (NCSS Statistical Software) was used for the sample size calculation. Continuous variables with a normal distribution are presented as the mean ± standard deviation (SD), and continuous variables with non-normal distribution are presented as the median with the 25th and 75th percentiles. Categorical variables are presented as the number and percentage. Independent samples t-test or analysis of variance (ANOVA) was used to compare continuous variables with a normal distribution. For continuous variables with non-normal distribution, Mann–Whitney U test or Kruskal–Wallis H test was used. Categorical variables were analyzed using the chi-squared test or Fisher’s exact test. The association between GS and non-insulin-based IR indexes was assessed using Spearman’s correlation analysis. Variables were analyzed by univariate logistic regression analysis, and variables < 0.1 in univariate analysis were included in the multivariate logistic regression analysis. The variance inflation factor (VIF) of the variables included in the models was calculated to avoid the result deviation caused by multicollinearity. No evidence of collinearity was found in the models given a VIF≥1.32. We standardized the TG/HDL-C ratio, TyG index, and METS-IR using regression analysis to determine the relationships between the increase of non-insulin-based IR indexes per SD and the presence and severity of CAD. We also performed a subgroup analysis based on gender, age, and DM state to determine the association between the METS-IR and the severity of CAD differed across various subgroups, and p for interaction was calculated. ROC curves were generated for the TG/HDL-C ratio, TyG index, and METS-IR. The maximum Youden index was used to determine the optimal cutoff value. The area under the curve (AUC) was used to compare the diagnostic utility of the presence of CAD and a high GS. A p-value of less than 0.05 was considered statistically significant.
Results
Baseline characteristics
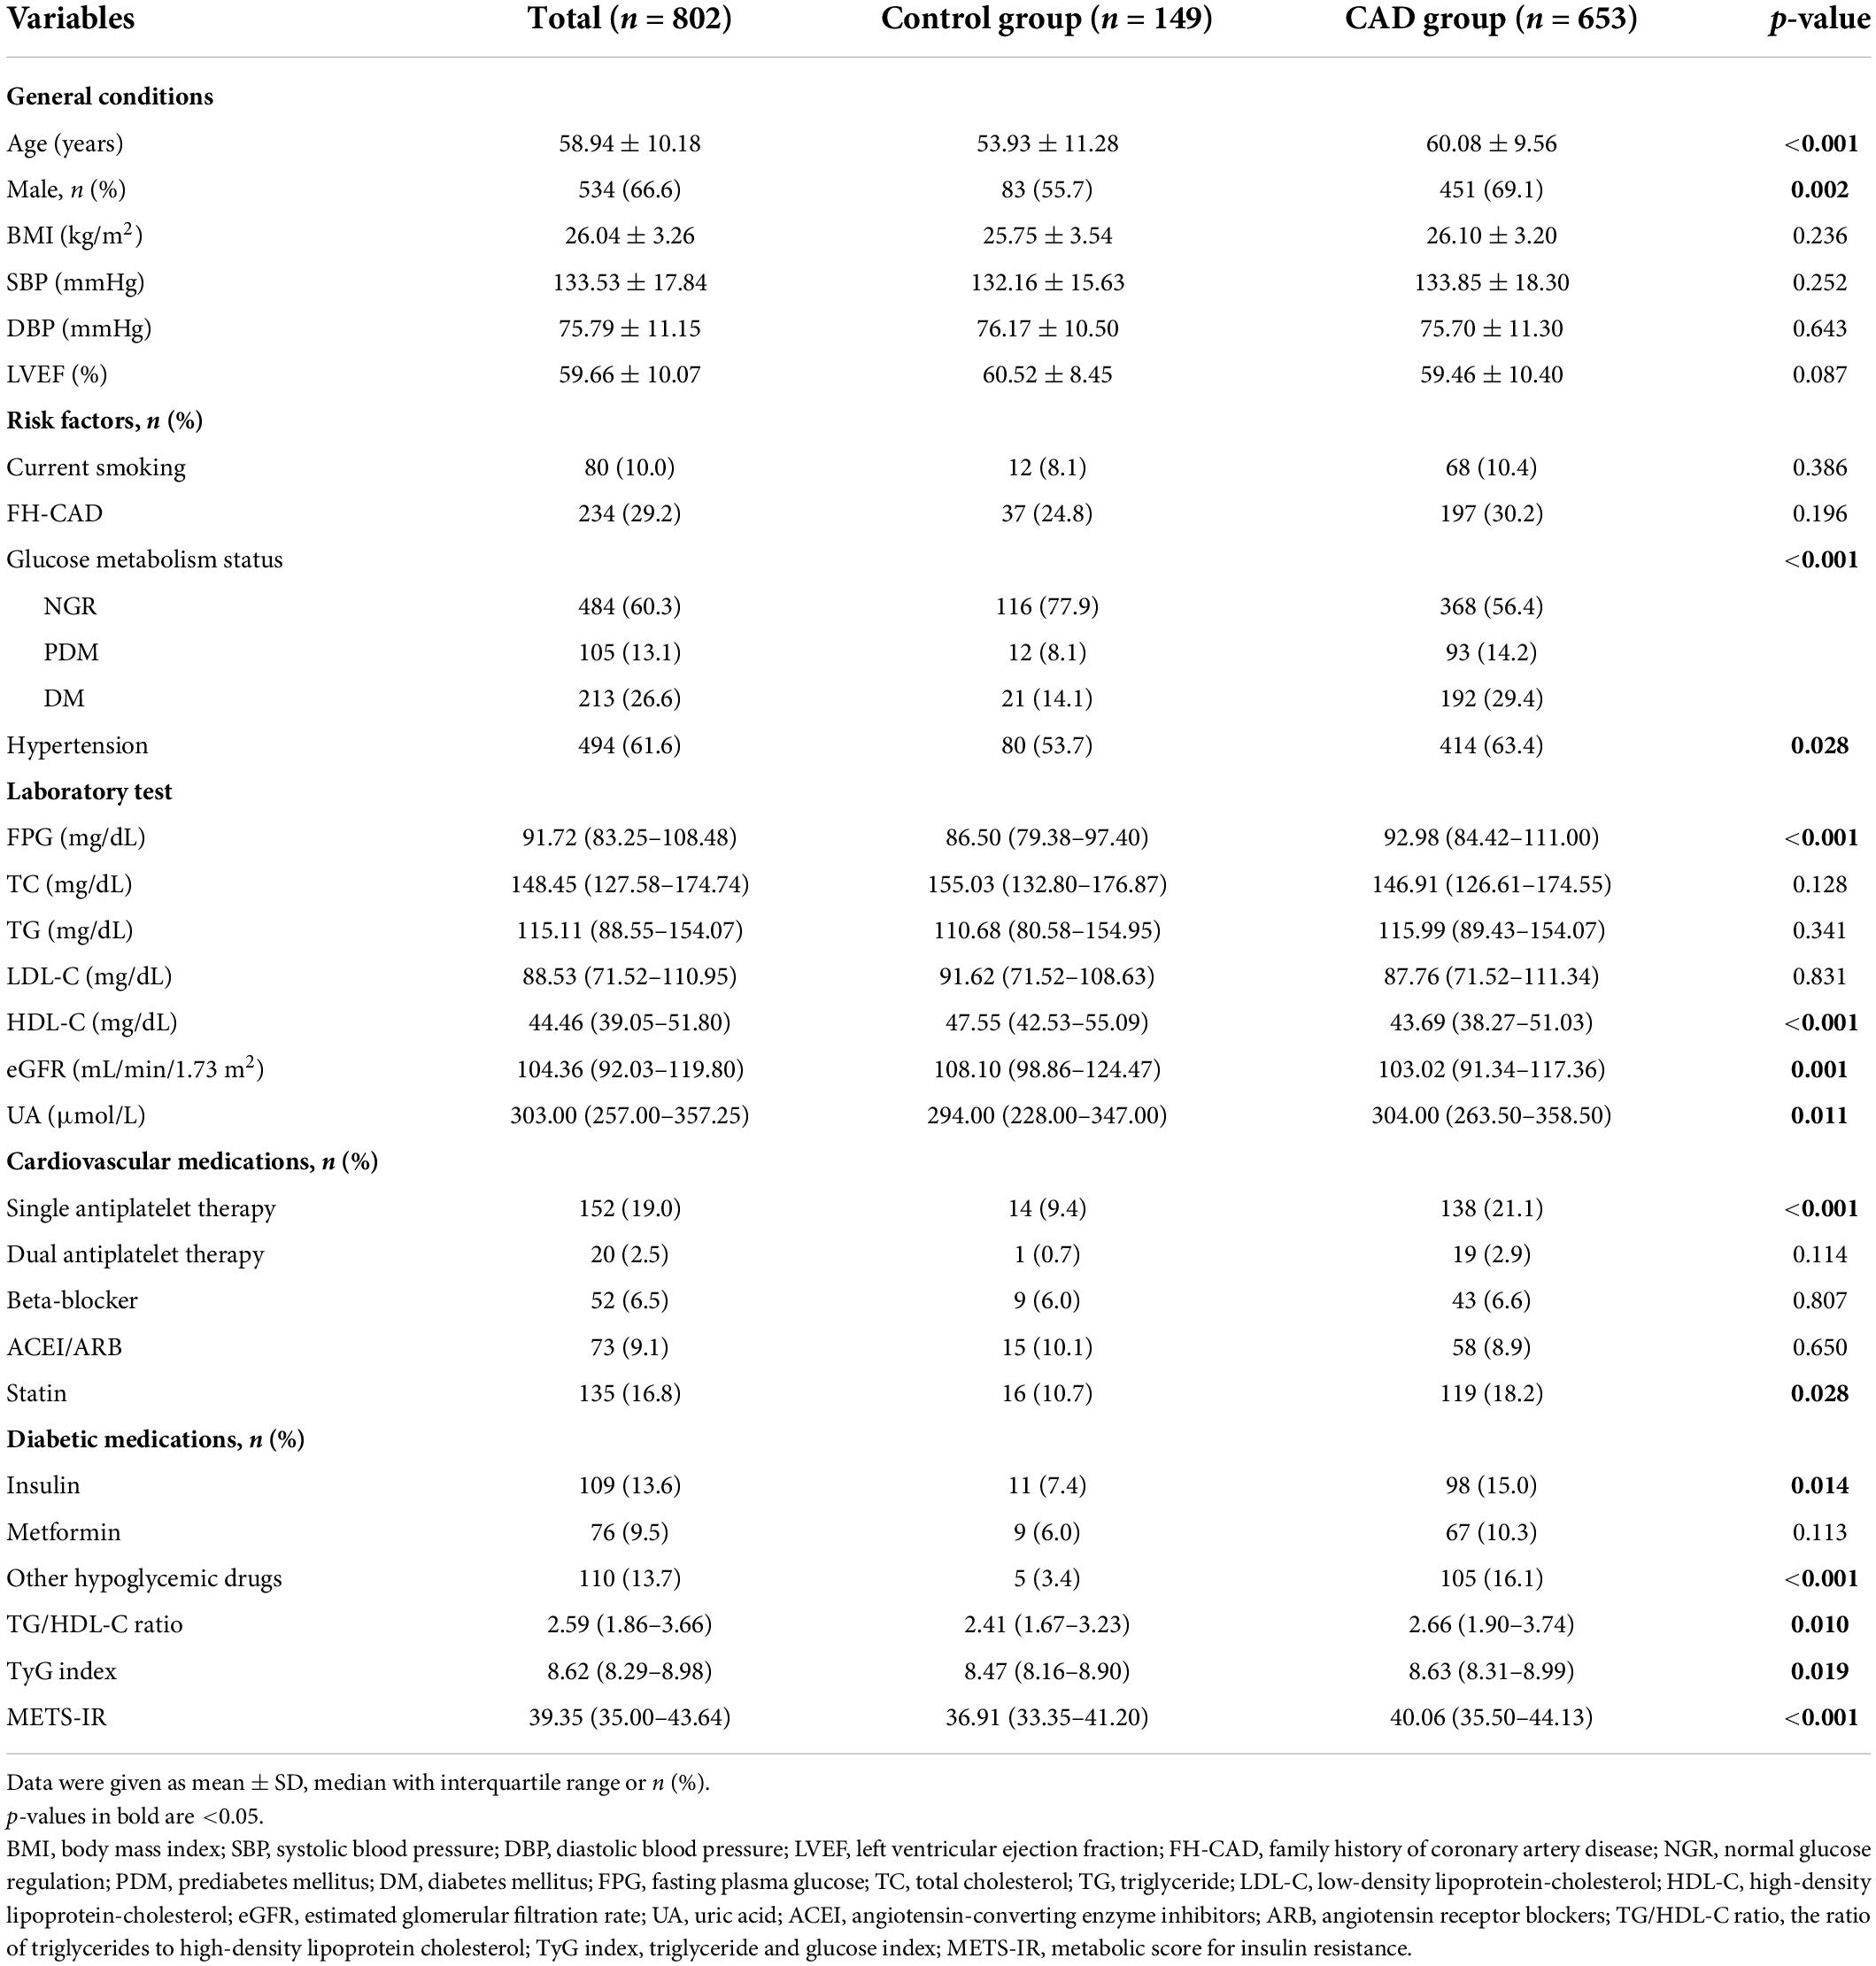
In total, 802 patients were enrolled in the present study, including 653 patients with angiographically defined CAD (CAD group) and 149 patients with normal coronary angiography (control group). The baseline clinical and demographic characteristics are shown in Table 1. A comparison between the CAD group and the control group revealed no significant difference in BMI, SBP, DBP, LVEF, smoking status, FH-CAD, glucose metabolism status, TC, TG, and LDL-C. However, age, FPG, and UA were higher in the CAD group than in the control group, whereas the HDL-C and eGFR were lower among subjects with CAD. In addition, the percentages of men, hypertension, and cardiovascular medication use were higher in the CAD group compared to the control group. Moreover, the CAD group presented a significantly higher TG/HDL-C ratio, TyG index, and METS-IR compared to the control group [2.66 (1.90–3.74) vs. 2.41 (1.67–3.23), p = 0.010; 8.63 (8.31–8.99) vs. 8.47 (8.16–8.90), p = 0.019; 40.06 (35.50–44.13) vs. 36.91 (33.35–41.20), p < 0.001, respectively].
The patients with CAD were categorized into three groups according to their GS as follows: low GS, <32 points (n = 221); intermediate GS, 32–64 points (n = 215); and high GS, 32–64 points (n = 217). The baseline characteristics according to the tertile of the GS are summarized in Table 2. As shown in Table 2, there were significant differences in gender, LVEF, glucose metabolism status, HDL-C, FH-CAD frequency, and METS-IR. However, no statistical difference was observed in the TG/HDL-C ratio and TyG index among the groups based on the tertile of GS (p = 0.115 and 0.119, respectively). More importantly, the TG/HDL-C ratio and METS-IR were significantly different between the high GS group and non-high GS group (p = 0.039 and 0.001, respectively), whereas the TyG index showed no statistical difference (p = 0.093) (Figure 1).
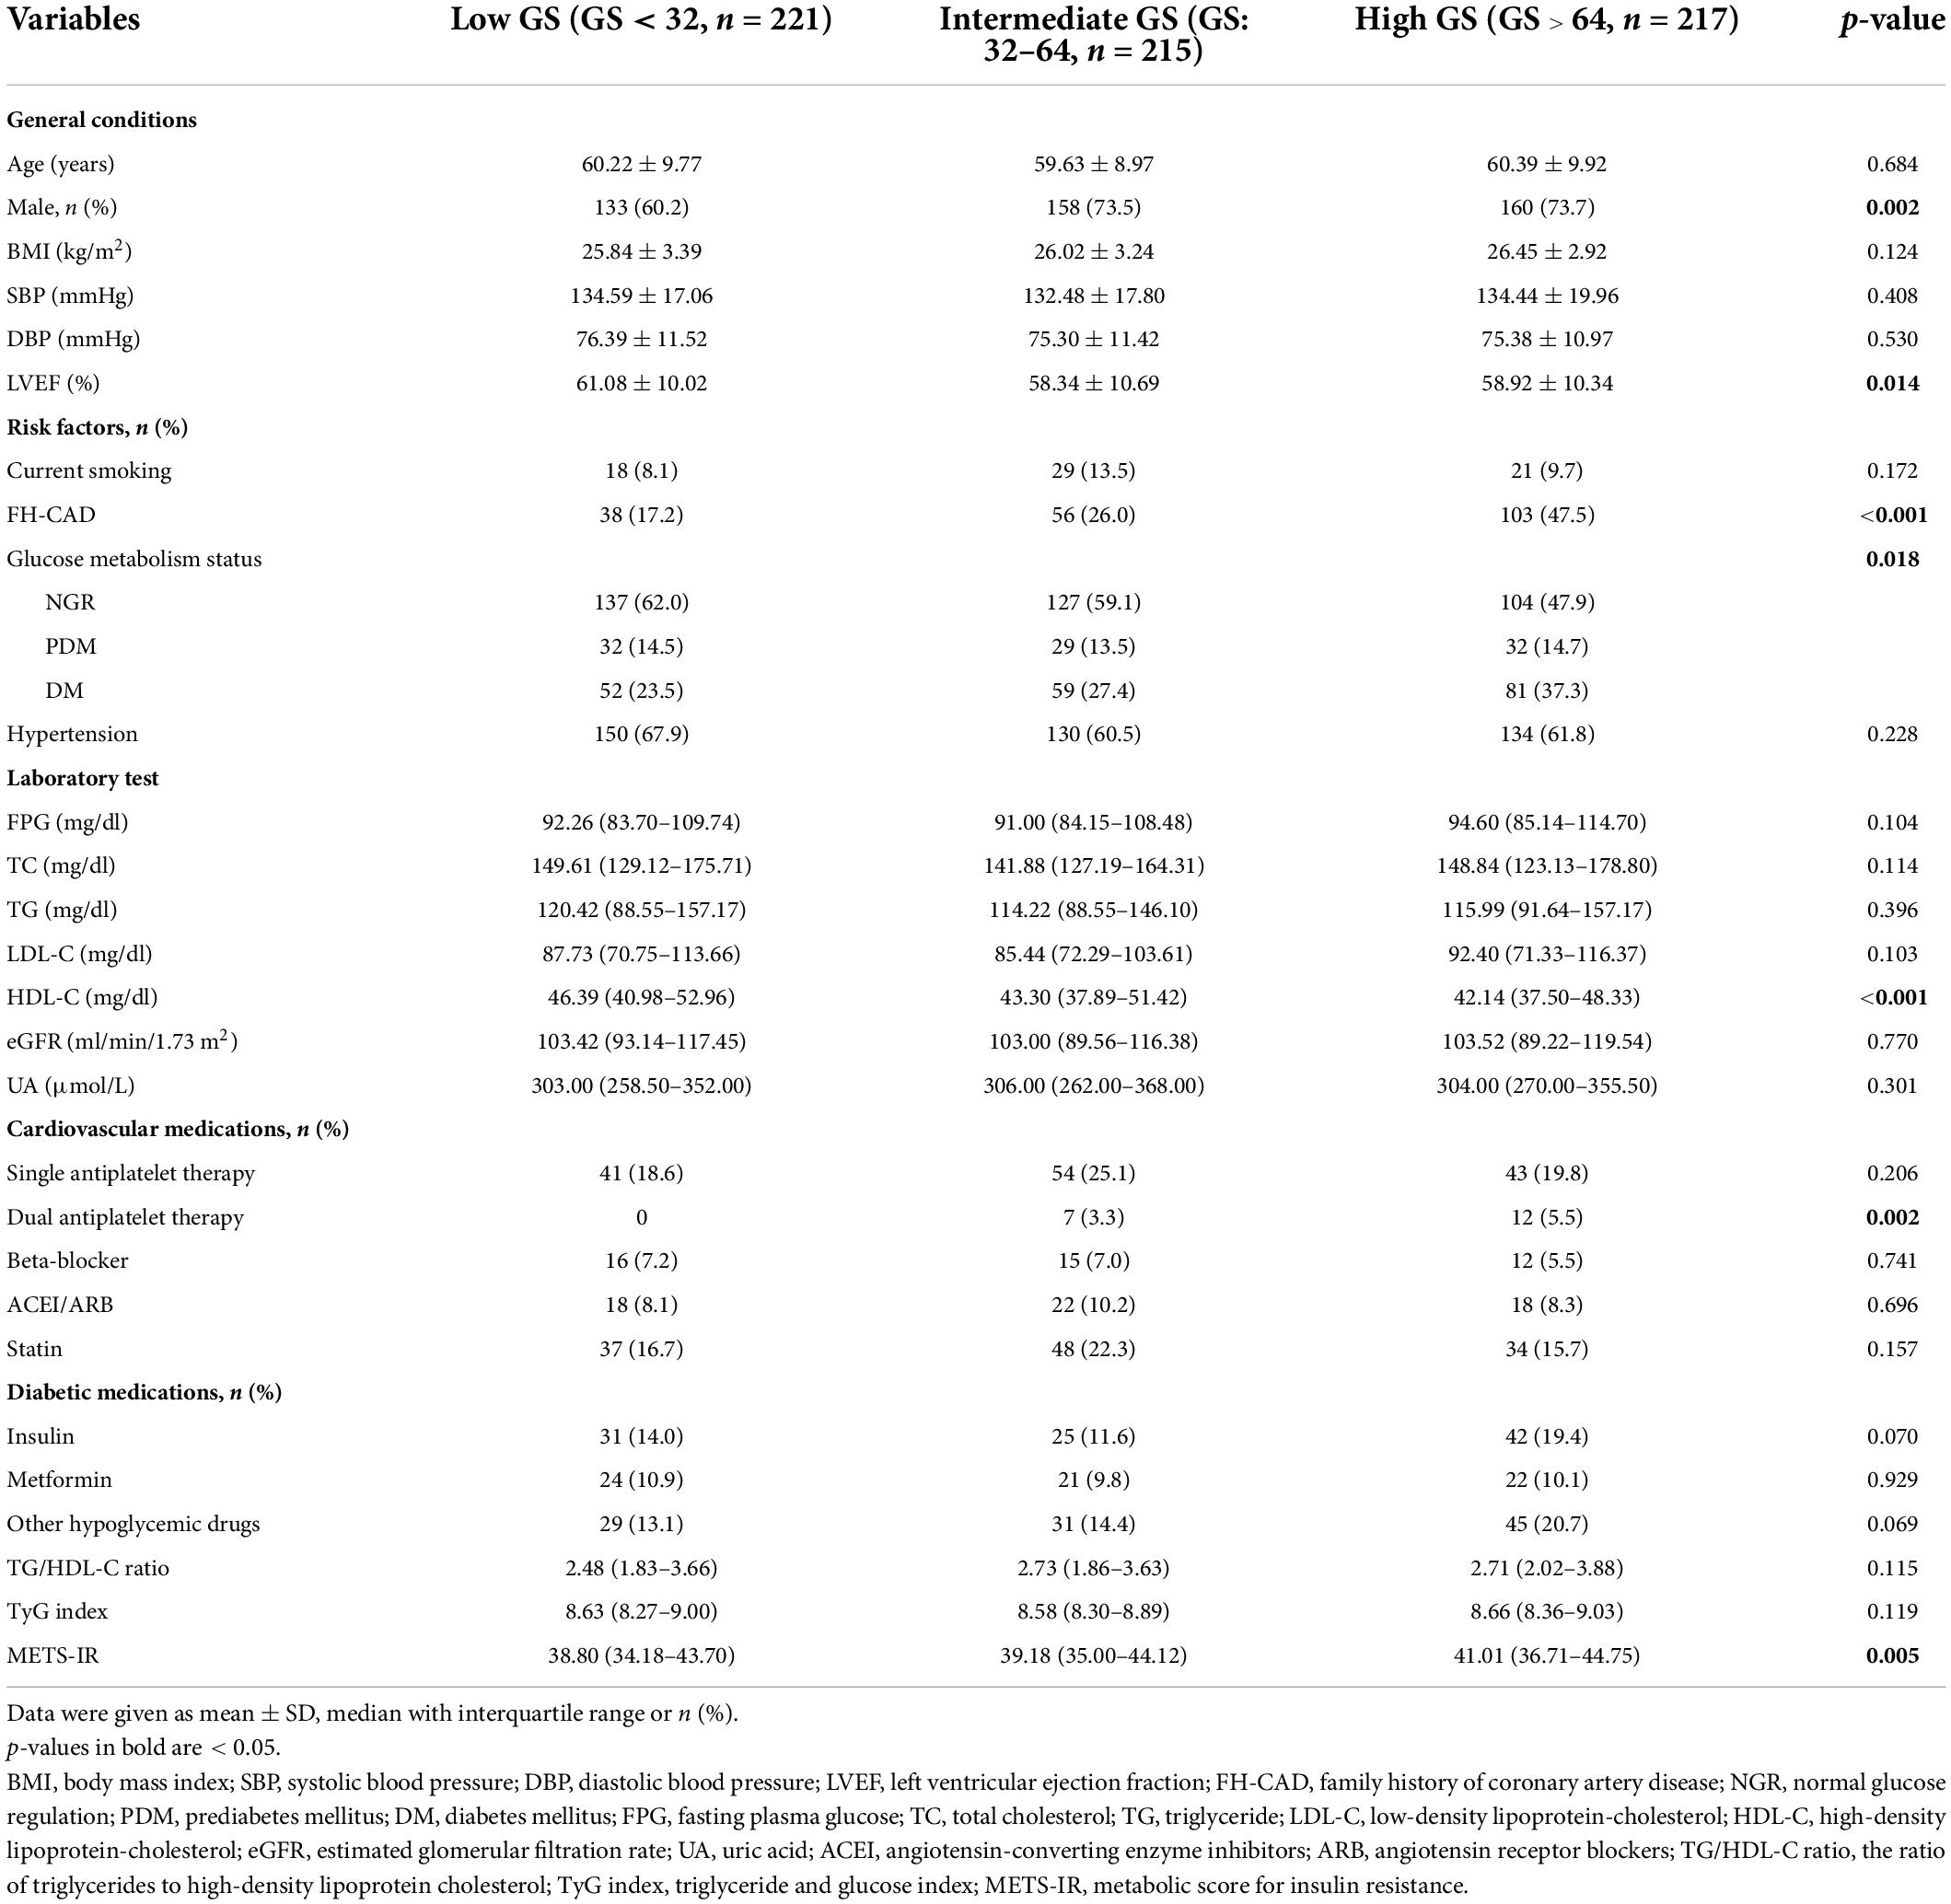
Table 2. Baseline characteristics of the study population according to the tertile of the Gensini score.

Figure 1. Comparison of the TG/HDL-C ratio, TyG index, and METS-IR between the high GS group and the non-high GS group. GS, Gensini score; TG/HDL-C ratio, the ratio of triglycerides to high-density lipoprotein cholesterol; TyG index, triglyceride and glucose index; METS-IR, metabolic score for insulin resistance. *p < 0.05; **p < 0.01.
In addition, the baseline characteristics were described according to the glucose metabolism status. As shown in Supplementary Table 1, patients with PDM and DM had higher percentages of CAD and higher GS, TG/HDL-C ratio, TyG index, and METS-IR (Supplementary Table 1). The patients with DM were further grouped by metformin use. The proportion of CAD was similar in the two groups, whereas patients with metformin had a lower GS. Moreover, the differences in the TG/HDL-C ratio, TyG index, and METS-IR between the two groups were not statistically significant (Supplementary Table 2).
Correlations among triglyceride to high-density lipoprotein cholesterol ratio, triglyceride and glucose index, metabolic score for insulin resistance, and Gensini score
We used Spearman’s correlation analyses to examine the correlations of the TG/HDL-C ratio, TyG index, and METS-IR with GS in patients with CAD. As shown in Figure 2, the GS was significantly positively correlated with the TG/HDL-C ratio and METS-IR (r = 0.087, p = 0.027; r = 0.151, p < 0.001, respectively). No significant correlation was observed between the TyG index and GS (r = 0.042, p = 0.288) (Figure 2).

Figure 2. Correlations between the TG/HDL-C ratio, TyG index, METS-IR, and the GS. GS, Gensini score; TG/HDL-C ratio, the ratio of triglycerides to high-density lipoprotein cholesterol; TyG index, triglyceride and glucose index; METS-IR, metabolic score for insulin resistance. *p < 0.05; ***p < 0.001.
Univariate and multivariate analyses
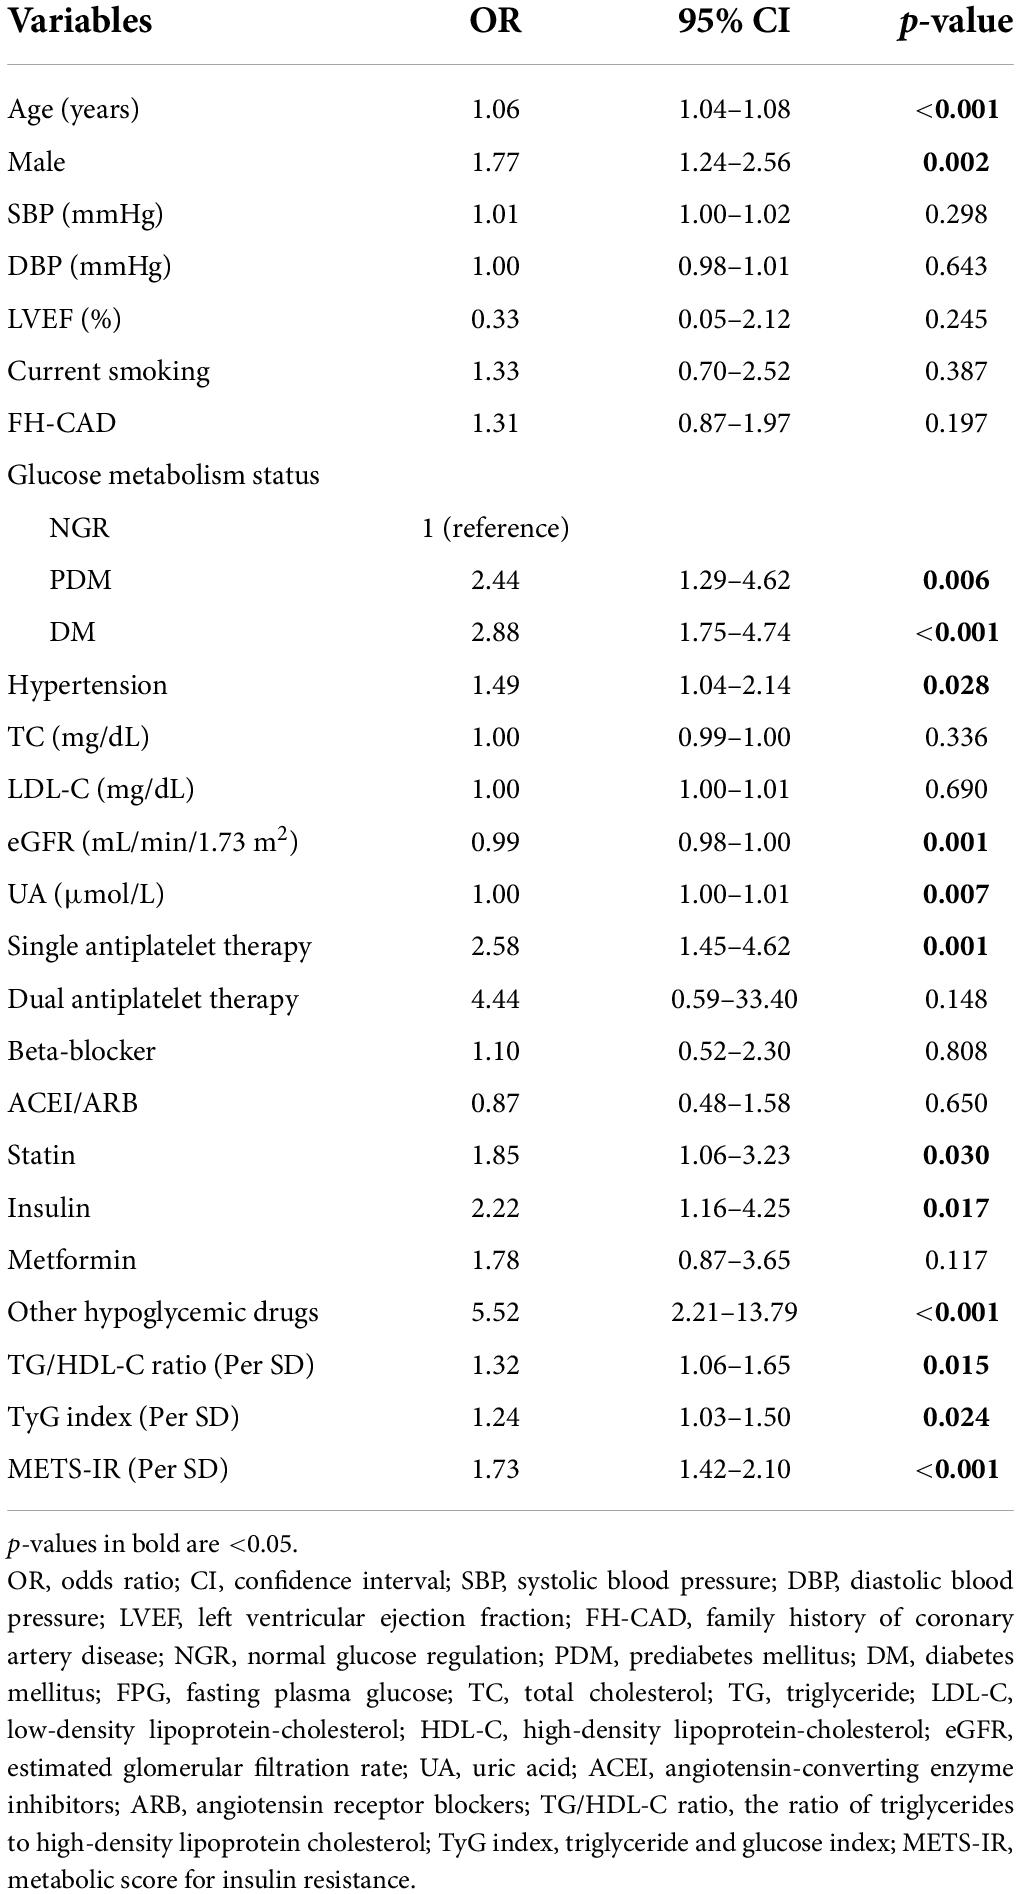
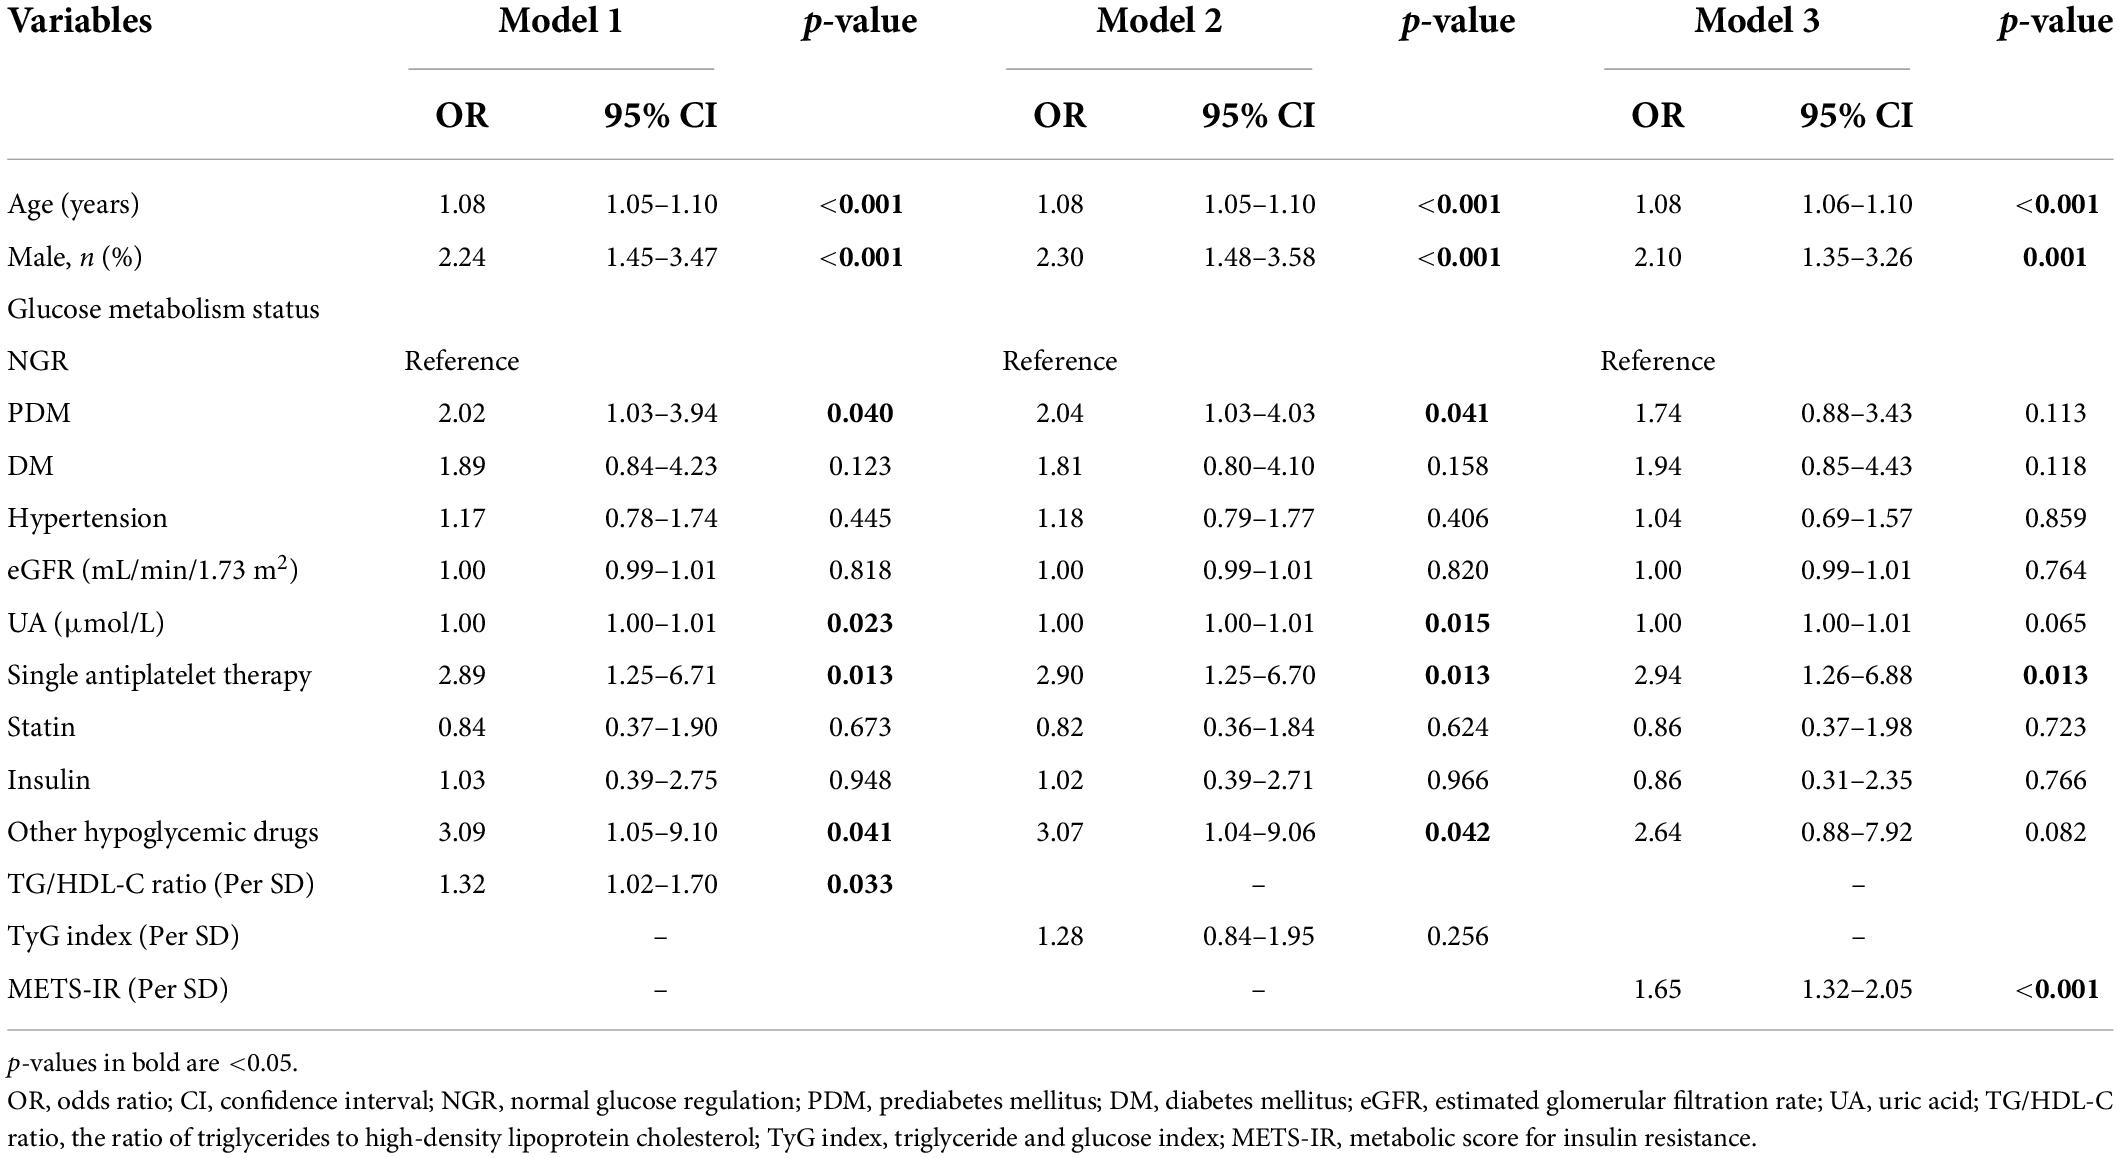
Univariate analysis demonstrated that the following factors were associated with the presence of CAD: age; gender; glucose metabolism status; hypertension; eGFR; UA; single antiplatelet therapy; use of statin, insulin, and other hypoglycemic drugs; TG/HDL-C ratio; TyG index; and METS-IR (Table 3). Multivariate logistic regression analysis showed that the TG/HDL-C ratio and METS-IR remained significant after adjusting for confounders. For each SD increase in the TG/HDL-C ratio and METS-IR, the adjusted OR (95% CI) was 1.32 (1.02–1.70) and 1.65 (1.32–2.05), respectively. In addition, age, male, glucose metabolism status, UA, single antiplatelet therapy, and the use of hypoglycemic drugs were independently associated with the present of CAD. However, the TyG index was not an independent predictor for CAD (Table 4).
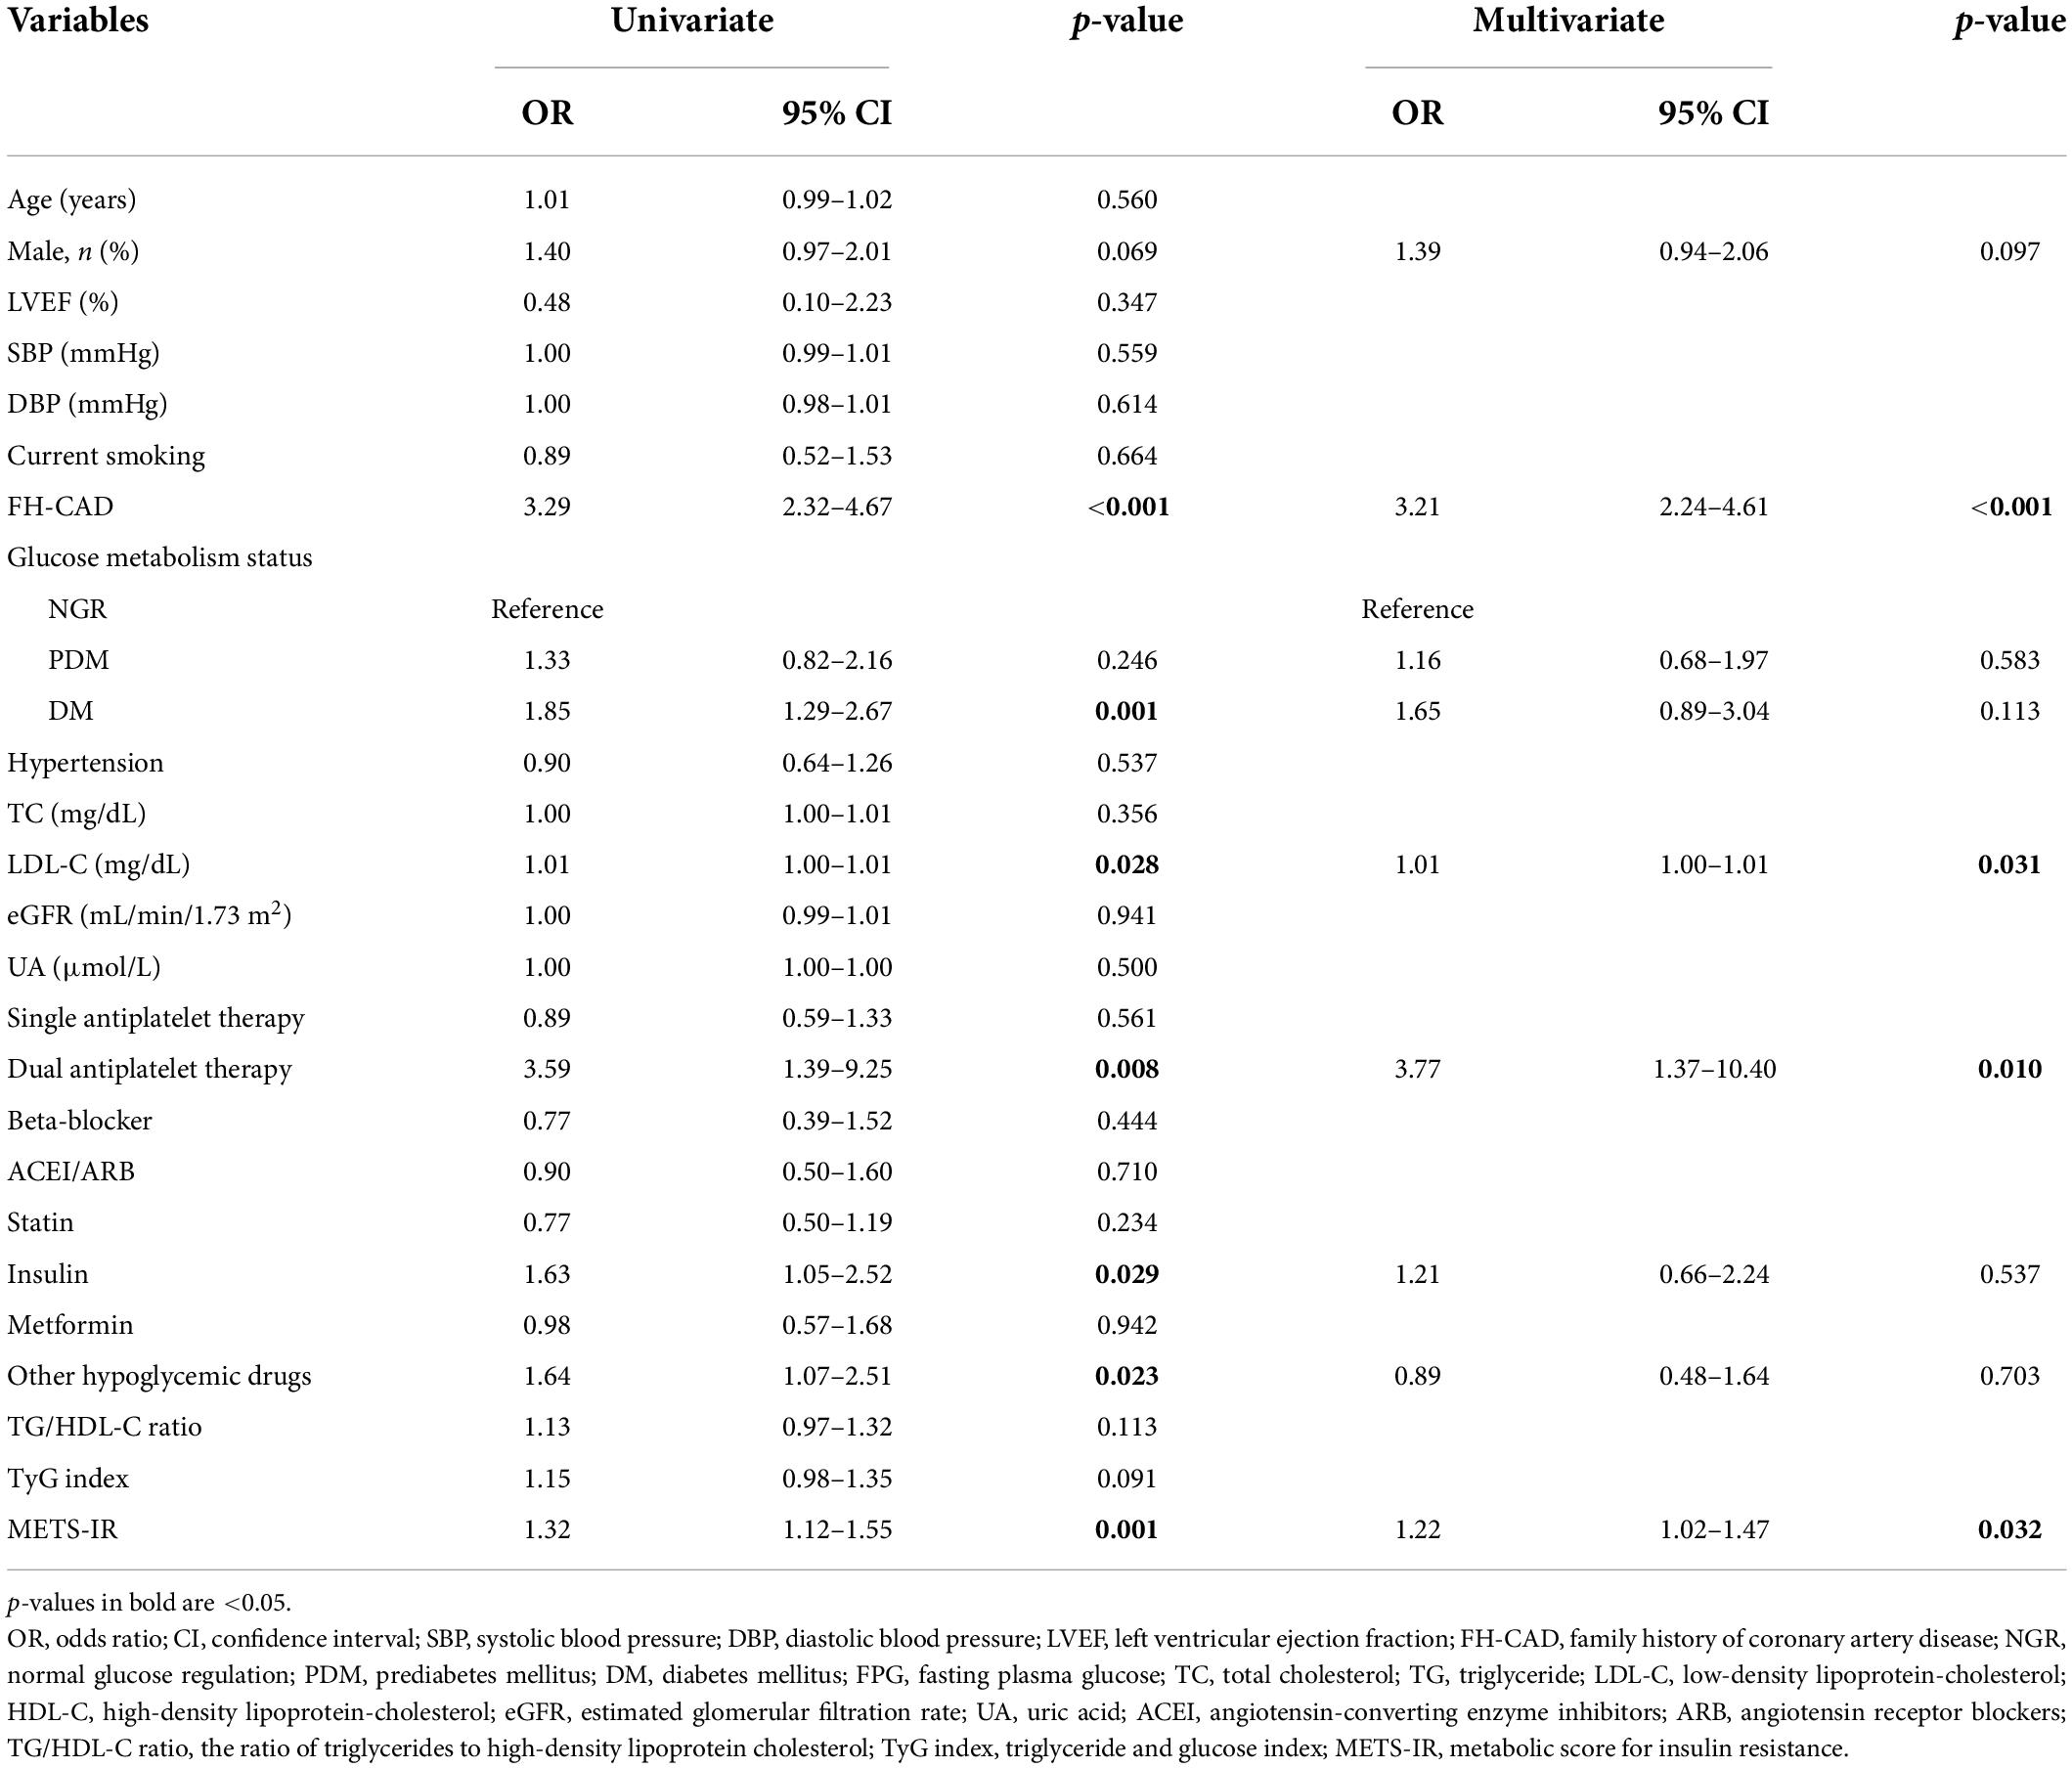
The results of multivariate logistic regression analysis for predicting high GS suggested that only the METS-IR was an independent predictor of the severity of CAD (Table 5). For each SD increase in the METS-IR, the adjusted OR (95% CI) was 1.22 (1.02–1.47). Furthermore, FH-CAD, LDL-C, and dual antiplatelet therapy were independent predictors of high GS (Table 5).
Subgroup analyses
The association between the METS-IR and the severity of CAD was examined by subgroup analyses. Although no interaction was found between age, gender, glucose metabolism status, and METS-IR for the high GS in multivariate analysis (all p-values for interaction≥0.306), the statistical significance was observed only among men, the younger age group (≤ 60), and patients with PDM (Figure 3).
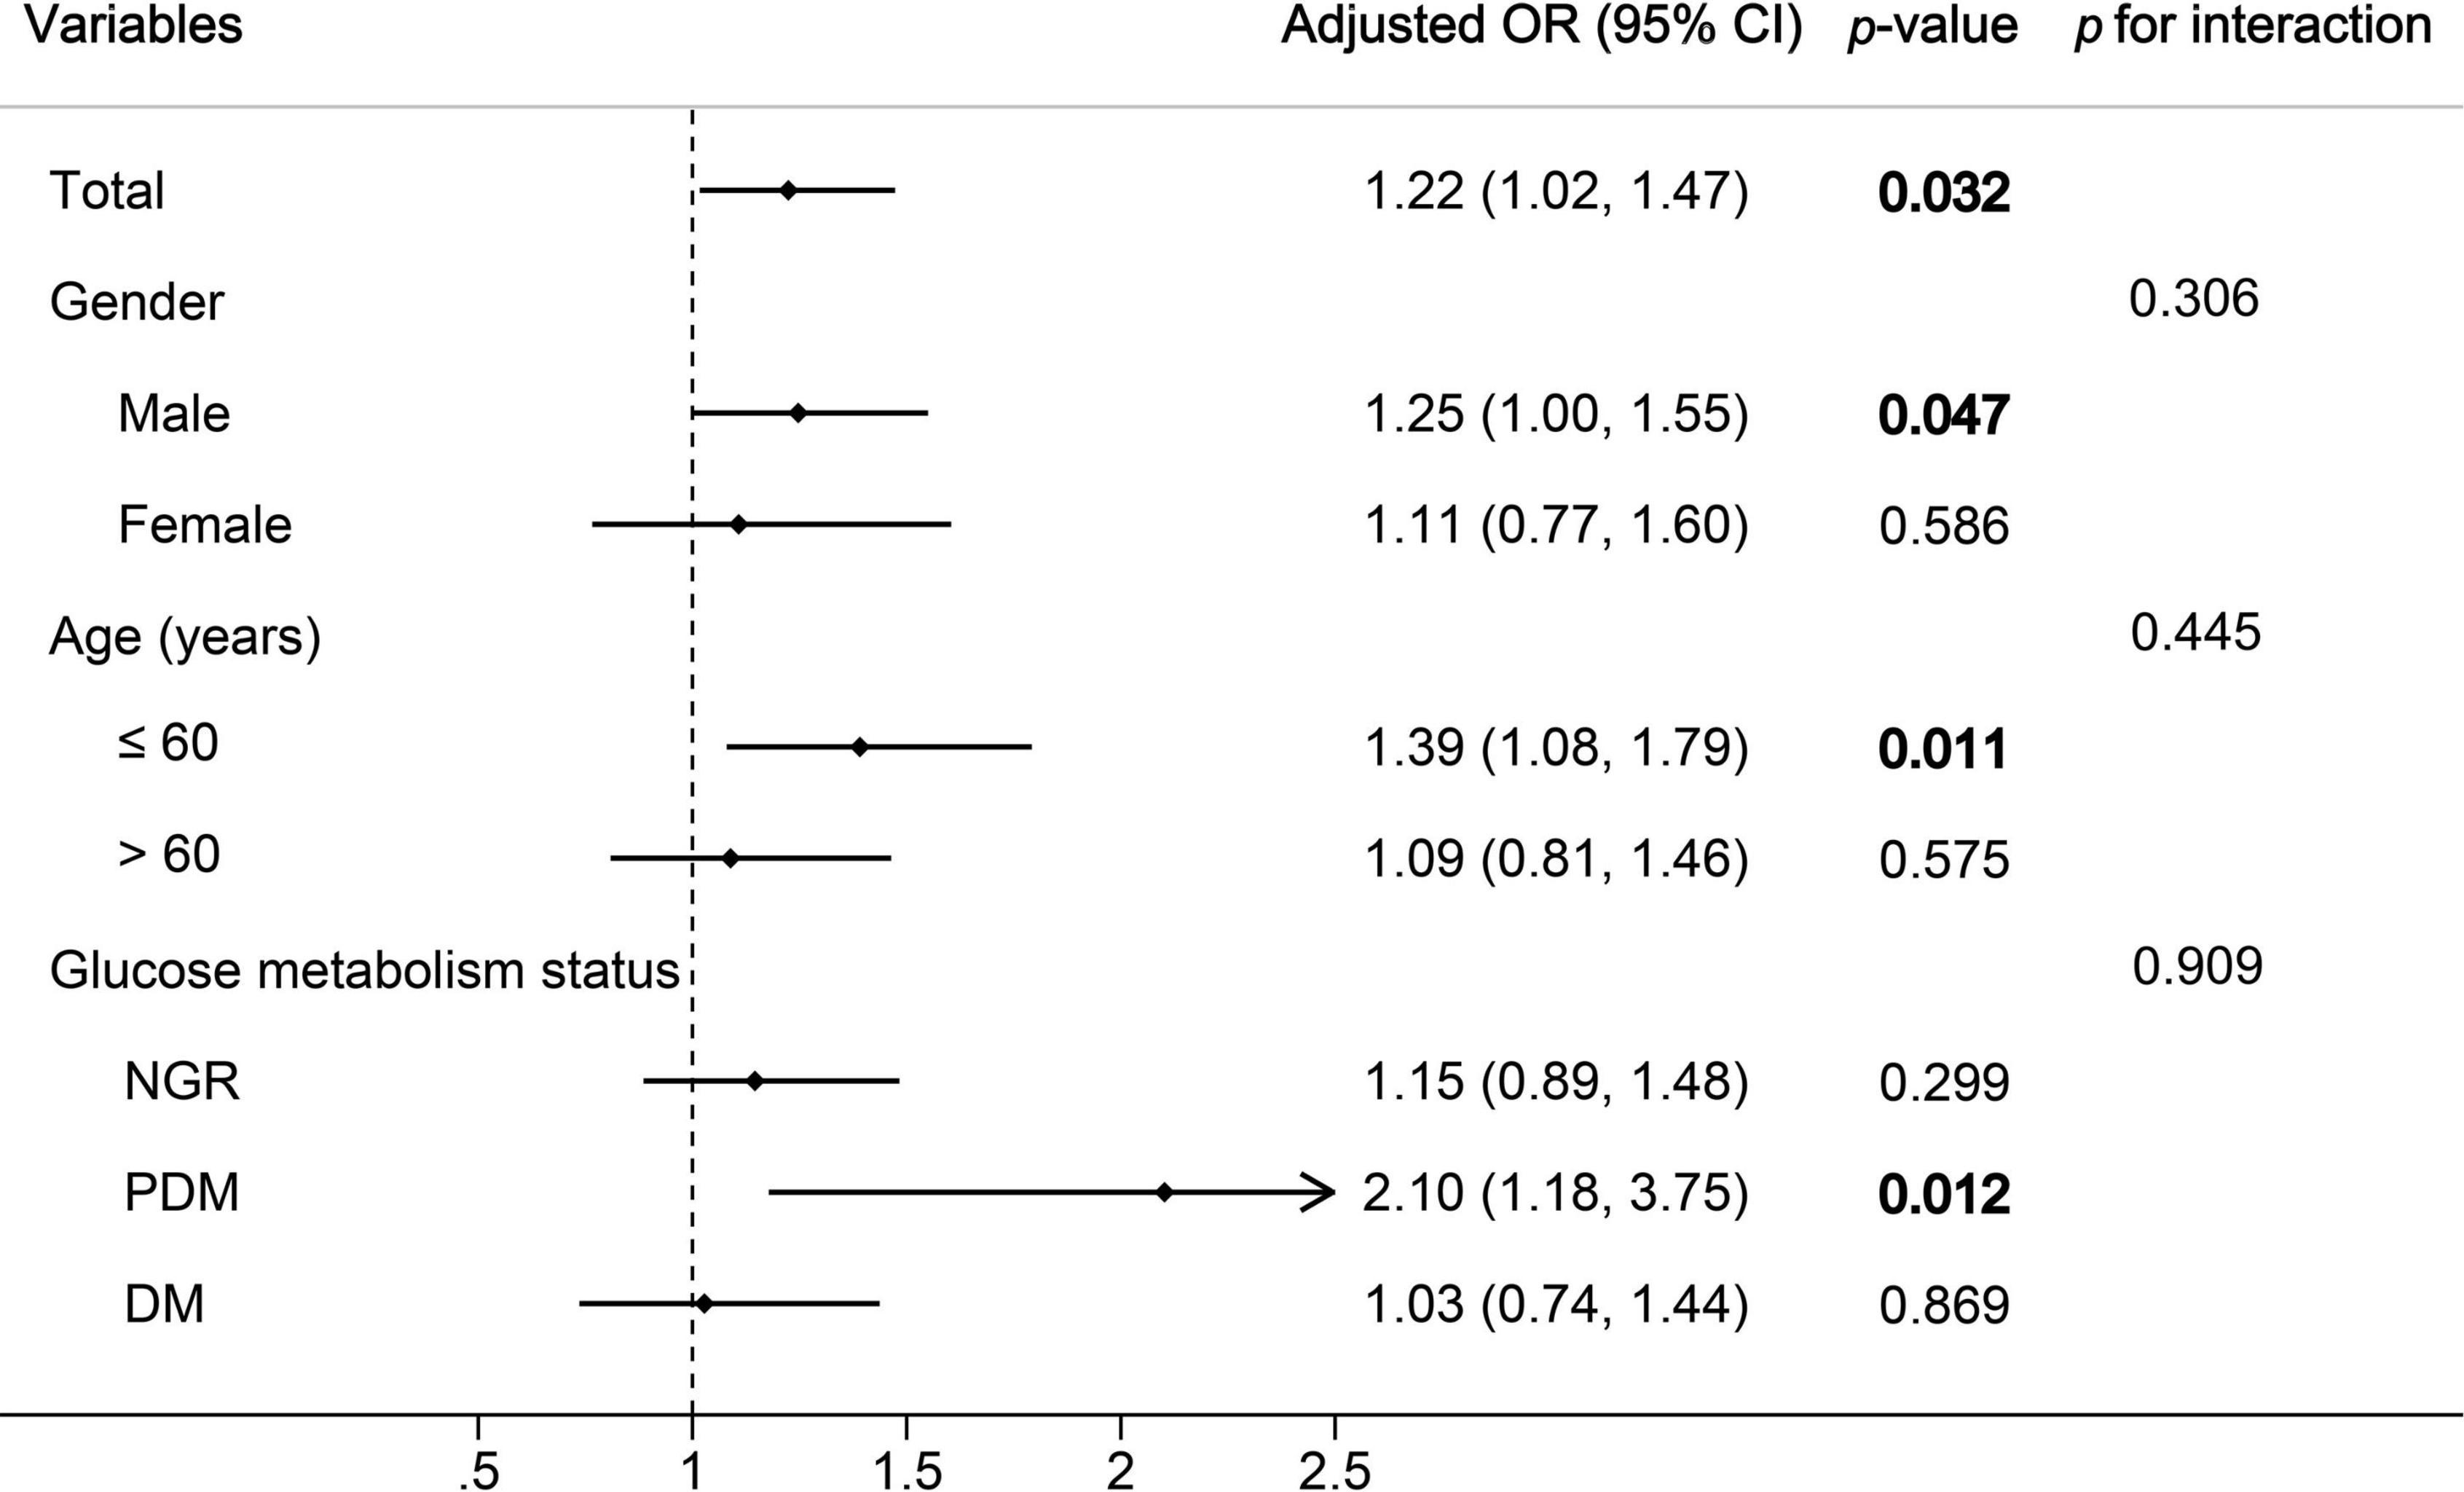
Figure 3. Subgroup and interaction analyses between the METS-IR (Per SD) and high GS across various subgroups. OR, odds ratio; CI, confidence interval; GS, Gensini score; NGR, normal glucose regulation; PDM, prediabetes mellitus; DM, diabetes mellitus. p-values in bold are <0.05.
Receiver operator characteristic curve analysis
The ROC analysis demonstrated that the optimal cutoff values of the TG/HDL-C ratio, TyG index, and METS-IR for predicting the presence of CAD were 2.9, 8.3, and 42.1 respectively. While comparing the predictive power, the METS-IR [AUC (95%CI): 0.636 (0.589–0.683)] demonstrated the highest AUC value compared to the TG/HDL-C ratio [0.567 (0.517–0.618)] and TyG index [0.562 (0.509–0.614)] (Figure 4 and Table 6). For the prediction of high GS (GS > 64), the METS-IR had the highest AUC at 0.606 (95% CI: 0.564–0.648, p < 0.001) among the non-insulin-based IR indexes. In addition, the METS-IR of 38.2 was identified as the optimal cutoff point for detecting high GS with a sensitivity of 69.1% and a specificity of 48.2% (Figure 4 and Table 7).
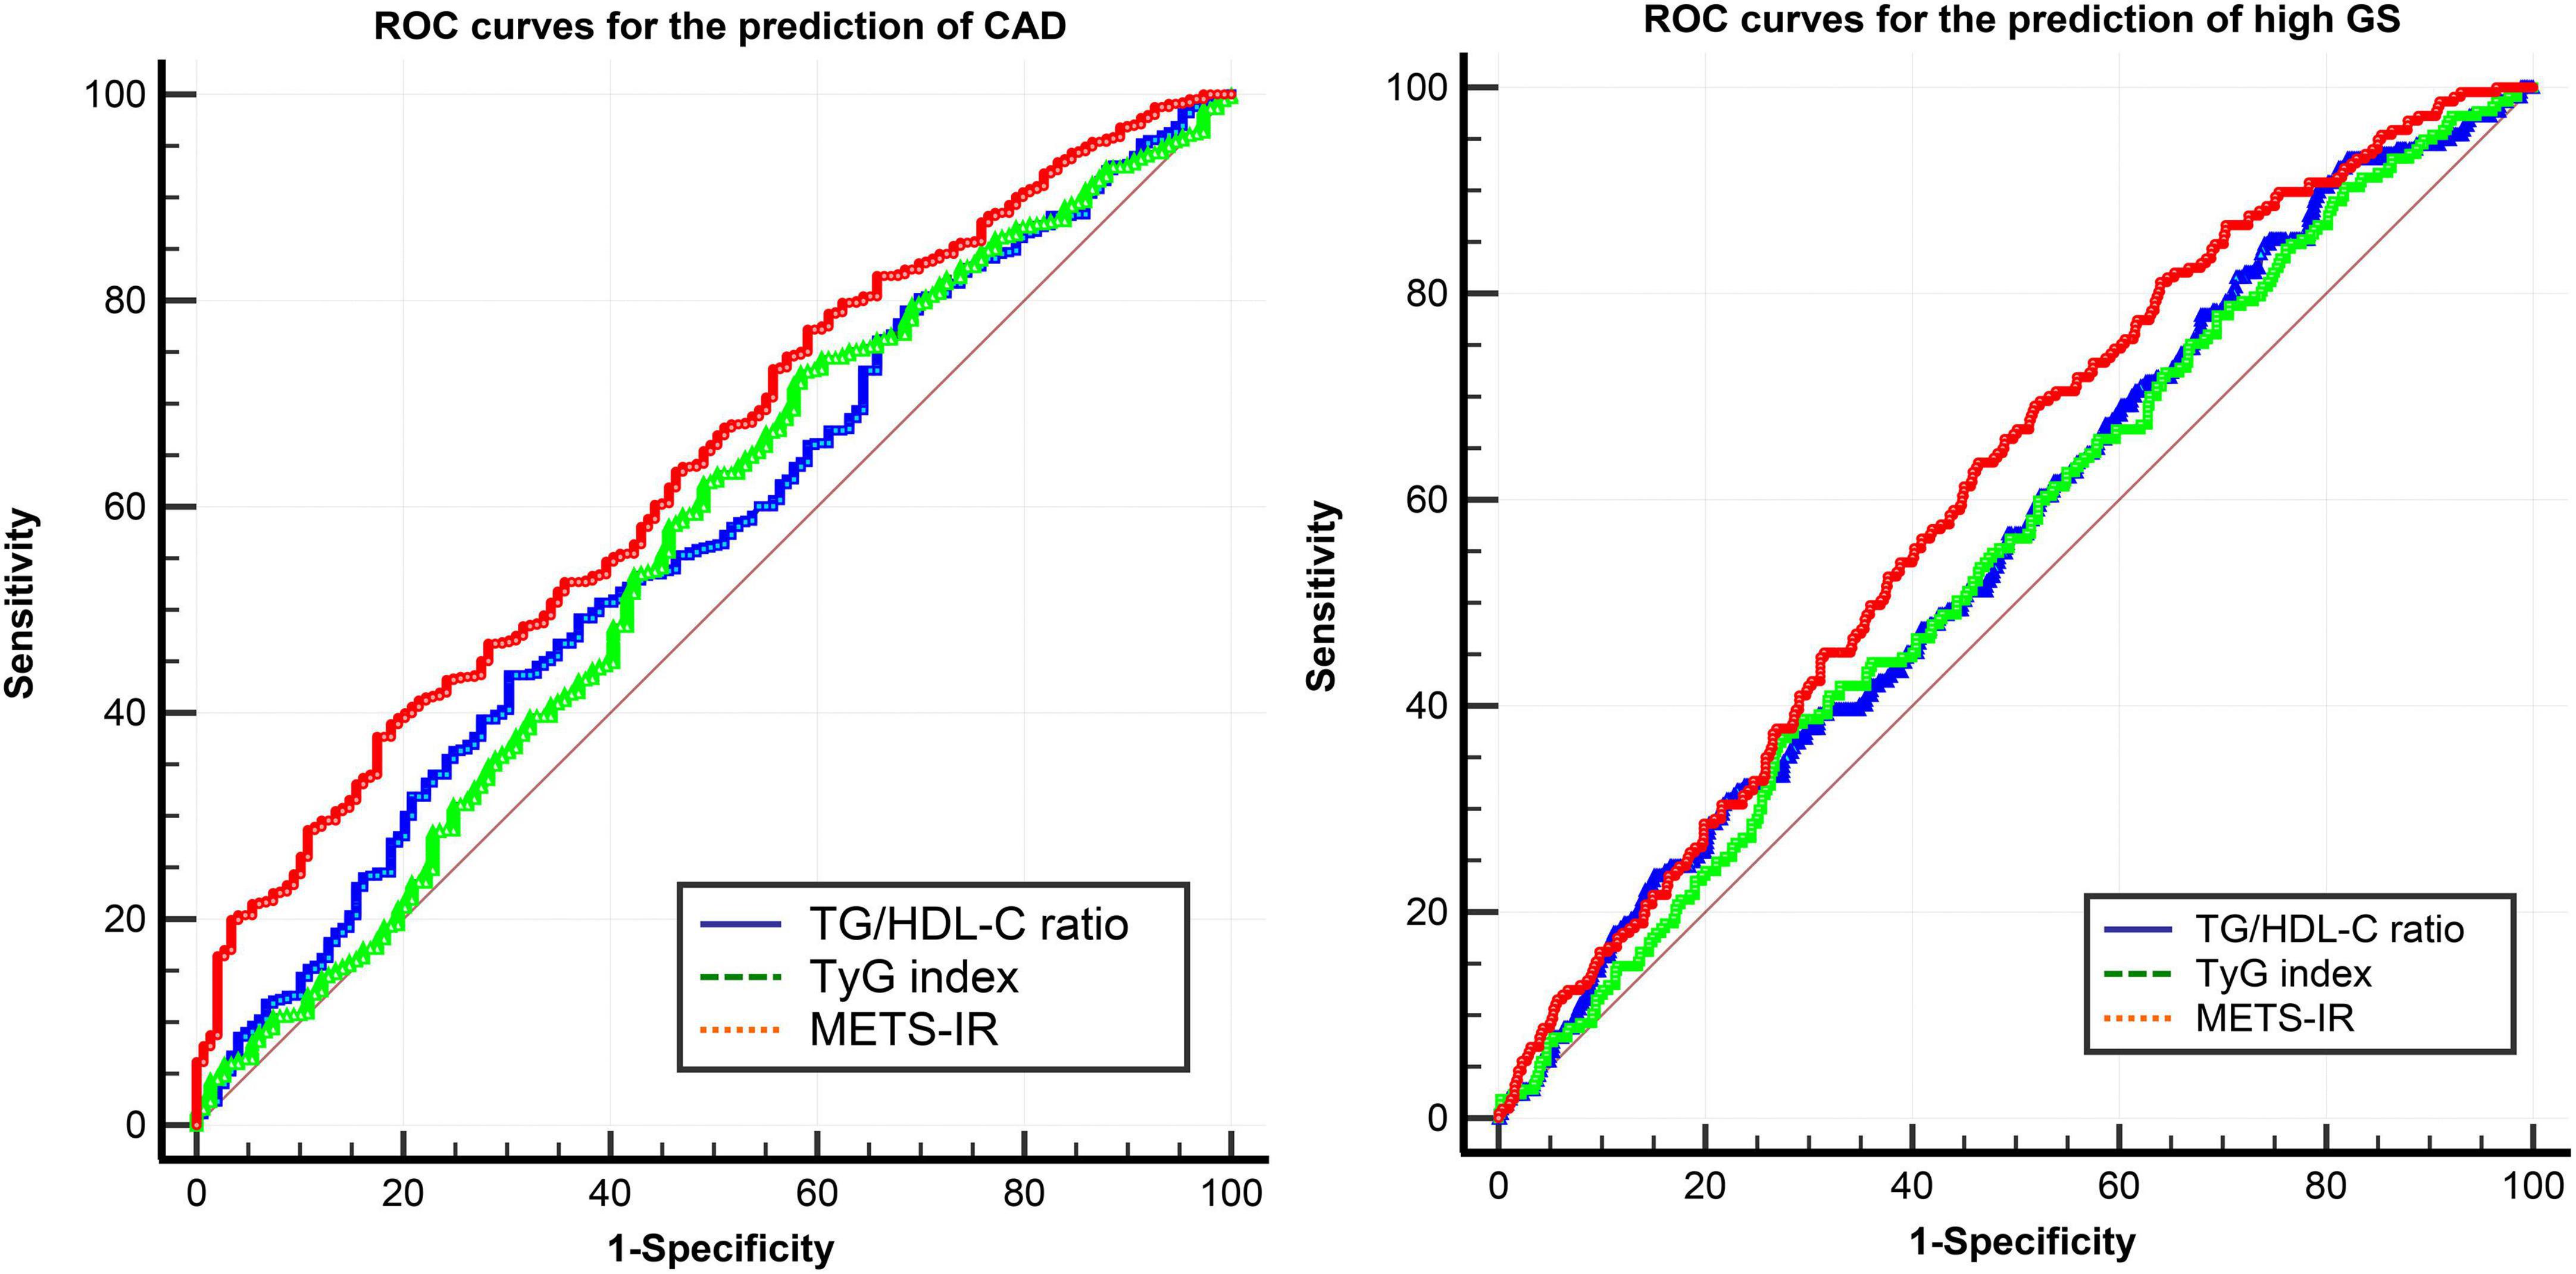
Figure 4. ROC curves of the TG/HDL-C ratio, TyG index, and METS-IR for the prediction of CAD and high GS. ROC curves, receiver operator characteristic curves; CAD, coronary heart disease; GS, Gensini score; TG/HDL-C ratio, the ratio of triglycerides to high-density lipoprotein cholesterol; TyG index, triglyceride and glucose index; METS-IR, metabolic score for insulin resistance.

Table 6. Comparison of the predictive value of the TG/HDL-C ratio, TyG index, and METS-IR for predicting the presence of CAD.

Table 7. Comparison of the predictive value of the TG/HDL-C ratio, TyG index, and METS-IR for predicting high GS.
Discussion
Our current study demonstrated that the TG/HDL-C ratio and METS-IR were independent predictors of the presence of CAD, and only the METS-IR was an independent predictor of high GS. More importantly, the METS-IR had the highest predictive value for the prediction of both the presence and severity of CAD.
Insulin resistance is a general term that characterizes a low response of adipose tissue, skeletal muscle, liver, and pancreas to insulin action. Theoretically, IR plays an important role in the pathogenesis of atherosclerosis, which is the most common cause of CAD. Several mechanisms describing the promotion of CAD by IR have been elucidated, including changes in classic CVD risk factors and alteration of insulin signaling pathways (21). The Insulin Resistance Atherosclerosis Study (IRAS) has revealed that higher levels of insulin sensitivity are associated with less atherosclerosis (22). A previous study has shown that IR is an important risk factor for CAD and is positively correlated with the severity of CAD, in which IR is measured using the hyperinsulinemic–euglycemic clamp technique (23). A 2012 meta-analysis of 65 studies has demonstrated that IR, as evaluated by HOMA-IR, is a good predictor of CVD (24). The hyperinsulinemic-euglycemic clamp technique is the gold standard to evaluate the degree of IR, but HOMA-IR is the most widely used method. However, the hyperinsulinemic–euglycemic clamp technique is costly and time-consuming (7), and HOMA-IR is likely to cause significant bias due to insulin measurements (25, 26). Recently, some non-insulin-based IR indexes, such as the TG/HDL-C ratio, TyG index, and METS-IR, have been used for the assessment of insulin action to compensate for the shortcomings of traditional IR assessment methods. Interestingly, these indexes have strong predictive abilities for the incidence and prognosis of CVD (12, 13, 15, 16, 27–29). To date, there has been no research to compare the value of the TG/HDL-C ratio, TyG index, and METS-IR in predicting the risk and severity of CAD.
In the present study, we found that the TG/HDL-C ratio, TyG index, and METS-IR were significantly higher in the CAD group than in the control group. The TG/HDL-C ratio and METS-IR were significantly different between the high GS group and non-high GS group, and both indexes were significantly positively correlated with GS. The proportion of current smoking was higher in the CAD group compared to the control group, but the difference was not statistically significant. Patients have different smoking characteristics, including years of smoking, the number of cigarettes, and secondhand-smoking exposure. All of these factors may affect CAD, which may have attributed to the lack of significance. The CAD group had a higher percentage of patients taking statins. The lack of significance in the TC, TG, and LDL-C between the groups may have been attributed to the higher usage of lipid-lowering drugs in the CAD group. There were more patients with hypertension in the CAD group, but the difference in SBP and DBP was not statistically significant between the groups. The use of anti-hypertensive drugs affects blood pressure, which may have attributed to the lack of significance. In the present study, patients with DM taking metformin had a lower GS. Previous studies have demonstrated that metformin improves cardiovascular functions and reduces cardiovascular risks (30, 31). In the present study, we found a potential connection between metformin and the severity of CAD.
Further analysis showed that the TG/HDL-C ratio and METS-IR were independent predictors of the presence of CAD, whereas only the METS-IR was an independent predictor of high GS. The correlations between GS and these indexes were relatively low, and the clinical application value of these indexes needs further research. In the present study, no statistical significance was found in the prediction of CAD severity by the TG/HDL-C ratio and TyG index after adjusting for confounders, which was consistent with previous studies (32, 33). Yunke et al. evaluated 317 consecutive patients who underwent coronary angiography and found that the TG/HDL-C ratio was predictive for CAD patients who had a GS greater than 40 even after adjusting for potential confounding variables (34). Mao et al. found that the TyG index is an independent predictor of the high SYNTAX score in an observational study that included 438 patients with non-ST-segment elevation acute coronary syndrome (35). The differences in the study population, tools for grading the severity of CAD, and the definition of severe CAD may have attributed to the inconsistent outcomes between the present study and previous studies.
In the present study, we found that single antiplatelet therapy was an independent predictive factor for the presence of CAD. However, dual antiplatelet therapy, instead of single antiplatelet therapy, was significantly associated with high GS. Single antiplatelet therapy is widely used for the prevention and treatment of CAD, whereas dual antiplatelet therapy is used for patients with acute coronary syndrome who may suffer from more severe CAD. The different indications of single and dual antiplatelet therapy may explain our findings.
In the subgroup analyses, the significant association between the METS-IR and high GS was mainly observed among men, younger patients, and patients with PDM. The Tehran Lipid and Glucose Study (TLGS) has also reported differences in the association between the TyG index and CVD in different age and gender groups (12). The inconsistency in the predictive power of non-insulin-based IR indexes between the age and gender groups needs further investigation to explore the underlying mechanism. IR occurs several years or even decades earlier than T2DM, which is an important risk factor for CVD in patients who develop T2DM (36). However, in patients with T2DM, the classic CVD risk factors are major predictors of CVD events, and the risk is further increased by hyperglycemia, but to a lesser extent as that by IR alone (37). These factors may explain the differences in the predictive power of the METS-IR between patients with different glucose metabolism statuses observed in the present study.
Prediabetes mellitus is an intermediate metabolic state between normal glucose regulation (NGR) and DM. Previous studies have shown that patients with PDM have a higher rate of CAD and a worse prognosis (30). Patients with PDM without obstructive coronary stenosis also have a worse prognosis caused by IR and endothelial dysfunction (30). In the present study, we observed a higher proportion of CAD and higher GS in patients with PDM, which was consistent with previous research. Further subgroup analysis showed that the METS-IR was significantly associated with high GS in patients with PDM, which has implications for severity stratification and early intervention of CAD in patients with PDM. Previous studies have linked the higher rate of acute myocardial infarction (AMI) in PDM with over-inflammation at the level of atherosclerotic plaques (38), peri-coronary fat (39, 40), and peripheral adipose tissue, as in the case of overweight (41). The ability of the METS-IR to reflect a hyperinflammatory state in patients with PDM is an important question to investigate. A previous prospective longitudinal observational study has reported that IR is a negative prognostic factor in subjects with ischemic heart disease and NGR (42). In the present study, the association between the METS-IR and high GS was not statistically significant in patients with NGR. Thus, the role of IR in CAD patients with NGR and the underlying mechanism need further investigation.
Bello-Chavolla et al. found that the METS-IR has a good and significantly higher diagnostic performance of incident T2DM compared to the TyG index and TG/HDL-C ratio in Mexican subjects (11). A study comparing the associations of the TG/HDL-C ratio, TyG index, and METS-IR with hypertension demonstrated that only the METS-IR is significantly associated with hypertension (43). In the present study, ROC analysis showed that the METS-IR had the highest predictive value for the prediction of both the presence and severity of CAD.
Several limitations of this study should be considered. First, this was a single-center retrospective study, indicating that potential bias may have been introduced. Second, as with many clinical studies, this cross-sectional study only showed association rather than causation. Third, the sample size was relatively small, which might influence our results. Fourth, the values of inflammatory markers were not measured in most patients, preventing the investigation of the associations between non-insulin-based IR indexes and inflammation. Finally, we did not record nutritional habits and physical activities, which may affect non-insulin-based IR indexes. Additional multicenter, large-size, and prospective studies may strengthen our conclusion.
Conclusion
In conclusion, the present findings demonstrated that non-insulin-based IR indexes are valuable predictors of the presence and severity of CAD and that the METS-IR has the highest predictive value among the three non-insulin-based IR indexes. Thus, these findings suggested that the METS-IR is a simple, inexpensive, and timely index for the prevention and management of CAD.
Data availability statement
The raw data supporting the conclusions of this article will be made available by the authors, without undue reservation.
Ethics statement
The studies involving human participants were reviewed and approved by Ethics Review Committee of Qilu Hospital of Shandong University. The patients/participants provided their written informed consent to participate in this study. Written informed consent was obtained from the individual(s) for the publication of any potentially identifiable images or data included in this article.
Author contributions
ZW, JY, and TZ drafted and revised the manuscript, contributed to the conception, and design of this manuscript. HC, WL, and YZ contributed to the case collection and database organization. LL, ZL, WZ, ZW, and JY performed the statistical analyses. All authors revised the manuscript critically for intellectual content, agreed to be accountable for the work and to ensure that any questions relating to the accuracy and integrity of the manuscript are investigated and properly resolved, and approved the final version.
Acknowledgments
We thank the Charlesworth Author Services for its linguistic assistance during the preparation of this manuscript.
Funding
This work was supported by grants from the National Natural Science Foundation of China (No. 81970366) and the Key Research and Development Plan of Shandong Province (No. 2021SFGC0503).
Conflict of interest
The authors declare that the research was conducted in the absence of any commercial or financial relationships that could be construed as a potential conflict of interest.
Publisher’s note
All claims expressed in this article are solely those of the authors and do not necessarily represent those of their affiliated organizations, or those of the publisher, the editors and the reviewers. Any product that may be evaluated in this article, or claim that may be made by its manufacturer, is not guaranteed or endorsed by the publisher.
Supplementary material
The Supplementary Material for this article can be found online at: https://www.frontiersin.org/articles/10.3389/fcvm.2022.918359/full#supplementary-material
References
1. Virani SS, Alonso A, Benjamin EJ, Bittencourt MS, Callaway CW, Carson AP, et al. Heart disease and stroke statistics-2020 update: a report from the American heart association. Circulation. (2020) 141:e139–596.
2. GBD 2019 Diseases and Injuries Collaborators. Global burden of 369 diseases and injuries in 204 countries and territories, 1990-2019: a systematic analysis for the Global Burden of Disease Study 2019. Lancet. (2020) 396:1204–22. doi: 10.1161/CIR.0000000000000757
3. Bornfeldt KE, Tabas I. Insulin resistance, hyperglycemia, and atherosclerosis. Cell Metab. (2011) 14:575–85.
4. Taube A, Schlich R, Sell H, Eckardt K, Eckel J. Inflammation and metabolic dysfunction: links to cardiovascular diseases. Am J Physiol Heart Circ Physiol. (2012) 302:H2148–65.
5. Beverly JK, Budoff MJ. Atherosclerosis: pathophysiology of insulin resistance, hyperglycemia, hyperlipidemia, and inflammation. J Diabetes. (2020) 12:102–4.
6. Bergman RN, Finegood DT, Ader M. Assessment of insulin sensitivity in vivo. Endocr Rev.. (1985) 6:45–86. doi: 10.1210/edrv-6-1-45
7. Pacini G, Mari A. Methods for clinical assessment of insulin sensitivity and beta-cell function. Best Pract Res Clin Endocrinol Metab. (2003) 17:305–22. doi: 10.1016/s1521-690x(03)00042-3
8. Matthews DR, Hosker JP, Rudenski AS, Naylor BA, Treacher DF, Turner RC. Homeostasis model assessment: insulin resistance and beta-cell function from fasting plasma glucose and insulin concentrations in man. Diabetologia. (1985) 28:412–9. doi: 10.1007/BF00280883
9. Lin D, Qi Y, Huang C, Wu M, Wang C, Li F, et al. Associations of lipid parameters with insulin resistance and diabetes: a population-based study. Clin Nutr. (2018) 37:1423–9. doi: 10.1016/j.clnu.2017.06.018
10. Abbasi F, Reaven GM. Comparison of two methods using plasma triglyceride concentration as a surrogate estimate of insulin action in nondiabetic subjects: triglycerides × glucose versus triglyceride/high-density lipoprotein cholesterol. Metabolism. (2011) 60:1673–6. doi: 10.1016/j.metabol.2011.04.006
11. Bello-Chavolla OY, Almeda-Valdes P, Gomez-Velasco D, Viveros-Ruiz T, Cruz-Bautista I, Romo-Romo A, et al. METS-IR, a novel score to evaluate insulin sensitivity, is predictive of visceral adiposity and incident type 2 diabetes. Eur J Endocrinol. (2018) 178:533–44. doi: 10.1530/EJE-17-0883
12. Barzegar N, Tohidi M, Hasheminia M, Azizi F, Hadaegh F. The impact of triglyceride-glucose index on incident cardiovascular events during 16 years of follow-up: tehran lipid and glucose study. Cardiovasc Diabetol. (2020) 19:155. doi: 10.1186/s12933-020-01121-5
13. Jiao Y, Su Y, Shen J, Hou X, Li Y, Wang J, et al. Evaluation of the long-term prognostic ability of triglyceride-glucose index for elderly acute coronary syndrome patients: a cohort study. Cardiovasc Diabetol. (2022) 21:3. doi: 10.1186/s12933-021-01443-y
14. de León AC, Coello SD, González DA, Díaz BB, Rodríguez JC, Hernández AG, et al. Impaired fasting glucose, ancestry and waist-to-height ratio: main predictors of incident diagnosed diabetes in the Canary Islands. Diabet Med. (2012) 29:399–403. doi: 10.1111/j.1464-5491.2011.03420.x
15. Hadaegh F, Khalili D, Ghasemi A, Tohidi M, Sheikholeslami F, Azizi F. Triglyceride/HDL-cholesterol ratio is an independent predictor for coronary heart disease in a population of Iranian men. Nutr Metab Cardiovasc Dis. (2009) 19:401–8. doi: 10.1016/j.numecd.2008.09.003
16. Yoon J, Jung D, Lee Y, Park B. The metabolic score for insulin resistance (METS-IR) as a predictor of incident ischemic heart disease: a longitudinal study among Korean without diabetes. J Pers Med. (2021) 11:742. doi: 10.3390/jpm11080742
17. American Diabetes Association. 2. Classification and diagnosis of diabetes: standards of medical care in diabetes-2018. Diabetes Care. (2018) 41:S13–27. doi: 10.2337/dc18-S002
18. Ma YC, Zuo L, Chen JH, Luo Q, Yu XQ, Li Y, et al. Modified glomerular filtration rate estimating equation for Chinese patients with chronic kidney disease. J Am Soc Nephrol. (2006) 17:2937–44. doi: 10.1681/ASN.2006040368
19. Guerrero-Romero F, Simental-Mendía LE, González-Ortiz M, Martínez-Abundis E, Ramos-Zavala MG, Hernández-González SO, et al. The product of triglycerides and glucose, a simple measure of insulin sensitivity. Comparison with the euglycemic-hyperinsulinemic clamp. J Clin Endocrinol Metab. (2010) 95:3347–51. doi: 10.1210/jc.2010-0288
20. Gensini GG. A more meaningful scoring system for determining the severity of coronary heart disease. Am J Cardiol. (1983) 51:606. doi: 10.1016/s0002-9149(83)80105-2
21. Ormazabal V, Nair S, Elfeky O, Aguayo C, Salomon C, Zuñiga FA. Association between insulin resistance and the development of cardiovascular disease. Cardiovasc Diabetol. (2018) 17:122. doi: 10.1186/s12933-018-0762-4
22. Howard G, O’Leary DH, Zaccaro D, Haffner S, Rewers M, Hamman R, et al. Insulin sensitivity and atherosclerosis. The insulin resistance atherosclerosis study (IRAS) investigators. Circulation. (1996) 93:1809–17. doi: 10.1161/01.cir.93.10.1809
23. Bressler P, Bailey SR, Matsuda M, DeFronzo RA. Insulin resistance and coronary artery disease. Diabetologia. (1996) 39:1345–50. doi: 10.1007/s001250050581
24. Gast KB, Tjeerdema N, Stijnen T, Smit JW, Dekkers OM. Insulin resistance and risk of incident cardiovascular events in adults without diabetes: meta-analysis. PLoS One. (2012) 7:e52036. doi: 10.1371/journal.pone.0052036
25. Rudvik A, Månsson M. Evaluation of surrogate measures of insulin sensitivity - correlation with gold standard is not enough. BMC Med Res Methodol. (2018) 18:64. doi: 10.1186/s12874-018-0521-y
26. Manley SE, Stratton IM, Clark PM, Luzio SD. Comparison of 11 human insulin assays: implications for clinical investigation and research. Clin Chem. (2007) 53:922–32. doi: 10.1373/clinchem.2006.077784
27. Lee HR, Kim JK, Kim JH, Chung TH. Compared to serum triglyceride alone, the association between serum triglyceride to high-density lipoprotein cholesterol ratio and 10-year cardiovascular disease risk as determined by Framingham risk scores in a large Korean cohort. Clin Chim Acta. (2021) 520:29–33. doi: 10.1016/j.cca.2021.05.029
28. Salazar MR, Carbajal HA, Espeche WG, Aizpurúa M, Dulbecco CA, Reaven GM. Comparison of two surrogate estimates of insulin resistance to predict cardiovascular disease in apparently healthy individuals. Nutr Metab Cardiovasc Dis. (2017) 27:366–73. doi: 10.1016/j.numecd.2016.12.002
29. Zhu Y, Liu K, Chen M, Liu Y, Gao A, Hu C, et al. Triglyceride-glucose index is associated with in-stent restenosis in patients with acute coronary syndrome after percutaneous coronary intervention with drug-eluting stents. Cardiovasc Diabetol. (2021) 20:137. doi: 10.1186/s12933-021-01332-4
30. Sardu C, Paolisso P, Sacra C, Mauro C, Minicucci F, Portoghese M, et al. Effects of metformin therapy on coronary endothelial dysfunction in patients with prediabetes with stable angina and nonobstructive coronary artery stenosis: the CODYCE multicenter prospective study. Diabetes Care. (2019) 42:1946–55. doi: 10.2337/dc18-2356
31. Scheen AJ, Paquot N. Metformin revisited: a critical review of the benefit-risk balance in at-risk patients with type 2 diabetes. Diabetes Metab. (2013) 39:179–90. doi: 10.1016/j.diabet.2013.02.006
32. Hong LF, Yan XN, Fan Y, Wu Q, Luo SH, Yang B, et al. Is the ratio of apoB/apoA-1 the best predictor for the severity of coronary artery lesions in Chinese diabetics with stable angina pectoris? An assessment based on Gensini scores. J Geriatr Cardiol. (2015) 12:402–9. doi: 10.11909/j.issn.1671-5411.2015.04.012
33. Song Y, Yang Y, Zhang J, Wang Y, He W, Zhang X, et al. The apoB100/apoAI ratio is independently associated with the severity of coronary heart disease: a cross sectional study in patients undergoing coronary angiography. Lipids Health Dis. (2015) 14:150. doi: 10.1186/s12944-015-0155-6
34. Yunke Z, Guoping L, Zhenyue C. Triglyceride-to-HDL cholesterol ratio. Predictive value for CHD severity and new-onset heart failure. Herz. (2014) 39:105–10. doi: 10.1007/s00059-013-3788-0
35. Mao Q, Zhou D, Li Y, Wang Y, Xu SC, Zhao XH. The triglyceride-glucose index predicts coronary artery disease severity and cardiovascular outcomes in patients with non-ST-segment elevation acute coronary syndrome. Dis Markers. (2019) 2019:6891537. doi: 10.1155/2019/6891537
36. Laakso M. Cardiovascular disease in type 2 diabetes from population to man to mechanisms: the Kelly West Award Lecture 2008. Diabetes Care. (2010) 33:442–9. doi: 10.2337/dc09-0749
37. Laakso M, Kuusisto J. Insulin resistance and hyperglycaemia in cardiovascular disease development. Nat Rev Endocrinol. (2014) 10:293–302. doi: 10.1038/nrendo.2014.29
38. Sardu C, Modugno P, Castellano G, Scisciola L, Barbieri M, Petrella L, et al. Atherosclerotic plaque fissuration and clinical outcomes in pre-diabetics vs. normoglycemics patients affected by asymptomatic significant carotid artery stenosis at 2 years of follow-up: role of microRNAs modulation: the ATIMIR study. Biomedicines. (2021) 9:401. doi: 10.3390/biomedicines9040401
39. Sardu C, D’Onofrio N, Torella M, Portoghese M, Mureddu S, Loreni F, et al. Metformin therapy effects on the expression of sodium-glucose cotransporter 2, leptin, and SIRT6 levels in pericoronary fat excised from pre-diabetic patients with acute myocardial infarction. Biomedicines. (2021) 9:904. doi: 10.3390/biomedicines9080904
40. Sardu C, D’ Onofrio N, Torella M, Portoghese M, Loreni F. Pericoronary fat inflammation and Major Adverse Cardiac Events (MACE) in prediabetic patients with acute myocardial infarction: effects of metformin. Cardiovasc Diabetol. (2019) 18:126. doi: 10.1186/s12933-019-0931-0
41. Sardu C, Pieretti G, D’Onofrio N, Ciccarelli F, Paolisso P, Passavanti MB, et al. Inflammatory cytokines and SIRT1 levels in subcutaneous abdominal fat: relationship with cardiac performance in overweight pre-diabetics patients. Front Physiol. (2018) 9:1030. doi: 10.3389/fphys.2018.01030
42. Sasso FC, Pafundi PC, Marfella R, Calabrò P, Piscione F, Furbatto F, et al. Adiponectin and insulin resistance are related to restenosis and overall new PCI in subjects with normal glucose tolerance: the prospective AIRE Study. Cardiovasc Diabetol. (2019) 18:24. doi: 10.1186/s12933-019-0826-0
Keywords: coronary artery disease, triglyceride to high-density lipoprotein cholesterol (TG/HDL-C) ratio, triglyceride and glucose index (TyG index), metabolic score for insulin resistance (METS-IR), Gensini score
Citation: Wu Z, Cui H, Li W, Zhang Y, Liu L, Liu Z, Zhang W, Zheng T and Yang J (2022) Comparison of three non-insulin-based insulin resistance indexes in predicting the presence and severity of coronary artery disease. Front. Cardiovasc. Med. 9:918359. doi: 10.3389/fcvm.2022.918359
Received: 12 April 2022; Accepted: 06 July 2022;
Published: 29 July 2022.
Edited by:
Carmine Pizzi, University of Bologna, ItalyReviewed by:
Aleksandra Jotic, University of Belgrade, SerbiaCelestino Sardu, University of Campania Luigi Vanvitelli, Italy
Copyright © 2022 Wu, Cui, Li, Zhang, Liu, Liu, Zhang, Zheng and Yang. This is an open-access article distributed under the terms of the Creative Commons Attribution License (CC BY). The use, distribution or reproduction in other forums is permitted, provided the original author(s) and the copyright owner(s) are credited and that the original publication in this journal is cited, in accordance with accepted academic practice. No use, distribution or reproduction is permitted which does not comply with these terms.
*Correspondence: Tengfei Zheng, enRmMjAwOUAxMjYuY29t; Jianmin Yang, eWFuZ2ppYW5taW5zZHVAMTYzLmNvbQ==
 Zhenguo Wu
 Huiliang Cui1
 Wencheng Zhang
 Jianmin Yang