
95% of researchers rate our articles as excellent or good
Learn more about the work of our research integrity team to safeguard the quality of each article we publish.
Find out more
SYSTEMATIC REVIEW article
Front. Cardiovasc. Med. , 06 October 2022
Sec. Heart Failure and Transplantation
Volume 9 - 2022 | https://doi.org/10.3389/fcvm.2022.918051
This article is part of the Research Topic Machine Learning and Data Science in Heart Failure and Stroke View all 11 articles
 Lin Dao1†Min Huang2†
 Xinghong Lin1†Liuyin Li3Xixi Feng4Changyou Wei4
 Mingjin Guo5
 Yifan Yang6
 Fan Xu4*
 Xiechuan Weng7*
Objective: This study aimed to compare the sensitivity and specificity of diagnosis between the third heart sound (S3) and left ventricular ejection fraction (LVEF) in heart failure (HF).
Methods: Relevant studies were searched in PubMed, SinoMed, China National Knowledge Infrastructure, and the Cochrane Trial Register until February 20, 2022. The sensitivity, specificity, likelihood ratio (LR), and diagnostic odds ratio (DOR) were pooled. The symmetric receiver operator characteristic curve (SROC) and Fagan’s nomogram were drawn. The source of heterogeneity was explored by meta-regression and subgroup analysis.
Results: A total of 19 studies, involving 5,614 participants, were included. The combined sensitivity of S3 was 0.23 [95% confidence interval (CI) (0.15–0.33), specificity was 0.94 [95% CI (0.82–0.98)], area under the SROC curve was 0.49, and the DOR was 4.55; while the sensitivity of LVEF was 0.70 [95% CI (0.53–0.83)], specificity was 0.79 [95% CI (0.75–0.82)], area under the SROC curve was 0.79, and the DOR was 8.64. No publication bias was detected in Deeks’ funnel plot. The prospective design, partial verification bias, and blind contributed to the heterogeneity in specificity, while adequate description of study participants contributed to the heterogeneity in sensitivity. In Fagan’s nomogram, the post-test probability was 48% when the pre-test probability was set as 20%, while in LVEF, the post-test probability was 45% when the pre-test probability was set as 20%.
Conclusion: The use of S3 alone presented lower sensitivity in diagnosing HF compared with LVEF, whereas it was useful in early pathological assessment.
Heart failure (HF) is a pathological process during the pumping of blood in the heart. The cardiac output becomes insufficient to fully meet the needs of body metabolism (1–3). Currently, the 5 year mortality rate for HF has remained around 50% (4). The traditional diagnosis of HF relies mainly on the history and physical examination; the clinical diagnostic methods for HF include bio-standard object examination, electrocardiogram, echocardiogram, cardiac magnetic resonance imaging, and invasive hemodynamic monitoring (5). The ratio of stroke volume to ventricular end-diastolic volume is called the ejection fraction. The ejection fraction accurately reflects the pumping function of the heart, which is important for the early detection of cardiac pumping dysfunction. Left ventricular ejection fraction (LVEF) is an important diagnostic index of HF and an important basis for its classification (5).
The non-invasive detection method has been used for the effective diagnosis of early HF without organic heart disease or clinical symptoms (6). As routine cardiac physical examination, heart sound auscultation helps in cardiac function evaluation and initial screening of cardiac structure abnormalities, and has important value for the early diagnosis of cardiovascular diseases (7). Heart sound signals, especially the third heart sound (S3) signals, are associated with increased left ventricular end-diastolic pressure, and considered ideal confirmatory markers (8). Recently, the application of heart sound analysis in the diagnosis and classification of HF has emerged gradually. However, the value of diagnosis using heart sounds in HF remains controversial. Therefore, this study aimed to compare the sensitivity and specificity of diagnosis between S3 and LVEF in HF.
Two reviewers (DL and LXJ) searched the PubMed, Embase, Cochrane Library, China National Knowledge Infrastructure, and Wan Fang databases up to February 2022 independently. The search terms were as follows: #1 TS = (“HF, Diastolic” OR “HF, Systolic” OR “Ventricular Dysfunction, Right” OR “Ventricular Dysfunction, Left”); #2 TS = (the S3 OR Heart Auscultation OR Heart Sounds OR Sounds, Heart OR Cardiac Sounds OR Cardiac Sound OR Sound, and Cardiac OR Sounds, Cardiac); #3 DT = (Clinical Trial OR Article); #4 DOP = (1971-01-01/2022-2-22); #5 #1 AND #2 AND #3 AND #4.
The inclusion criteria were as follows: (1) randomized controlled experiments using patients with HF as the experimental group and healthy people or patients with benign disease as the control group; (2) well-defined patients with HF included as study participants; (3) diagnostic tests including S3 or/and LVEF; (4) number of true-positive (TP) cases, false-negative (FN) cases, false-positive (FP) cases, and true-negative (TN) cases obtained directly or calculated through the literature; (5) age, sex, and race not considered; and (6) studies published in any language. The exclusion criteria were as follows: (1) animal studies; (2) non-case-control trials; (3) studies with incomplete or no experimental data, duplicate published literature, reviews, and abstracts; (4) poor equilibrium between groups and different baselines, and the two groups not compared with the literature; and (5) no described diagnostic tests.
Two authors (LD and XL) independently extracted the demographic data and treatment information; the third author (MH) was consulted when disagreement occurred. The baseline information extracted from 23 studies contained the first author’s name, year of publication, title, design type, study participants (number, age, and male/female ratio), disease degree, and length of the disease. The primary outcomes included FN, TN, TP, and FP with S3 and LVEF.
A meta-analysis was performed with Stata 15.0 software (Stata Corp., College Station, TX, USA). The combined sensitivity, specificity, positive/negative likelihood ratio (PLR/NLR), and diagnostic odds ratio (DOR) were calculated using the bivariate model. The total diagnostic accuracy was estimated by drawing the symmetric receiver operator characteristic curve (SROC). Post-test probability was used to determine whether the probability of diagnosis increased or reduced compared with pre-test probability, which was estimated from routine data, practice data, or clinical judgment. Heterogeneity was assessed using Cochrane’s Q statistics (chi-square) or inverse variance (I2). I2 < 50% and P > 0.1 indicated that these studies could be considered homogeneous using a fixed-effects model. If I2 ≥ 50% and P < 0.10, the random-effects model was used for meta-analysis. A P-value < 0.05 indicated a significant difference.
A total of 28,179 studies (including documents, reviews, animal experiments, case reports, and repeated studies) were retrieved from each database. After removing 27,074 duplicate records, 279 relevant studies were included. Among these studies, 2,115 were excluded for being reviews, meta-analyses, or case reports, while 19,209 studies did not have related titles and abstracts. The full text of the remaining 279 studies was read and 3,093 studies were removed after reading the full text due to incomplete data. The remaining 19 studies were extracted from the corresponding data according to the data extraction requirements. Twelve studies used S3, and seven used LVEF. The literature screening process is shown in Figure 1. The basic characteristics and inclusion and exclusion criteria of each study included are shown in Table 1 and Supplementary Table 1.
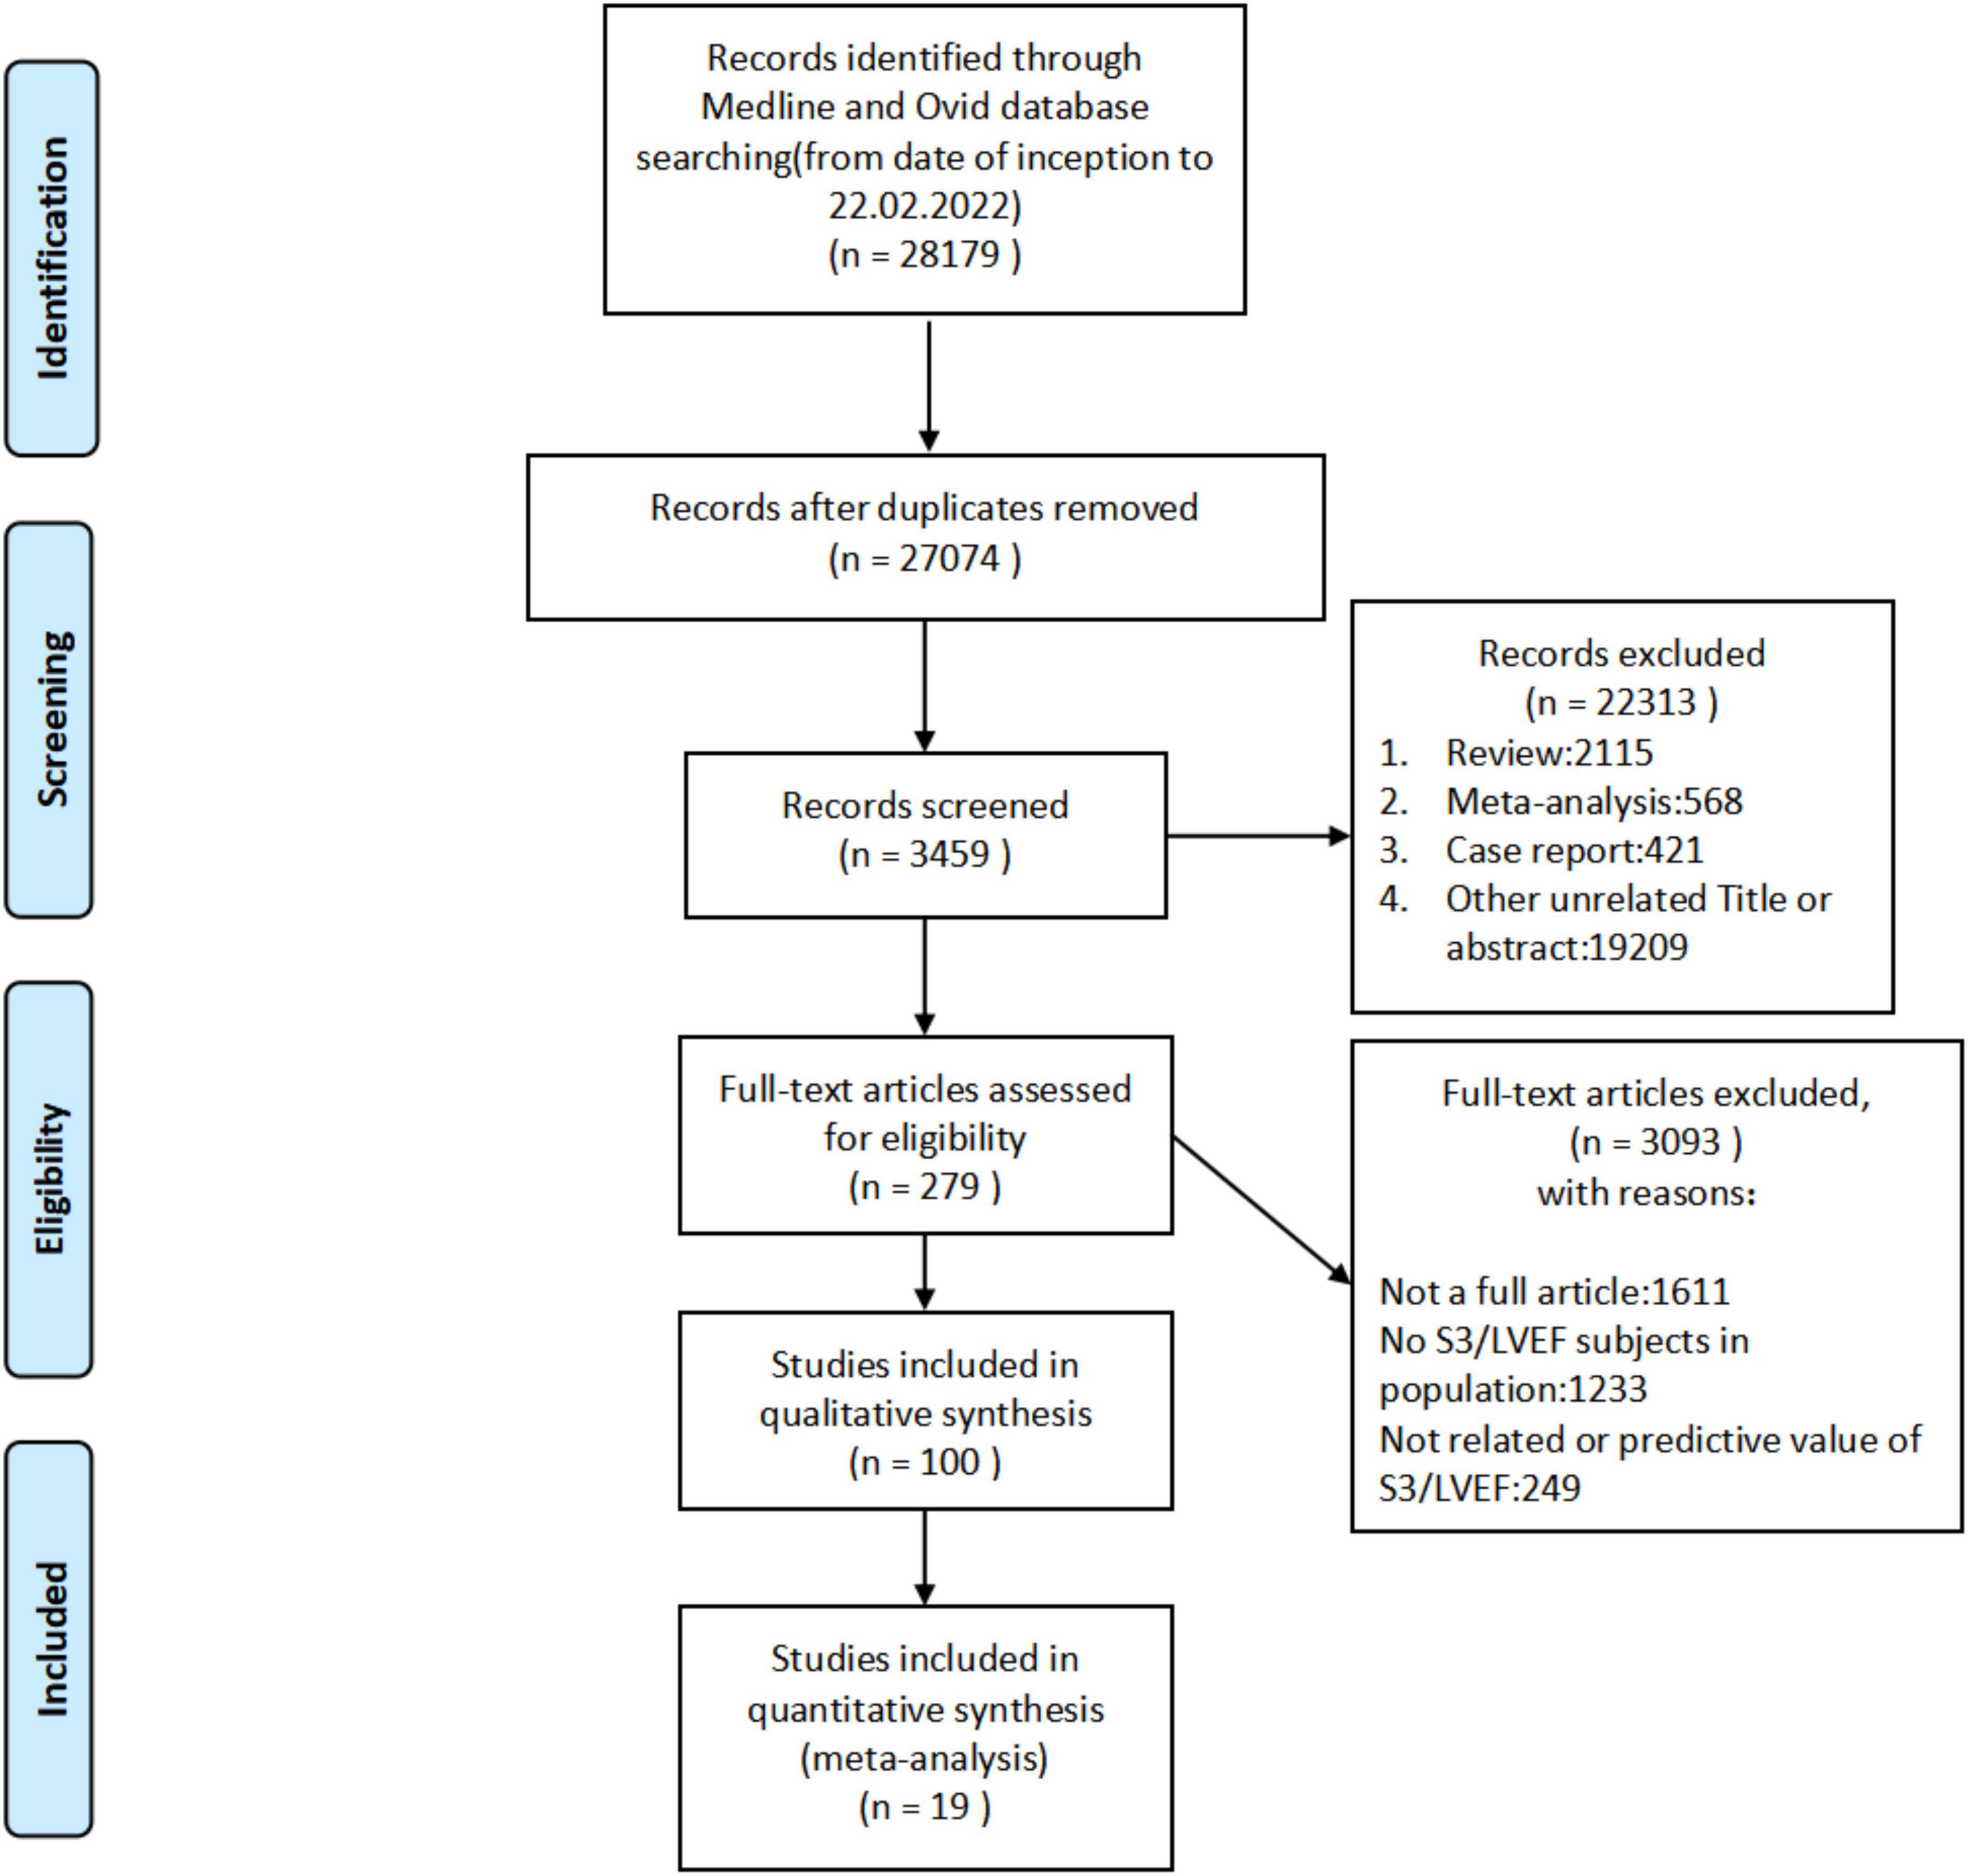
Figure 1. Literature screening process of the meta-analysis.
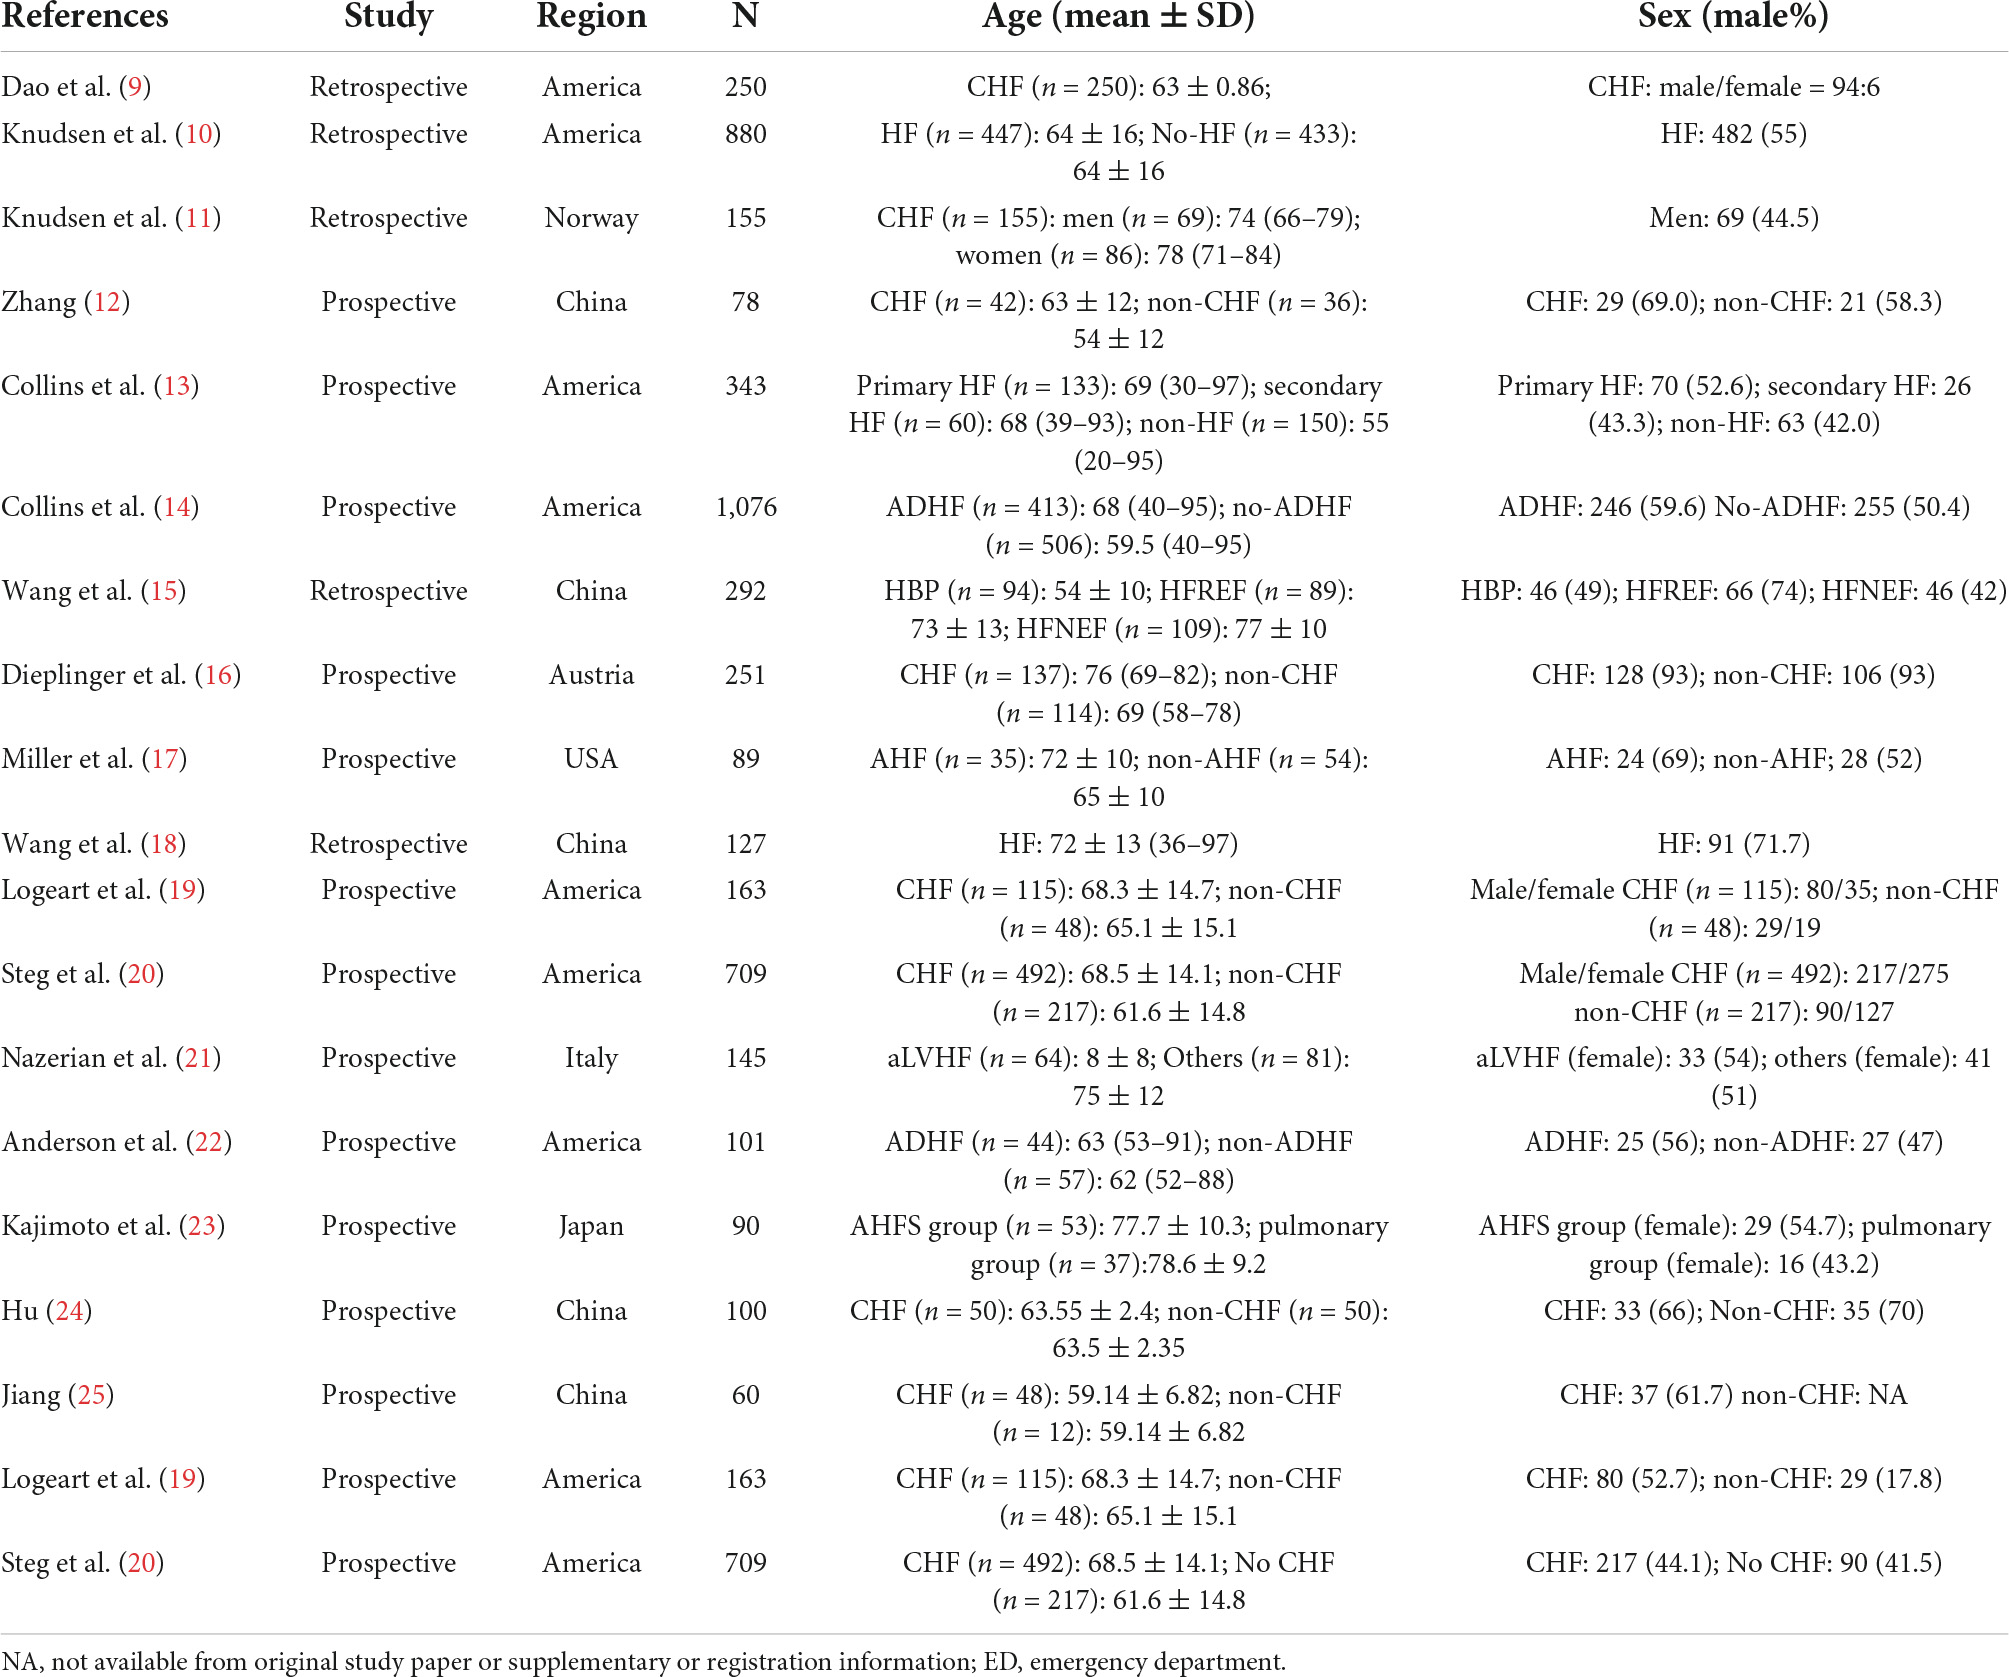
Table 1. Basic characteristics of enrolled studies.
The combined sensitivity of S3 in HF was 0.23 [95% CI (0.15–0.33)], specificity was 0.94 [95% CI (0.82–0.98)], PLR was 3.74 95% CI (1.33–10.50)], NLR was 0.82 [95% CI (0.74–0.92)], and DOR was 4.55, indicating that S3 had a medium value in the screening of HF. The random-effects model was used when the heterogeneity was I2 > 50%. The details of the combined sensitivity and specificity forest are shown in Figure 2A; the combined likelihood ratio (LR) forest is shown in Figure 2B; and the combined diagnosis ratio forest is shown in Figure 2C.
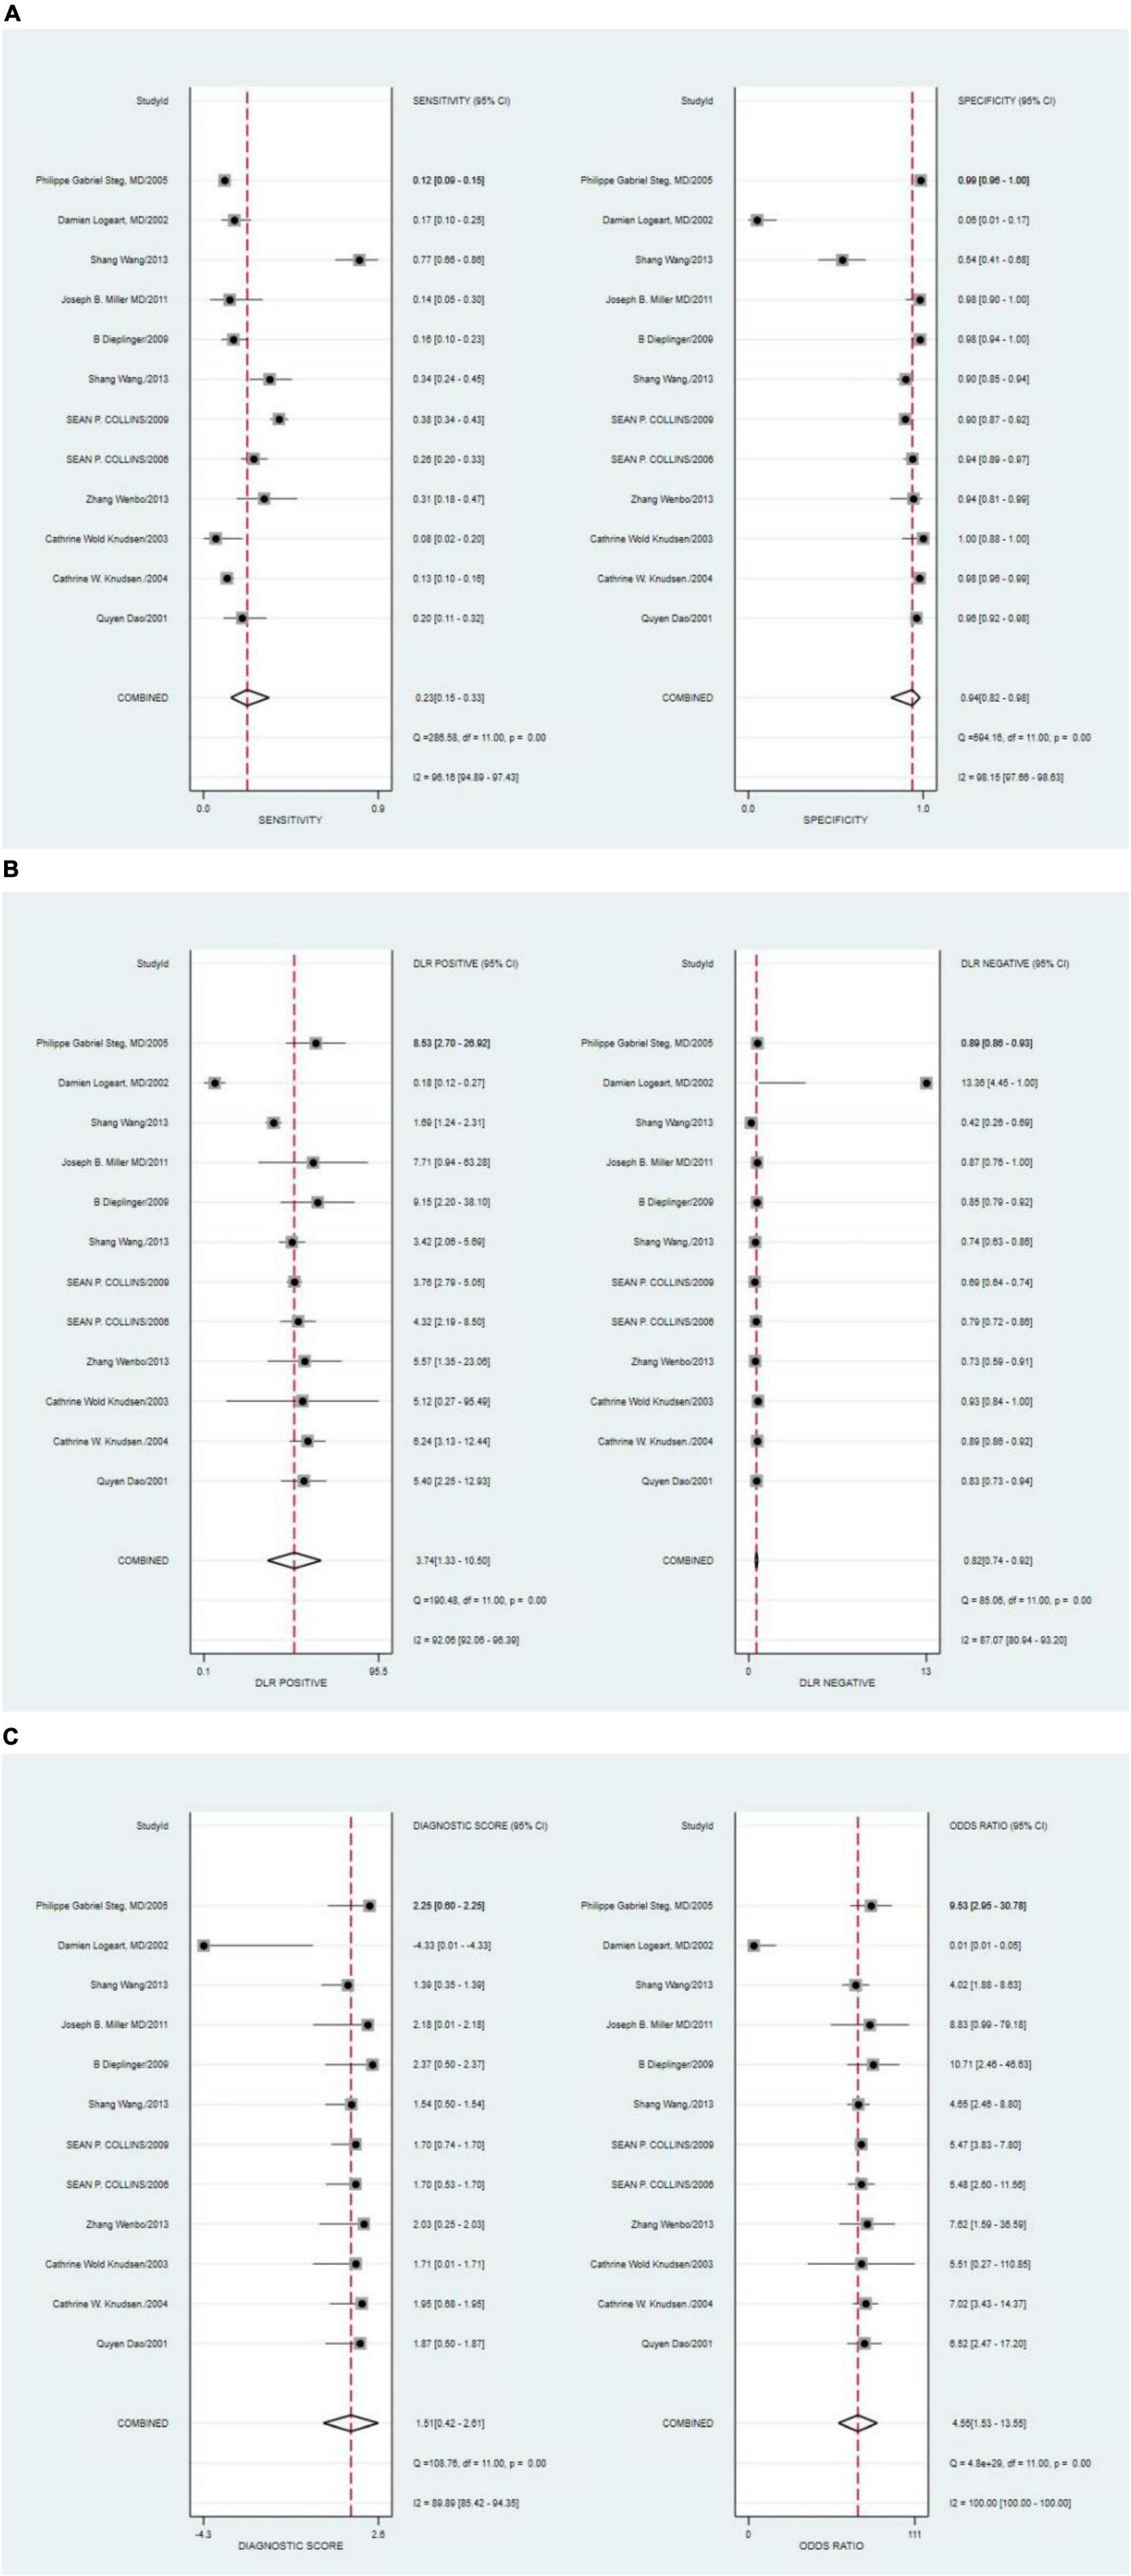
Figure 2. (A) Forest plot of sensitivity and specificity of third heart sound (S3) in the diagnosis of heart failure (HF). (B) Forest plot of DLR positives and negatives of HF. (C) Forest plot of the diagnostic odds ratio (DOR) of S3 in the diagnosis of HF.
The Deeks’ funnel plots were used to assess potential publication bias in detecting HF with S3. As shown in Figure 3, no publication bias existed, with a P-value of 0.35. The bivariate boxplot showed that three studies were out of the circles, indicating heterogeneity between included studies, as shown in Figure 4.
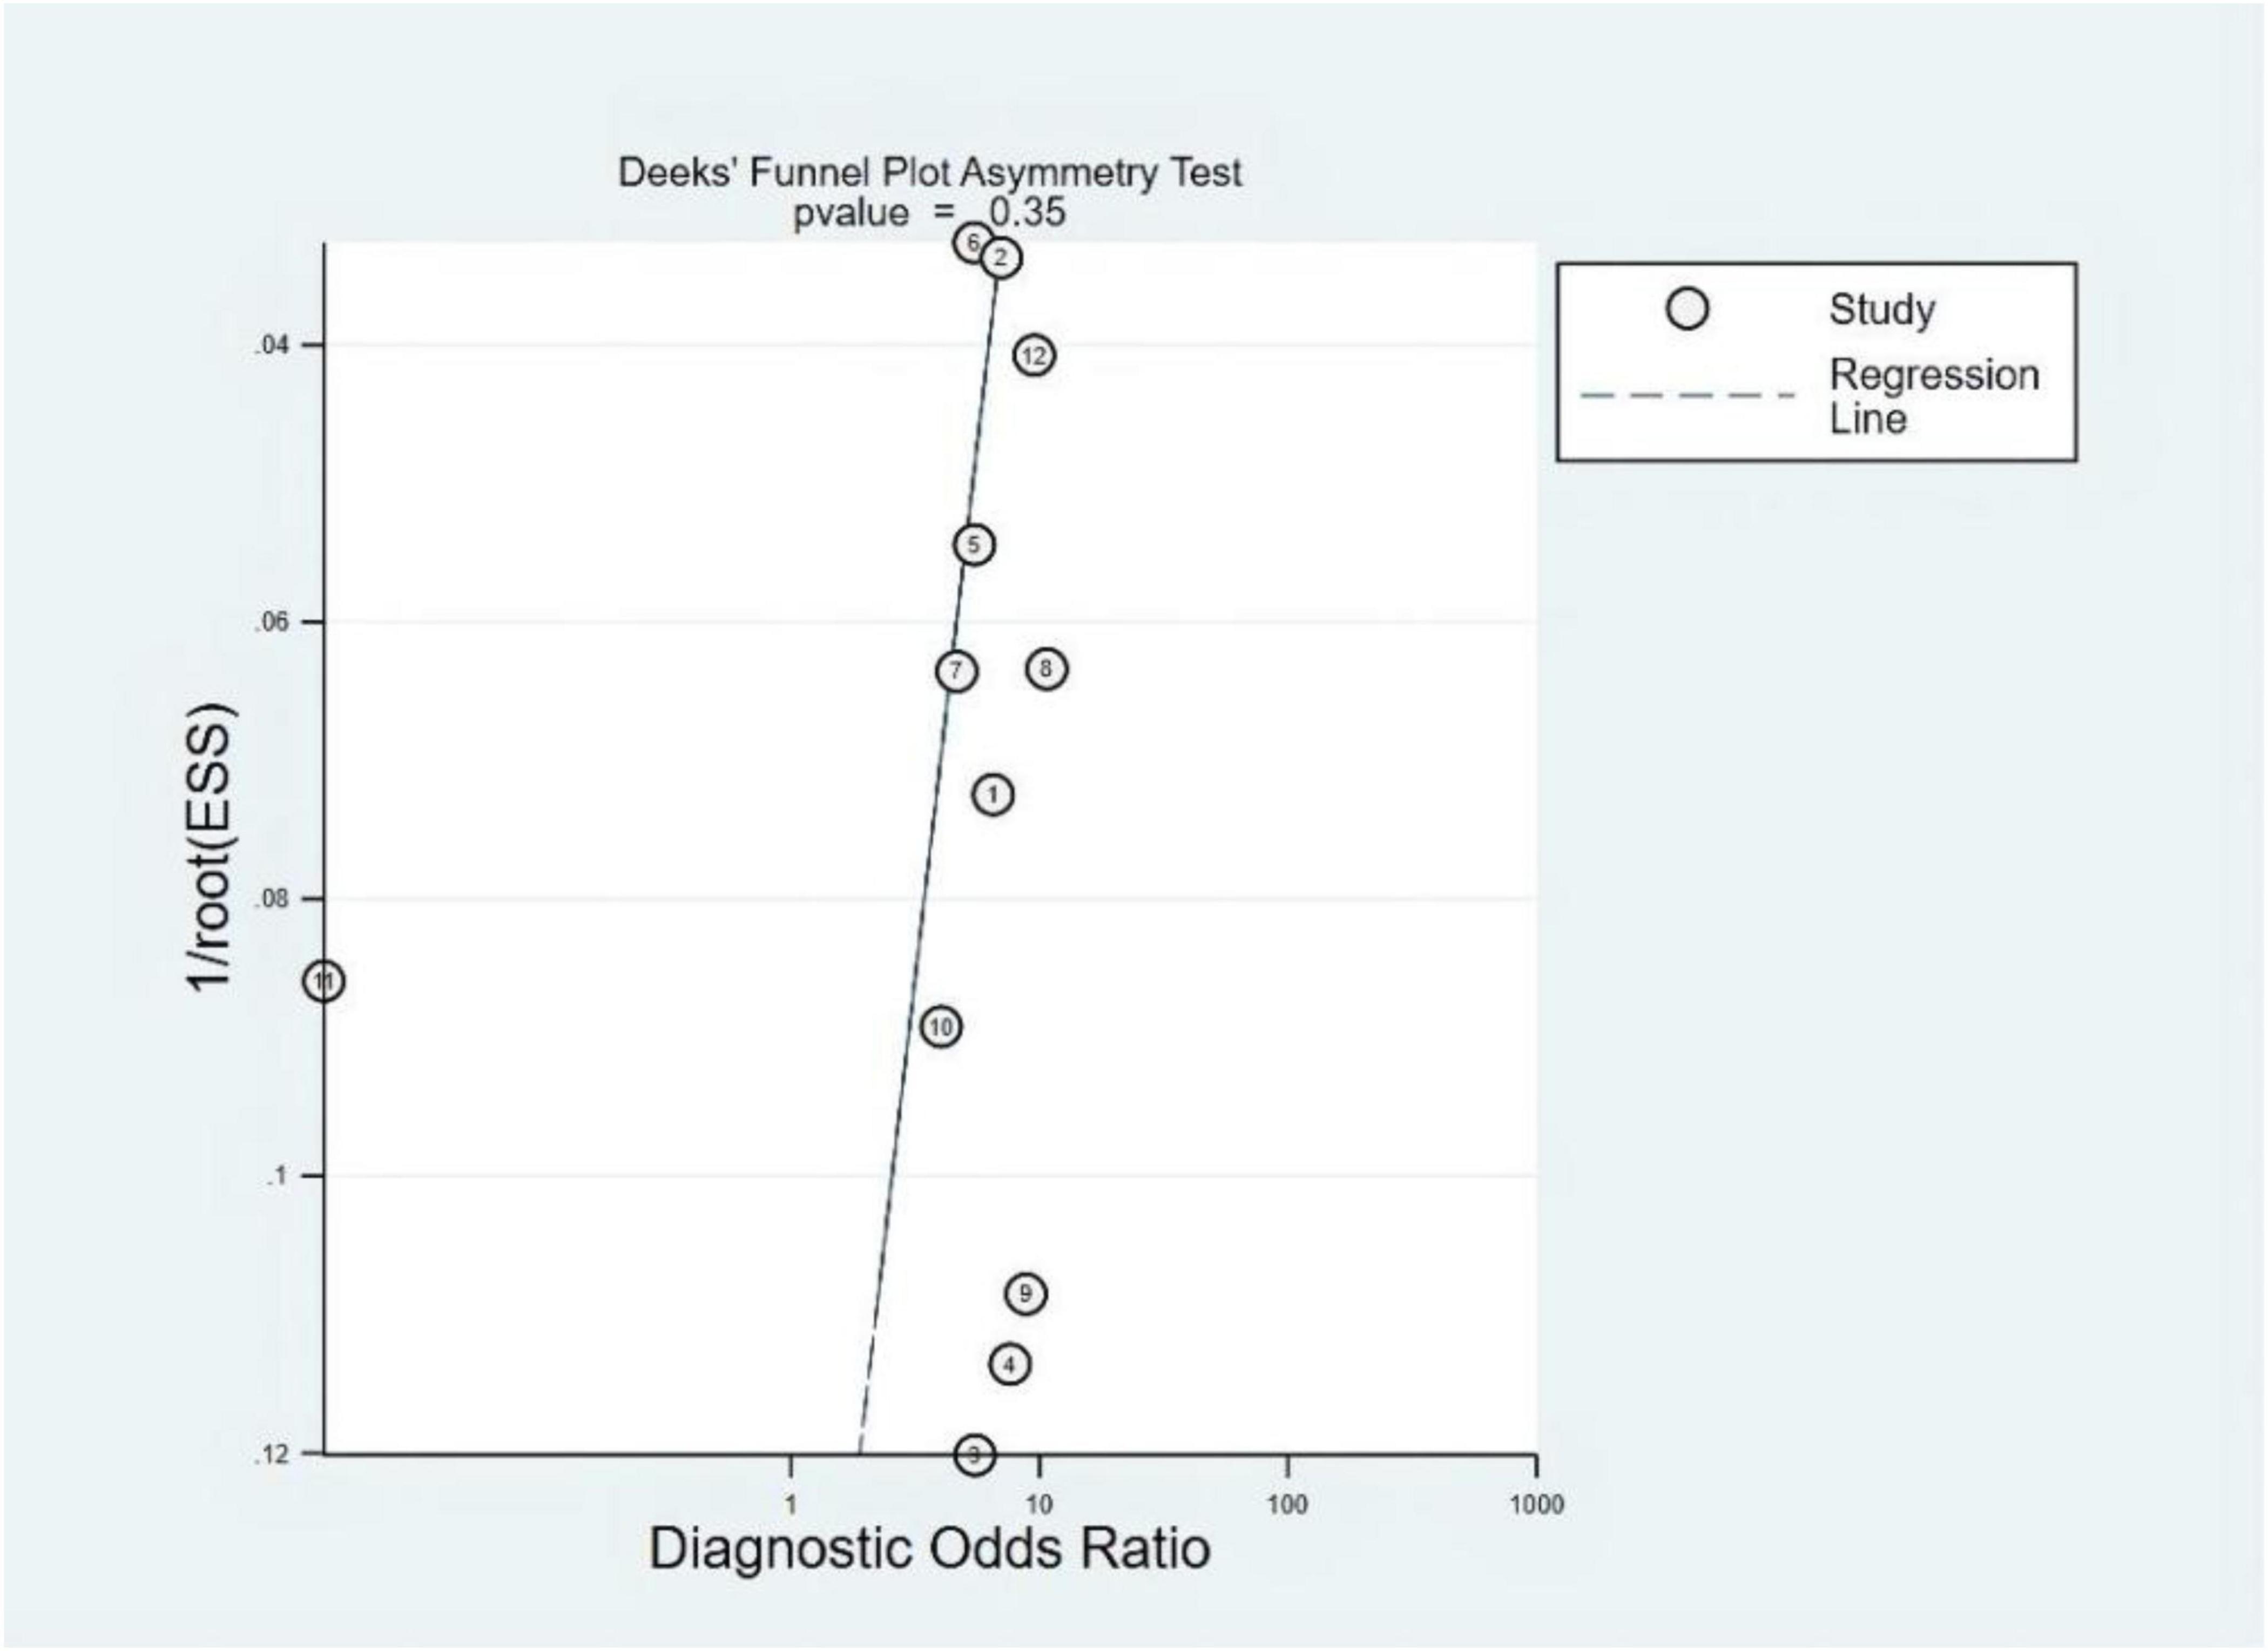
Figure 3. Deeks’ funnel plot.
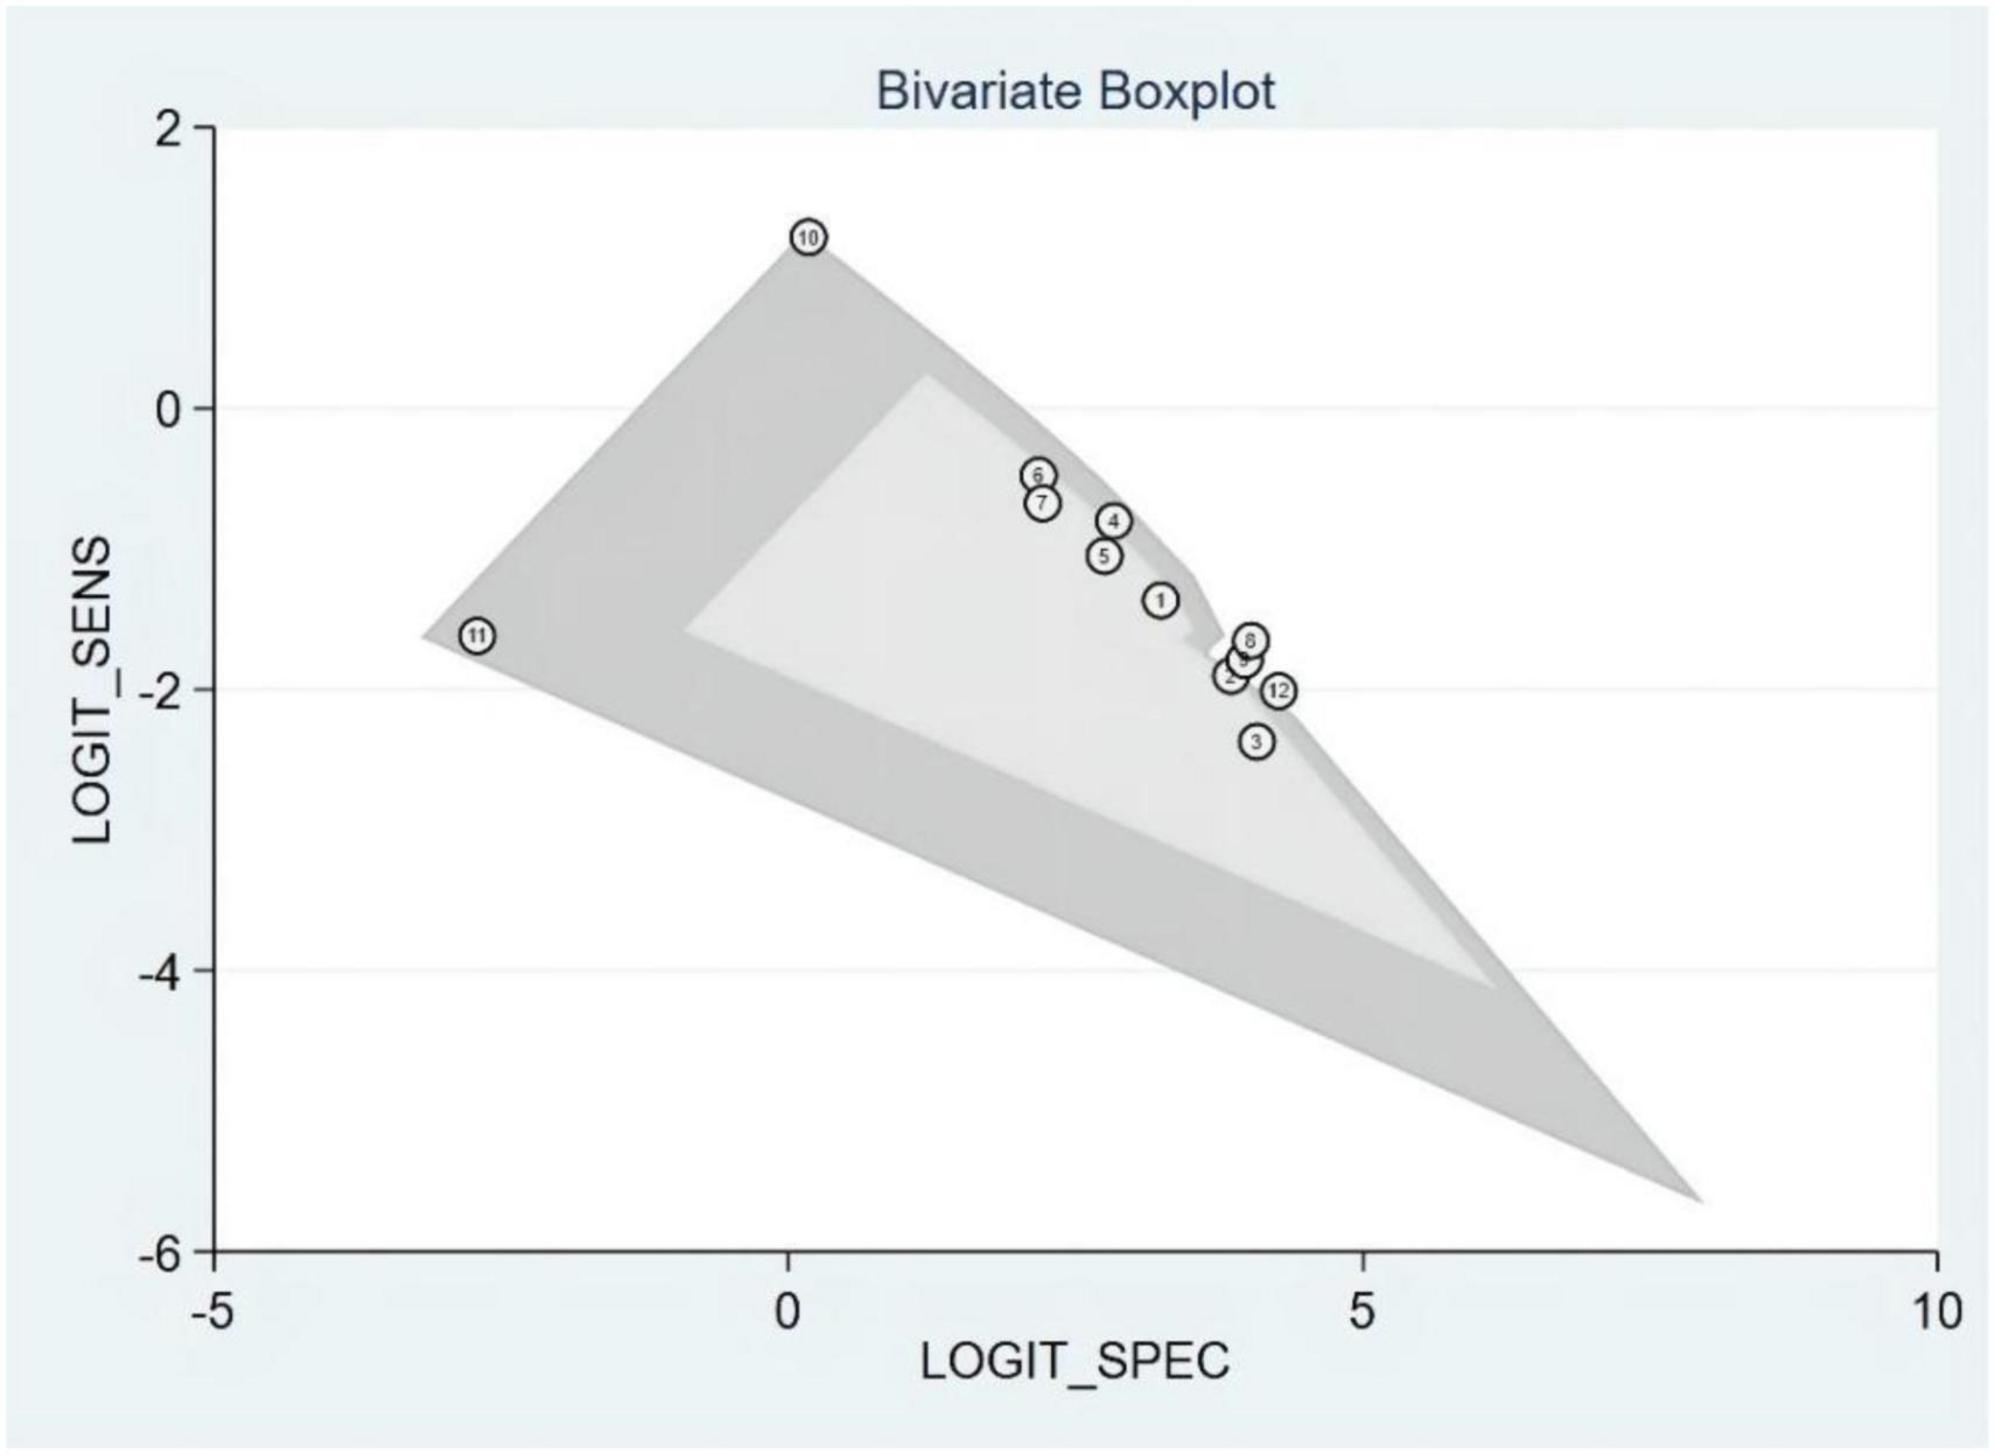
Figure 4. Bivariate boxplot.
The symmetric receiver operator characteristic curve curve plane test was used for the threshold effect. No typical “shoulder arm” was found, indicating no threshold effect. A moderate predictive value could be concluded by the value of the area under the SROC curve (AUC), which was 0.49 [95% CI (0.45–0.54)], as shown in Figure 5.
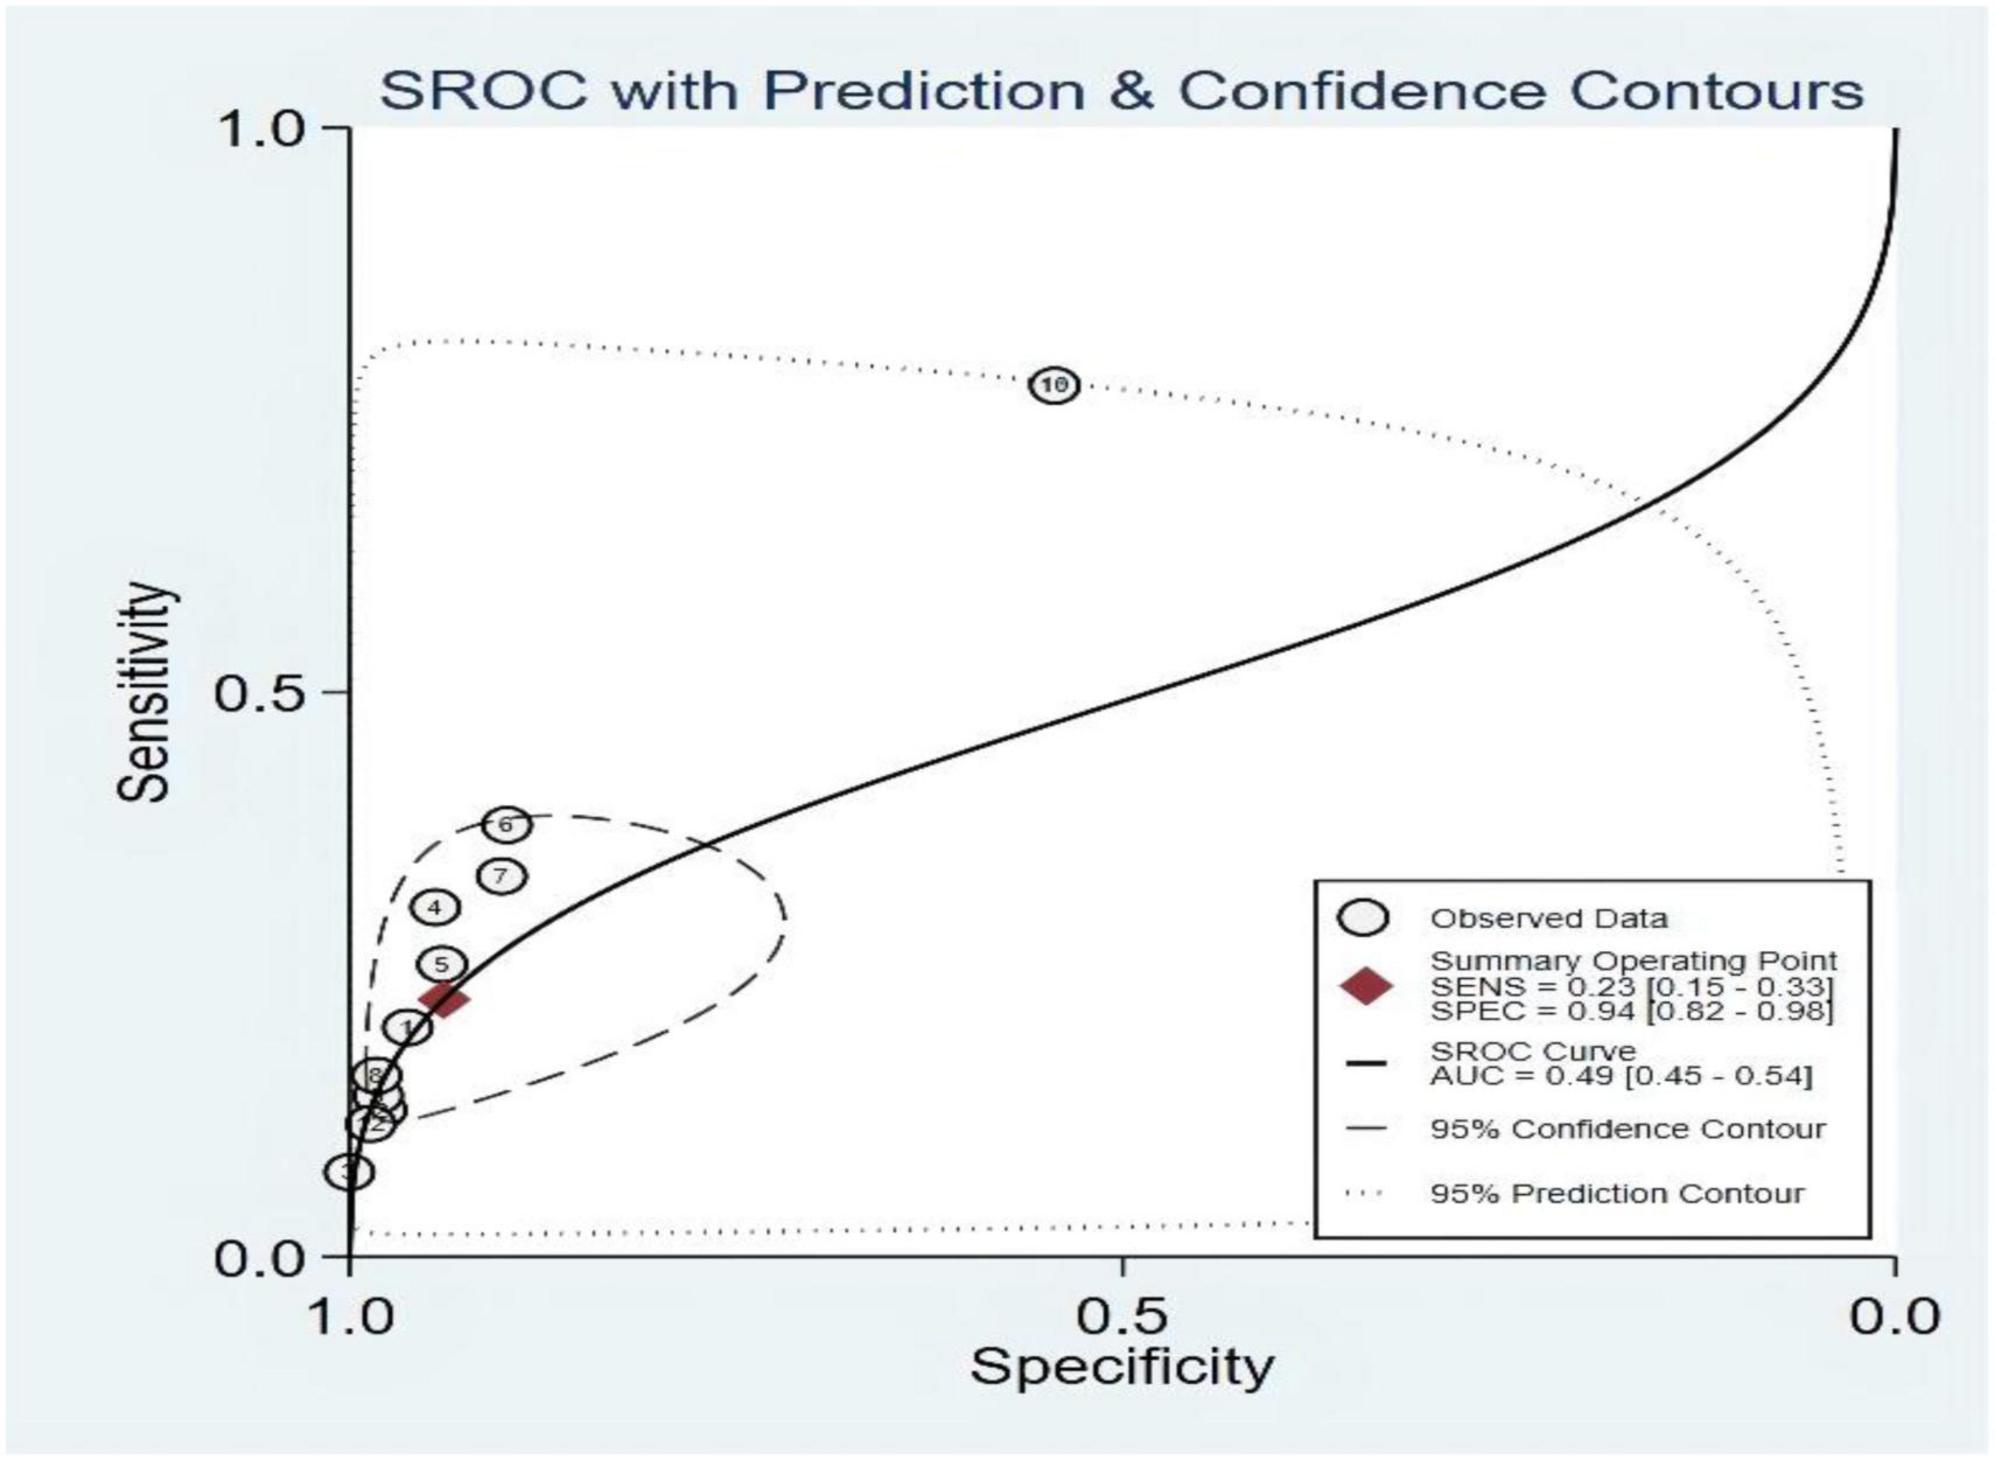
Figure 5. Summary receiver operating characteristic of third heart sound (S3).
The Fagan graph was plotted to show the relationship among the prior probability, the LR, and the posterior probability. The pre-test probability was 20% and the post-test probability of HF was 48%. In addition, the positive likelihood ratio (LRP) was <10 (LRP = 4) and the negative likelihood ratio (LRN) was >0.1 (LRN = 0.82), indicating that the diagnosis could neither be confirmed nor excluded. The predictive value of S3 in HF was limited, as shown in Figure 6.
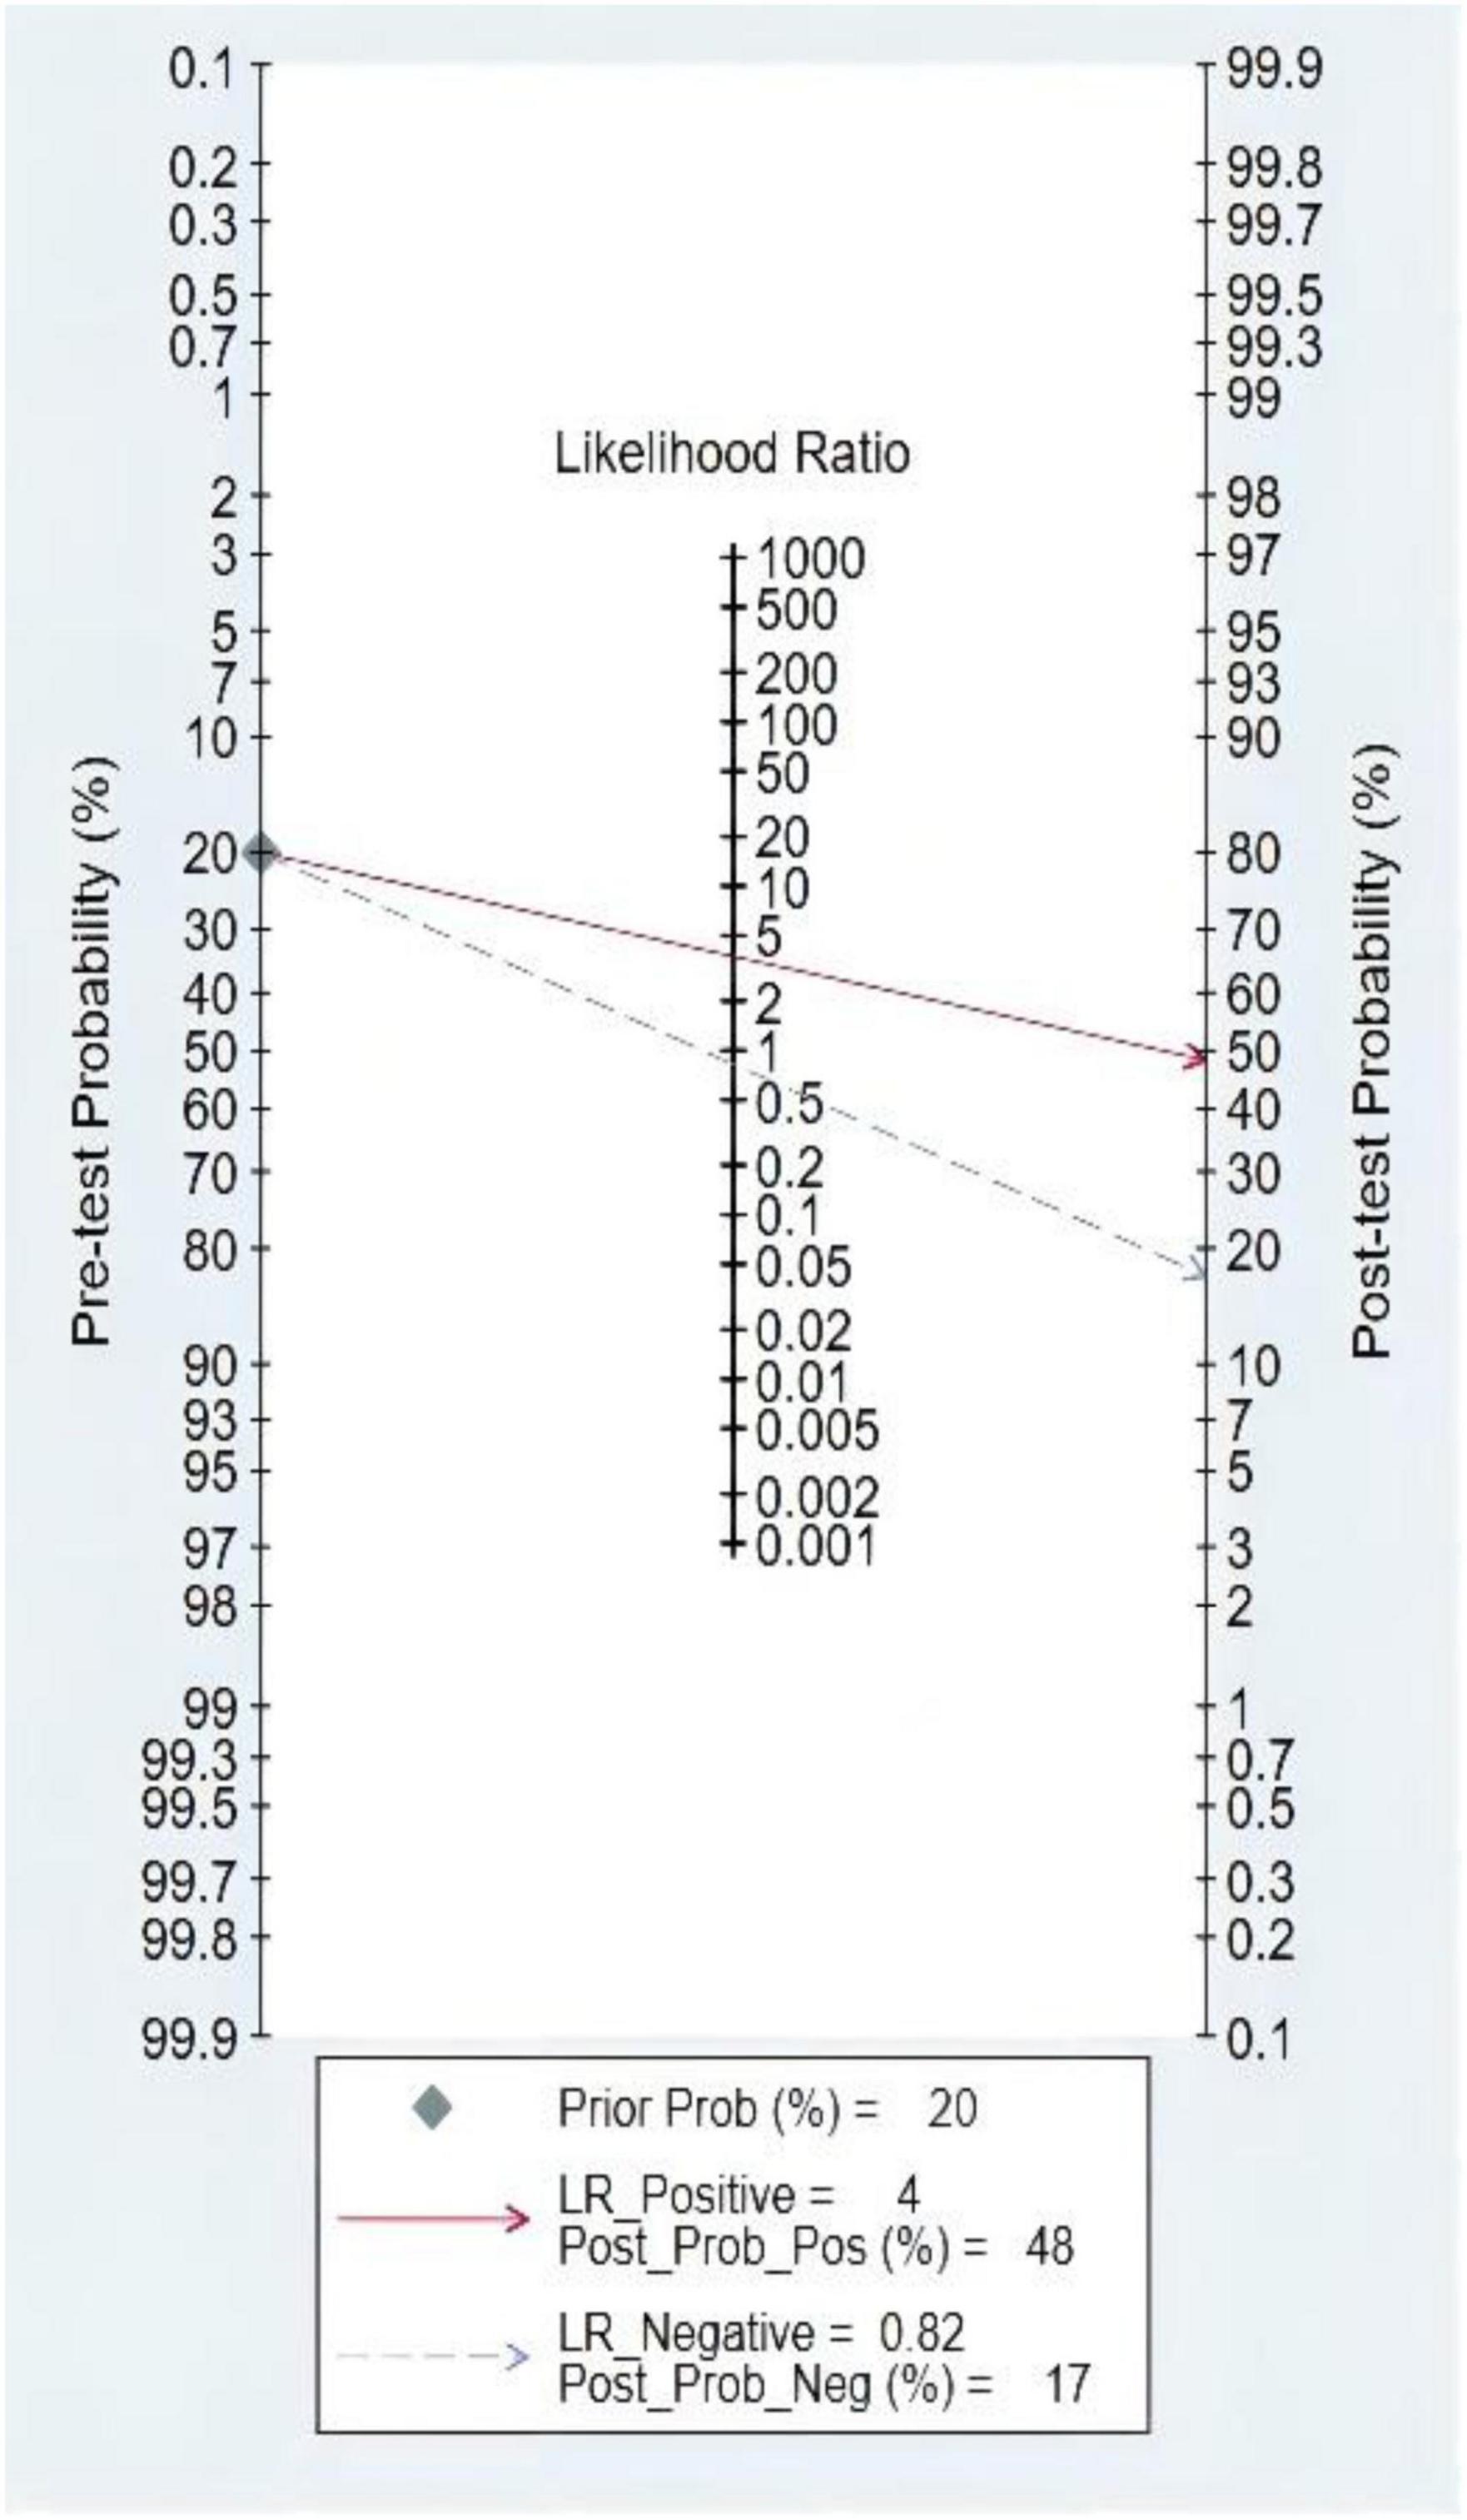
Figure 6. Fagan diagram of third heart sound (S3) in the diagnosis of heart failure (HF).
Among the S3 studies, the factors that might affect the heterogeneity, including prospective design (prodesign), partial verification bias (fulverif), an adequate description of study participants (subjdescr), report, a broad spectrum of diseases (brdspect), and whether the test results were evaluated by a blind method, were evaluated. The meta-regression analysis of the aforementioned factors revealed that the sources of heterogeneity of sensitivity were statistically related to subjdescr and the sources of heterogeneity of specificity were related to prodesign, as shown in Figure 7.
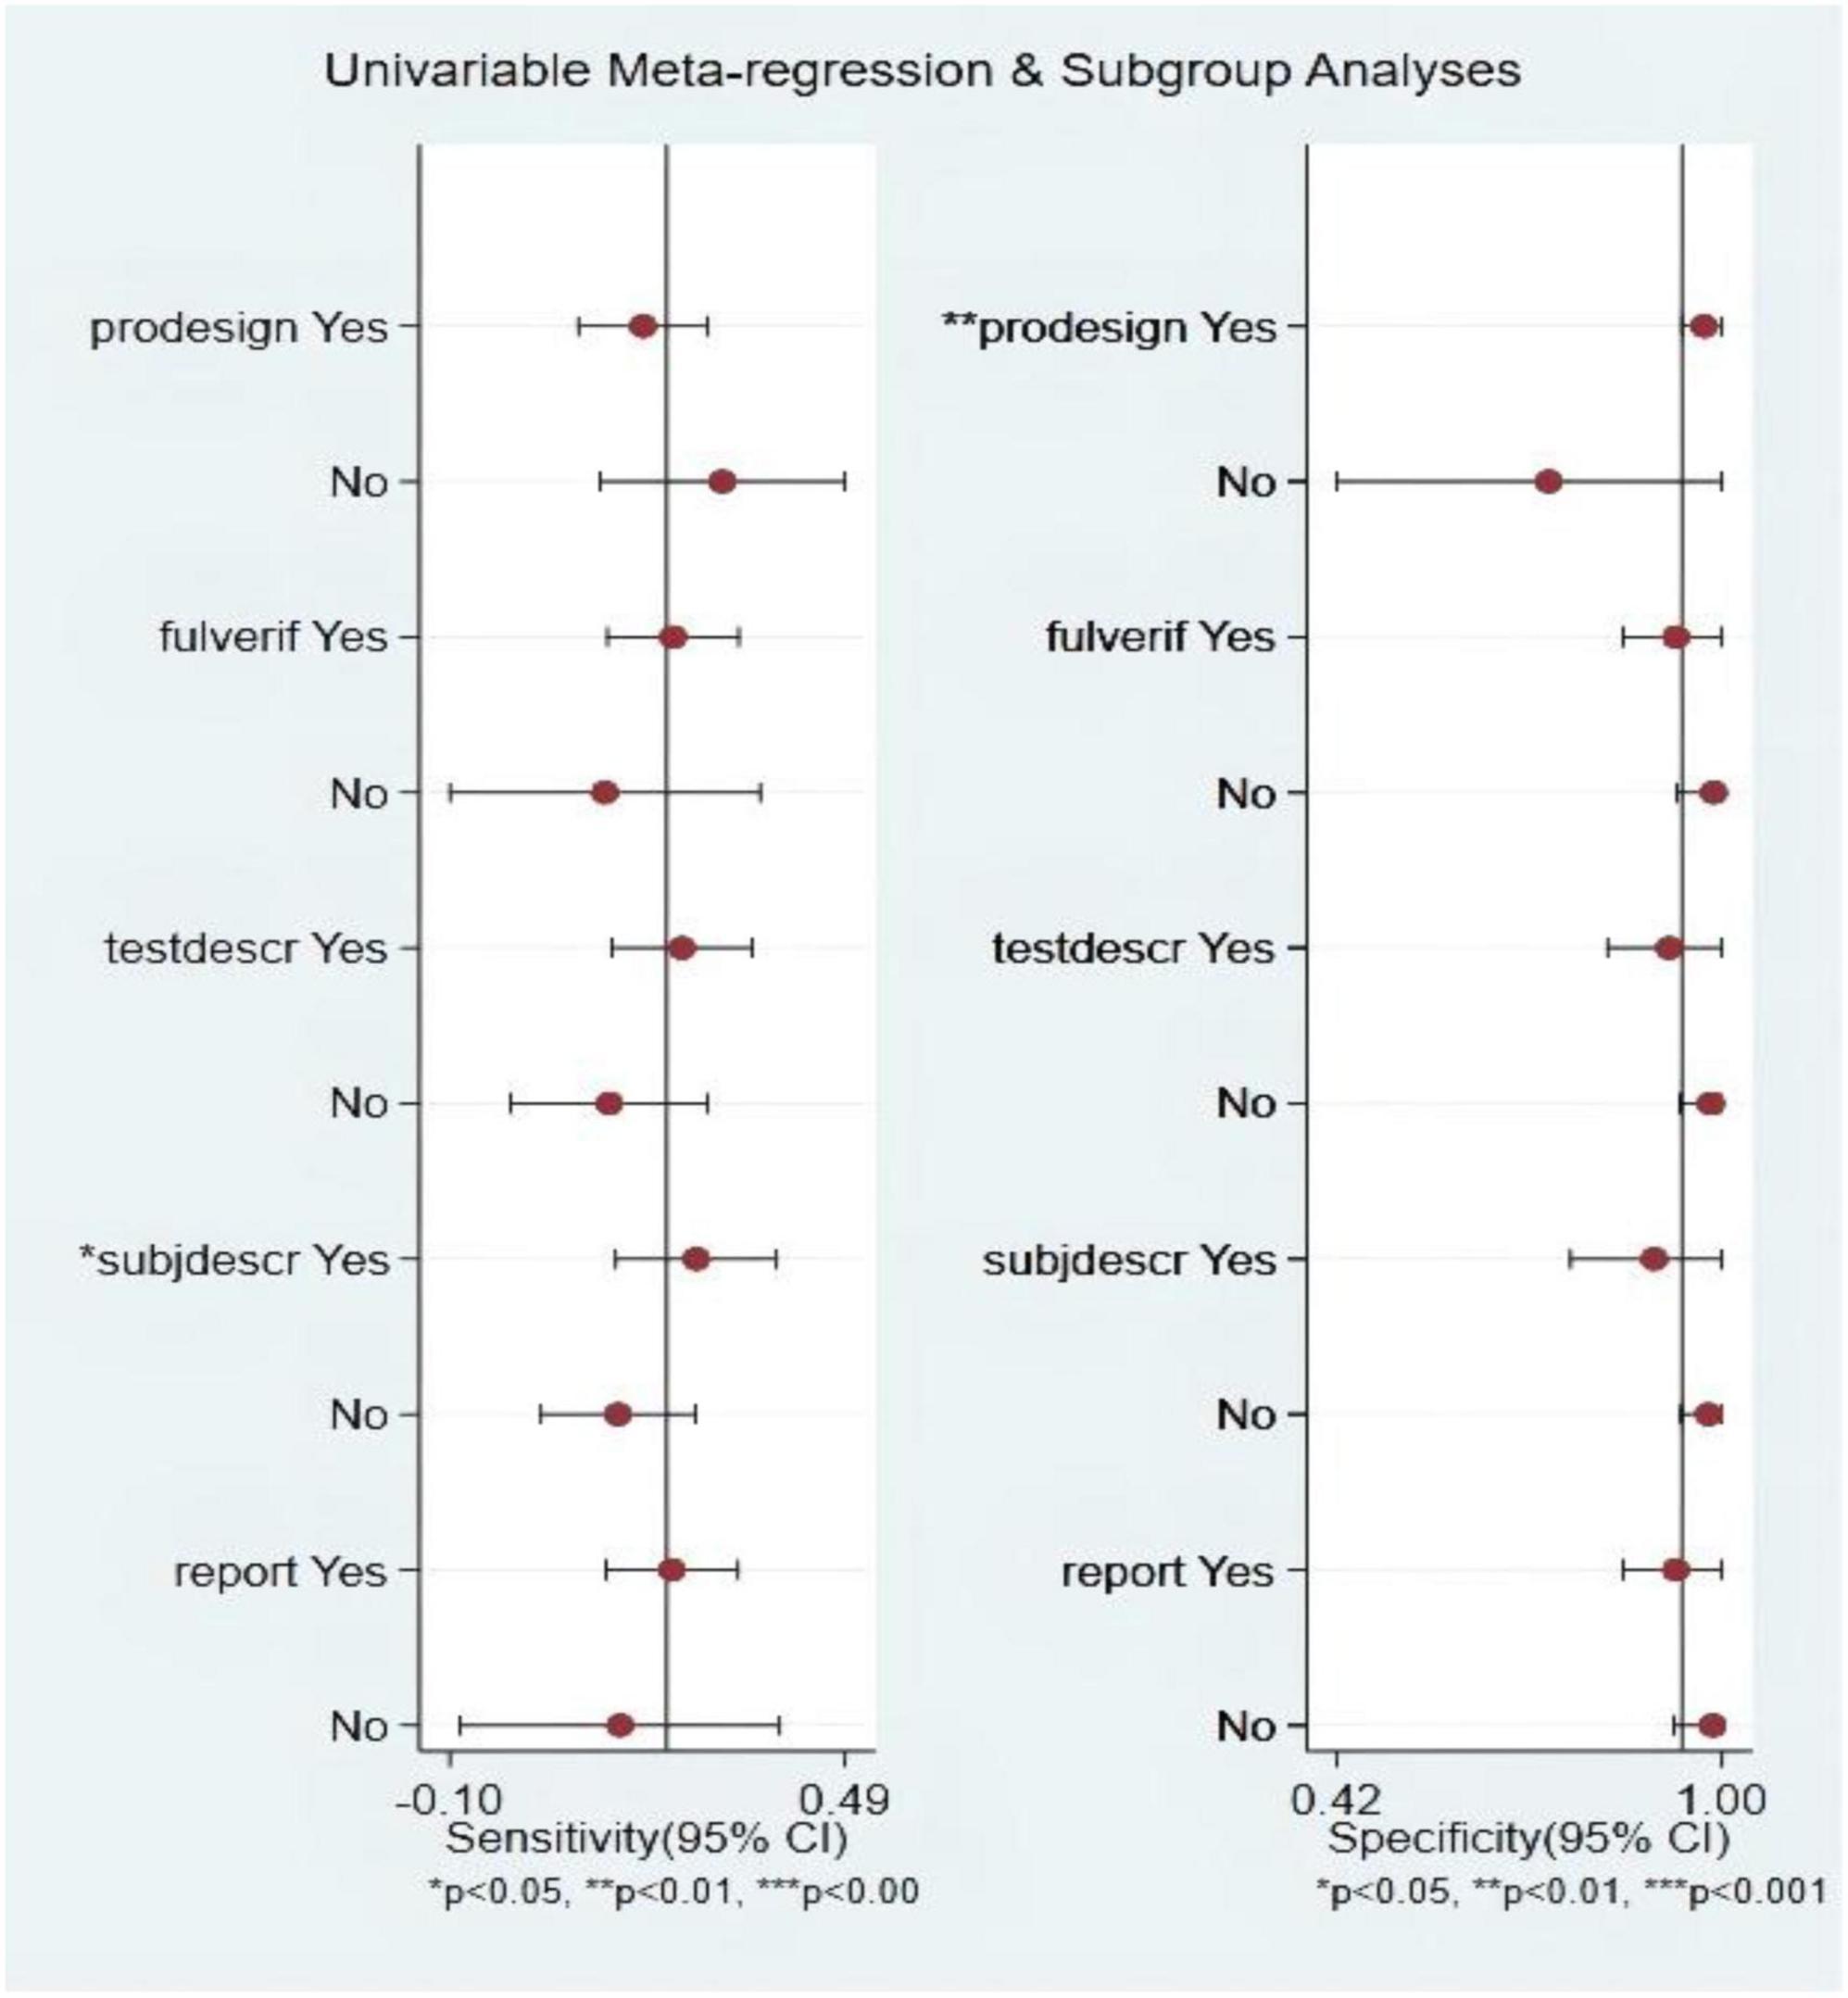
Figure 7. Multiple univariate meta-regression and subgroup analysis. Prospective design: prodesign; fulverif: partial verification bias; subjdescr: adequate description of study participants; brdspect: broad spectrum of disease.
The combined sensitivity was 0.70 (95% CI, 0.53–0.83), specificity was 0.79 (95% CI, 0.75–0.82), PLR was 3.31 (95% CI, 2.46–4.44), NLR was 0.38 (95% CI, 0.23–0.64), and DOR was 8.64, indicating that the LVEF had a medium value in the screening of HF. The heterogeneity was I2 > 50%; therefore, the random model was used, as shown in Figure 8.
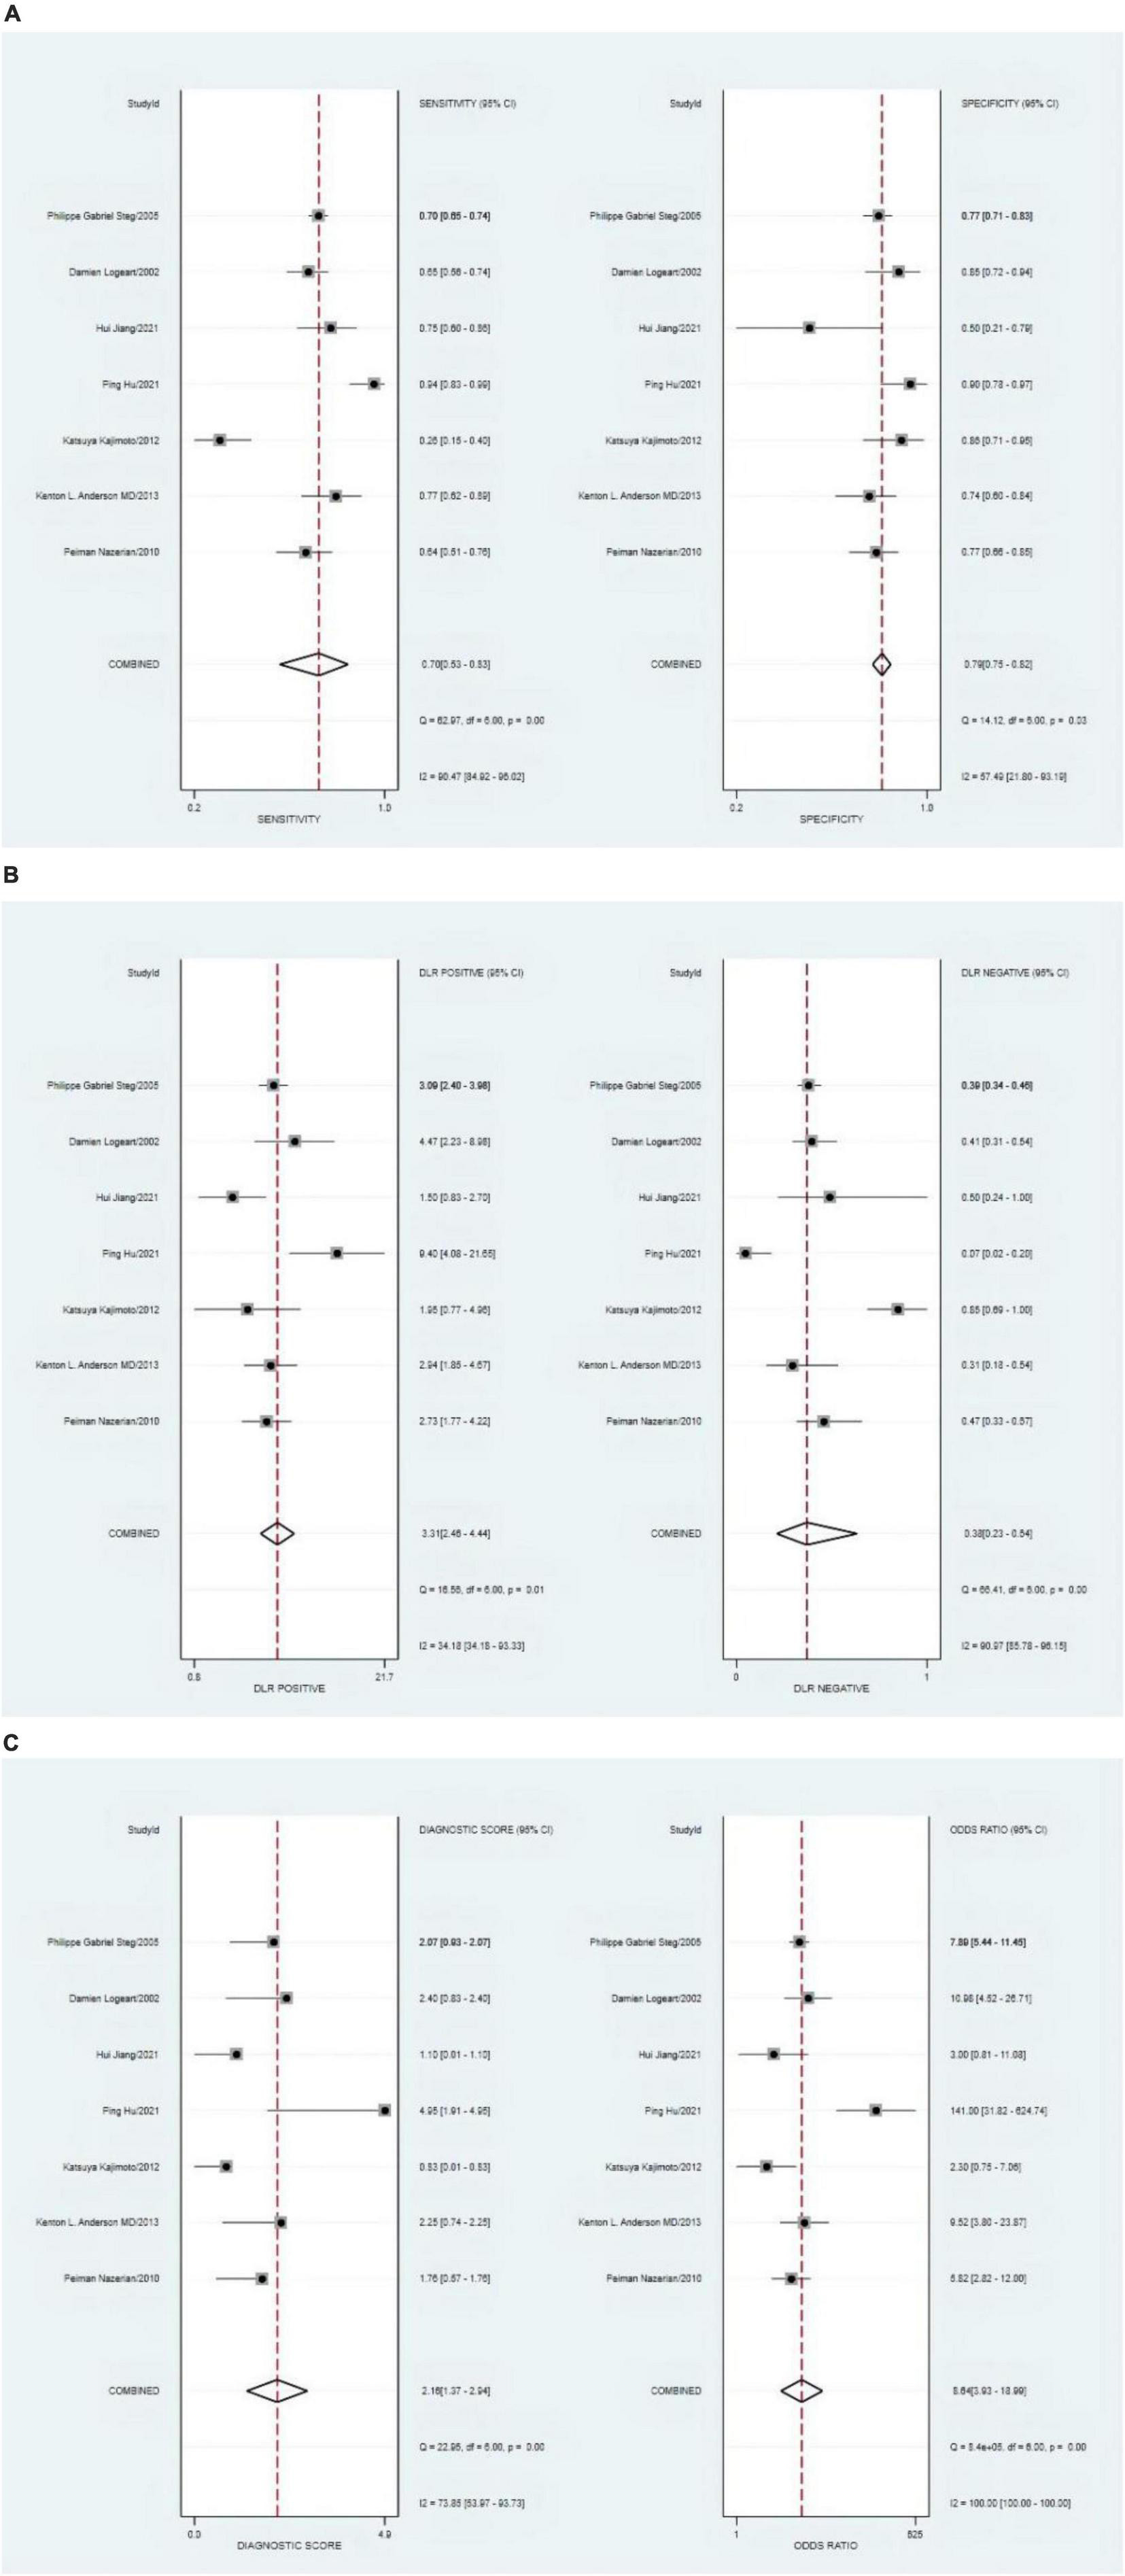
Figure 8. (A) Forest plot of sensitivity and specificity of left ventricular ejection fraction (LVEF) in diagnosing heart failure (HF). (B) Forest plot of DLR positives and negatives of HF. (C) Forest plot of the diagnostic odds ratio (DOR) of LVEF in diagnosing HF.
The P-value of Deeks’ funnel plots asymmetry test was 0.90 (P > 0.05). As shown in Figure 9, no evidence of publication bias was found. It demonstrated that three sets of data were out of the circles, indicating heterogeneity between included studies. The details are shown in Figure 10.
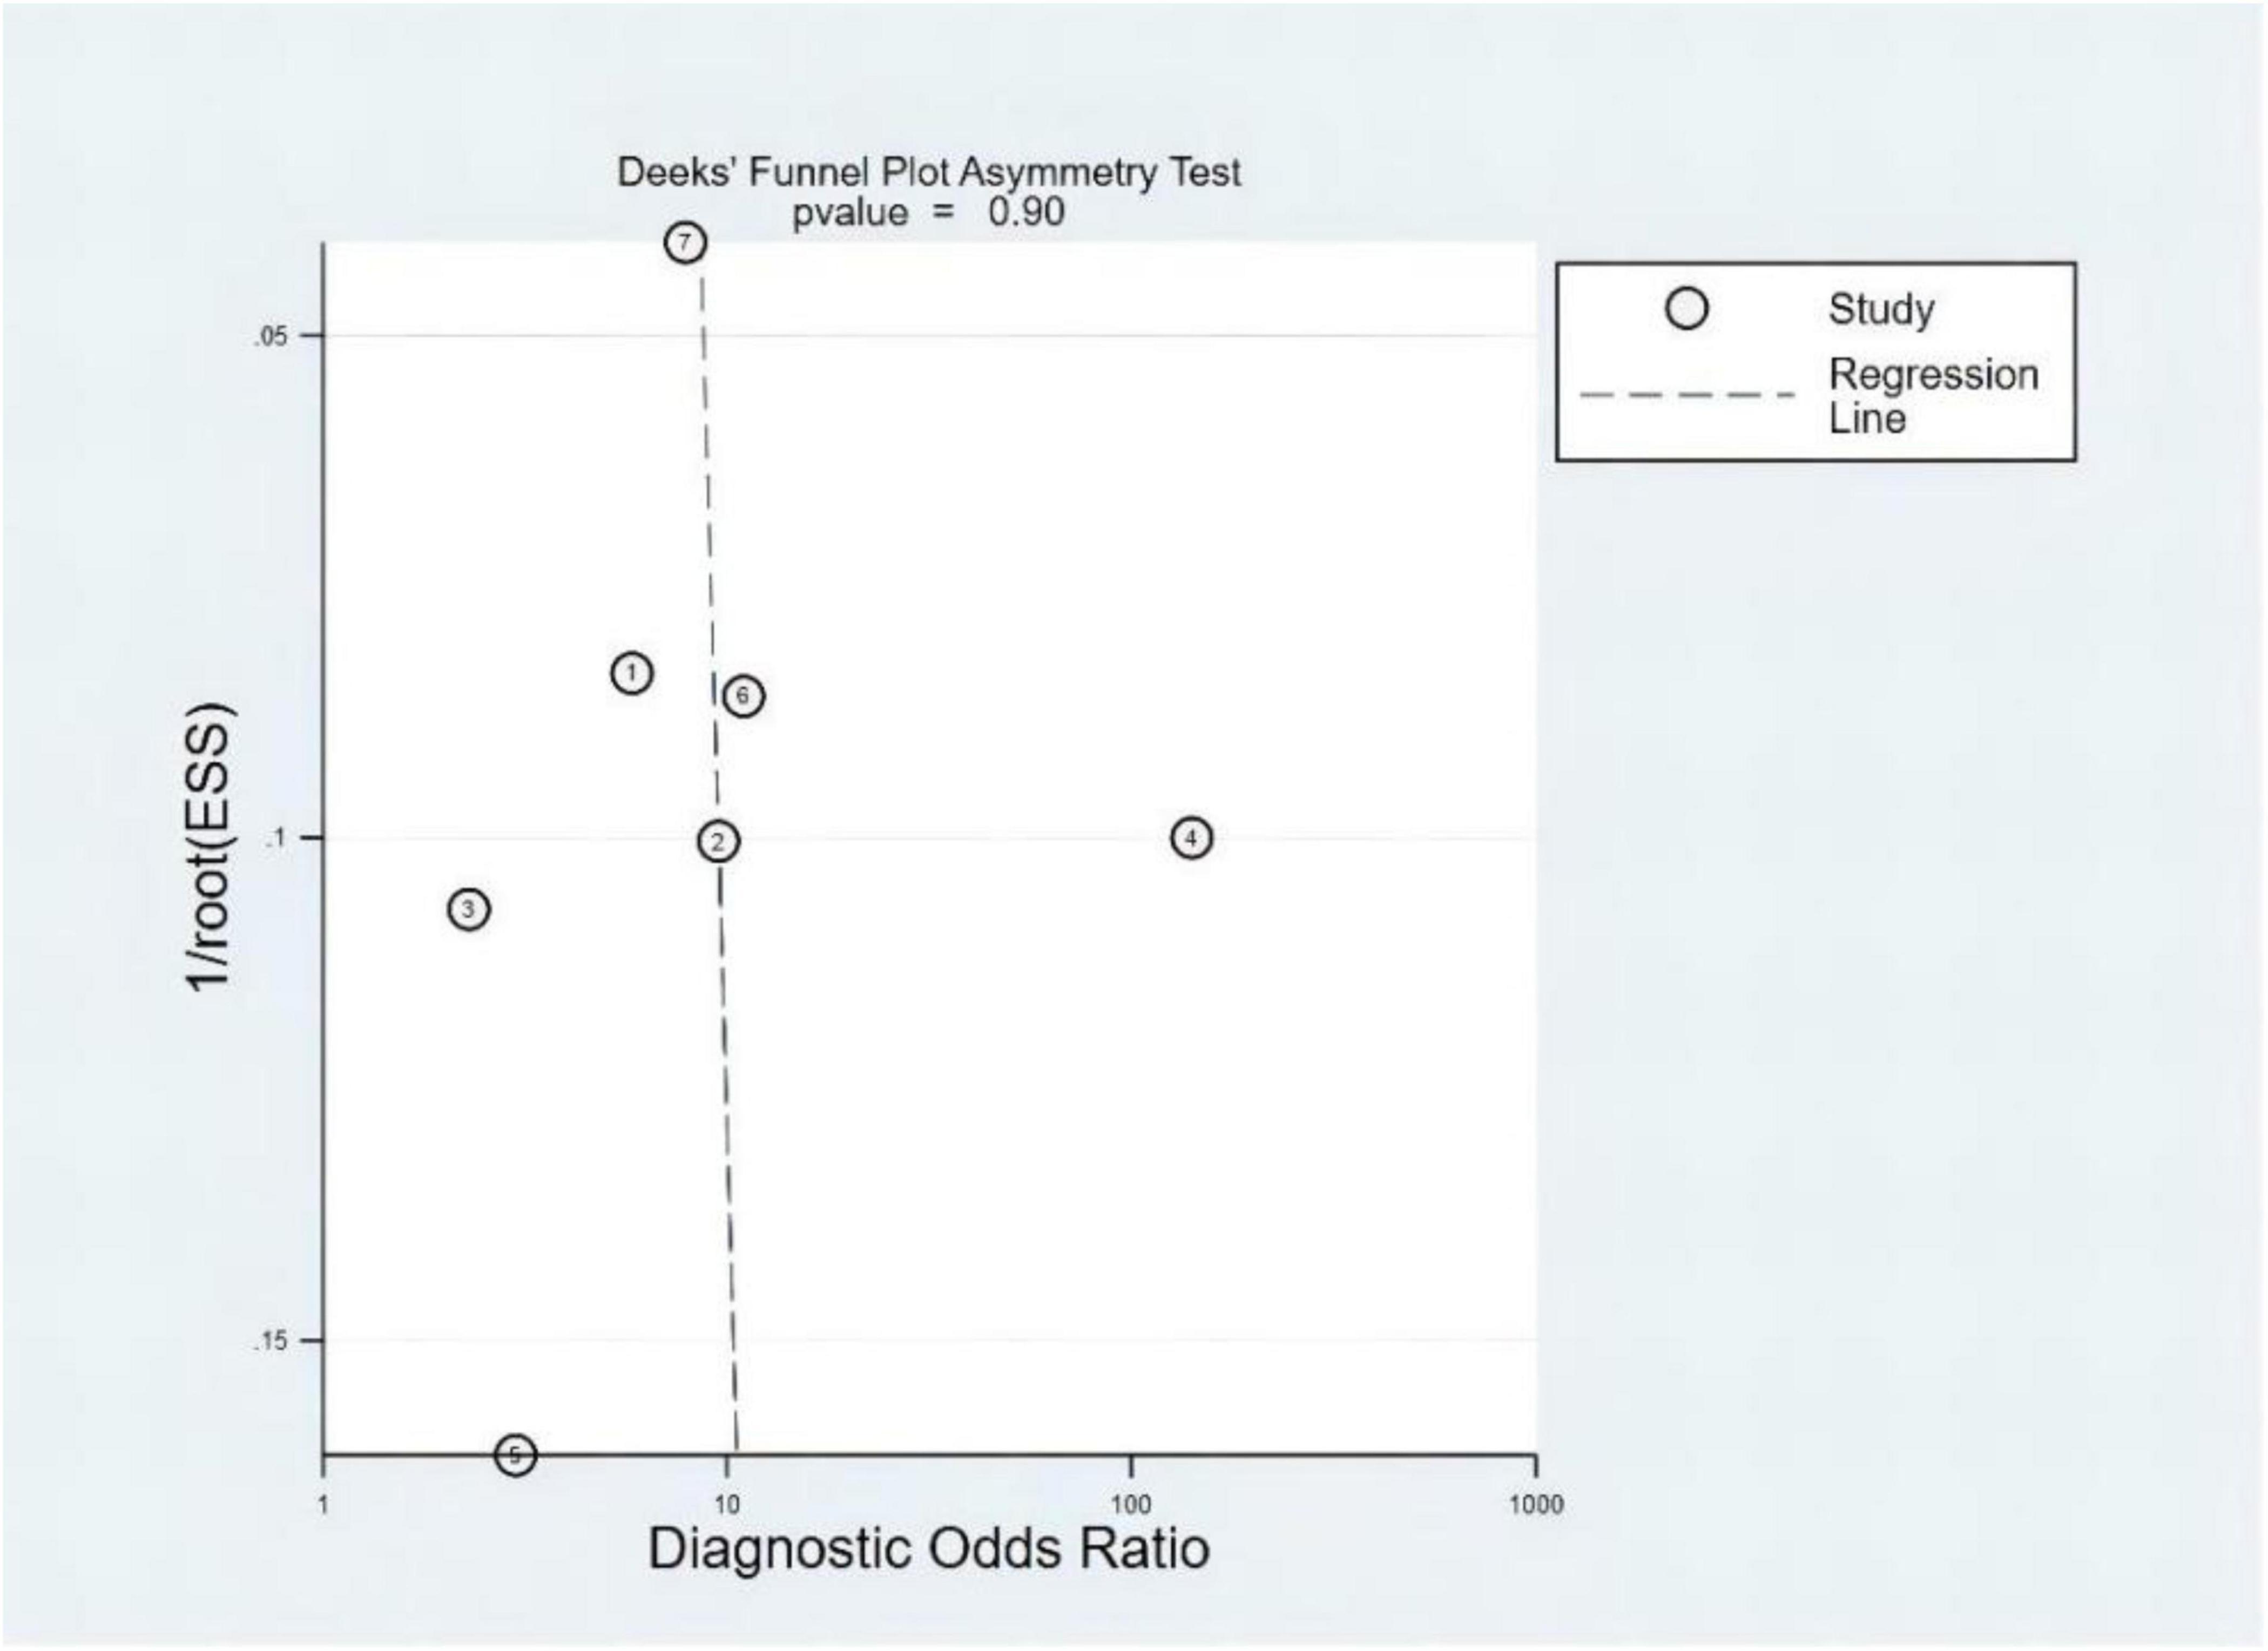
Figure 9. Deeks’ funnel plot.
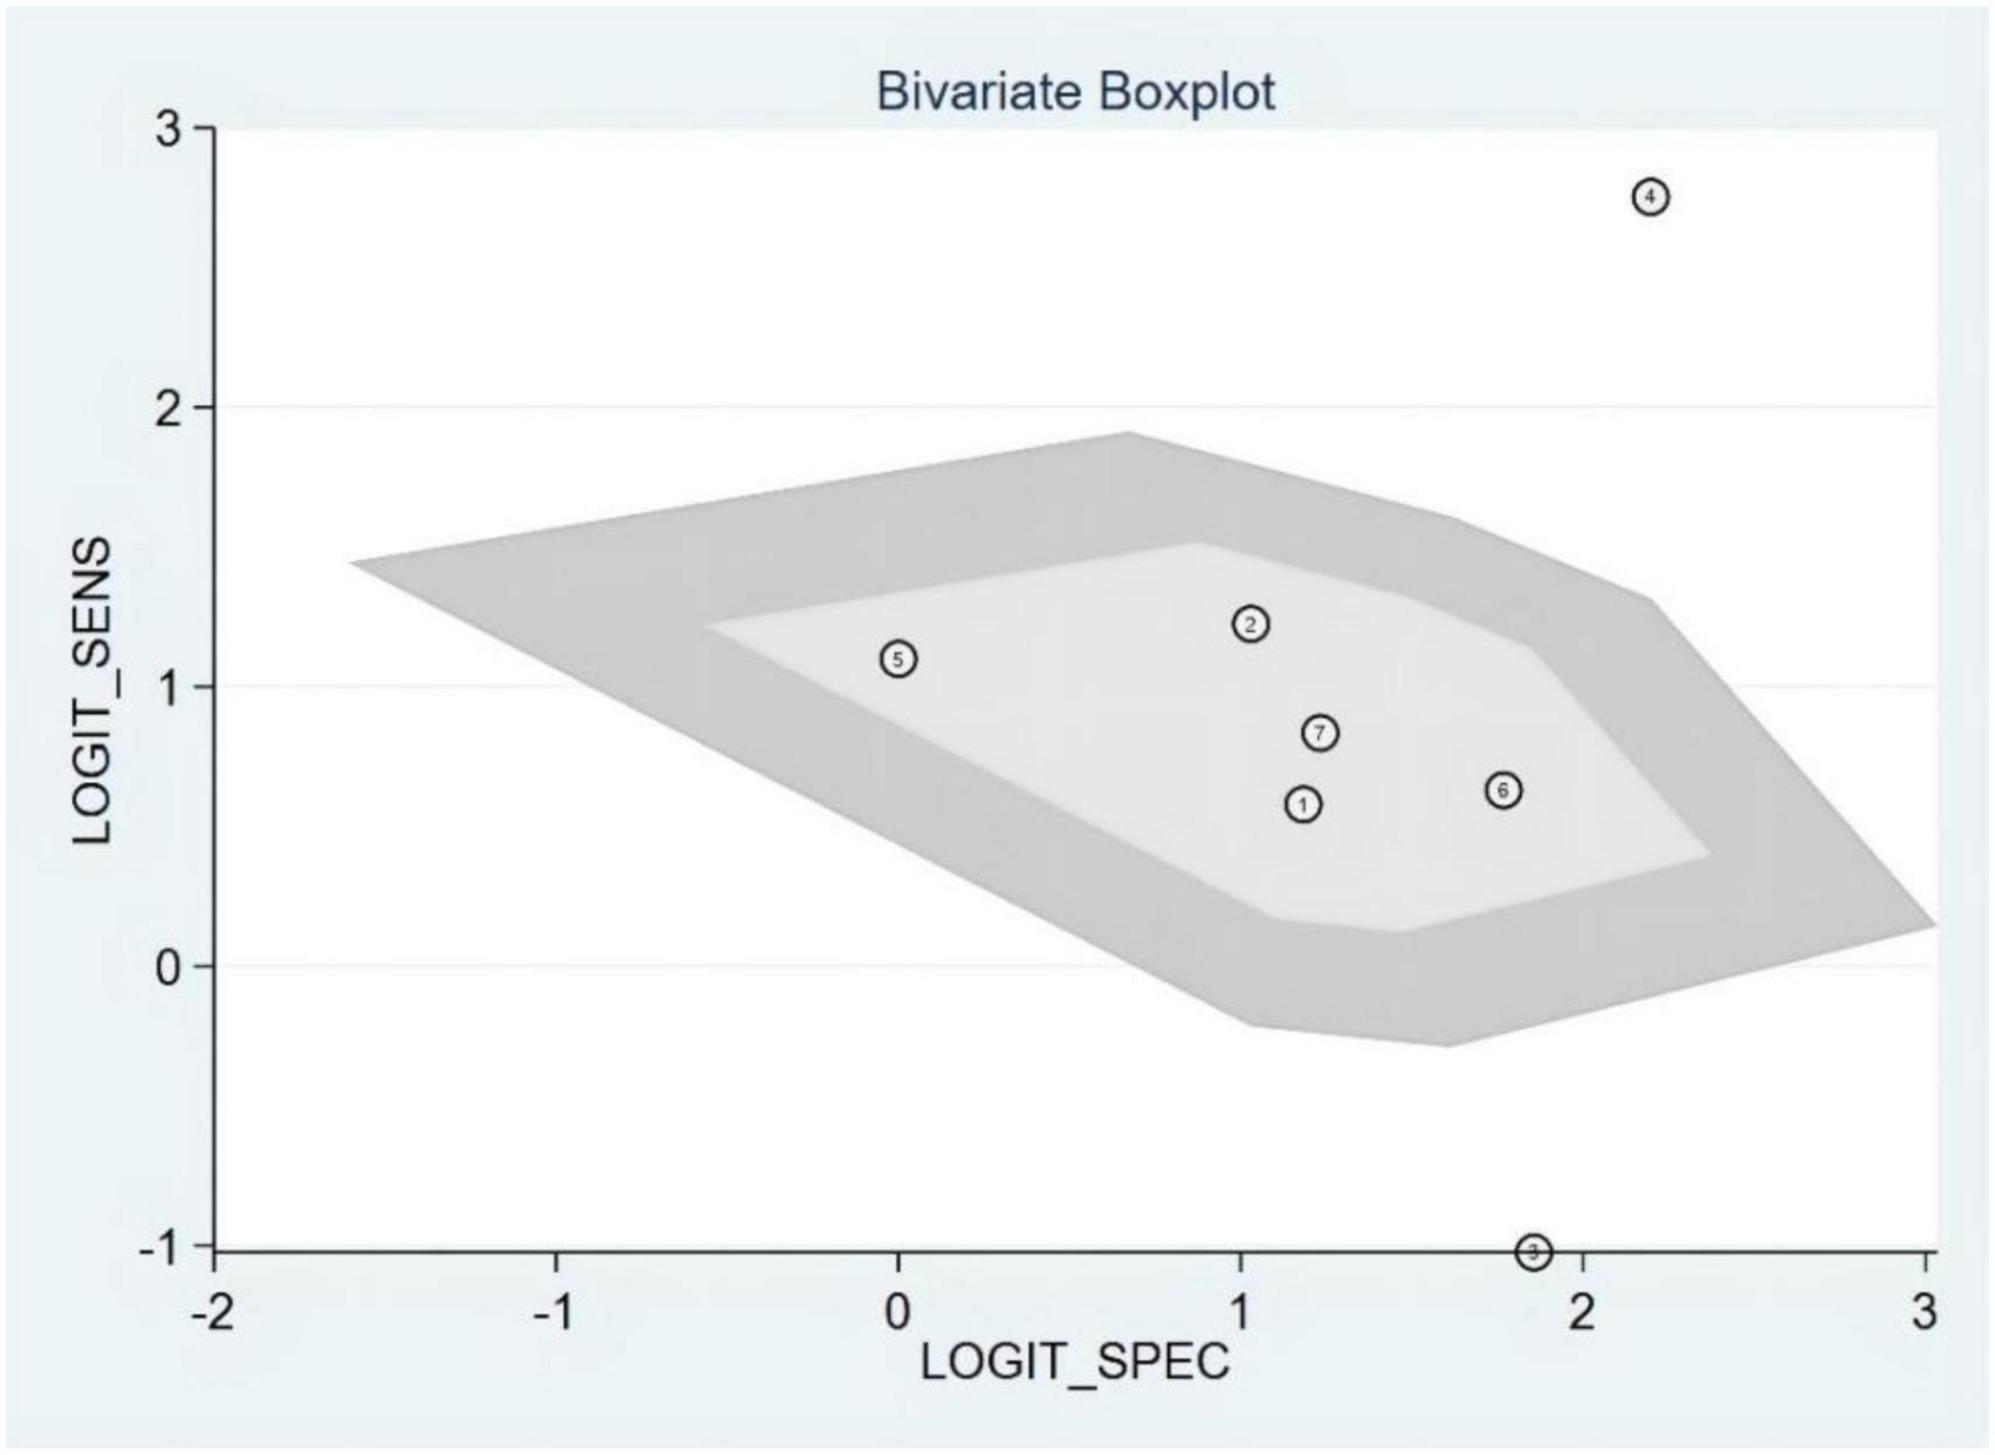
Figure 10. Bivariate boxplot.
The threshold effect was assessed using the SROC curve plane test. As no typical “shoulder arm” was found, no threshold effect was observed. A moderate predictive value could be concluded using the value of the AUC, which was 0.79 (95% CI, 0.75–0.83). The details are shown in Figure 11.
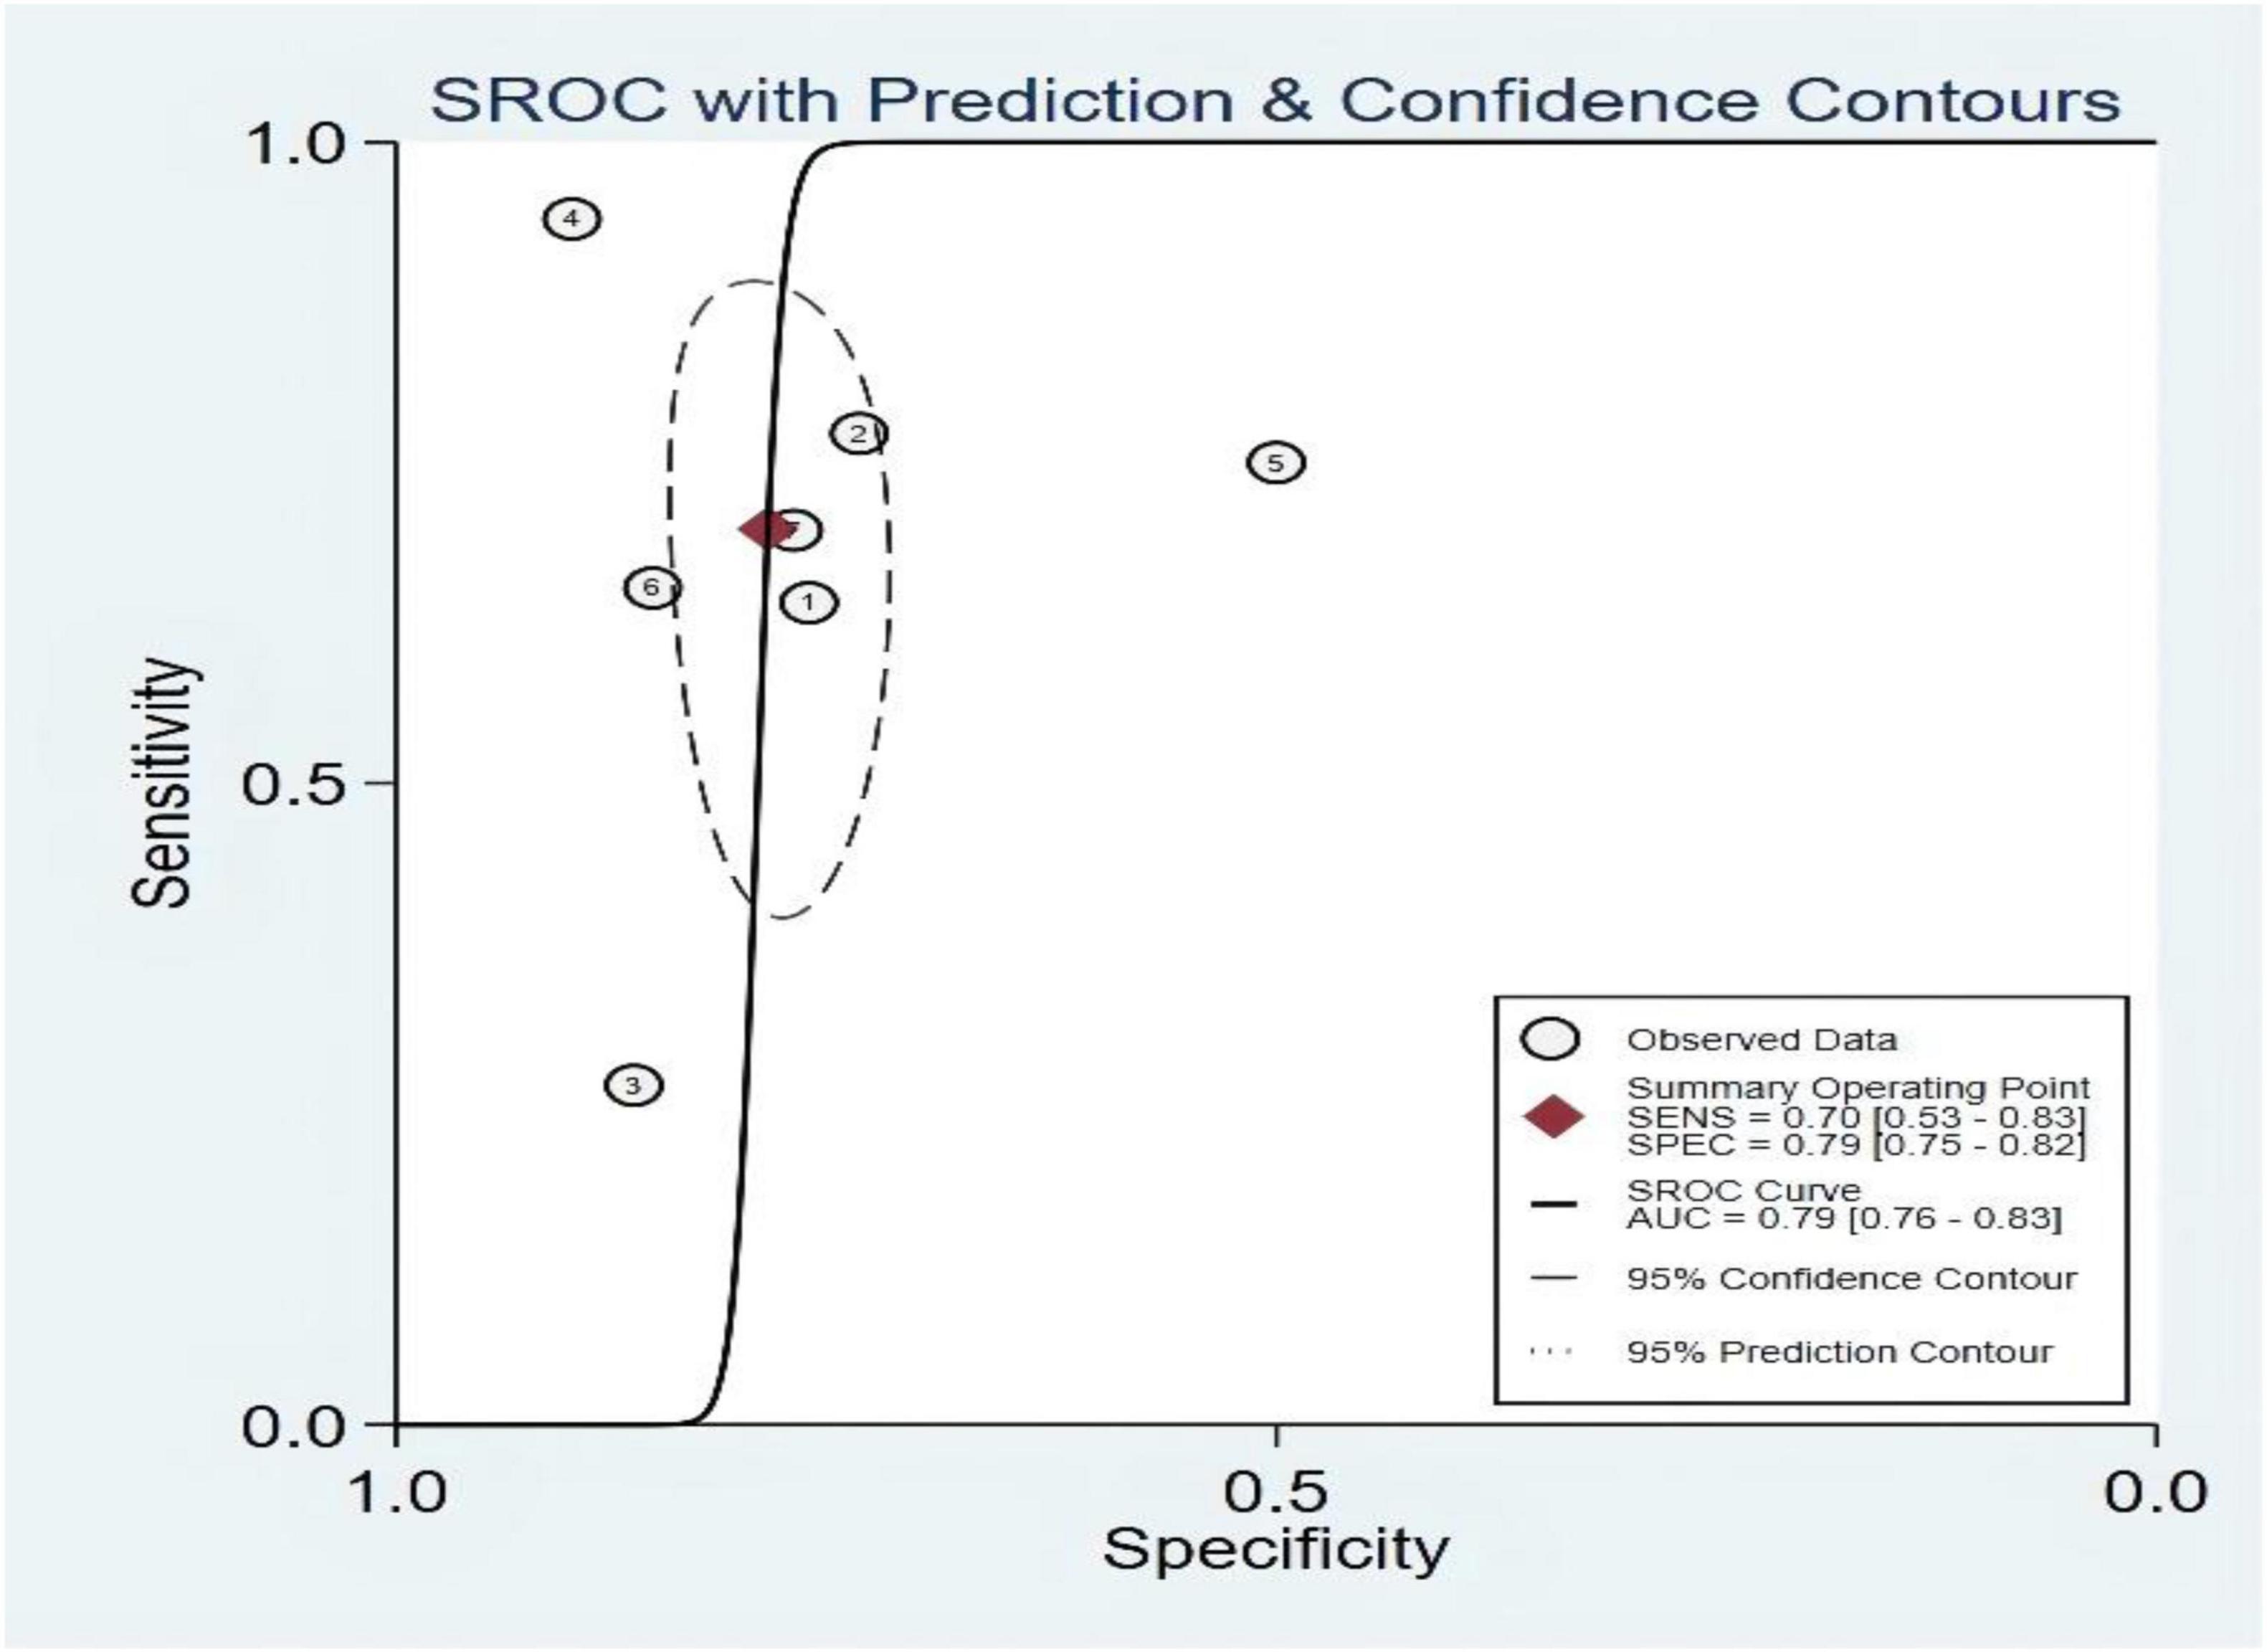
Figure 11. Summary receiver operating characteristic of left ventricular ejection fraction (LVEF).
The pre-test probability was 20%, and the probability of HF was 45%. In addition, the LRP was <10 (LRP = 3) and the LRN was >0.1 (LRN = 0.38), indicating that the diagnosis could be neither confirmed nor excluded. Their predictive value of LVEF in HF was also limited. The details are also shown in Figure 12.
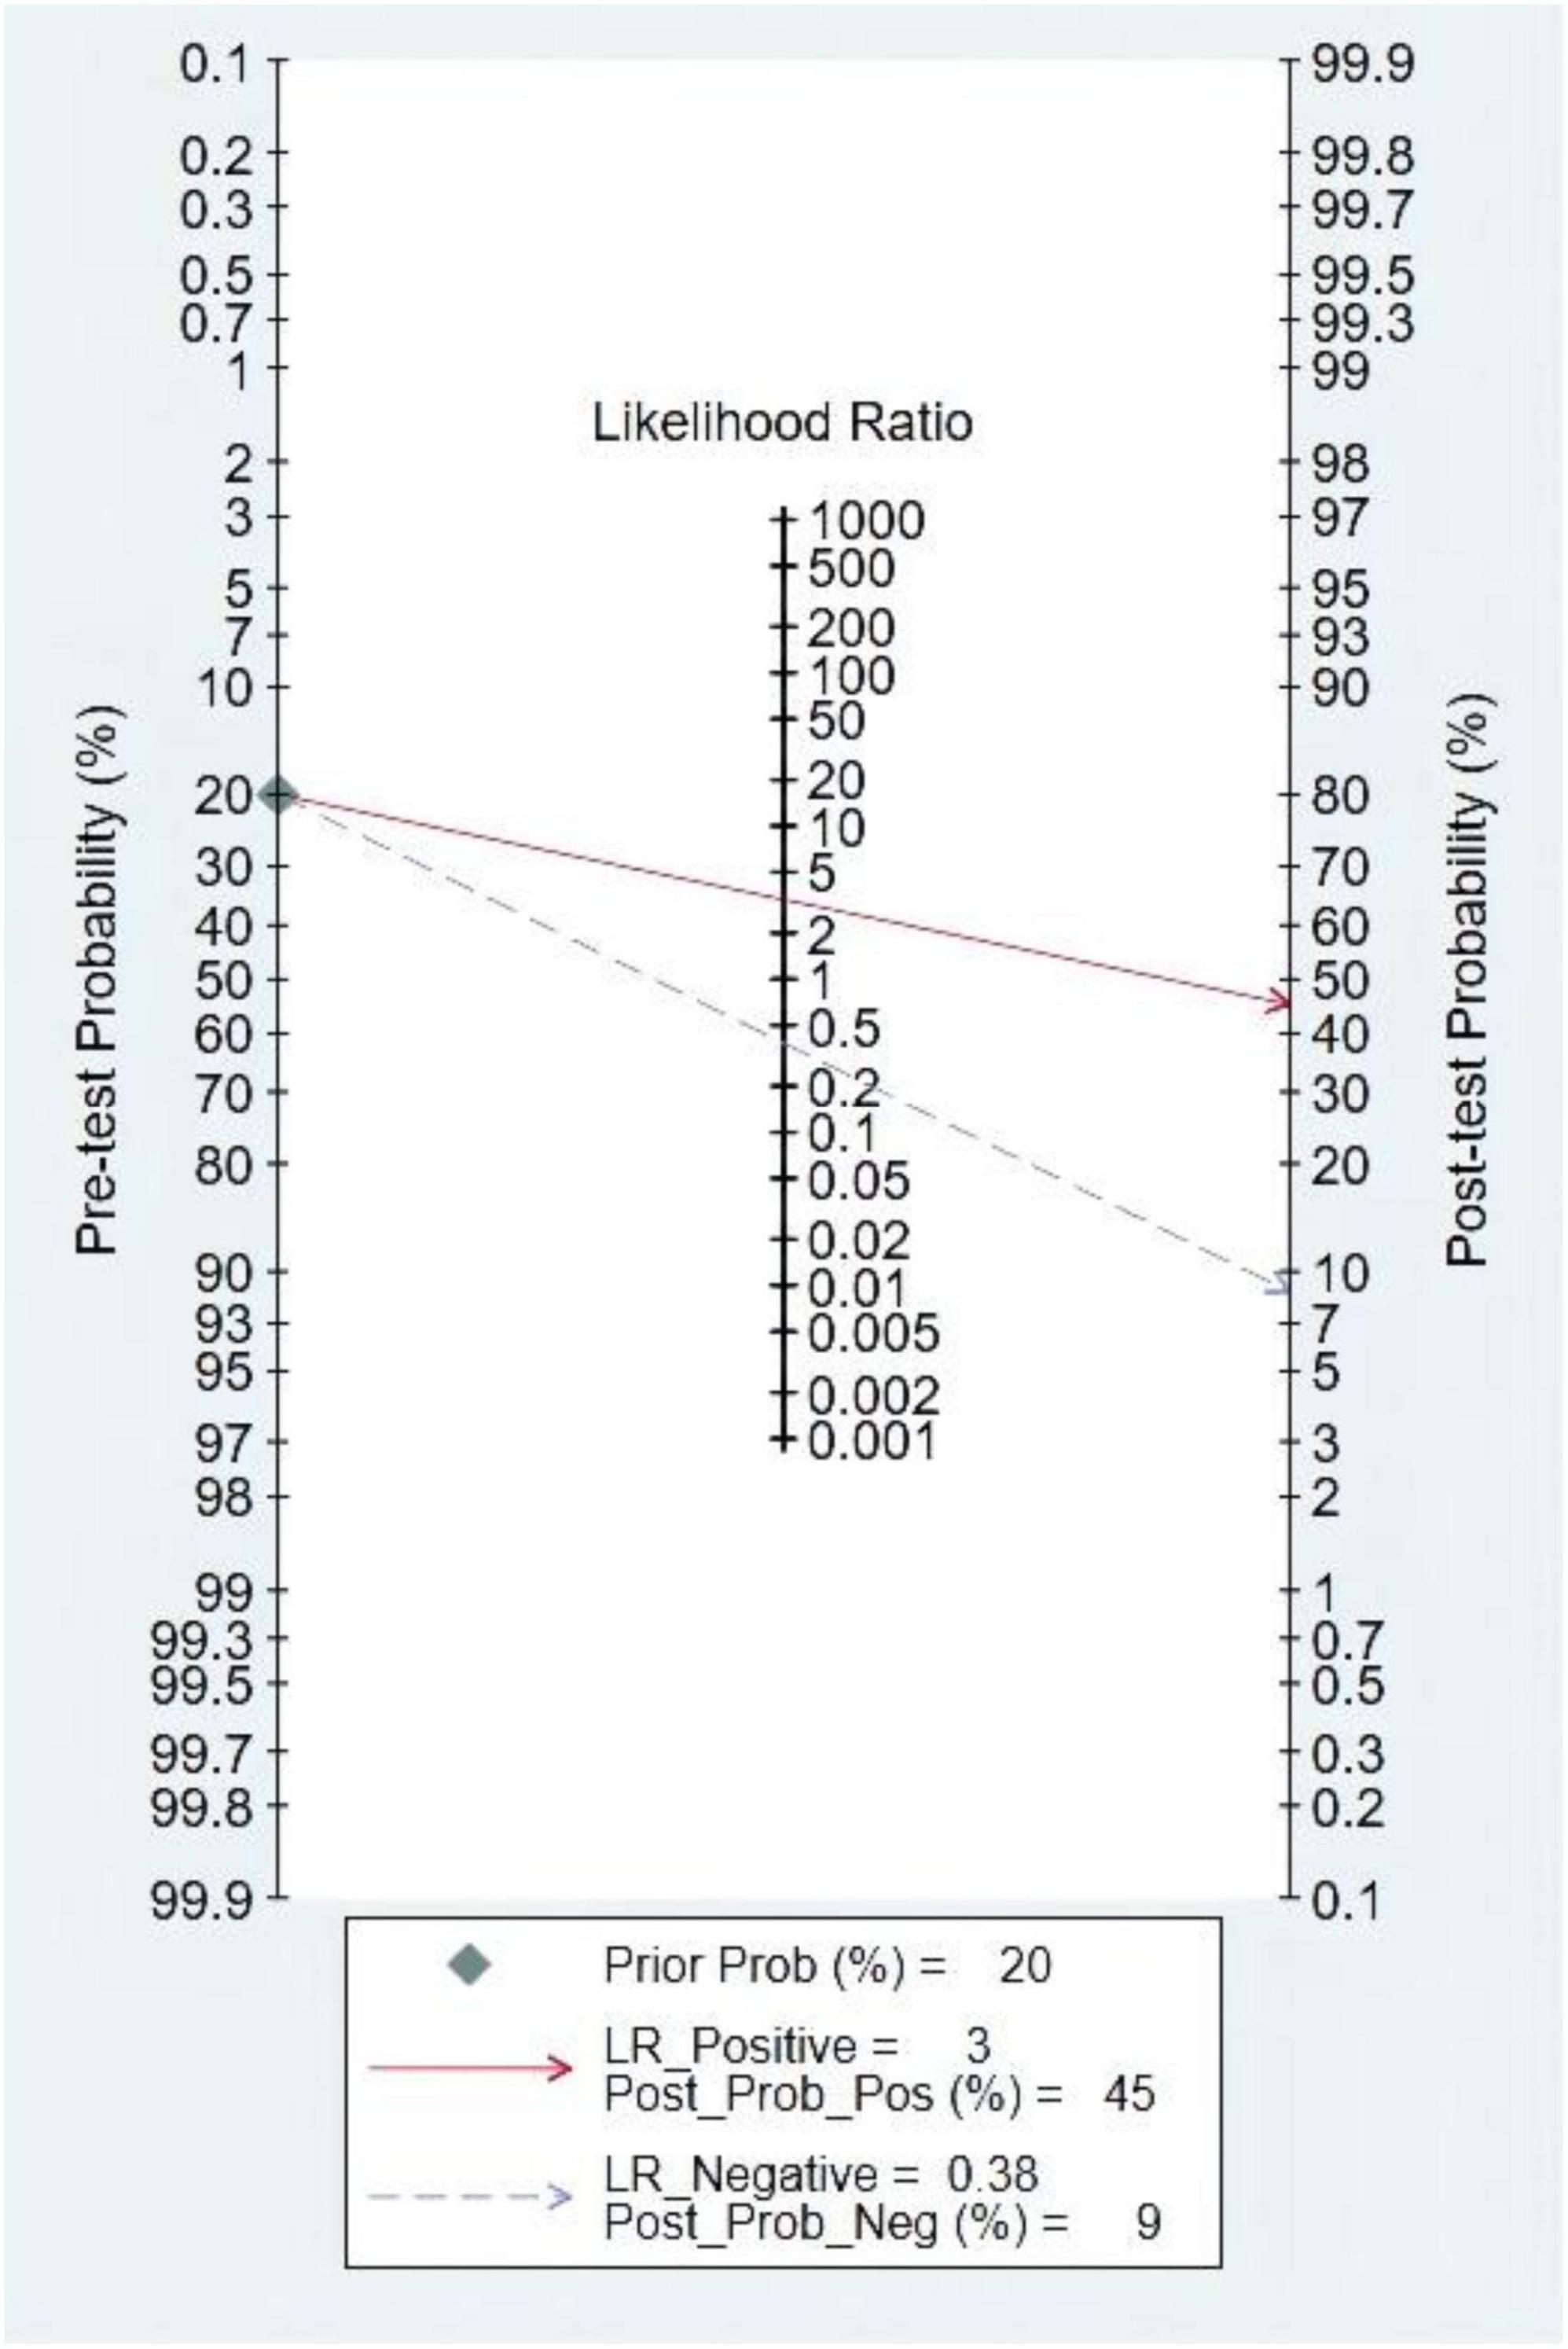
Figure 12. Fagan diagram of left ventricular ejection fraction (LVEF) in the diagnosis of heart sound.
Among the LVEF studies, the factors that might affect the heterogeneity, including prospective design (prodesign), partial verification bias (fulverif), an adequate description of study participants (subjdescr), report, a broad spectrum of disease (brdspect), and whether the test results were evaluated by a blind method, were evaluated. The meta-regression analysis of the aforementioned factors revealed that although the sources of heterogeneity of specificity were statistically related to the prodesign, fuverif, and blind, the sources of heterogeneity of sensitivity were not related to these factors, as shown in Figure 13.
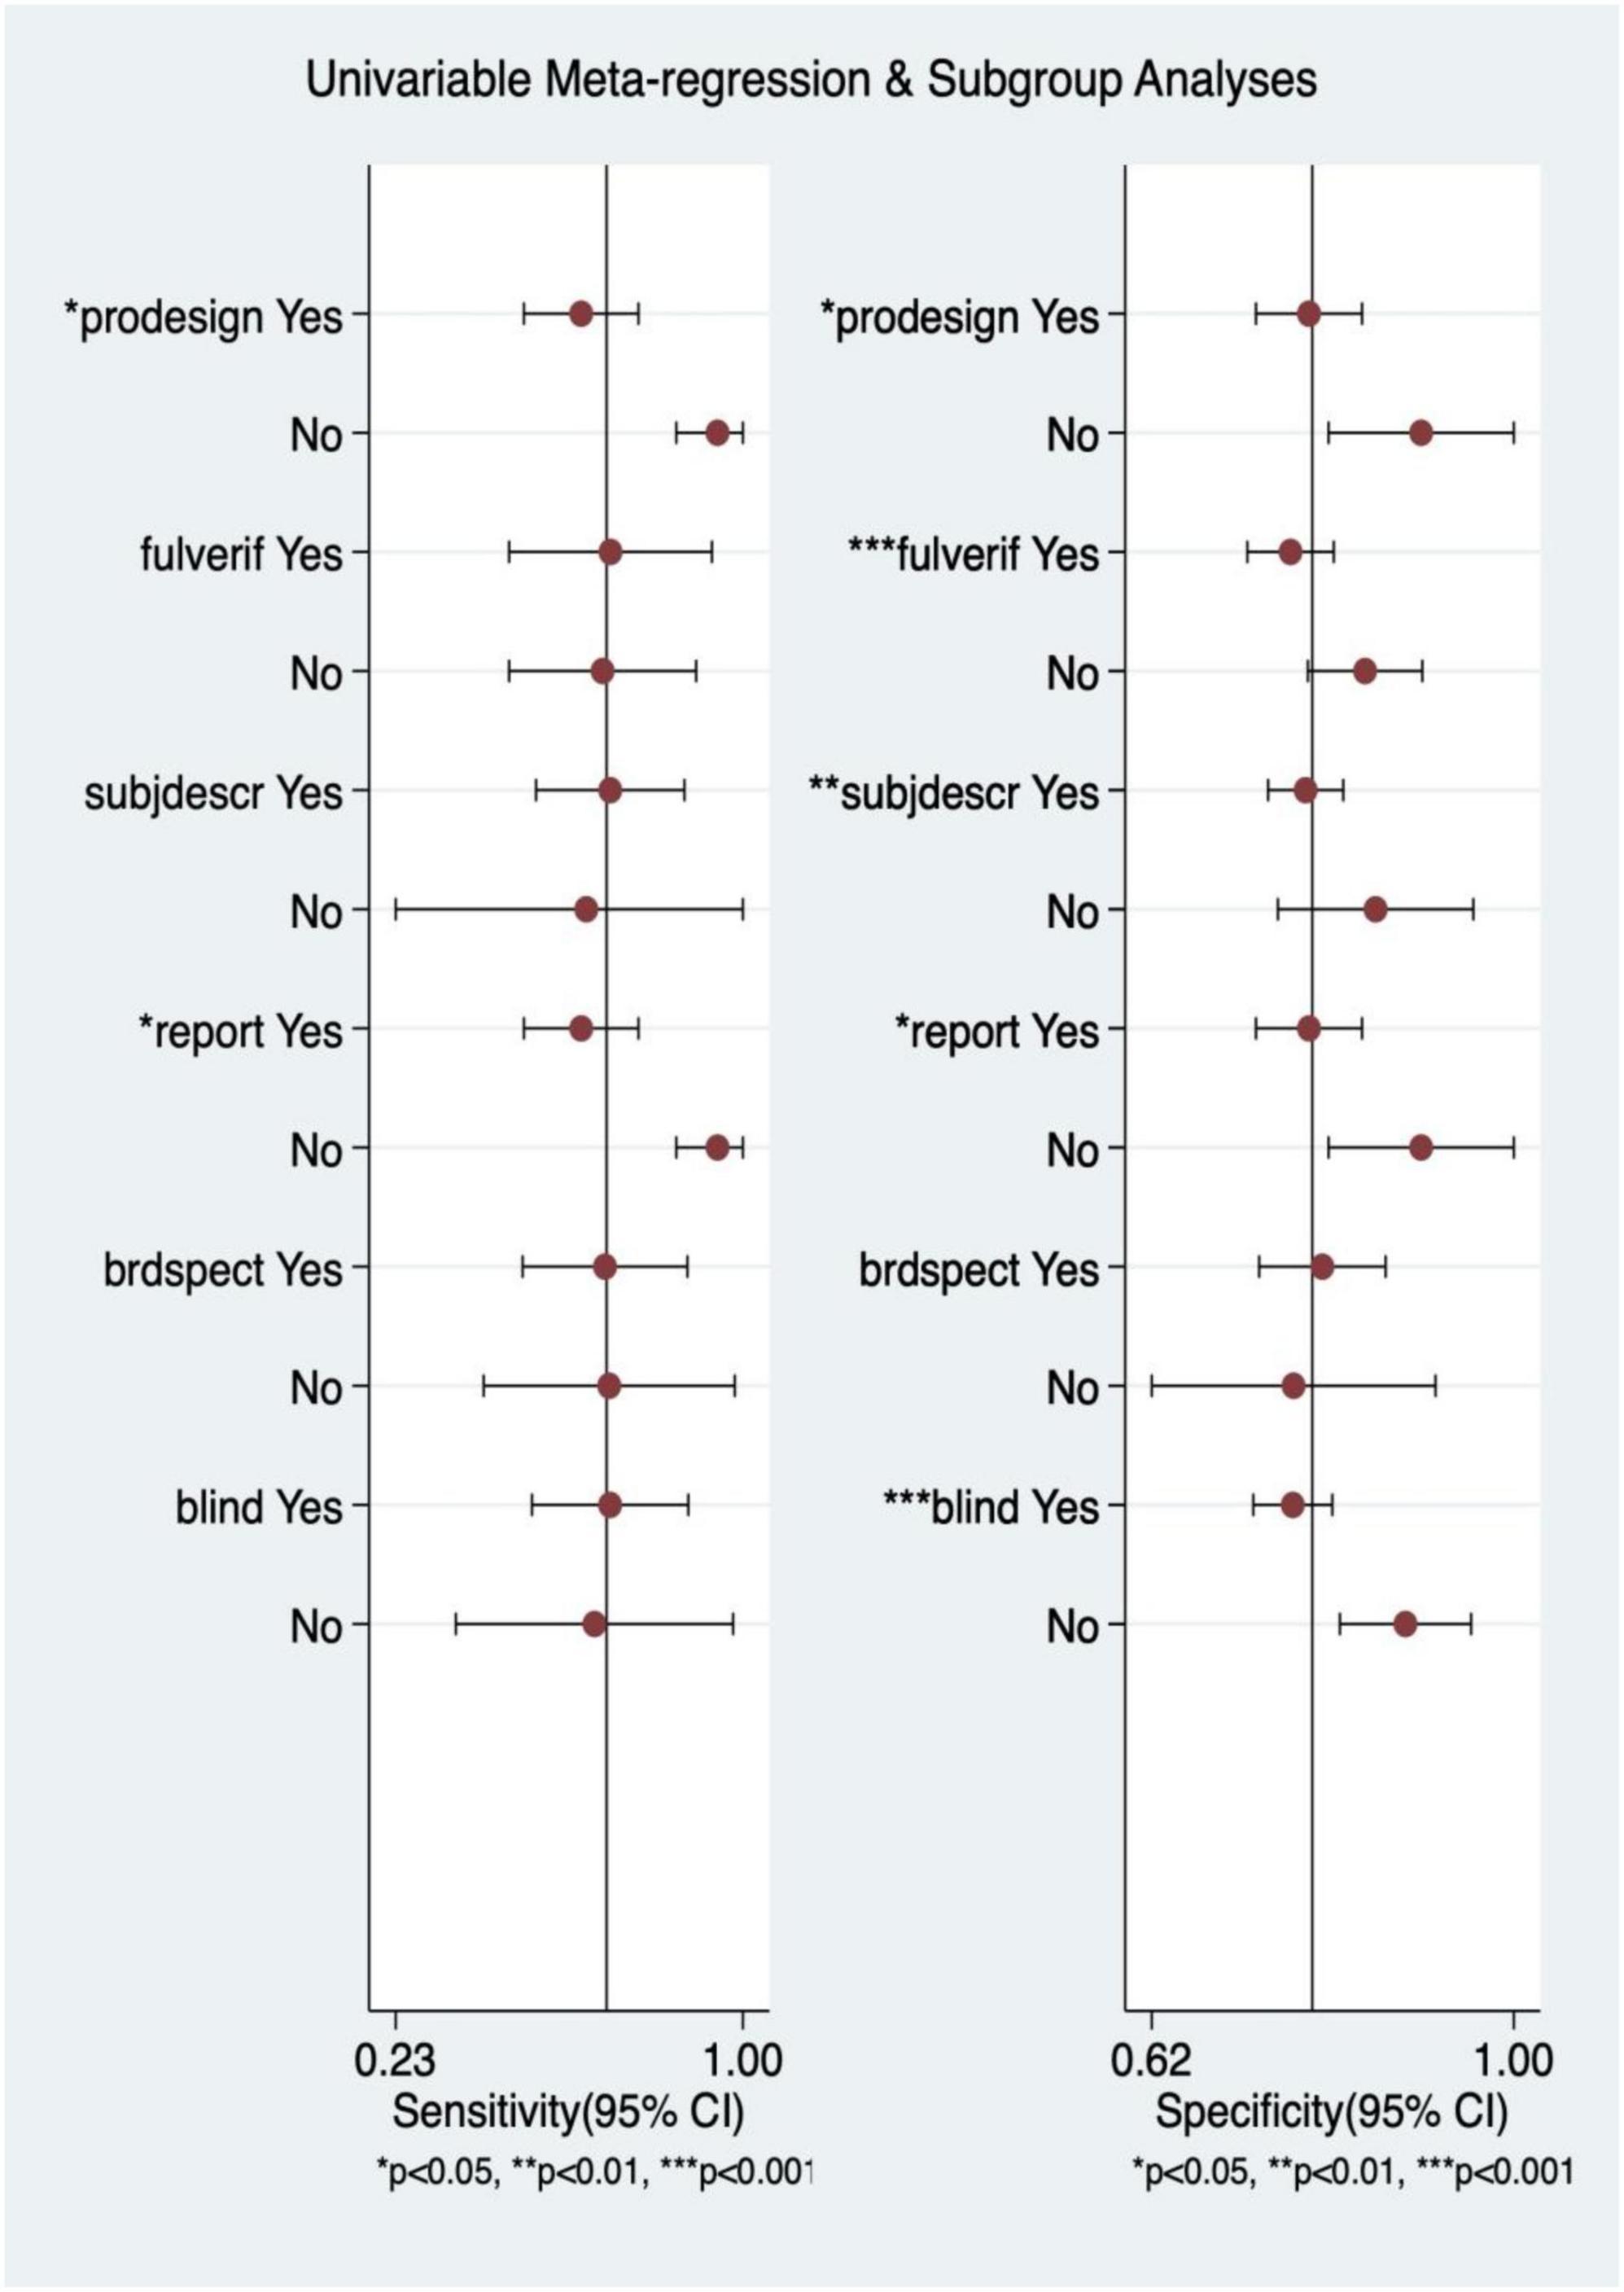
Figure 13. Multiple univariate meta-regression and subgroup analysis. Prospective design: prodesign; fulverif: partial verification bias; subjdescr: adequate description of study participants; brdspect: broad spectrum of disease.
Third heart sound and LVEF were compared using SROC, sensitivity, and specificity analysis. Among them, the predictive value of LVEF was better. The details are shown in Table 2.

Table 2. Diagnostic performance of third heart sound (S3) and left ventricular ejection fraction (LVEF).
Heart failure is a global public health issue of epidemic proportions and represents a tremendous burden to the overall healthcare costs (26). Meanwhile, it affects the quality of life of patients and their families seriously. Therefore, early recognition and accurate diagnosis are essential, and meaningful for a positive outcome.
This systematic review and meta-analysis was novel in comparing the ability to diagnose HF between S3 and LVEF. In this meta-analysis, 19 studies, including 5,614 participants, were analyzed. The combined sensitivity and DOR of S3 was less than that of LVEF. On the contrary, S3 had a higher specificity than LVEF, and the AUC of S3 was less than that of LVEF. Moreover, after using the S3 or LVEF, the post-test probability was equally improved. This suggested that LVEF had the highest diagnostic value compared with S3 and S3 alone was not of high diagnostic value for HF.
The 2021 ESC guidelines (5) pointed out that the identification of the etiology of the underlying cardiac dysfunction was imperative in the diagnosis of HF, making it convenient for subsequent treatment decision-making. In general, HF is due to systolic, diastolic, or both dysfunction. However, the pathology of the valves, pericardium, or endocardium and the abnormalities of heart rhythm, and conduction can contribute to HF (27). Heart sound intensity and frequency and their relationship or the occurrence of heart murmur are closely related to the condition of a cardiac valve, myocardial contraction, and blood flow in the heart (28). The aforementioned arguments laid the solid foundation for the diagnosis of HF via heart sound detection and analysis.
Kosmicki et al. (29) found that the diagnostic efficacy of the discriminative model constructed based on the characteristics of heart sound-electrocardiogram fusion, which included the S3 strength, left ventricular systolic time, electromechanical activation time, QR interval, and QRS interval, was significantly better than that of B-type natriuretic peptide (BNP). Moreover, the identification ability of patients with CHF in the “gray zone” of BNP significantly improved. Moreover, Maisel et al. (30) found that the strength of the S3 provided rapid results that assisted with the identification of acute HF (AHF) in selected populations. This evidence disclosed that S3 had high diagnostic value as an auxiliary diagnostic indicator. However, S3 was used as the single diagnostic indicator, reducing the sensitivity and specificity of diagnosis.
Meanwhile, the deficit in auscultation technology and the techniques of sound deciphering pulled down the sensitivity and specificity of diagnosis in HF via heart sound. The detection method for heart sound has been continuously improving, with new feature extraction algorithm and computer-aided diagnosis system based on machine learning or deep learning (31, 32), which further improves its diagnostic value. Liu et al. (31). reported that using extreme learning machine and heart sound characteristics to assist in diagnosing HF with preserved ejection fraction (HFpEF) showed an accuracy of 96.32%, a sensitivity of 95.48%, and a specificity of 97.10, which demonstrated the effectiveness of HS for HFpEF diagnosis. Alkhodari et al. (33) showed that the potential of implementing deep learning-based models clinically to ensure faster, yet accurate, automatic prediction of HF based on the ASE/EACVI LVEF guidelines with only clinical profiles, and corresponding information as input to the models. In addition, Alkhodari et al. (34) also found that applied support vector regression (SVR) models to estimate LVEF from ECG derived heart rate variability (HRV) data which ensure the best possible estimations of LVEF levels. Although the diagnostic value of S3 as a single indicator for HF is not high, heart sound shows promise as a diagnostic and prognostic tool in HF with the update of heart sound feature extraction methods.
The use of S3 alone presented lower sensitivity in the diagnosis of HF compared with LVEF, whereas it was useful in early pathological assessment. Future prospective studies are needed to explore the diagnostic value of heart sound analysis based on new feature extraction algorithm and computer-aided diagnosis system based on machine learning or deep learning, so as to improve the early recognition rate of HF.
First, less and reduplicative studies made the original data incomplete. Second, moderate heterogeneity existed across studies, and meta-regression and subgroup analyses failed output due to limited S3 data. Third, few included studies did not explicitly exclude participants. These shortcomings should be further investigated and addressed in future studies.
The original contributions presented in this study are included in the article/Supplementary material, further inquiries can be directed to the corresponding authors.
LD, MH, and XL performed the literature screening, the data extraction and analysis, result representation, and drafting of the manuscript for intellectual content. FX performed statistical analysis, interpreted the data, and revised the manuscript for intellectual content. XW initiated the study and revised the manuscript for intellectual content. XF and CW revised the manuscript. All authors contributed to the study and approved the submitted version of the manuscript.
This study was supported by the National Natural Science Foundation of China (Nos. 8216050478 and 82073833), the Chengdu Science and Technology Bureau Focuses on Research and Development Support Plan (No. 2019-YF09-00097-SN), the Popular Scientific Research Project of Sichuan Health Commission (No. 20PJ171), the Yunnan Education Program (No. SYSX202036), and the Key Discipline Construction Project of Sichuan Administration of Traditional Chinese Medicine (No. 202072).
The authors declare that the research was conducted in the absence of any commercial or financial relationships that could be construed as a potential conflict of interest.
All claims expressed in this article are solely those of the authors and do not necessarily represent those of their affiliated organizations, or those of the publisher, the editors and the reviewers. Any product that may be evaluated in this article, or claim that may be made by its manufacturer, is not guaranteed or endorsed by the publisher.
The Supplementary Material for this article can be found online at: https://www.frontiersin.org/articles/10.3389/fcvm.2022.918051/full#supplementary-material
1. Sacks D, Baxter B, Campbell BCV, Carpenter JS, Cognard C, Dippel D, et al. Multisociety consensus quality improvement revised consensus statement for endovascular therapy of acute ischemic stroke. Int J Stroke. (2018) 13: 612–32.
2. Heidenreich PA, Albert NM, Allen LA, Bluemke DA, Butler J, Fonarow GC, et al. Forecasting the impact of heart failure in the United States: a policy statement from the American Heart Association. Circ Heart Fail. (2013) 6:606–19. doi: 10.1161/HHF.0b013e318291329a
3. Ambrosy AP, Fonarow GC, Butler J, Chioncel O, Greene SJ, Vaduganathan M, et al. The global health and economic burden of hospitalizations for heart failure: lessons learned from hospitalized heart failure registries. J Am Coll Cardiol. (2014) 63:1123–33. doi: 10.1016/j.jacc.2013.11.053
4. Taylor CJ, Ryan R, Nichols L, Gale N, Hobbs FR, Marshall T. Survival following a diagnosis of heart failure in primary care. Fam Pract. (2017) 34:161–8. doi: 10.1093/fampra/cmx040
5. McDonagh TA, Metra M, Adamo M, Gardner RS, Baumbach A, Böhm M, et al. Corrigendum to: 2021 ESC guidelines for the diagnosis and treatment of acute and chronic heart failure: developed by the task force for the diagnosis and treatment of acute and chronic heart failure of the European Society of Cardiology (ESC) with the special contribution of the Heart Failure Association (HFA) of the ESC. Eur Heart J. (2021) 42:4901. doi: 10.1093/eurheartj/ehab670
6. Long B, Koyfman A, Gottlieb M. Diagnosis of acute heart failure in the emergency department: an evidence-based review. West J Emerg Med. (2019) 20:875–84. doi: 10.5811/westjem.2019.9.43732
7. Voin V, Oskouian RJ, Loukas M, Tubbs RS. Auscultation of the heart: the basics with anatomical correlation. Clin Anat. (2017) 30:58–60. doi: 10.1002/ca.22780
8. Stevenson LW, Perloff JK. The limited reliability of physical signs for estimating hemodynamics in chronic heart failure. JAMA. (1989) 261:884–8. doi: 10.1001/jama.261.6.884
9. Dao Q, Krishnaswamy P, Kazanegra R, Harrison A, Amirnovin R, Lenert L, et al. Utility of B-type natriuretic peptide in the diagnosis of congestive heart failure in an urgent-care setting. J Am Coll Cardiol. (2001) 37:379–85. doi: 10.1016/S0735-1097(00)01156-6
10. Knudsen CW, Omland T, Clopton P, Westheim A, Abraham WT, Storrow AB, et al. Diagnostic value of B-type natriuretic peptide and chest radiographic findings in patients with acute dyspnea. Am J Med. (2004) 116:363–8. doi: 10.1016/j.amjmed.2003.10.028
11. Knudsen CW, Riis JS, Finsen AV, Eikvar L, Müller C, Westheim A, et al. Diagnostic value of a rapid test for B-type natriuretic peptide in patients presenting with acute dyspnoe: effect of age and gender. Eur J Heart Fail. (2004) 6:55–62. doi: 10.1016/j.ejheart.2003.10.006
12. Zhang W. Usefulness of Acoustic Cardiography in the Diagnosis Of Chronic Systolic Heart Failure. Zhejiang: ©1994–2021 China Academic Journal Electronic Publishing House (2013).
13. Collins SP, Lindsell CJ, Peacock WF, Hedger VD, Askew J, Eckert DC, et al. The combined utility of an S3 heart sound and B-type natriuretic peptide levels in emergency department patients with dyspnea. J Card Fail. (2006) 12:286–92. doi: 10.1016/j.cardfail.2006.01.012
14. Collins SP, Peacock WF, Lindsell CJ, Clopton P, Diercks DB, Hiestand B, et al. S3 detection as a diagnostic and prognostic aid in emergency department patients with acute dyspnea. Ann Emerg Med. (2009) 53:748–57. doi: 10.1016/j.annemergmed.2008.12.029
15. Wang S, Lam YY, Liu M, Fang F, Wang J, Shang Q, et al. Acoustic cardiography helps to identify heart failure and its phenotypes. Int J Cardiol. (2013) 167:681–6. doi: 10.1016/j.ijcard.2012.03.067
16. Dieplinger B, Gegenhuber A, Haltmayer M, Mueller T. Evaluation of novel biomarkers for the diagnosis of acute destabilised heart failure in patients with shortness of breath. Heart. (2009) 95:1508–13. doi: 10.1136/hrt.2009.170696
17. Miller JB, Sen A, Strote SR, Hegg AJ, Farris S, Brackney A, et al. Inferior vena cava assessment in the bedside diagnosis of acute heart failure. Am J Emerg Med. (2012) 30:778–83. doi: 10.1016/j.ajem.2011.04.008
18. Wang S, Fang F, Liu M, Lam YY, Wang J, Shang Q, et al. Rapid bedside identification of high-risk population in heart failure with reduced ejection fraction by acoustic cardiography. Int J Cardiol. (2013) 168:1881–6. doi: 10.1016/j.ijcard.2012.12.064
19. Logeart D, Saudubray C, Beyne P, Thabut G, Ennezat PV, Chavelas C, et al. Comparative value of Doppler echocardiography and B-type natriuretic peptide assay in the etiologic diagnosis of acute dyspnea. J Am Coll Cardiol. (2002) 40:1794–800. doi: 10.1016/s0735-1097(02)02482-8
20. Steg PG, Joubin L, McCord J, Abraham WT, Hollander JE, Omland T, et al. B-type natriuretic peptide and echocardiographic determination of ejection fraction in the diagnosis of congestive heart failure in patients with acute dyspnea. Chest. (2005) 128:21–9. doi: 10.1378/chest.128.1.21
21. Nazerian P, Vanni S, Zanobetti M, Polidori G, Pepe G, Federico R, et al. Diagnostic accuracy of emergency Doppler echocardiography for identification of acute left ventricular heart failure in patients with acute dyspnea: comparison with Boston criteria and N-terminal prohormone brain natriuretic peptide. Acad Emerg Med. (2010) 17:18–26. doi: 10.1111/j.1553-2712.2009.00630.x
22. Anderson KL, Jenq KY, Fields JM, Panebianco NL, Dean AJ. Diagnosing heart failure among acutely dyspneic patients with cardiac, inferior vena cava, and lung ultrasonography. Am J Emerg Med. (2013) 31:1208–14. doi: 10.1016/j.ajem.2013.05.007
23. Kajimoto K, Madeen K, Nakayama T, Tsudo H, Kuroda T, Abe T, et al. Rapid evaluation by lung-cardiac-inferior vena cava (LCI) integrated ultrasound for differentiating heart failure from pulmonary disease as the cause of acute dyspnea in the emergency setting. Cardiovasc Ultrasound. (2012) 10:49. doi: 10.1186/1476-7120-10-49
24. Hu P. Accuracy and clinical application value of cardiac color ultrasound in the diagnosis of multiple causes of chronic heart failure. Imaging Res Med Appl. (2021) 5:144–5.
25. Jiang H. Diagnosis value analysis of echocardiography combined with BNP detection in chronic heart failure. Forum Essent Med. (2021) 25:978–9.
26. Tsao L, Gibson CM. Heart failure: an epidemic of the 21st century. Crit Pathw Cardiol. (2004) 3:194–204. doi: 10.1097/01.hpc.0000146867.90558.ca
27. Bozkurt B, Coats AJ, Tsutsui H, Abdelhamid M, Adamopoulos S, Albert N, et al. Universal definition and classification of heart failure: a report of the Heart Failure Society of America, Heart Failure Association of the European Society of Cardiology, Japanese Heart Failure Society and Writing Committee of the Universal Definition of Heart Failure. J Card Fail. (2021) 27:387–413. doi: 10.1002/ejhf.2115
28. Tang H, Gao J, Ruan C, Qiu T, Park Y. Modeling of heart sound morphology and analysis of the morphological variations induced by respiration. Comput Biol Med. (2013) 43:1637–44. doi: 10.1016/j.compbiomed.2013.08.005
29. Kosmicki DL, Collins SP, Kontos MC, Zuber M, Kipfer P, Attenhofer Jost C, et al. Noninvasive prediction of left ventricular systolic dysfunction in patients with clinically suspected heart failure using acoustic cardiography. Congest Heart Fail. (2010) 16:249–53. doi: 10.1111/j.1751-7133.2010.00191.x
30. Maisel AS, Peacock WF, Shah KS, Clopton P, Diercks D, Hiestand B, et al. Acoustic cardiography S3 detection use in problematic subgroups and B-type natriuretic peptide “gray zone”: secondary results from the heart failure and audicor technology for rapid diagnosis and initial treatment multinational investigation. Am J Emerg Med. (2011) 29:924–31. doi: 10.1016/j.ajem.2010.03.032
31. Liu Y, Guo X, Zheng Y. An automatic approach using ELM classifier for HFpEF identification based on heart sound characteristics. J Med Syst. (2019) 43:285. doi: 10.1007/s10916-019-1415-1
32. Zheng Y, Guo X, Qin J, Xiao S. Computer-assisted diagnosis for chronic heart failure by the analysis of their cardiac reserve and heart sound characteristics. Comput Methods Programs Biomed. (2015) 122:372–83. doi: 10.1016/j.cmpb.2015.09.001
33. Alkhodari M, Jelinek HF, Karlas A, Soulaidopoulos S, Arsenos P, Doundoulakis I, et al. Deep learning predicts heart failure with preserved, mid-range, and reduced left ventricular ejection fraction from patient clinical profiles. Front Cardiovasc Med. (2021) 8:755968. doi: 10.3389/fcvm.2021.755968
Keywords: acute heart failure, LVEF, meta-analysis, third heart sound, heart failure
Citation: Dao L, Huang M, Lin X, Li L, Feng X, Wei C, Guo M, Yang Y, Xu F and Weng X (2022) A systemic review and meta-analysis comparing the ability of diagnostic of the third heart sound and left ventricular ejection fraction in heart failure. Front. Cardiovasc. Med. 9:918051. doi: 10.3389/fcvm.2022.918051
Received: 12 April 2022; Accepted: 12 September 2022;
Published: 06 October 2022.
Edited by:
Marco Giuseppe Del Buono, Agostino Gemelli University Polyclinic (IRCCS), ItalyReviewed by:
Hirotsugu Yamada, Tokushima University, JapanCopyright © 2022 Dao, Huang, Lin, Li, Feng, Wei, Guo, Yang, Xu and Weng. This is an open-access article distributed under the terms of the Creative Commons Attribution License (CC BY). The use, distribution or reproduction in other forums is permitted, provided the original author(s) and the copyright owner(s) are credited and that the original publication in this journal is cited, in accordance with accepted academic practice. No use, distribution or reproduction is permitted which does not comply with these terms.
*Correspondence: Fan Xu, eHVmYW5AY21jLmVkdS5jbg==; Xiechuan Weng, d2VuZ3hjMjAwMEAxNjMuY29t
†These authors have contributed equally to this work
Disclaimer: All claims expressed in this article are solely those of the authors and do not necessarily represent those of their affiliated organizations, or those of the publisher, the editors and the reviewers. Any product that may be evaluated in this article or claim that may be made by its manufacturer is not guaranteed or endorsed by the publisher.
Research integrity at Frontiers
Learn more about the work of our research integrity team to safeguard the quality of each article we publish.