 Zhaoshui Li
 Yanjie Song2
 Ting Jiang
 Yifan Chi
94% of researchers rate our articles as excellent or good
Learn more about the work of our research integrity team to safeguard the quality of each article we publish.
Find out more
ORIGINAL RESEARCH article
Front. Cardiovasc. Med. , 25 August 2022
Sec. Cardiovascular Genetics and Systems Medicine
Volume 9 - 2022 | https://doi.org/10.3389/fcvm.2022.905737
Background: Although the roles of m6A modification in the immune responses to human diseases have been increasingly revealed, their roles in immune microenvironment regulation in coronary heart disease (CHD) are poorly understood.
Methods: The GSE20680 and GSE20681 datasets related to CHD were acquired from the Gene Expression Omnibus (GEO) database. A total of 30 m6A regulators were used to perform LASSO regression to identify the significant genes involved in CHD. Unsupervised clustering analysis was conducted using the m6A regulators to distinguish the m6A RNA methylation patterns in patients with CHD. The differentially expressed genes (DEGs) and biological characteristics, including GO and KEGG enrichment results, were assessed for the different m6A patterns to analyse the impacts of m6A regulators on CHD. Hub genes were identified, and subsequent microRNAs-mRNAs (miRNAs–mRNAs) and mRNAs-transcriptional factors (mRNA-TFs) interaction networks were constructed by the protein and protein interaction (PPI) network method using Cytoscape software. The infiltrating proportion of immune cells was assessed by ssGSEA and the CIBERSORT algorithm. Quantitative real-time PCR (qRT-PCR) was performed to detect the expression of the significant m6A regulators and hub genes.
Results: Four of 30 m6A regulators (HNRNPC, YTHDC2, YTHDF3, and ZC3H13) were identified to be significant in the development of CHD. Two m6A RNA methylation clusters were distinguished by unsupervised clustering analysis based on the expression of the 30 m6A regulators. A total of 491 genes were identified as DEGs between the two clusters. A PPI network including 308 mRNAs corresponding to proteins was constructed, and 30 genes were identified as hub genes that were enriched in the bioprocesses of peptide cross-linking, keratinocyte differentiation. Twenty-seven hub genes were found to be related to miRNAs, and seven hub genes were found to be related to TFs. Moreover, among the 30 hub genes, eight genes were found to be upregulated in CHD, and three were found to be downregulated in CHD compared to the normal people. The high m6A modification pattern was associated with a higher infiltrated abundance of immune cells.
Conclusion: Our findings demonstrated that m6A modification plays crucial roles in the diversity and complexity of the immune microenvironment in CHD.
Cardiovascular disease (CVD) is a chronic disease of the heart and circulatory system, and for many years, it has been the leading cause of premature death worldwide (1). Coronary heart disease (CHD) is the most common type of CVD (2), and it is caused by atherosclerotic plaque, atherosclerotic erosion, unstable atheroma, and vessel lumen stenosis (3). Arterial inflammation is caused by the recruitment of cells in the innate (e.g., monocytes, macrophages) and adaptive (e.g., CD4+ T helper cells and cytotoxic CD8+ T cells) immune systems into the intima of the artery (4). Therefore, understanding immune regulation in patients with CHD might be critical for revealing the molecular mechanism of its pathogenesis and might be conducive to uncovering novel immune therapies for CHD.
N6-methyladenosine (m6A) is the most prevalent type of internal RNA posttranscriptional modification in eukaryotic cells, and can occur in multiple types of RNA, including messenger RNA (mRNAs), ribosomal RNA (rRNAs), transfer RNA (tRNAs), long non-coding RNAs (lncRNAs) and microRNAs (miRNAs) (3, 5–7). This modification is a reversible process (8) that is controlled by three main components: adenosine methyltransferases (writers), m6A-binding proteins (readers), and m6A demethylating enzymes (erasers) (9, 10). The “writers” are m6A methyltransferases that catalyse the formation of the m6A modification (5), while the “erasers” are m6A demethylases that regulate the demethylation of the m6A modification (11, 12). The “readers” are m6A RNA binding proteins (RBPs) that recognize the target m6A-modified mRNA and promote its function in subsequent biological processes (13). Additionally, m6A RNA modification exerts diverse functions in normal bioprocesses and under disease conditions, including gene expression regulation, RNA stability, and RNA processing (14–17). Recently, m6A regulators have been reported to be linked to the immune microenvironment and participate in the regulation of human diseases (18). For instance, the results of Sun D's group suggested that m6A modification plays a key role in severe asthma, and may be able to guide future immunotherapy strategies (19).
Multiple independent studies have found increased levels of m6A RNA methylation in various CADs, including heart failure (20, 21), cardiac hypertrophy (22), myocardial infarction (23, 24), and CHD (25), indicating that m6A RNA methylation is closely linked to the occurrence and development of CADs. For example, the loss of the m6A methyltransferase METTL5 promotes cardiac hypertrophy through the epitranscriptomic control of SUZ12 expression (26). Zhao X's group found that METTL3 attenuated cardiomyocyte apoptosis in myocardial ischaemia–reperfusion (I/R) injury through miR-25-3p and miR-873-5p (27). Another study found that loss of m6A methyltransferase METTL3 promoted heart regeneration and repair after myocardial injury (28). Recently, a study by Mo's group (29) identified 304 CHD-associated m6A-SNPs that might alter the expression of local genes, which might subsequently affect CHD risk (29). Guo M's group found that the enhanced m6A RNA modification of circ_0029589 helped IFN regulatory factor-1(IRF-1) facilitate macrophage pyroptosis and inflammation in CHD (30). A study of the transcriptome-wide m6A landscape of CHD identified differentially methylated m6A sites in both mRNAs and lncRNAs between CHD and control groups (25). Another study found that loss of m6A methyltransferase METTL3 promoted heart regeneration and repair after myocardial injury (28). Although relevant studies have proposed the existence of expression changes in m6A regulators changes in CHD, their specific roles in the development and progression of CHD still need to be expounded.
This study aimed to systematically evaluate the modification patterns of m6A RNA methylation in patients with CHD by using bioinformatics to analyse CHD sequencing data from the Gene Expression Omnibus (GEO) database. The infiltration of immune cells in the different m6A patterns was further analyzed to illustrate the impacts of m6A RNA modification on the immune environment of CHD. The results lay a theoretical foundation for the regulation of m6A modification in the pathogenesis of CHD and provide a novel immune therapy approach for CHD.
Coronary heart disease was retrieved from GEO database and human whole blood sequencing data were screened. The data used in this study were acquired from GSE159657 (31), GSE20680 (32), and GSE20681 (33) data sets of Gene Expression Omnibus (GEO) database (34). Among these, GSE20680 data set contains 143 human CHD samples and 52 control samples, GSE20686 data set contains 99 human CHD samples and 99 control samples, which were both sequenced via GPL4133 platform. The gene expression levels of the above two datasets were normalized signal intensity of Log2 transformation. R “sva” package (35) was used for the batch removal of the two data sets, and the integrated GEO data sets was obtained as the training set, that included 242 human CHD samples and 99 control samples. As a validation set, GSE159657 data set contains 8 human CHD samples and 10 control samples, with the sequencing platform of GPL24676. All data were obtained by R “GEOquery” (36) package. The detailed information of the GEO data sets was shown in Table 1.
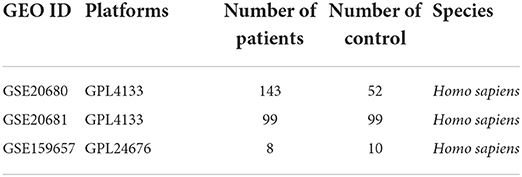
Table 1. The detailed information of the GEO data sets.
The univariate logistic regression was used to select candidate m6A regulators from the 30 m6A regulators to predict the occurrence of CHD and the cut-off criteria are P-value < 0.05. The least absolute shrinkage and selection operator (LASSO) regression (37) was used for feature selection and dimension reduction to establish the predictive scoring formula. R “glmnet” package (38) was used to implement the method and select the best lambda value. After regression, only genes with non-zero coefficients were retained. Then, a rosette model was constructed based on the selected candidate m6A regulator to predict the prevalence of CHD by R “forestplot” package (39).
R “rms” package (40) was used for nomogram visualization to directly reflect the clinical significance of this model. Receiver operating characteristic (ROC) curve (41) was used to evaluate the distinguishing performance of the signature, and the area under the curve was calculated using R “pROC” package (42). Decision curve analysis (DAC) curve (43) was used to assess whether model-based decision making was beneficial to patients, drawing by R “ggDCA” package (44).
Unsupervised clustering analysis (45) was performed to identify diverse m6A modification pattern based on the expression of the 30 m6A regulators. The consistency clustering algorithm was used to evaluate the clustering number and robustness. R “Consensus Cluster Plus” package (46) was used to identify different m6A modification pattern. The above steps were performed 1,000 iterations to ensure the robustness of the classification. PCA was performed 20 times to further verify 30 m6A regulator expression patterns under different modification modes.
To identify m6A regulator meditated genes, samples of two distinct m6A modification patterns were analyzed by the empirical Bayesian approach of the R “limma” package (47) to identify the differentially expressed genes (DEGs) between the two m6A modification patterns, with the threshold of log2FC > 1.5 and Padj < 0.05. For the visualization of data, “Ggplot 2” R package was used to perform the volcano plot, and “Pheatmap” R package was used to perform the heatmap.
The biological function of m6A phenotype-related genes was analyzed by Gene Ontology (GO) and Kyoto Encyclopedia of Genes and Genomes (KEGG) enrichment analysis. GO analysis is a common method for large-scale functional enrichment studies, including biological process (BP), molecular function (MF) and Cellular Component (CC) (48). KEGG is a widely used database that stores information about genomes, biological pathways, diseases and drugs (49). The gene name was firstly transited to be entrez ID using the R “org.hs.eg.db” package. R “clusterProfiler” package (50) was used for GO annotation analysis and KEGG pathway enrichment analysis of DEGs, FDR <0.05 was considered to be statistically significant.
To study the differences in biological processes between different m6A modification patterns, Gene Set Enrichment Analysis (GSEA) (51) was performed based on the data set of gene expression profiles in patients with CHD. The gene sets of “c2.cp.kegg.v7.4.symbols.gmt” and “c5.go.v7.2.symbols.gmt” were downloaded from MSigDB database (51) for the GSEA analysis, discovery rate <0.1, and P-value < 0.05 was considered to be statistically significant.
The STRING (https://cn.string-db.org/) (52) is a database that searches for known proteins and predicts interactions between proteins. STRING database was used, and genes with combined score >400 were selected to construct the protein-protein interaction (PPI) network. Cytoscape (v3.7.2) (53) was used for the visualization of PPI network. CytoHubba (54) is used to rank nodes according to their attributes in the network to identify the central elements in the network and discover the key targets and sub-networks of the complex network. The top 30 genes were identified ad hub genes.
For the miRNA-mRNA interaction network, miRNAs and lncRNAs were obtained from miRNet database (https://www.mirnet.ca/) (55), and the interaction network was performed by Cytoscape (v3.7.2). For the mRNA-transcription factor (mRNA-TF) interaction network, the relationship between TF and hub-genes was retrieved from miRNet database, the interaction network was performed by Cytoscape (v3.7.2). Different icons were used to label mRNAs, miRNAs and TFs.
The functional similarity among proteins was evaluated using the geometric mean of semantic similarities in BPs, CCs, and MFs through GOSemSim R package (56).
Single sample gene set Enrichment analysis (ssGSEA) (57) is used to calculate the abundance of 28 immune cells in CHD with different m6A patterns. The immune reaction gene-sets were got from the ImmPort databses (http://www.immport.org) (58). The composition of immune cells in patients with different m6A patterns was visualized by box diagram. The difference in proportion of immune cells was calculated by Wilcoxon test, and P-value < 0.05 was considered as statistically significant.
CIBERSORT algorithm is a deconvolution algorithm for the expression matrix of immune cell subtypes based on the principle of linear support vector regression, using RNA-seq data to estimate the abundance of immune cells in samples (59). CIBERSORT algorithm was used to estimate the abundance of 22 types of immune cells in patients with different m6A patterns, and the composition of immune cells in patients with different m6A patterns was visualized by box diagram. The difference in proportion of immune cells was calculated by Wilcoxon test, and P-value < 0.05 was considered as statistically significant.
The peripheral blood was collected in the anticoagulant tube from 14 patients with CHD and 9 normal people. The whole blood cells were isolated form the collected peripheral blood using the Lymphocyte Separation Medium (#P8620, Solarbio) according to the manufacturer's protocol. The fresh blood and normal saline were mixed in a ratio of 1:1, the lymphocyte separation medium was carefully added to the top of the page, and centrifuged for 20 min, 1,500 r/min. The circular milky lymphocyte layer at the second layer was sucked out and placed in a new centrifuge tube containing 4–5 ml normal saline, and centrifuged for 20 min, 1,500 r/min. The desired whole blood cells were obtained after the precipitate was washed twice.
Total RNA was isolated using TRizol (#R401-01-AA, Vazyme Biotech) following the manufacturer's protocol. RNAs were then reverse transcribed using HiScript II Q RT SuperMix for qPCR Reverse Transcription Kit (#R223-01, Vazyme Biotech) following the manufacturer's protocol. Quantitative real-time PCR (qRT-PCR) was performed using AceQ® Universal SYBR® qPCR Master Mix (#Q511, Vazyme Biotech). Primers were synthesized by Integrated DNA Technologies. Target gene expression was normalized to the GAPDH reference gene and relative expression levels were determined using the 2−ΔΔCt method. The primers used in qRT-PCR were listed in Supplementary Table 13.
All data calculations and statistical analysis were performed using R programming (https://www.r-project.org/, version 4.1.1). For the comparison of the two groups of continuous variables, the statistical significance of the normally distributed variables was estimated using the independent Student t test, and the differences between the non-normally distributed variables were analyzed using the Mann-Whitney U test (i.e., Wilcoxon rank-sum test). The Chi-square test or Fisher's exact test was used to compare and analyze the statistical significance between the two groups of categorical variables. The correlation coefficients of different genes were calculated by Pearson correlation analysis. All statistical P values were bilateral, and P < 0.05 was considered statistically significant.
The detailed processes used for the m6A regulator cluster construction and data analyses are shown in Figure 1A. The training data were obtained from the merged and batch-normalized GSE20680 and GSE20681 sets, and contained 242 disease samples and 151 normal samples (Figures 1B–E).
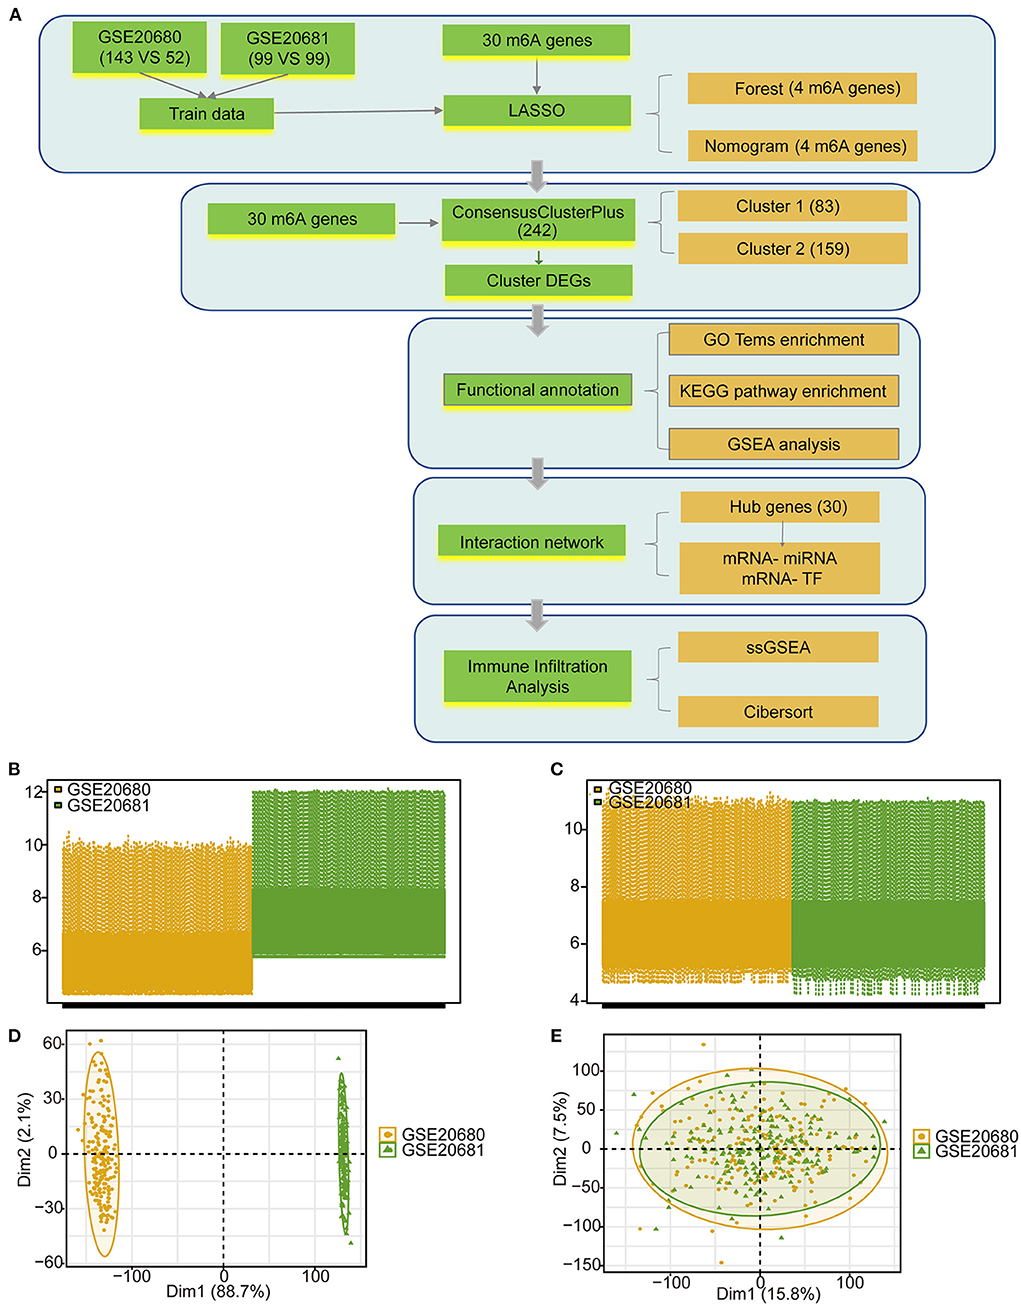
Figure 1. The data preprocessing and analysis process. (A) The work flow of this study. (B) Box plot showing the two GEO data sets before standardization. (C) Box plot showing the two GEO data sets after standardization. (D) PCA analysis of the two data sets before standardization. (E) PCA analysis of the two data sets after standardization.
A total of 37 m6A regulators (60) were extracted from the dataset, including 11 writers (METTL3, METTL14, WTAP, VIRMA, ZC3H13, CBLL1, RBM15, RBM15B, METTL16, ZCCHC4, and PCIF1) (Figure 2A; Supplementary Table 1), 23 readers (YTHDF2, FMR1, RBMX, YTHDF1, IGF2BP1, HNRNPC, NUDT21, CPSF6, NXF1, EIF3A, YTHDF3, HNRNPA2B1, IGF2BP3, YTHDC2, YTHDC1, IGF2BP2, XRN1, SETD2, LRPPRC, PRRC2, SRSF3, TRMT112, and SRSF10) (Figure 2B; Supplementary Table 1, among these, only 19 genes can be annotated for location on human chromosome), and 3 erasers (FTO, ALKBH5, and ALKBH3) (Figure 2C; Supplementary Table 1). However, 30 m6A regulators were overlapped with genes in the CHD expression profiles, and these m6A regulators were used for the subsequent analysis (Figure 2D; Supplementary Table 2). Seven CHD susceptibility genes (ALOX5AP, LTA4, MEF2A, LTA, LGALS2, PCSK9, CFH) (61) were used to analyse the possible susceptibility to CHD associated with these m6A regulators by mapping the chromosomal locations of these genes and the m6A genes (Figure 2E). Among the examined genes, PCSK9 was obviously close to the m6A “reader” YTHDF2, with both located on chr1. ALOX5AP and the “writer” ZC3H13 were both located on chr13. Other CHD susceptibility genes were located at varying close distances to m6A regulators (Figure 2E). These results suggested that the m6A regulators may have potential regulatory effects on these genes. Then, we analyzed the correlations of these m6A regulators in the 242 CHD samples, and the results showed that these m6A regulators were strongly correlated in patients with CHD (Figure 2F). Among the examined genes, 3 m6A RNA methylation writers (WTAP, ZCCHC4, and ZCCHC4) and 6 m6A RNA methylation readers (XRN1,YTHDF1, YTHDF2, YTHDF3, YTHDC1, and YTHDC2) were significantly and positively correlated with each other (marked by blue line, Figure 2F); the writer PCIF1 was negatively correlated with almost all regulators (marked by green line, Figure 2F); the readers IGF2BP1-3 had similar patterns that were negatively correlated with other regulators (marked by red line, Figure 2F); while HNRNPC, CPSF6, EIF3A, HNRNPA2B1, and FMR1 had similar patterns that were also positively correlated with other regulators (marked by yellow line, Figure 2F). The results indicated that these similar m6A RNA methylation modifiers might have a synergistic effect on gene expression regulation by m6A RNA methylation.
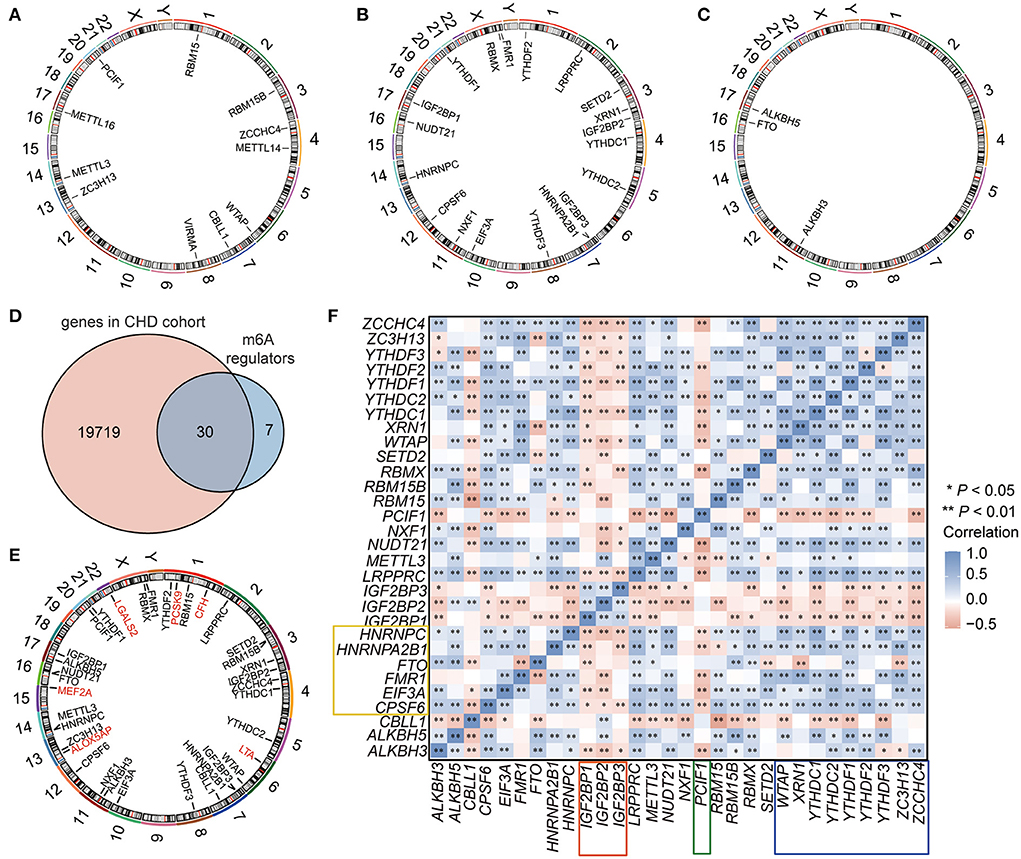
Figure 2. The landscape of m6A regulators in CHD. (A–C) The location of m6A RNA methylation writers (A), readers (B), and erasers (C) on the chromosome. (D) Venn showing the overlapped m6A regulators in the GEO-CHD cohort. (E) The location of m6A regulators and the CHD susceptibility genes. The red labeled genes were CHD susceptibility gene, and the black labeled genes were m6A regulators. (F) The correlation of the m6A regulators in CHD.
To analyse the roles of these m6A regulators in CHD, least absolute shrinkage and selection operator (LASSO) regression was performed on the 30 m6A regulators for feature selection and dimension reduction to identify the significant genes, and we found that four genes, including HNRNPC, YTHDC2, YTHDF3, and ZC3H13, were significant in CHD (Figures 3A–C; Supplementary Table 3). The classifier consisted of these four significant genes that could well distinguish healthy people from CHD patients, with CHD patients presenting higher risk scores than healthy people (Figure 3D). The receiver operating characteristic (ROC) curve also illustrated that the model could better predict patients with CHD (Figure 3E). The nomogram line diagram model was applied to predict the occurrence of CHD (Figures 3F,G), and it showed that four significant m6A-related genes had predictive value for CHD. The decision curve analysis (DCA) analysis also verified that decisions based on the nomogram model may be beneficial for CHD patients (Figure 3H). Finally, the risk model based on the four m6A-related significant genes was validated based on the GSE159657 dataset, and the ROC curve suggested the feasibility of the model (Figure 3I). These results indicate that m6A RNA modification plays important roles in the development and progression of CHD.
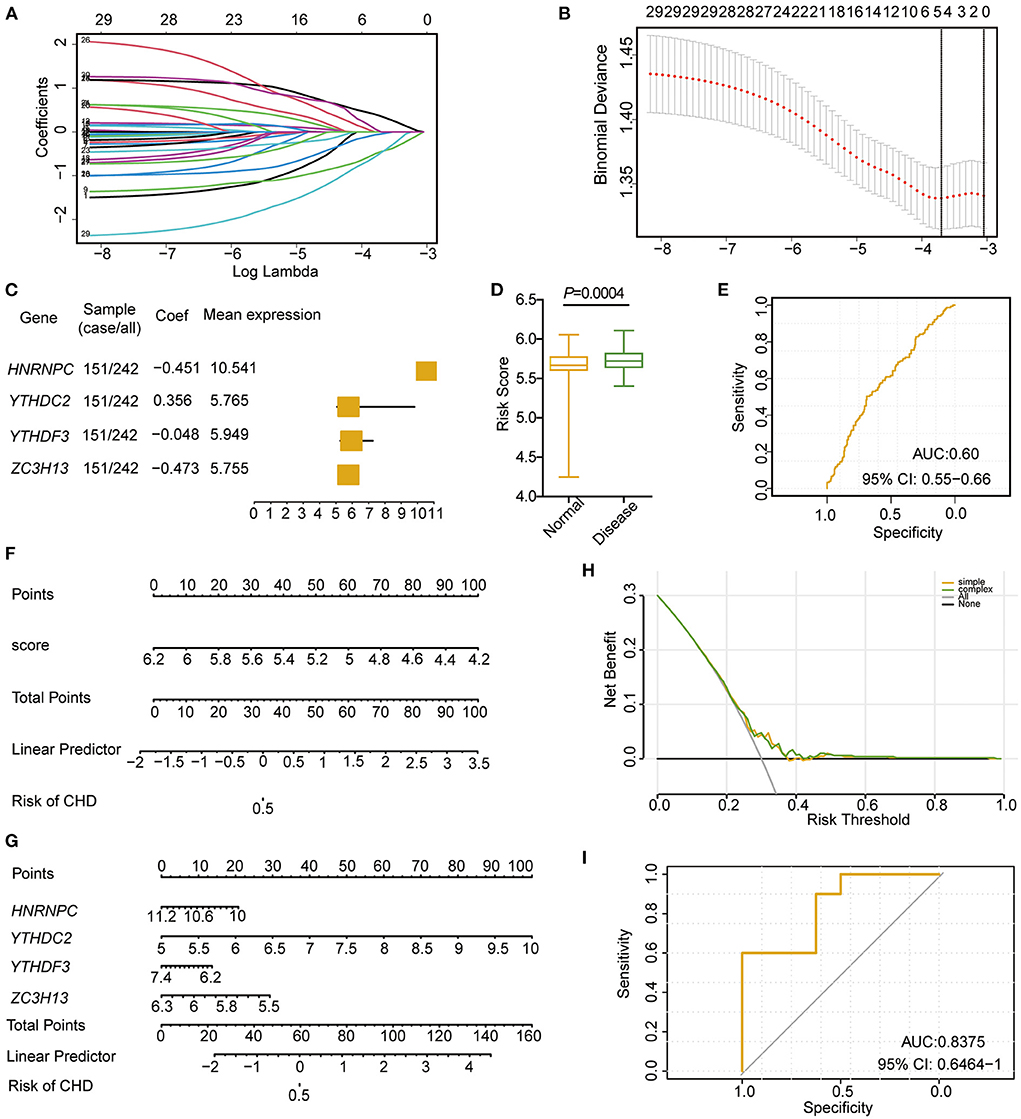
Figure 3. Cox model construction based on m6A regulators in CHD. (A,B) LASSO regression to identify significant m6A RNA methylation modification genes related to CHD. (C) Forest diagram showing the four significant m6A regulators in patients with CHD. (D) The risk score between the disease and normal samples. (E) ROC curve of the four significances. (F) Nomogram of diagnostic scores for patients with CHD. (G) Nomogram of the four m6A regulator significance for the diagnosis of CHD. (H) PCA analysis of the nomogram model. (I) ROC curve of the cox model of the validation set (GSE159657).
Based on the expression levels of the 30 m6A regulators, unsupervised consensus clustering was conducted to investigate the m6A RNA modification clusters in the CHD samples. Two distinct subgroups were identified based on qualitative differences in expression among the 30 m6A-related genes, with 83 samples included in Cluster 1 and 159 samples included in Cluster 2 (Figures 4A–C; Supplementary Table 4). The principal component analysis (PCA) results showed that the two clusters had visible distinctions (Figure 4D). All 30 m6A regulators had remarkable differences in expression between the two m6A modification clusters (Figures 4E,F), and the four significant m6A-related genes were expressed at higher levels in Cluster 2 than in Cluster 1 (Figure 4E). These results validate the different m6A RNA modification patterns in the two clusters of CHD patients.
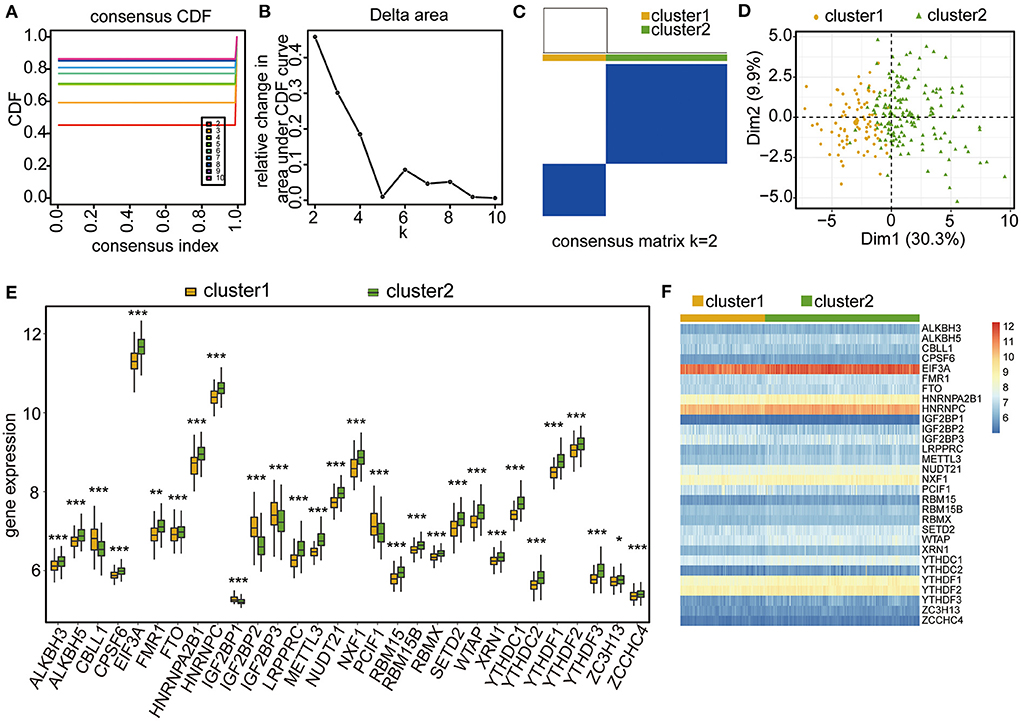
Figure 4. Unsupervised clustering analysis of CHD samples based on the four-gene significance. (A–C) Unsupervised clustering result of CHD samples. (D) PCA analysis of the two m6A RNA modification patterns. (E) Box plot showing the expressional levels of the 30 m6A regulators in the two m6A RNA modification patterns. The statistical significance was calculated via Wilcoxon rank sum test, ***P < 0.001, **P < 0.01, *P < 0.05. (F) Heatmap showing the expressional levels of the 30 m6A regulators in the two m6A RNA modification patterns.
To assess the biological characteristics of the two m6A RNA modification clusters, the differentially expressed genes (DEGs) between the clusters were identified. Based on the threshold of a fold change >1.5 and an adjusted P < 0.05, a total of 491 genes were found to be significantly differentially expressed between the two clusters (Figures 5A,B; Supplementary Table 5). The subsequent Gene Ontology (GO) enrichment results showed that these DEGs belonged to the biological processes of epidermal cell differentiation, keratinocyte differentiation, keratinization, and skin development signaling pathways (Figures 5C,D; Table 2; Supplementary Table 6). Additionally, these DEGs were enriched in the cellular component categories of anchored components of the membrane, intermediate filaments, intermediate cytoskeleton filaments, keratin filaments, and rough endoplasmic reticulum (Figures 5C,E; Table 2; Supplementary Table 6), and the molecular function categories of G-protein coupled receptor activity, neuropeptide receptor activity, and peptide receptor activity (Figures 5C,F; Table 2; Supplementary Table 6).
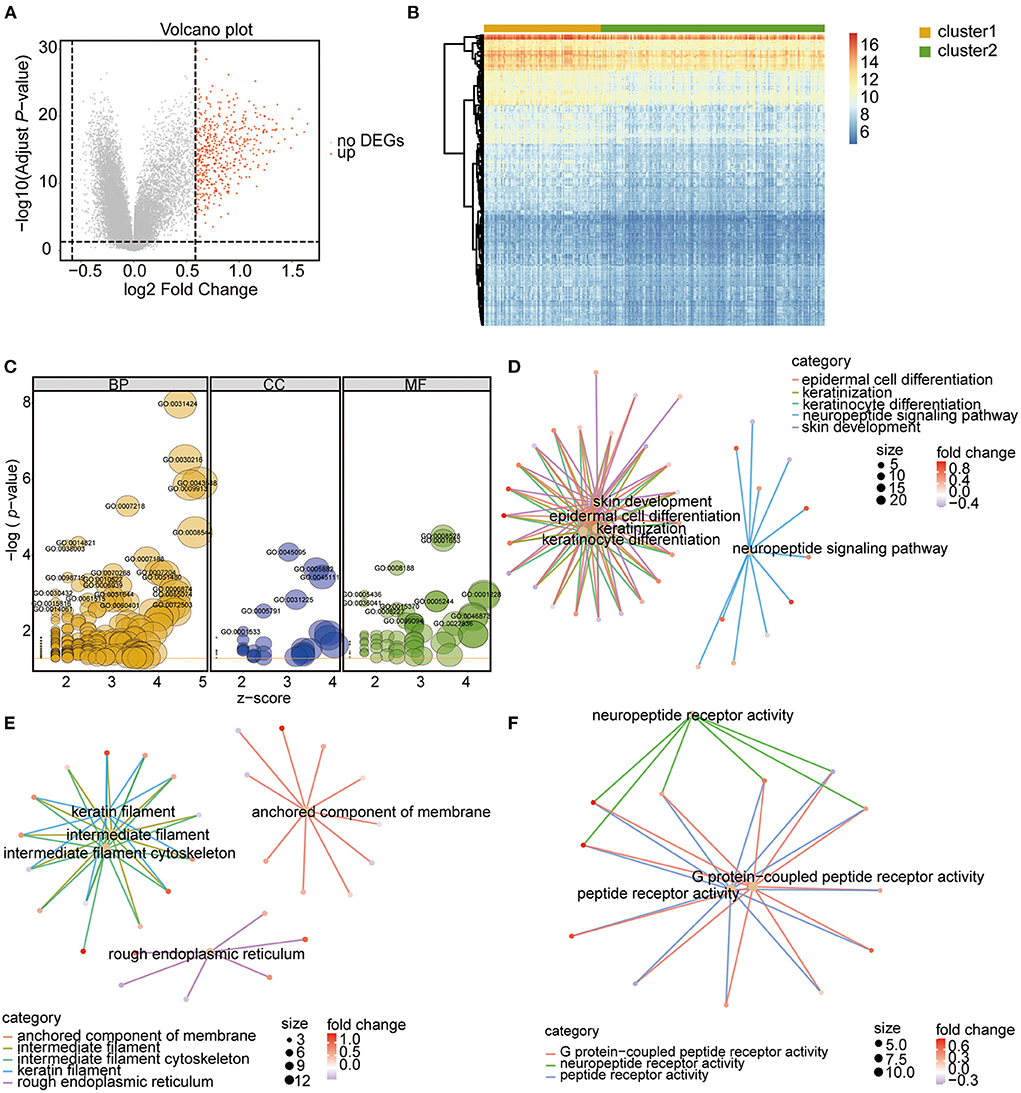
Figure 5. Identification and function analysis of DEGs between the two m6A RNA modification patterns. (A) Volcano Plot showing the DEGs in cluster 1 vs. cluster 2 subgroups. The red dots represent up-regulated genes, the gray dots represent genes with no significant difference. DEGs were identified with the threshold of adjust P-value < 0.05 and Fold change > 1.5. (B) Heatmap showing the DEGs in cluster 1 vs. cluster 2 subgroups. (C) GO functional enrichment analysis of the DEGs. The node size represents the number of genes contained in the current GO Term. BP, biological process; CC, cellular component; MF, molecular function. (D–F) Top 5 terms of BP (D), CC (E), and MF (F).
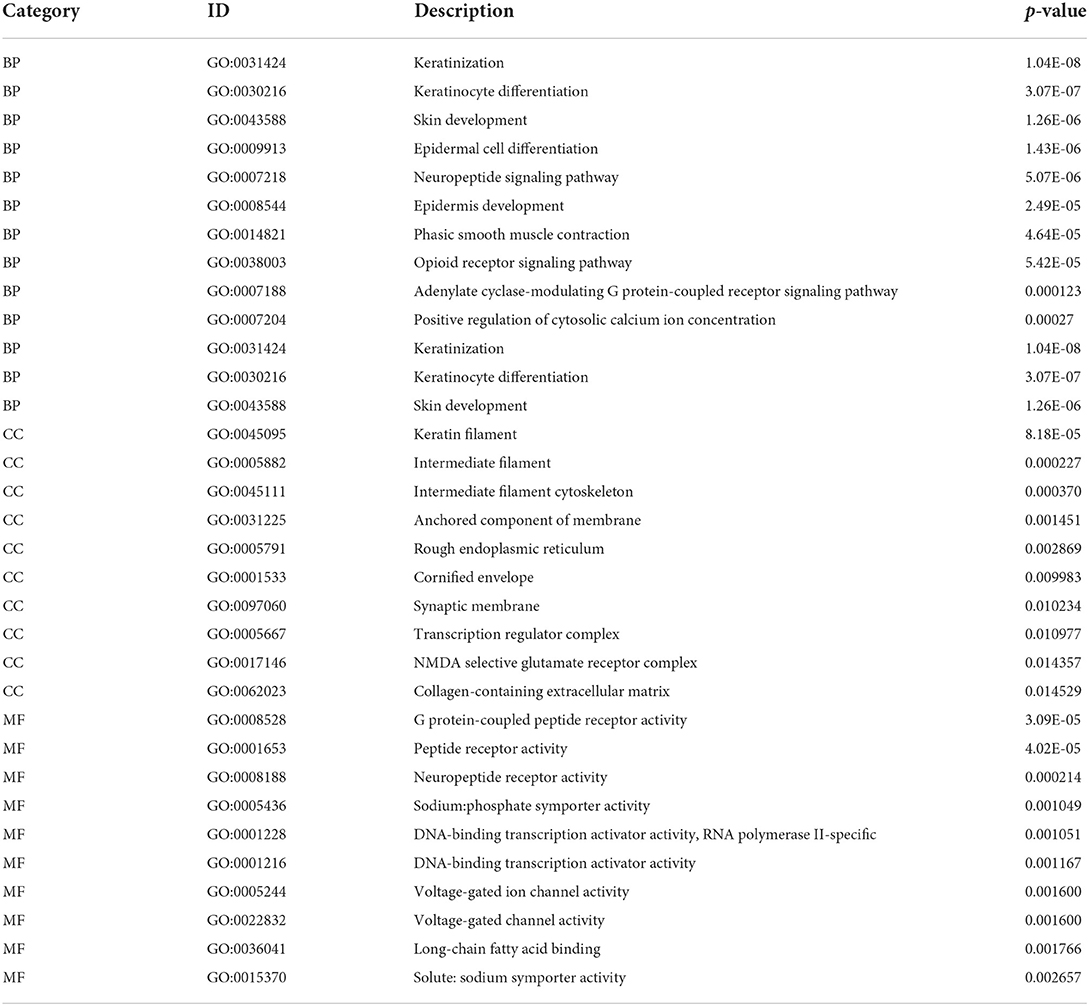
Table 2. Top 10 GO and KEGG enrichment of DEGs.
Then, gene set enrichment analysis (GSEA) enrichment was performed for the two clusters, and the results showed that the Kyoto Encyclopedia of Genes and Genomes (KEGG) pathways of ubiquitin-mediated proteolysis, peroxisomes, colorectal cancer, and autoimmune thyroid disease were enriched in Cluster 2 (Figure 6A; Supplementary Table 7), whereas the pathways of steroid hormone biosynthesis and retinol metabolism were enriched in Cluster 1 (Figure 6B; Supplementary Table 7). In the biological processes category, the terms DNA repair, mitochondrial matrix, and RNA catabolic process were enriched in Cluster 2 (Figure 6C; Supplementary Table 8), whereas the terms voltage-gated cation channel activity and skin development were enriched in Cluster C1 (Figure 6D; Supplementary Table 8). These results indicate that the examined m6A RNA modifications influenced these biological processes and pathways, which further impacted the development and progression of CHD.
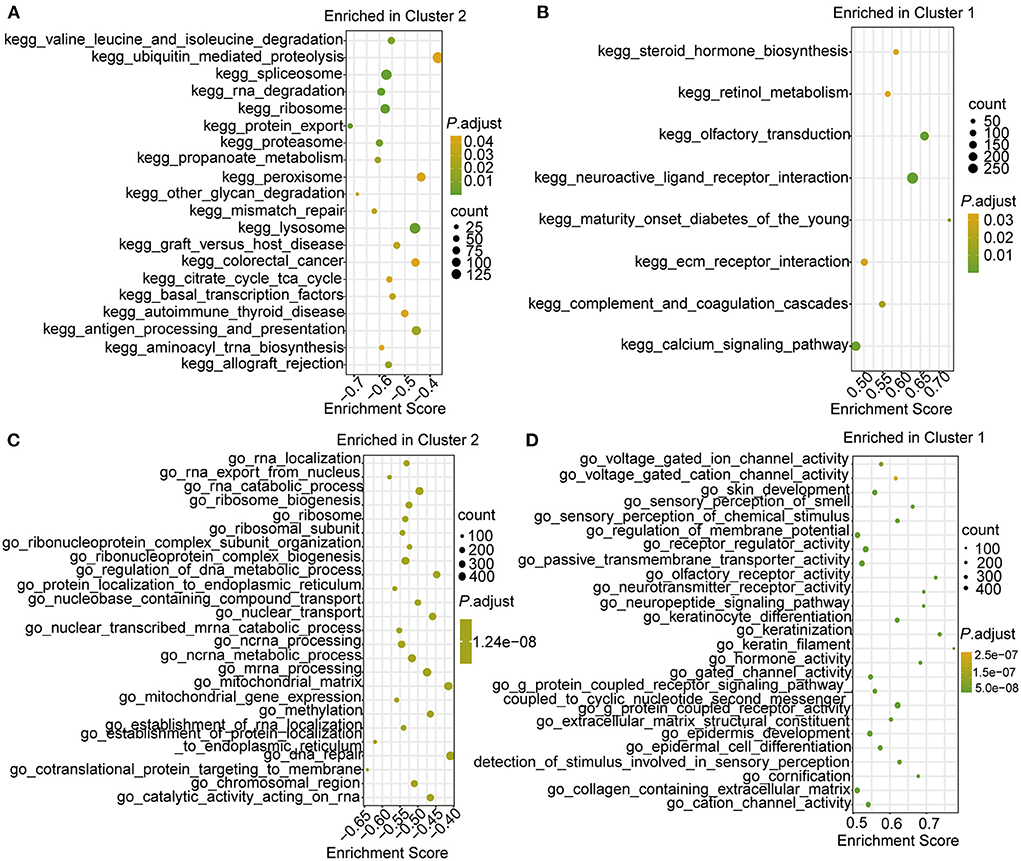
Figure 6. The GSEA enrichment analysis in the two clusters. (A,B) Top 10 GSEA-KEGG enrichment of genes in cluster 2 (A) and cluster 1 (B). (C,D) Top 10 GSEA-GO enrichment of genes in cluster 2 (C) and cluster 1 (D).
To identify the hub genes among the DEGs, a protein–protein interaction (PPI) network was constructed by using the STRING database and Cytoscape software. A total of 499 interaction pairs and 308 genes were identified in the PPI network (Figure 7A). Among these genes and interactions, NK2 homeobox 5 (NKX2-5) was closely related to 16 DEGs while glutamate ionotropic receptor NMDA type subunit 1 (GRIN1), solute carrier family 4 member 1 (SLC4A1), and urotensin 2 receptor (UTS2R) were closely related to 15 DEGs (Figure 7A). CytoHubba was used to extract the functional interaction subnet containing 30 hub genes (Figure 7B; Supplementary Table 9). The GO enrichment results showed that these hub genes were linked to the biological processes of keratinization, chromatin, and sequence-specific double-stranded DNA binding (Figure 7C; Table 3; Supplementary Table 10). Moreover, we ranked the hub genes based on the average functional similarity (Figure 7D). Late cornified envelope 1A (LCE1A) was the top protein that potentially played a key role in CHD (Figure 7D). Moreover, the ROC results showed that these hub genes could distinguish the two RNA modification patterns well (Supplementary Figure 1).
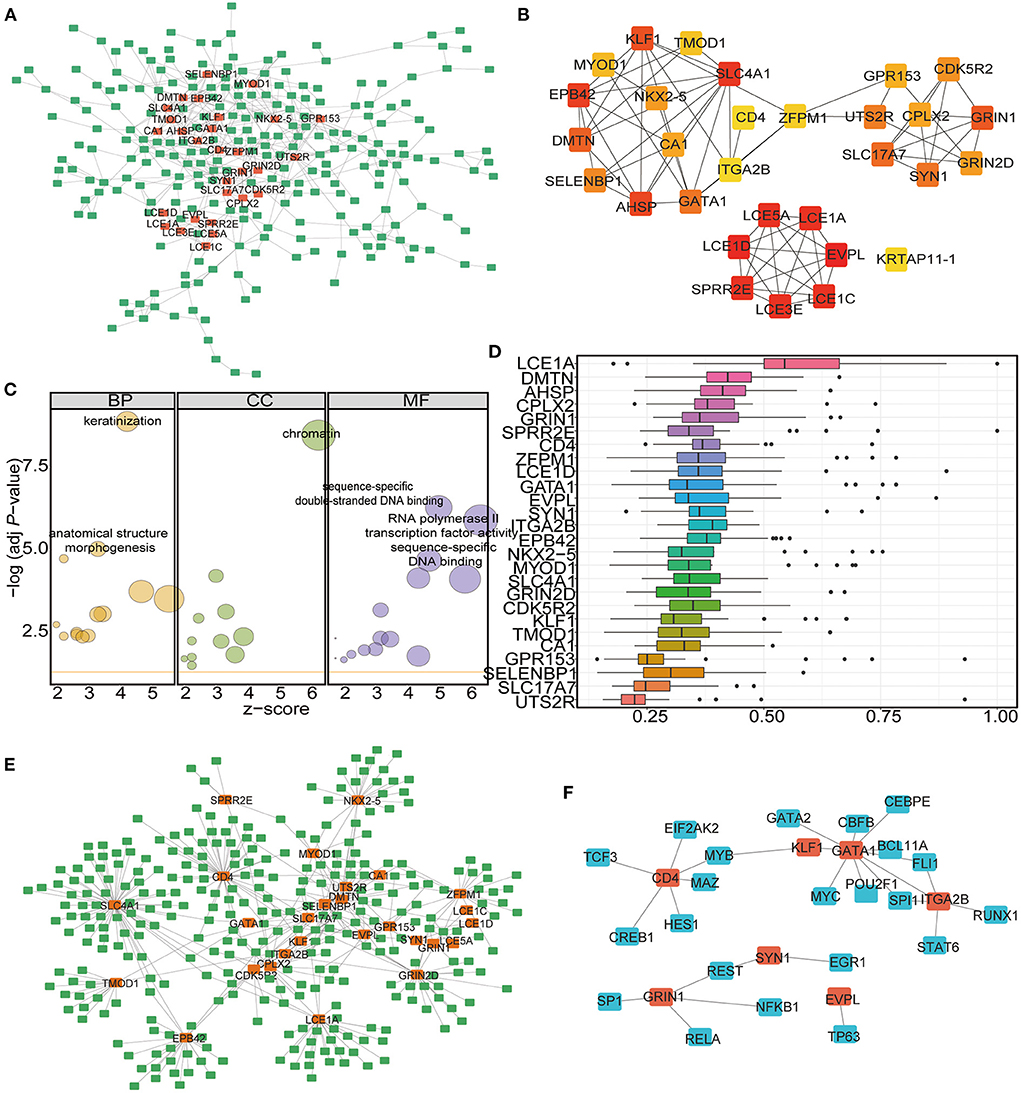
Figure 7. Identification of the hub-genes and the miRNA-mRNA-TF network construction. (A) PPI network analysis of DEGs in the two clusters. (B) Hub-gene network among the DEGs. (C) GO functional enrichment analysis of the Hub-genes. The node size represents the number of genes contained in the current GO Term. BP: biological process; CC: cellular component; MF: molecular function. (D) Functional similarity analysis of the hub-genes. The horizontal axis is the correlation size, the vertical axis is the gene name. (E) The miRNA-mRNA interaction network of the hub-genes. The green label represents miRNAs, the orange label represents mRNAs. (F) The mRNA-TF interaction network of the hub-genes. The blue label represents TFs, the orange label represents mRNAs.
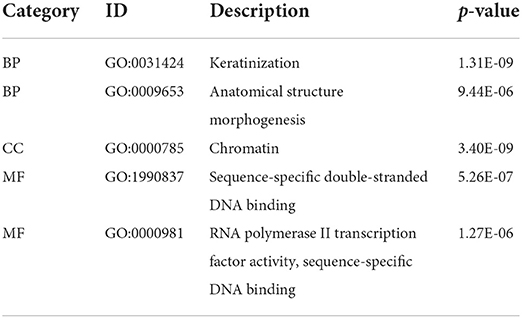
Table 3. Top 3 GO enrichment of hub-genes.
The important roles of microRNAs (miRNAs) in the development and treatment of human diseases have been determined in recent years. A previous study predicted potential miRNA-disease associations by using a novel unsupervised deep learning framework with a variational autoencoder (62). To study the ncRNAs associated with the selected hub genes, we acquired the associated miRNAs and lncRNAs from the miRNet database and constructed the mRNA-miRNA-lncRNA interaction network (Supplementary Figure 2). Among the hub genes, 27 were found to be correlated with ncRNAs. A total of 308 miRNAs (Supplementary Table 11 sheet 1) and 883 lncRNAs (Supplementary Table 11 sheet 1) were found to be associated with the 27 mRNAs (Supplementary Figure 2). We then analyzed the miRNA–mRNA interaction network, which included 396 interactions involving 27 mRNAs and 308 miRNAs (Figure 7E; Supplementary Table 11 sheet 2). According to the results, SLC4A1 had the largest number of interactional miRNAs at 63, while hsa-mir-146a-5p had the most target mRNAs at 8 (Figure 7E).
Then, we established the mRNA–TF network to analyse the regulation of gene expression modes by the hub genes. The mRNA–TF interaction network included 29 interactions involving 7 mRNAs and 23 TFs (Figure 7F; Supplementary Table 12). According to the results, GATA binding protein 1 (GATA1) regulated 9 TFs, and it also served as a TF and interacted with 3 hub genes (Figure 7F). The results suggest that these m6A-related hub genes are involved in the gene regulatory network in CHD.
To further determine the differences in immune microenvironment characteristics between the two m6A RNA modification clusters, single-sample GSEA (ssGSEA) was performed to calculate the infiltrated proportions of 28 types of immune cells. The results showed that the infiltrated proportions of multiple types of immune cells were significantly lower in Cluster 1 than in Cluster 2 (Figure 8A). Moreover, the hub genes were strongly correlated with the immune cell infiltration abundance (Figure 8B). For example, the infiltrated abundance of activated CD4 T cells, activated CD8 T cells, effector memory CD8 T cells, central memory CD4 T cells, regulatory T cells, gamma delta T cells, immature dendritic cells, memory B cells, monocytes, natural killer T cells, and type 2 T helper cells were significantly and negatively correlated with the hub genes (Figure 8B, green). The abundances of infiltrated natural killer T cells, CD56dim natural killer cells, type 1 T helper cells and type 17 T helper cells were positively correlated with the hub genes (Figure 8B, red).
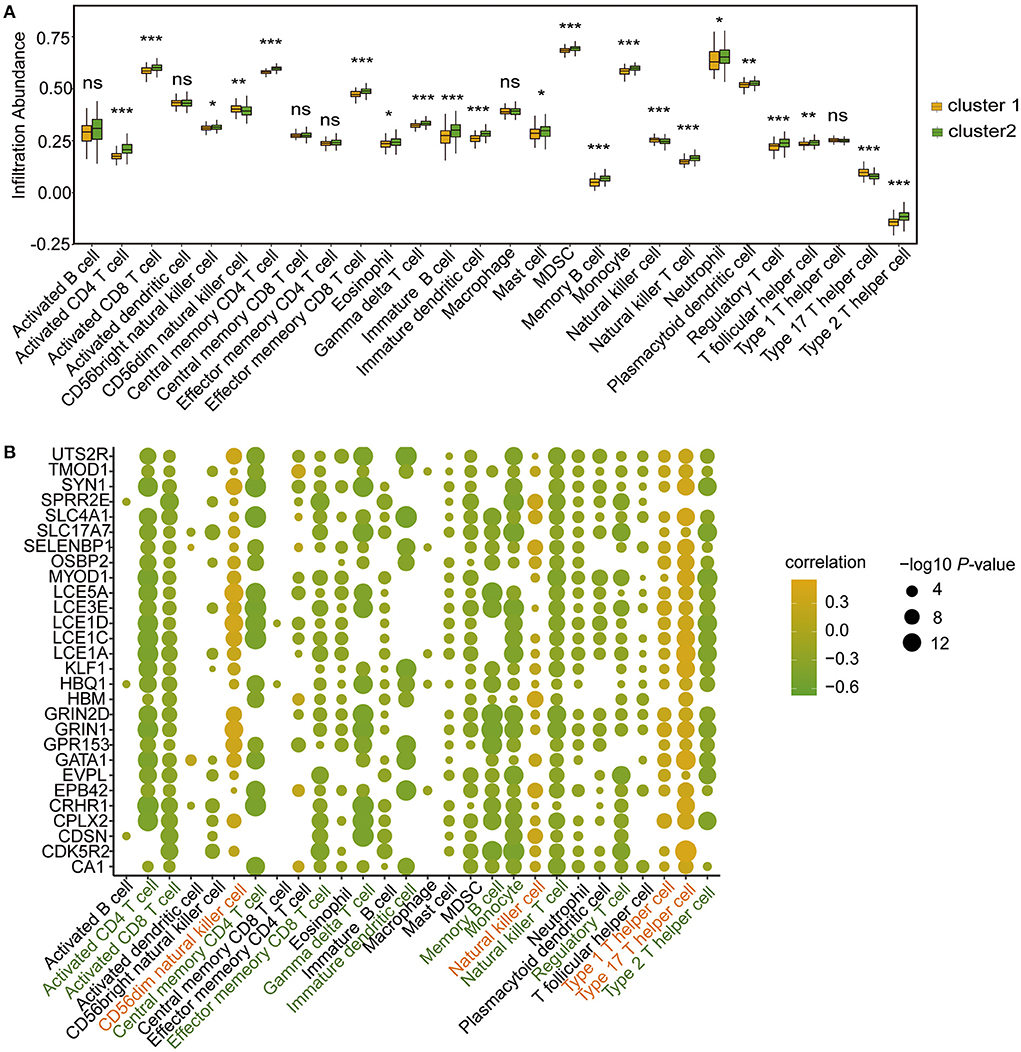
Figure 8. Immune microenvironment characteristics of immune cells in CHD patients of the two m6A RNA modification patterns according to ssGSEA. (A) Box plot showing the immune cell levels in the two m6A RNA modification patterns based on ssGSEA result. The statistical significance was calculated via Wilcoxon rank sum test, ***P < 0.001, **P < 0.01, *P < 0.05. (B) The correlation between hub-genes and immune cell levels. The horizontal axis represents immune cells, the vertical axis represents Hub gene, the node color represents correlation, and the node size represents significance level.
The CIBERSORT algorithm was further applied to analyse the infiltrated abundance of 22 types of immune cells in patients in the two clusters. The landscape of immune cell infiltration showed that monocytes and neutrophils were predominant among the 22 immune cell types in those with CHD (Figure 9A). Compared with the patients in Cluster 1, the proportion of infiltrated M0 macrophages and plasma cells were lower in Cluster 2 (Figure 9B). The correlation results showed that the hub genes were positively correlated with macrophages (Figure 9C) in patients in Cluster 1, and negatively correlated with follicular helper T cells and Tregs (Figure 9D) in patients in Cluster 2. These findings demonstrated a strong link between m6A RNA modification and immune cell infiltration in patients with CHD, thus indicating that this type of modification further functions in the development and progression of CHD.
Figure 9. Infiltrating proportion of immune cells in CHD patients of the two m6A RNA modification patterns according to CIBERSORT algorithm. (A) The landscape of immune cells infiltration in patients with CHD based on CIBERSORT algorithm. (B) Box plot showing the proportion of immune cells infiltration between cluster 1 and cluster 2. The statistical significance was calculated via Wilcoxon rank sum test, ***P < 0.001. (C,D) The correlation between hub-genes and immune cell levels in cluster 1 (C) and cluster 2 (D). The horizontal axis represents immune cells, the vertical axis represents Hub gene, the node color represents correlation, and the node size represents significance level.
To verify the potential role of m6A RNA modification in the development of CHD, the whole blood cells isolated from patients (n = 8) with CHD piror to undergoing cardiac catheterization and normal people (n = 8) were collected, and the mRNA expression levels of the related hub genes in the patients with CHD were detected by qRT-PCR. The result showed that eight hub genes were upregulated in patients with CHD compared to the normal people (Figure 10A), including alpha hemoglobin stabilizing protein (AHSP), carbonic anhydrase 1 (CA1), solute carrier family 4 member 1 (SLC4A1), selenium binding protein 1 (SELENBP1), erythrocyte membrane protein band 4.2 (EPB42), tropomodulin 1 (TMOD1), late cornified envelope 5A (LCE5A), dematin actin binding protein (DMTN). In addition, three hub genes were downregulated in CHD patients, and they were late cornified envelope 1A (LCE1A), G protein-coupled receptor 153 (GPR153), late cornified envelope 1D (LCE1D) (Figure 10B). This indicated that these genes may have critical roles in the development of CHD, thus further confirming the potential regulatory role of m6A RNA modification in CHD progression.
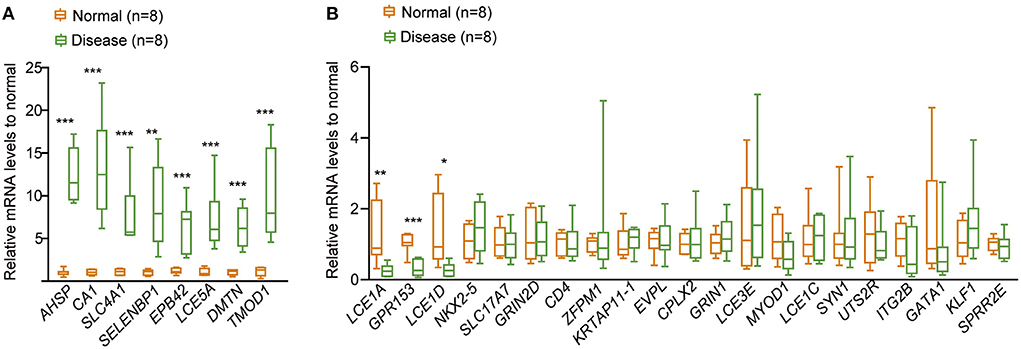
Figure 10. qRT-PCR to detect the relative expression of the 30 hub genes in CHD. (A) The relative expressional levels of the eight up-regulated hub genes in CHD. (B) The relative expressional levels of the three down-regulated hub genes and genes that were not changed in CHD compared to the normal people. The statistical significance was calculated via one-way ANOVA, ***P < 0.001, **P < 0.01, *P < 0.05.
m6A RNA methylation, in which a methyl group is added to the nitrogenous base at the sixth position of the adenine residue in RNA, has emerged as one of the most common internal modifications of RNAs (63) and is linked to multiple human diseases, including CVD (3, 20, 21, 64, 65), chronic obstructive pulmonary disease (66), neurodegenerative disease (67), periodontitis (18), cancers (68), and metabolic syndromes (69). The so-called “writer,” “eraser,” and “reader” proteins can respectively add, remove, or recognize m6A-modified sites and impact important biological processes (70, 71). The discovery of these regulators increased our perception of the function of the m6A RNA modification.
According to LASSO regression, the current study first identified four m6A regulators that were significant in the development and progression of CHD, including three m6A “readers” (HNRNPC, YTHDC2, and YTHDF3) and one “writer” (ZC3H13) among the 30 differentially expressed m6A regulators in CHD samples. Compared with previous models (62), LASSO regression is characterized by its use of multidimensional continuous dependent variables to build linear models. LASSO regression requires minimal data formatting and is widely used. Additionally, LASSO regression can also screen variables to reduce the model complexity and selectively include variables in the model to obtain better performance parameters, and the complexity of the model can be controlled by a series of parameters to avoid overfitting. Based on the expression of the four genes, CHD patients had significantly higher risk scores than healthy people. Meanwhile, the expression levels of the four m6A regulators, especially that of YTHDC2, were predictive of high CHD risk. The results indicate that these genes might be related to the prognoses of CHD patients and could play prodevelopmental roles in CHD. As an m6A “reader,” HNRNPC belongs to the subfamily of ubiquitously expressed heterogeneous nuclear ribonucleoproteins (hnRNPs) and is implicated in oncogenic functions in various tumor (72). CHD is associated with a higher incidence of brain pathologies. For example, depression and CHD are highly comorbid conditions. A new study showed that brain-derived neurotrophic factor (BDNF) plays an important role in cardiovascular processes (73). HNRNPC was recently shown to have enriched binding sites in the brain (74). This strengthens our finding that HNRNPC is a potential biomarker and prognostic signature. YTHDC2 belongs to the YT521-B homology superfamily, contains the YTH domain, which is typical of eukaryotes. The protein has a conserved m6A-binding domain (75) and preferentially binds to m6A-modified RNA, modulates the stability of m6A-containing mRNAs and facilitates their efficient translation (75). Recent studies have shown that YTHDC2 can improve the translation efficiency of hypoxia-inducible factor-1alpha (HIF-1a) mRNA (76). HIF-1a has been shown to have the potential function of promoting coronary collateral formation, and might be helpful in predicting the prognoses of patients with CHD (77). Moreover, the important role of hypoxia in CAD development has been reported in previous papers (78). Similar to YTHDC2, YTHDF3 is also a member of the YTH superfamily, and it works closely with other readers to influence the metabolism of m6A-modified mRNA (79, 80). ZC3H13 is an m6A “writer” that facilitates nuclear localization of the writer complex (81). In addition, we found that YTHDF3 and ZC3H13 were chromosomally located close to CHD susceptibility genes, indicating that they had potential regulatory effects on CHD development. Although these genes have been known for many years, this is the first study to demonstrate the importance of these four m6A regulators in the development and progression of CHD.
Consensus cluster analysis using the 30 m6A regulators divided the CHD patient samples into two distinct clusters with different m6A regulator expression levels, indicating that two totally distinct m6A modification patterns occur in patients with CHD. A total of 491 genes were found to be significantly upregulated in the samples in Cluster 1 compared with those in Cluster 2, suggesting that these 491 genes might be the target genes for regulation by m6A RNA modifications. Subsequent GO analysis showed that these genes were enriched in the following biological processes: epidermal cell differentiation, keratinocyte differentiation, keratinization, and skin development signaling pathways. Among the 491 m6A RNA modification-related DEGs, 30 were identified as hub genes by PPI network analysis. These hub genes were enriched in the following biological processes: keratinization, chromatin, and sequence-specific double-stranded DNA binding. The GO results suggested that keratinization, epidermal cell differentiation, and skin development signaling pathways may be the common bioprocesses that influence m6A RNA modification in CHD. Skin lesions are frequent manifestations of underlying systemic conditions, including systemic autoimmune vasculitis (82). For example, patients with psoriasis are up to 50% more likely to develop CVD, and this CVD risk increases with skin symptom severity (83). Our results showed that the dysregulation of keratinization and skin development may be a result of m6A RNA modification disorder. This may be a pathway by which m6A RNA modification impacts CHD development. Moreover, LCE1A protein was ranked as the top protein playing a key role in CHD, which was found to be downregulated in CHD by qRT-PCR. LCE1A belongs to the LCE gene cluster within the EDC on chromosome 1. The LCE cluster contains multiple conserved genes that encode stratum corneum proteins, and these genes are expressed relatively late during fetal assembly of the skin cornified envelope (84). These results all indicate that the dysregulation of m6A RNA modification impacts biological processes in patients with CHD that ultimately influence the development of this disease.
Notably, we found that many miRNAs were closely related to the hub genes that were affected by m6A regulators. For example, hsa-mir-146a-5p was the most common miRNA and was linked to eight target hub genes. Sang J's team found that hsa-mir-146a-5p was regulated by the m6A “writer” METTL14 to function in cancer invasion and migration (85). In addition, hsa-miR-146a-5p was reported to be involved in the innate immune response by regulating IFN-β signaling (86). The miRNA–mRNA network constructed in this study indicates that hsa-miR-146a-5p might be an m6A regulator target that regulates CHD development, although this hypothesis requires further verification. Several miRNA polymorphisms have been associated with susceptibility to specific health disorders, including CHD (87). Several papers have established that miRNAs regulate various cardiovascular development processes and functions, and a deregulated cardiac-enriched miRNA profile plays a critical role in the pathogenesis of CHD and biological aging (88). By constructing the competing endogenous RNA (ceRNA) regulation network, 308 miRNAs and 883 lncRNAs were found to be associated with the hub genes. Among these ncRNAs, hsa-miR-6884-5p, hsa-miR-485-5p, hsa-miR-16-5p, hsa-miR-497-5p, and hsa-miR-665 regulate multiple miRNAs and are regulated by various lncRNAs. For example, we found that 107 miRNAs were regulated by lnc-NEAT1. A recent study showed that NEAT1/miR-140-3p/MAPK1 mediates the viability and survival of coronary endothelial cells and affects coronary atherosclerotic heart disease (89). miR-140-3p was identified as a valuable biomarker for risk estimation in CHD to predict mortality in secondary prevention settings (90). miR-140-3p was also found to be the target miRNA of lnc-SNHG1 in this study, with the latter regulated by METTL3 (91). Additionally, we found that miR-140-3p was correlated with six hub genes (CD4, GRIN1, ZEPM1, SLC17A7, EPB42, and SLC4A1). These findings may explain the potential regulatory effects of m6A RNA modifications on the development of CHD. Based on the mRNAs-TFs network, GATA1 was found to be prominent and interact with nine TFs and three hub genes. GATA1 is one of the most meaningful TFs for biologists because it interacts with a large number of other TFs and regulates many haematopoietic genes (92). The common role of GATA1 in human disease is its procancer function (93). The potential role of this gene in CHD was first revealed in our study and should be further investigated. These findings provide a prospective theoretical basis for further research on CHD.
Emerging evidence has indicated that inflammation and immune activation appear to be important in the pathogenesis of CHD (94). Various types of immune cells play specific roles in the human immune response and are involved in the strong crosstalk network of the immune system (70, 95). Recently, m6A RNA modification has attracted increasing attention in the regulation of the human immune system (96) based on its important role in the pathogenesis and development of human diseases (97). In the present study, we found that the proportion of infiltrated immune cells differed between the two patient clusters constructed based on the m6A regulators. The proportions of 28 types of immune cells were calculated by ssGSEA, and the results showed that patients in Cluster 2 had an activated immune level with higher infiltrating proportions of activated CD4 T cells, activated CD8 T cells, effector memory CD8 T cells, central memory CD4 T cells, regulatory T cells, gamma delta T cells, immature dendritic cells, memory B cells, monocytes, natural killer cells, and type 2 T helper cells, while patients in Cluster 1 had higher infiltrating proportions of natural killer T cells, CD56dim natural killer cells, type 1 T helper cells and type 17 T helper cells. Previous studies showed that the infiltration of CD8+ T cells could enhance the accumulation of macrophages and inflammation in a human disease model (98, 99). CD4+ T cells are subdivided into two main subsets according to their functions: effector cells and regulatory T (Treg) cells (100). The main function of Treg cells is to avoid autoimmune reactions and to stop the effector response against exogenous antigens, when the response itself becomes dangerous to the host (100). Type 1 T helper (Th1) and type 17 T helper (Th17) cells are involved in chronic inflammatory disorders and the pathogeneses of autoimmune diseases, whereas type 2 T helper (Th2) cells play a critical role in allergies (100). Additionally, the CIBERSORT algorithm was applied to analyse the 22 types of infiltrating immune cells. The results showed that the infiltrated proportions of M0 macrophages and plasma cells were lower in the immune microenvironment of CHD patients in Cluster 2 than those of patients in Cluster 1. Macrophages are the primary contributors to potentially pathological inflammatory processes, which produce large numbers of inflammatory cytokines in response to danger signals (101). These cytokines can initiate a cascade of inflammatory mediator release to cause wholesale tissue destruction (101). Both algorithms used in this study showed significant correlations between m6A RNA modification and these proinflammatory lymphocytes, providing evidence that the infiltrating proportions of these lymphocytes were higher in CHD patients in Cluster 2, and these patients also had higher levels of m6A regulators. The enhanced expression of m6A regulators leads to a high level of m6A RNA methylation, which further changes the expression of target genes and ultimately influences the immune microenvironment.
A previous study identified differentially methylated m6A sites within both mRNAs and lncRNAs between CAD and control groups by methylated RNA immunoprecipitation sequencing (MeRIP-seq) (25). This finding indicates that m6A RNA modification plays an important role in the CHD process. Our results are consistent with it. However, our study aimed to analyse distinct clusters based on m6A RNA modifications, including examinations of DEGs and the immune microenvironment. We systematically revealed the heterogeneity of m6A RNA modifications in CHD and indicated the corresponding biological processes influenced in CHD by analyzing DEGs between the distinct clusters. This study provides a novel theoretical basis for revealing the pathogenesis of CHD regulated by m6A regulators. It also provides a prospective theoretical basis for further studies on the regulatory pathway of m6A RNA modification. Moreover, the influence of CHD-related m6A RNA modification on immune system disorders was clarified for the first time, thus providing a potentially significant research foundation for elucidating the pathogenesis of CHD. Finally, many target miRNAs and TFs regulated by m6A RNA modifications were identified in this study. These results will provide multiple potential approaches for further studies on the mechanisms of m6A modification.
However, this study had certain limitations. First, due to the lack of disease-related prognostic indices in the GEO datasets, the clinical indicators of CHD were not analyzed. Therefore, a large amount of clinical information from CHD patients should be collected to construct a validation set, and additional clinical information should be collected through follow-ups to further analyse the relationships between m6A modification and clinical parameters in CHD patients. The effect of m6A RNA modification on the prognosis of CHD needs to be further explained. Second, in vivo and in vitro experiments were performed to further explain the specific roles of the four significant m6A regulators in the development of CHD. Additionally, methylated RNA immunoprecipitation sequencing (MeRIP-seq) may be conducted to identify the m6A RNA modification patterns in CHD and to identify the significant genes involved in m6A modification. Finally, we found 308 miRNAs that were closely related to the m6A-related DEGs. These miRNAs might be linked to CHD in future analyses.
In conclusion, the current study suggests that changes in m6A RNA modification patterns mediated by regulators are involved in the immune microenvironment of patients with CHD and play significant roles in the progression of the disease. These findings provide potential novel biomarkers for the diagnosis of CHD.
The datasets presented in this study can be found in online repositories. The names of the repository/repositories and accession number(s) can be found in the article/Supplementary materials.
The studies involving human participants were reviewed and approved by Ethics Committee of Qingdao Hiser Hospital Affiliated to Qingdao University. The patients/participants provided their written informed consent to participate in this study.
ZL, TJ, and YC designed experiments and interpreted data. ZL, YS, MW, RS, KQ, YZ, and TJ conducted bioinformatic and statistical analyses. ZL wrote the paper. All authors have read and approved the manuscript for publication.
This work was supported by grants from the Natural Science Foundation of Shandong Province [ZR2021MH253 to YC].
The authors declare that the research was conducted in the absence of any commercial or financial relationships that could be construed as a potential conflict of interest.
All claims expressed in this article are solely those of the authors and do not necessarily represent those of their affiliated organizations, or those of the publisher, the editors and the reviewers. Any product that may be evaluated in this article, or claim that may be made by its manufacturer, is not guaranteed or endorsed by the publisher.
The Supplementary Material for this article can be found online at: https://www.frontiersin.org/articles/10.3389/fcvm.2022.905737/full#supplementary-material
1. Francula-Zaninovic S, Nola IA. Management of measurable variable cardiovascular disease' risk factors. Curr Cardiol Rev. (2018) 14:153–63. doi: 10.2174/1573403X14666180222102312
2. Wong ND. Epidemiological studies of CHD and the evolution of preventive cardiology. Nat Rev Cardiol. (2014) 11:276–89. doi: 10.1038/nrcardio.2014.26
3. Wu S, Zhang S, Wu X, Zhou X. m6A RNA Methylation in Cardiovascular diseases. Mol Ther. (2020) 28:2111–9. doi: 10.1016/j.ymthe.2020.08.010
4. Gisterå A, Hansson GK. The immunology of atherosclerosis. Nat Rev Nephrol. (2017) 13:368–80. doi: 10.1038/nrneph.2017.51
5. Fu Y, Dominissini D, Rechavi G, He C. Gene expression regulation mediated through reversible m6A RNA methylation. Nat Rev Genet. (2014) 15:293–306. doi: 10.1038/nrg3724
6. Zhou Y, Kong Y, Fan W, Tao T, Xiao Q, Li N, et al. Principles of RNA methylation and their implications for biology and medicine. Biomed Pharmacother. (2020) 131:110731. doi: 10.1016/j.biopha.2020.110731
7. Wei W, Ji X, Guo X, Ji S. Regulatory role of N6-methyladenosine (m6 A) methylation in RNA processing and human diseases. J Cell Biochem. (2017) 118:2534–43. doi: 10.1002/jcb.25967
8. Peng L, Long T, Li F, Xie Q. Emerging role of m6 a modification in cardiovascular diseases. Cell Biol Int. (2022) 46:711–22. doi: 10.1002/cbin.11773
9. Zaccara S, Ries RJ, Jaffrey SR. Reading, writing and erasing mRNA methylation. Nat Rev Mol Cell Biol. (2019) 20:608–24. doi: 10.1038/s41580-019-0168-5
10. Shi H, Wei J, He C. Where, when, and how: context-dependent functions of RNA methylation writers, readers, and erasers. Mol Cell. (2019) 74:640–50. doi: 10.1016/j.molcel.2019.04.025
11. Jia G, Fu Y, Zhao X, Dai Q, Zheng G, Yang Y, et al. N6-methyladenosine in nuclear RNA is a major substrate of the obesity-associated FTO. Nat Chem Biol. (2011) 7:885–7. doi: 10.1038/nchembio.687
12. Zheng G, Dahl JA, Niu Y, Fedorcsak P, Huang CM, Li CJ, et al. ALKBH5 is a mammalian RNA demethylase that impacts RNA metabolism and mouse fertility. Mol Cell. (2013) 49:18–29. doi: 10.1016/j.molcel.2012.10.015
13. Zhao Y, Shi Y, Shen H, Xie W. m6A-binding proteins: the emerging crucial performers in epigenetics. J Hematol Oncol. (2020) 13:35. doi: 10.1186/s13045-020-00872-8
14. He L, Li H, Wu A, Peng Y, Shu G, Yin G. Functions of N6-methyladenosine and its role in cancer. Mol Cancer. (2019) 18:176. doi: 10.1186/s12943-019-1109-9
15. Lan Q, Liu PY, Haase J, Bell JL, Hüttelmaier S, Liu T. The critical role of RNA m6A methylation in cancer. Cancer Res. (2019) 79:1285–92. doi: 10.1158/0008-5472.CAN-18-2965
16. Zhou J, Wan J, Gao X, Zhang X, Jaffrey SR, Qian SB. Dynamic m(6)A mRNA methylation directs translational control of heat shock response. Nature. (2015) 526:591–4. doi: 10.1038/nature15377
17. Barbieri I, Tzelepis K, Pandolfini L, Shi J, Millán-Zambrano G, Robson SC, et al. Promoter-bound METTL3 maintains myeloid leukaemia by m6A-dependent translation control. Nature. (2017) 552:126–31. doi: 10.1038/nature24678
18. Zhang X, Zhang S, Yan X, Shan Y, Liu L, Zhou J, et al. m6A regulator-mediated RNA methylation modification patterns are involved in immune microenvironment regulation of periodontitis. J Cell Mol Med. (2021) 25:3634–45. doi: 10.1111/jcmm.16469
19. Sun D, Yang H, Fan L, Shen F, Wang Z. m6A regulator-mediated RNA methylation modification patterns and immune microenvironment infiltration characterization in severe asthma. J Cell Mol Med. (2021) 25:10236–47. doi: 10.1111/jcmm.16961
20. Berulava T, Buchholz E, Elerdashvili V, Pena T, Islam MR, Lbik D, et al. Changes in m6A RNA methylation contribute to heart failure progression by modulating translation. Eur J Heart Fail. (2020) 22:54–66. doi: 10.1002/ejhf.1672
21. Zhang B, Xu Y, Cui X, Jiang H, Luo W, Weng X, et al. Alteration of m6A RNA methylation in heart failure with preserved ejection fraction. Front Cardiovasc Med. (2021) 8:647806. doi: 10.3389/fcvm.2021.647806
22. Dorn LE, Lasman L, Chen J, Xu X, Hund TJ, Medvedovic M, et al. The N6-methyladenosine mRNA methylase METTL3 controls cardiac homeostasis and hypertrophy. Circulation. (2019) 139:533–45. doi: 10.1161/CIRCULATIONAHA.118.036146
23. Mathiyalagan P, Adamiak M, Mayourian J, Sassi Y, Liang Y, Agarwal N, et al. FTO-dependent N6-methyladenosine regulates cardiac function during remodeling and repair. Circulation. (2019) 139:518–32. doi: 10.1161/CIRCULATIONAHA.118.033794
24. Li T, Zhuang Y, Yang W, Xie Y, Shang W, Su S, et al. Silencing of METTL3 attenuates cardiac fibrosis induced by myocardial infarction via inhibiting the activation of cardiac fibroblasts. FASEB J. (2021) 35:e21162. doi: 10.1096/fj.201903169R
25. Deng K, Ning X, Ren X, Yang B, Li J, Cao J, et al. Transcriptome-wide N6-methyladenosine methylation landscape of coronary artery disease. Epigenomics. (2021) 13:793–808. doi: 10.2217/epi-2020-0372
26. Han Y, Du T, Guo S, Wang L, Dai G, Long T, et al. Loss of m6A methyltransferase METTL5 promotes cardiac hypertrophy through epitranscriptomic control of SUZ12 Expression. Front Cardiovasc Med. (2022) 9:852775. doi: 10.3389/fcvm.2022.852775
27. Zhao X, Yang L, Qin L. Methyltransferase-like 3 (METTL3) attenuates cardiomyocyte apoptosis with myocardial ischemia-reperfusion (I/R) injury through miR-25-3p and miR-873-5p. Cell Biol Int. (2021).
28. Gong R, Wang X, Li H, Liu S, Jiang Z, Zhao Y, et al. Loss of m6A methyltransferase METTL3 promotes heart regeneration and repair after myocardial injury. Pharmacol Res. (2021) 174:105845. doi: 10.1016/j.phrs.2021.105845
29. Mo XB, Lei SF, Zhang YH, Zhang H. Detection of m6A-associated SNPs as potential functional variants for coronary artery disease. Epigenomics. (2018) 10:1279–87. doi: 10.2217/epi-2018-0007
30. Guo M, Yan R, Ji Q, Yao H, Sun M, Duan L, et al. IFN regulatory Factor-1 induced macrophage pyroptosis by modulating m6A modification of circ_0029589 in patients with acute coronary syndrome. Int Immunopharmacol. (2020) 86:106800. doi: 10.1016/j.intimp.2020.106800
31. He GD, Huang YQ, Liu L, Huang JY, Lo K, Yu YL, et al. Association of circulating, inflammatory-response exosomal mRNAs with acute myocardial infarction. Front Cardiovasc Med. (2021) 8:712061. doi: 10.3389/fcvm.2021.712061
32. Beineke P, Fitch K, Tao H, Elashoff MR, Rosenberg S, Kraus WE, et al. A whole blood gene expression-based signature for smoking status. BMC Med Genomics. (2012) 5:58. doi: 10.1186/1755-8794-5-58
33. Elashoff MR, Wingrove JA, Beineke P, Daniels SE, Tingley WG, Rosenberg S, et al. Development of a blood-based gene expression algorithm for assessment of obstructive coronary artery disease in non-diabetic patients. BMC Med Genomics. (2011) 4:26. doi: 10.1186/1755-8794-4-26
34. Barrett T, Troup DB, Wilhite SE, Ledoux P, Rudnev D, Evangelista C, et al. NCBI GEO: mining tens of millions of expression profiles–database and tools update. Nucleic Acids Res. (2007) 35:D760–5. doi: 10.1093/nar/gkl887
35. Chakraborty S, Datta S, Datta S. Surrogate variable analysis using partial least squares (SVA-PLS) in gene expression studies. Bioinformatics. (2012) 28:799–806. doi: 10.1093/bioinformatics/bts022
36. Davis S, Meltzer PS. GEOquery: a bridge between the gene expression omnibus (GEO) and bioconductor. Bioinformatics. (2007) 23:1846–7. doi: 10.1093/bioinformatics/btm254
37. van Egmond MB, Spini G, van der Galien O, IJpma A, Veugen T, Kraaij W, et al. Privacy-preserving dataset combination and Lasso regression for healthcare predictions. BMC Med Inform Decis Mak. (2021) 21:266. doi: 10.1186/s12911-021-01582-y
38. Friedman J, Hastie T, Tibshirani R. Regularization paths for generalized linear models via coordinate descent. J Stat Softw. (2010) 33:1–22. doi: 10.18637/jss.v033.i01
39. Fang Y, Huang S, Han L, Wang S, Xiong B. Comprehensive analysis of peritoneal metastasis sequencing data to identify LINC00924 as a prognostic biomarker in gastric cancer. Cancer Manag Res. (2021) 13:5599–611. doi: 10.2147/CMAR.S318704
40. Pajouheshnia R, Pestman WR, Teerenstra S, Groenwold RH. A computational approach to compare regression modelling strategies in prediction research. BMC Med Res Methodol. (2016) 16:107. doi: 10.1186/s12874-016-0209-0
41. Mandrekar JN. Receiver operating characteristic curve in diagnostic test assessment. J Thorac Oncol. (2010) 5:1315–6. doi: 10.1097/JTO.0b013e3181ec173d
42. Robin X, Turck N, Hainard A, Tiberti N, Lisacek F, Sanchez JC, et al. pROC: an open-source package for R and S+ to analyze and compare ROC curves. BMC Bioinformatics. (2011) 12:77. doi: 10.1186/1471-2105-12-77
43. Van Calster B, Wynants L, Verbeek JFM, Verbakel JY, Christodoulou E, Vickers AJ, et al. Reporting and interpreting decision curve analysis: a guide for investigators. Eur Urol. (2018) 74:796–804. doi: 10.1016/j.eururo.2018.08.038
44. Fitzgerald M, Saville BR, Lewis RJ. Decision curve analysis. JAMA. (2015) 313:409–10. doi: 10.1001/jama.2015.37
45. Testa D, Jourde-Chiche N, Mancini J, Varriale P, Radoszycki L, Chiche L. Unsupervised clustering analysis of data from an online community to identify lupus patient profiles with regards to treatment preferences. Lupus. (2021) 30:1837–43. doi: 10.1177/09612033211033977
46. Wilkerson MD, Hayes DN. Consensusclusterplus: a class discovery tool with confidence assessments and item tracking. Bioinformatics. (2010) 26:1572–3. doi: 10.1093/bioinformatics/btq170
47. Ritchie ME, Phipson B, Wu D, Hu Y, Law CW, Shi W, et al. Limma powers differential expression analyses for RNA-sequencing and microarray studies. Nucleic Acids Res. (2015) 43:e47. doi: 10.1093/nar/gkv007
48. Ashburner M, Ball CA, Blake JA, Botstein D, Butler H, Cherry JM, et al. Gene ontology: tool for the unification of biology. the gene ontology consortium. Nat Genet. (2000) 25:25–9. doi: 10.1038/75556
49. Kanehisa M, Goto S. KEGG: kyoto encyclopedia of genes and genomes. Nucleic Acids Res. (2000) 28:27–30. doi: 10.1093/nar/28.1.27
50. Yu G, Wang LG, Han Y, He QY. clusterProfiler: an R package for comparing biological themes among gene clusters. OMICS. (2012) 16:284–7. doi: 10.1089/omi.2011.0118
51. Subramanian A, Tamayo P, Mootha VK, Mukherjee S, Ebert BL, Gillette MA, et al. Gene set enrichment analysis: a knowledge-based approach for interpreting genome-wide expression profiles. Proc Natl Acad Sci U S A. (2005) 102:15545–50. doi: 10.1073/pnas.0506580102
52. Szklarczyk D, Gable AL, Lyon D, Junge A, Wyder S, Huerta-Cepas J, et al. STRING v11: protein-protein association networks with increased coverage, supporting functional discovery in genome-wide experimental datasets. Nucleic Acids Res. (2019) 47:D607–13. doi: 10.1093/nar/gky1131
53. Shannon P, Markiel A, Ozier O, Baliga NS, Wang JT, Ramage D, et al. Cytoscape: a software environment for integrated models of biomolecular interaction networks. Genome Res. (2003) 13:2498–504. doi: 10.1101/gr.1239303
54. Chin CH, Chen SH, Wu HH, Ho CW, Ko MT, Lin CY. cytoHubba: identifying hub objects and sub-networks from complex interactome. BMC Syst Biol. (2014) 8:S11. doi: 10.1186/1752-0509-8-S4-S11
55. Chang L, Zhou G, Soufan O, Xia J. miRNet 2.0: network-based visual analytics for miRNA functional analysis and systems biology. Nucleic Acids Res. (2020) 48:W244–51. doi: 10.1093/nar/gkaa467
56. Yu G. Gene ontology semantic similarity analysis using GOSemSim. Methods Mol Biol. (2020) 2117:207–15. doi: 10.1007/978-1-0716-0301-7_11
57. Barbie DA, Tamayo P, Boehm JS, Kim SY, Moody SE, Dunn IF, et al. Systematic RNA interference reveals that oncogenic KRAS-driven cancers require TBK1. Nature. (2009) 462:108–12. doi: 10.1038/nature08460
58. Bhattacharya S, Andorf S, Gomes L, Dunn P, Schaefer H, Pontius J, et al. ImmPort: disseminating data to the public for the future of immunology. Immunol Res. (2014) 58:234–9. doi: 10.1007/s12026-014-8516-1
59. Newman AM, Steen CB, Liu CL, Gentles AJ, Chaudhuri AA, Scherer F, et al. Determining cell type abundance and expression from bulk tissues with digital cytometry. Nat Biotechnol. (2019) 37:773–82. doi: 10.1038/s41587-019-0114-2
60. Zhang C, Fu J, Zhou Y. A review in research progress concerning m6A methylation and immunoregulation. Front Immunol. (2019) 10:922. doi: 10.3389/fimmu.2019.00922
61. Topol EJ, Smith J, Plow EF, Wang QK. Genetic susceptibility to myocardial infarction and coronary artery disease. Hum Mol Genet. (2006) 15:R117–23. doi: 10.1093/hmg/ddl183
62. Zhang L, Chen X, Yin J. Prediction of potential miRNA-disease associations through a novel unsupervised deep learning framework with variational autoencoder. Cells. (2019) 8:1040. doi: 10.3390/cells8091040
63. Karthiya R, Khandelia P. m6A RNA methylation: ramifications for gene expression and human health. Mol Biotechnol. (2020) 62:467–84. doi: 10.1007/s12033-020-00269-5
64. Qin Y, Li L, Luo E, Hou J, Yan G, Wang D, et al. Role of m6A RNA methylation in cardiovascular disease (Review). Int J Mol Med. (2020) 46:1958–72. doi: 10.3892/ijmm.2020.4746
65. Paramasivam A, Priyadharsini JV. m6A RNA methylation in heart development, regeneration and disease. Hypertens Res. (2021) 44:1236–7. doi: 10.1038/s41440-021-00696-0
66. Huang X, Lv D, Yang X, Li M, Zhang H. m6A RNA methylation regulators could contribute to the occurrence of chronic obstructive pulmonary disease. J Cell Mol Med. (2020) 24:12706–15. doi: 10.1111/jcmm.15848
67. Han M, Liu Z, Xu Y, Liu X, Wang D, Li F, et al. Abnormality of m6A mRNA methylation is involved in Alzheimer's disease. Front Neurosci. (2020) 14:98. doi: 10.3389/fnins.2020.00098
68. Wang T, Kong S, Tao M, Ju S. The potential role of RNA N6-methyladenosine in Cancer progression. Mol Cancer. (2020) 19:88. doi: 10.1186/s12943-020-01204-7
69. Zhang B, Jiang H, Dong Z, Sun A, Ge J. The critical roles of m6A modification in metabolic abnormality and cardiovascular diseases. Genes Dis. (2020) 8:746–58. doi: 10.1016/j.gendis.2020.07.011
70. Sun T, Wu R, Ming L. The role of m6A RNA methylation in cancer. Biomed Pharmacother. (2019) 112:108613. doi: 10.1016/j.biopha.2019.108613
71. Lee JH, Wang R, Xiong F, Krakowiak J, Liao Z, Nguyen PT, et al. Enhancer RNA m6A methylation facilitates transcriptional condensate formation and gene activation. Mol Cell. (2021) 81:3368–85. doi: 10.1016/j.molcel.2021.07.024
72. Huang XT Li JH, Zhu XX, Huang CS, Gao ZX, Xu QC, et al. HNRNPC impedes m6A-dependent anti-metastatic alternative splicing events in pancreatic ductal adenocarcinoma. Cancer Lett. (2021) 518:196–206. doi: 10.1016/j.canlet.2021.07.016
73. Franz IW, Tönnesmann U, Behr U, Ketelhut R. Regression of left ventricular hypertrophy during combined atenolol and nifedipine treatment. Drugs. (1988) 35 Suppl 4:39–43. doi: 10.2165/00003495-198800354-00010
74. Xiong X, Hou L, Park YP, Molinie B, GTEx Consortium, Gregory RI, et al. Genetic drivers of m6A methylation in human brain, lung, heart and muscle. Nat Genet. (2021) 53:1156–65. doi: 10.1038/s41588-021-00890-3
75. Wang X, Lu Z, Gomez A, Hon GC, Yue Y, Han D, et al. N6-methyladenosine-dependent regulation of messenger RNA stability. Nature. (2014) 505:117–20. doi: 10.1038/nature12730
76. Tanabe A, Tanikawa K, Tsunetomi M, Takai K, Ikeda H, Konno J, et al. RNA helicase YTHDC2 promotes cancer metastasis via the enhancement of the efficiency by which HIF-1α mRNA is translated. Cancer Lett. (2016) 376:34–42. doi: 10.1016/j.canlet.2016.02.022
77. Chen SM Li YG, Zhang HX, Zhang GH, Long JR, Tan CJ, et al. Hypoxia-inducible factor-1alpha induces the coronary collaterals for coronary artery disease. Coron Artery Dis. (2008) 19:173–9. doi: 10.1097/MCA.0b013e3282fa4b2c
78. Seo MY, Lee SH, Hong SD, Chung SK, Kim HY. Hypoxemia during sleep and the progression of coronary artery calcium. Cardiovasc Toxicol. (2021) 21:42–8. doi: 10.1007/s12012-020-09593-3
79. Shi H, Wang X, Lu Z, Zhao BS, Ma H, Hsu PJ, et al. YTHDF3 facilitates translation and decay of N6-methyladenosine-modified RNA. Cell Res. (2017) 27:315–28. doi: 10.1038/cr.2017.15
80. Li A, Chen YS, Ping XL, Yang X, Xiao W, Yang Y, et al. Cytoplasmic m6A reader YTHDF3 promotes mRNA translation. Cell Res. (2017) 27:444–7. doi: 10.1038/cr.2017.10
81. Wen J, Lv R, Ma H, Shen H, He C, Wang J, et al. Zc3h13 regulates nuclear RNA m6A methylation and mouse embryonic stem cell self-renewal. Mol Cell. (2018) 69:1028–38. doi: 10.1016/j.molcel.2018.02.015
82. Marzano AV, Raimondo MG, Berti E, Meroni PL, Ingegnoli F. Cutaneous manifestations of ANCA-associated small vessels vasculitis. Clin Rev Allergy Immunol. (2017) 53:428–38. doi: 10.1007/s12016-017-8616-5
83. Garshick MS, Ward NL, Krueger JG, Berger JS. Cardiovascular risk in patients with psoriasis: JACC review topic of the week. J Am Coll Cardiol. (2021) 77:1670–80. doi: 10.1016/j.jacc.2021.02.009
84. Jackson B, Tilli CM, Hardman MJ, Avilion AA, MacLeod MC, Ashcroft GS, et al. Late cornified envelope family in differentiating epithelia–response to calcium and ultraviolet irradiation. J Invest Dermatol. (2005) 124:1062–70. doi: 10.1111/j.0022-202X.2005.23699.x
85. Yi D, Wang R, Shi X, Xu L, Yilihamu Y, Sang J. METTL14 promotes the migration and invasion of breast cancer cells by modulating N6-methyladenosine and hsa-miR-146a-5p expression. Oncol Rep. (2020) 43:1375–86. doi: 10.3892/or.2020.7515
86. Mo L, Zeng Z, Deng R, Li Z, Sun J, Hu N, et al. Hepatitis A virus-induced hsa-miR-146a-5p attenuates IFN-β signaling by targeting adaptor protein TRAF6. Arch Virol. (2021) 166:789–99. doi: 10.1007/s00705-021-04952-z
87. Agiannitopoulos K, Samara P, Papadopoulou M, Efthymiadou A, Papadopoulou E, Tsaousis GN, et al. miRNA polymorphisms and risk of premature coronary artery disease. Hellenic J Cardiol. (2021) 62:278–84. doi: 10.1016/j.hjc.2020.01.005
88. Ali Sheikh MS, Alduraywish A, Almaeen A, Alruwali M, Alruwaili R, Alomair BM, et al. Therapeutic value of miRNAs in coronary artery disease. Oxid Med Cell Longev. (2021) 2021:8853748. doi: 10.1155/2021/8853748
89. Zhang H, Ji N, Gong X, Ni S, Wang Y. NEAT1/miR-140-3p/MAPK1 mediates the viability and survival of coronary endothelial cells and affects coronary atherosclerotic heart disease. Acta Biochim Biophys Sin. (2020) 52:967–74. doi: 10.1093/abbs/gmaa087
90. Karakas M, Schulte C, Appelbaum S, Ojeda F, Lackner KJ, Münzel T, et al. Circulating microRNAs strongly predict cardiovascular death in patients with coronary artery disease-results from the large AtheroGene study. Eur Heart J. (2017) 38:516–23. doi: 10.1093/eurheartj/ehw250
91. Jiang X, Yuan Y, Tang L, Wang J, Liu Q, Zou X, et al. Comprehensive pan-cancer analysis of the prognostic and immunological roles of the METTL3/lncRNA-SNHG1/miRNA-140-3p/UBE2C Axis. Front Cell Dev Biol. (2021) 9:765772. doi: 10.3389/fcell.2021.765772
92. Kobayashi M, Yamamoto M. Regulation of GATA1 gene expression. J Biochem. (2007) 142:1–10. doi: 10.1093/jb/mvm122
93. Panferova A, Gaskova M, Nikitin E, Baryshev P, Timofeeva N, Kazakova A, et al. GATA1 mutation analysis and molecular landscape characterization in acute myeloid leukemia with trisomy 21 in pediatric patients. Int J Lab Hematol. (2021) 43:713–23. doi: 10.1111/ijlh.13451
94. Fioranelli M, Bottaccioli AG, Bottaccioli F, Bianchi M, Rovesti M, Roccia MG. Stress and inflammation in coronary artery disease: a review psychoneuroendocrineimmunology-based. Front Immunol. (2018) 9:2031. doi: 10.3389/fimmu.2018.02031
95. McComb S, Thiriot A, Akache B, Krishnan L, Stark F. Introduction to the immune system. Methods Mol Biol. (2019) 2024:1–24. doi: 10.1007/978-1-4939-9597-4_1
96. Liu C, Yang Z, Li R, Wu Y, Chi M, Gao S, et al. Potential roles of N6-methyladenosine (m6A) in immune cells. J Transl Med. (2021) 19:251. doi: 10.1186/s12967-021-02918-y
97. Zhao H, Xu Y, Xie Y, Zhang L, Gao M, Li S, et al. m6A regulators is differently expressed and correlated with immune response of esophageal cancer. Front Cell Dev Biol. (2021) 9:650023. doi: 10.3389/fcell.2021.650023
98. Nishimura S, Manabe I, Nagasaki M, Eto K, Yamashita H, Ohsugi M, et al. CD8+ effector T cells contribute to macrophage recruitment and adipose tissue inflammation in obesity. Nat Med. (2009) 15:914–20. doi: 10.1038/nm.1964
99. Kiran S, Kumar V, Murphy EA, Enos RT, Singh UP. High fat diet-induced CD8+ T cells in adipose tissue mediate macrophages to sustain low-grade chronic inflammation. Front Immunol. (2021) 12:680944. doi: 10.3389/fimmu.2021.680944
100. Cosmi L, Maggi L, Santarlasci V, Liotta F, Annunziato F. T helper cells plasticity in inflammation. Cytometry A. (2014) 85:36–42. doi: 10.1002/cyto.a.22348
Keywords: m6A RNA methylation, immune microenvironment, LASSO regression, unsupervised clustering, coronary heart disease
Citation: Li Z, Song Y, Wang M, Shen R, Qin K, Zhang Y, Jiang T and Chi Y (2022) m6A regulator-mediated RNA methylation modification patterns are involved in immune microenvironment regulation of coronary heart disease. Front. Cardiovasc. Med. 9:905737. doi: 10.3389/fcvm.2022.905737
Received: 27 March 2022; Accepted: 03 August 2022;
Published: 25 August 2022.
Edited by:
Chayakrit Krittanawong, Grossman School of Medicine, New York University, United StatesReviewed by:
Songwei Feng, Southeast University, ChinaCopyright © 2022 Li, Song, Wang, Shen, Qin, Zhang, Jiang and Chi. This is an open-access article distributed under the terms of the Creative Commons Attribution License (CC BY). The use, distribution or reproduction in other forums is permitted, provided the original author(s) and the copyright owner(s) are credited and that the original publication in this journal is cited, in accordance with accepted academic practice. No use, distribution or reproduction is permitted which does not comply with these terms.
*Correspondence: Ting Jiang, amlhbmd0aW5nMjAwM0AxNjMuY29t; Yifan Chi, MjAxNzAyMjA4N0BxZHUuZWR1LmNu
Disclaimer: All claims expressed in this article are solely those of the authors and do not necessarily represent those of their affiliated organizations, or those of the publisher, the editors and the reviewers. Any product that may be evaluated in this article or claim that may be made by its manufacturer is not guaranteed or endorsed by the publisher.
Research integrity at Frontiers
Learn more about the work of our research integrity team to safeguard the quality of each article we publish.