
94% of researchers rate our articles as excellent or good
Learn more about the work of our research integrity team to safeguard the quality of each article we publish.
Find out more
ORIGINAL RESEARCH article
Front. Cardiovasc. Med., 14 July 2022
Sec. General Cardiovascular Medicine
Volume 9 - 2022 | https://doi.org/10.3389/fcvm.2022.895917
This article is part of the Research TopicPeripheral Artery Disease: Identification, management and prognosis in diverse populationsView all 4 articles
 Marcelino Bermúdez-López1
 Manuel Martí-Antonio1
 Eva Castro-Boqué1María del Mar Bretones1Cristina Farràs2,3Gerard Torres4,5
 Reinald Pamplona6
 Albert Lecube7,8
 Dídac Mauricio8,9
 José Manuel Valdivielso1*Elvira Fernández1 on behalf of the ILERVAS Project Collaborators
Background: Although European guidelines recommend vascular ultrasound for the assessment of cardiovascular risk in low-to-moderate risk individuals, no algorithm properly identifies patients who could benefit from it. The aim of this study is to develop a sex-specific algorithm to identify those patients, especially women who are usually underdiagnosed.
Methods: Clinical, anthropometrical, and biochemical data were combined with a 12-territory vascular ultrasound to predict severe atheromatosis (SA: ≥ 3 territories with plaque). A Personalized Algorithm for Severe Atheromatosis Prediction (PASAP-ILERVAS) was obtained by machine learning. Models were trained in the ILERVAS cohort (n = 8,330; 51% women) and validated in the control subpopulation of the NEFRONA cohort (n = 559; 47% women). Performance was compared to the Systematic COronary Risk Evaluation (SCORE) model.
Results: The PASAP-ILERVAS is a sex-specific, easy-to-interpret predictive model that stratifies individuals according to their risk of SA in low, intermediate, or high risk. New clinical predictors beyond traditional factors were uncovered. In low- and high-risk (L&H-risk) men, the net reclassification index (NRI) was 0.044 (95% CI: 0.020–0.068), and the integrated discrimination index (IDI) was 0.038 (95% CI: 0.029–0.048) compared to the SCORE. In L&H-risk women, PASAP-ILERVAS showed a significant increase in the area under the curve (AUC, 0.074 (95% CI: 0.062–0.087), p-value: < 0.001), an NRI of 0.193 (95% CI: 0.162–0.224), and an IDI of 0.119 (95% CI: 0.109–0.129).
Conclusion: The PASAP-ILERVAS improves SA prediction, especially in women. Thus, it could reduce the number of unnecessary complementary explorations selecting patients for a further imaging study within the intermediate risk group, increasing cost-effectiveness and optimizing health resources.
Clinical Trial Registration: [www.ClinicalTrials.gov], identifier [NCT03228459].
Atherosclerotic cardiovascular disease (ASCVD) is still the main preventable cause of cardiovascular mortality and disability. ASCVD is a latent and progressive condition in which atheroma plaques develop in the artery wall, and it is usually widely extended by the time symptoms, typically a cardiovascular event, occur. Current European guidelines on cardiovascular prevention recommend initial assessment and stratification of the risk of ASCVD based on a probabilistic tool that includes traditional risk factors, followed by therapeutic intervention when necessary (1). However, these traditional risk scores underestimate individual risk in several circumstances, such as women, youths, and individuals with a low-to-moderate ASCVD risk (2, 3). Indeed, the number of cardiovascular events in individuals with a low-to-moderate risk is unacceptably high (4) and, although ASCVD is often thought to be a disease with a higher prevalence in men, the annual cardiovascular mortality rate has remained greater in women (5). Despite these numbers, women have been underrepresented in CVD-related clinical trials, and data are not often stratified by sex, limiting their interpretation. Indeed, better individualized prediction algorithms are urgently required, especially in individuals with moderate risk and in women.
One of the available tools to improve prediction algorithms is the use of non-invasive imaging techniques. Those techniques can detect the presence, estimate the extent, and evaluate the clinical consequences of ASCVD. Detection of subclinical atheromatosis in the arteries by vascular ultrasound is a reliable method to predict future coronary events (6), and it improves cardiovascular risk assessment in asymptomatic individuals (7). The most common method of estimating ASCVD burden has been carotid ultrasound. Carotid artery atheromatosis has a well-demonstrated role in the incidence of cerebrovascular and cardiovascular events (8). Atherosclerotic lower extremity peripheral artery disease is increasingly recognized as an important cause of cardiovascular morbidity and mortality (9). Nevertheless, femoral artery atheromatosis assessment has long been underexplored, although femoral atheroma plaques show the strongest association with cardiovascular risk factors, and a higher sensitivity to predict calcified coronary disease (10). Furthermore, extensive vascular territory assessment has been shown to increase its predictive value in cardiovascular mortality (11). However, and even though the 2019 European guideline recommends vascular ultrasounds in individuals with a low-to-moderate ASCVD risk (1), its implementation is still limited possibly because it is not easy to select candidates who could benefit from a comprehensive imaging study. Thus, a new algorithm that helps clinicians to identify those patients is highly recommended, as it will be cost-effective and will optimize health resources allocation.
Machine learning (ML) technologies can improve the diagnosis of diseases developing risk prediction algorithms to guide clinical decisions (12). Although several ML algorithms have been described to predict cardiovascular events (13–17), few predict the presence and extent of subclinical atheromatosis (18), and sex-specific algorithms are not available. Therefore, we developed and validated a personalized model to predict the probability of severe atheromatosis (SA; the PASAP-ILERVAS) based on classification trees (19), integrating clinical data, anthropometrical parameters, and routine, easy-to-obtain, affordable biochemical parameters in an asymptomatic, middle-aged population with a low-to-moderate cardiovascular risk. The new algorithm could help clinicians to select patients who could benefit from further vascular ultrasound examination and reduce the number of unnecessary complementary explorations.
It is an ongoing randomized, interventional, longitudinal clinical trial in a low-to-moderate cardiovascular risk population of the North-East region of Spain (ClinicalTrials.gov identifier: NCT03228459). The study was originally designed with two arms: (i) intervention group, thereafter called Mobile Unit follow-up group, and (ii) no intervention group, thereafter called Electronic Medical Record follow-up group. The intervention was the generation of a report sent to the primary care physician, including vascular ultrasound examination in carotid and femoral arteries assessing 12 territories, combined with clinical, anthropometric, lifestyle, and biochemical parameters. The study population was randomly allocated to the groups by stratified sampling from the electronic clinical history database of primary care. The no intervention group will be used to compare the impact of the intervention on cardiovascular morbidity and mortality. Thus, this group was not used for the present work. The intervention group was formed by 8,330 participants who were enrolled from January 2015 to December 2018 from 32 basic health areas of the province of Lleida (Catalonia, Spain). The study was designed to (i) assess the prevalence, vascular distribution, severity, and progression of subclinical atheromatosis in a middle-aged population with a low-to-moderate cardiovascular risk; (ii) uncover potential new factors predicting severe; and (iii) assess the impact of subclinical atheromatosis detection on the incidence of cardiovascular events during a 10-year follow-up period. The inclusion criteria were: 50–70-year-old women and 45–65-year-old men with at least one of the following CVD risk factors: hypertension, dyslipidemia, obesity (defined as body mass index, BMI ≥ 30), smoking, and/or first-degree relative who developed premature CVD (with a threshold at age 55 years for men or 65 years for women). The exclusion criteria were clinical history of diabetes, chronic kidney disease, cardiovascular pathology (angina, myocardial infarction, cerebral vascular accident, peripheral arterial disease, intestinal, or other ischemia), history of arterial surgery, active neoplasia, less than 18 months of expected life, long-term home care, and/or institutionalized population. The Ethics Committee of the Hospital Arnau de Vilanova (Lleida, Spain) approved the protocol (CEIC-1410). All patients signed informed consent. The study was conducted according to the principles of the Declaration of Helsinki. A more-detailed explanation of the study has been previously published (3).
It is an observational, multicenter, prospective study. For the present study, 559 healthy asymptomatic individuals with normal kidney function were selected from the NEFRONA cohort. Subjects were enrolled in Primary Care centers from October 2010 to June 2012. It was designed to evaluate the prevalence and natural history of subclinical atheromatosis in chronic kidney disease patients, and the contribution of vascular ultrasound for a more precise cardiovascular risk assessment. The NEFRONA cohort included a control group of individuals with normal kidney function, which is the subgroup used for the validation. Inclusion criteria were asymptomatic individuals between 18 and 74 years of age with a glomerular filtration rate (GFR) over 60 ml/min/1.73 m2. Exclusion criteria were active infections, pregnancy, active neoplasia, life expectancy shorter than 12 months, previous cardiovascular event, carotid surgery, or any organ transplantation. The Ethics Committee of the Hospital Arnau de Vilanova (Lleida, Spain) approved the protocol. All patients signed informed consent. The study was conducted according to the principles of the Declaration of Helsinki. A more-detailed explanation of the study has been previously published (20).
Sociodemographic variables and clinical history of cardiovascular risk factors were collected from clinical records. In contrast, anthropometric data, smoking habit, and blood samples were collected at the moment of vascular examination.
The same protocols were used in both cohorts. Weight and height were measured according to guidelines to obtain BMI. Waist perimeter was measured with a non-stretchable tape with a precision of 0.1 cm to assess abdominal adiposity, which was defined as a waist perimeter ≥ 88 cm in women and ≥ 102 cm in men. Blood pressure was determined in triplicate, after 5 min rest using an automated device (Omron M6 Comfort, Omron Healthcare, Japan) at 2-min intervals. The mean of the three recordings was calculated.
In the ILERVAS cohort, a fasting dried blood spot sample was obtained by a fingertip puncture according to standard protocols. Creatinine, uric acid, and total cholesterol levels were assessed with the REFLOTRON® Plus system (Roche Diagnostics, Germany). It is a validated clinical chemistry system with highly correlated results to well-standardized laboratory methods (21–23). The glycosylated hemoglobin test was performed using a point-of-care instrument (Cobas B101®, Roche Diagnostics, Germany) that meets the generally accepted performance criteria for its measurement (24). In the NEFRONA cohort, biochemical parameters were obtained from a routine fasting blood test taken no more than 3 months apart from vascular examination. GFR was estimated according to international guidelines using the CKD-EPI equation in both cohorts (25).
Vascular ultrasound was performed by nurses specialized in vascular imaging. Standardized scanning and reading protocols were followed to decrease interoperator variability and type 2 errors. Intra-observer reliability assessment showed a k-coefficient of one (two repeated measurements; 1,007 observations). Overall inter-rater reliability for all operators showed a k-coefficient of 0.915 (95% CI: 0.892–0.944; 959 observations). Readers were unaware of the patients’ clinical histories. The VIVID i BT09 model ultrasound system (GE Healthcare) equipped with a 12L-RS linear probe (6–13 MHz), and a pulsed Doppler ultrasound was used to assess hemodynamic repercussions. In the ILERVAS cohort, arterial ultrasound was performed in 12 territories, both carotid (common, bifurcation, internal, and external) and femoral (common and superficial) arteries. In the NEFRONA study, 10 territories were explored, both carotid (common, bifurcation, and internal) and femoral (common and superficial) arteries (3, 20). Subclinical atheromatosis was defined as the presence of any plaque in the explored areas. According to Mannheim consensus, an atheroma plaque was defined as a focal encroachment into the lumen of the artery ≥ 1.5 mm (26). SA was defined as ≥ 3 territories with atheroma plaque.
Parameters that require a high degree of specialization or technical resources were ruled out. Thus, a set of easy-to-obtain and affordable variables were selected. The outcome was SA, defined as ≥ 3 territories with atheroma plaque out of 12. The explanatory variables were age, sex, clinical data (history of hypertension and dyslipidemia and smoking habit), anthropometrical data [systolic blood pressure (SBP), diastolic blood pressure (DBP), body mass index (BMI), abdominal adiposity, and waist-to-height ratio], and biochemical parameters (creatinine, GFR, uric acid, and total cholesterol).
The clinical characteristics of the ILERVAS cohort (discovery cohort) and NEFRONA cohort (external validation cohort) were described as frequencies for categorical variables, and means and standard deviation (SD) for quantitative variables. Differences between SA and non-SA were assessed by several univariate logistic regressions for each clinical predictor adjusted by age and stratified by sex. The p-value of the likelihood-ratio test and odds ratio (OR) values with 95% confidence intervals (95% CI) were represented with the forestplot package (27). For each numerical predictor, adjusted OR per 1-SD higher parameter measure was estimated.
The descriptive analyzed revealed that the prevalence of SA was lower than non-SA in the discovery cohort. Thus, a Random Over-Sampling Example (ROSE) function (28) was used to increase the sample size of individuals with SA separately for men and women. Individuals who presented missing data (Supplementary Table 1) were excluded prior to sample balancing. This new balanced data set was used to train ML models in both sexes.
A Recursive PARTicioning (rpart) classification tree (29) approach was used and plotted with rpart.plot (30). Trees were constructed in the balanced sample stratified by sex as follows: first, the algorithm recursively selected itself the clinical predictors that provide an optimal split in each node based on the generalized Gini index to obtain the maximal impurity reduction. The growth of the tree was controlled by pre-pruning techniques. A minimum of 200 individuals in each node was required to try a split and at least 100 in the terminal nodes. The maximum depth of the final tree was fixed on 6. Second, the resultant tree was trimmed back to minimize overfitting by post-pruning techniques, which select the complexity parameter (CP) that produced the minimum internal three-fold cross-validation error to prune the full tree. The probability of SA and the 95% CI were represented in the terminal nodes with ggplot2 (31). The obtained model was called Personalized Algorithm for Severe Atheromatosis Prediction (PASAP-ILERVAS).
A variable importance score was calculated using the improvement measure attributable to each predictor in its role as splitter, plus the goodness for all splits in which it was a surrogate. The values of importance were scaled up to sum 100%.
In order to agglutinate terminal nodes into groups with similar risk, the probabilities of SA were calibrated using a histogram-transformed method using the CalibratR (32). First, the original probabilities with a maximum of 10 bins were plotted. Then, the optimal number of partitions to maximize the sensitivity was tested. The calibration process evidenced three risk groups, classified as low-, intermediate-, and high-risk nodes.
The Youden index (33) was computed to identify the cut-off probability to distinguish between non-SA and SA in the terminal nodes. Terminal nodes with a lower or equal probability to the cut-off were considered as non-SA, whereas terminal nodes with a higher probability were classified as SA.
The area under the curve (AUC) and the recommended metrics derived from the confusion matrix were used to evaluate model performance (34). A report from the European Society of Cardiology Prevention of CVD Programme is recommended to familiarize the reader with the risk prediction tools in cardiovascular disease prevention and performance metrics (35).
The PASAP-ILERVAS model was externally validated in a subpopulation of the NEFRONA study and performance metrics were also calculated.
A logistic binary model with the Systematic COronary Risk Evaluation (SCORE) model was developed in the discovery balanced sample. The Youden index was computed to identify the cut-off probability to distinguish between non-SA and SA and performance metrics were calculated in L&H-risk individuals.
The increment on AUC, the Net Reclassification Index (NRI), and the Integrated Discrimination Index (IDI) were evaluated to quantify the differences between both models in L&H-risk individuals (36). The SCORE model was considered as reference, and the PASAP-ILERVAS as the new model whose improvement was evaluated (37, 38). The CI for all metrics was performed by bootstrapping (2,000 bootstraps). The comparisons between models were performed by the DeLong test at 95% CI (39). To test the differences between performance metrics [sensitivity, specificity, accuracy, and the positive predictive value (PPV)], a two-sample test for equality of proportions with continuity correction was performed (40).
The workflow of the whole analysis is shown in Figure 1. The clinical characteristics of the ILERVAS cohort stratified by sex is shown in Table 1. The prevalence of SA, defined as ≥ 3 territories with atheroma plaque out of the 12 studied, was 42.6 and 24.4% in men and women, respectively. These patients showed a higher prevalence of clinical history of hypertension and dyslipidemia, and there were fewer non-smokers and more current smokers. The mean age was higher in participants with SA, and the levels of systolic blood pressure, glycosylated hemoglobin, uric acid, and total cholesterol. However, the association of these clinical predictors with SA showed some differences between sexes (Supplementary Figure 1). Age, systolic and diastolic blood pressure, total cholesterol, and being underweight showed a stronger positive association with SA in men than in women (OR: 1.76 vs. 1.51; OR: 1.32 vs. 1.23; OR: 1.17 vs. 1.07; OR: 1.24 vs. 1.13; and OR: 7.02 vs. 3.39, respectively). On the contrary, clinical history of hypertension showed a stronger positive association with SA in women than in men (OR: 1.58 vs. 1.24, respectively). Finally, the levels of glycosylated hemoglobin, uric acid, and clinical history of dyslipidemia showed a similar positive association in both sexes (OR: 1.11 vs. 1.09; OR: 1.10 vs. 1.10; and OR: 1.19 vs. 1.21 in men vs. women, respectively; Supplementary Table 2).
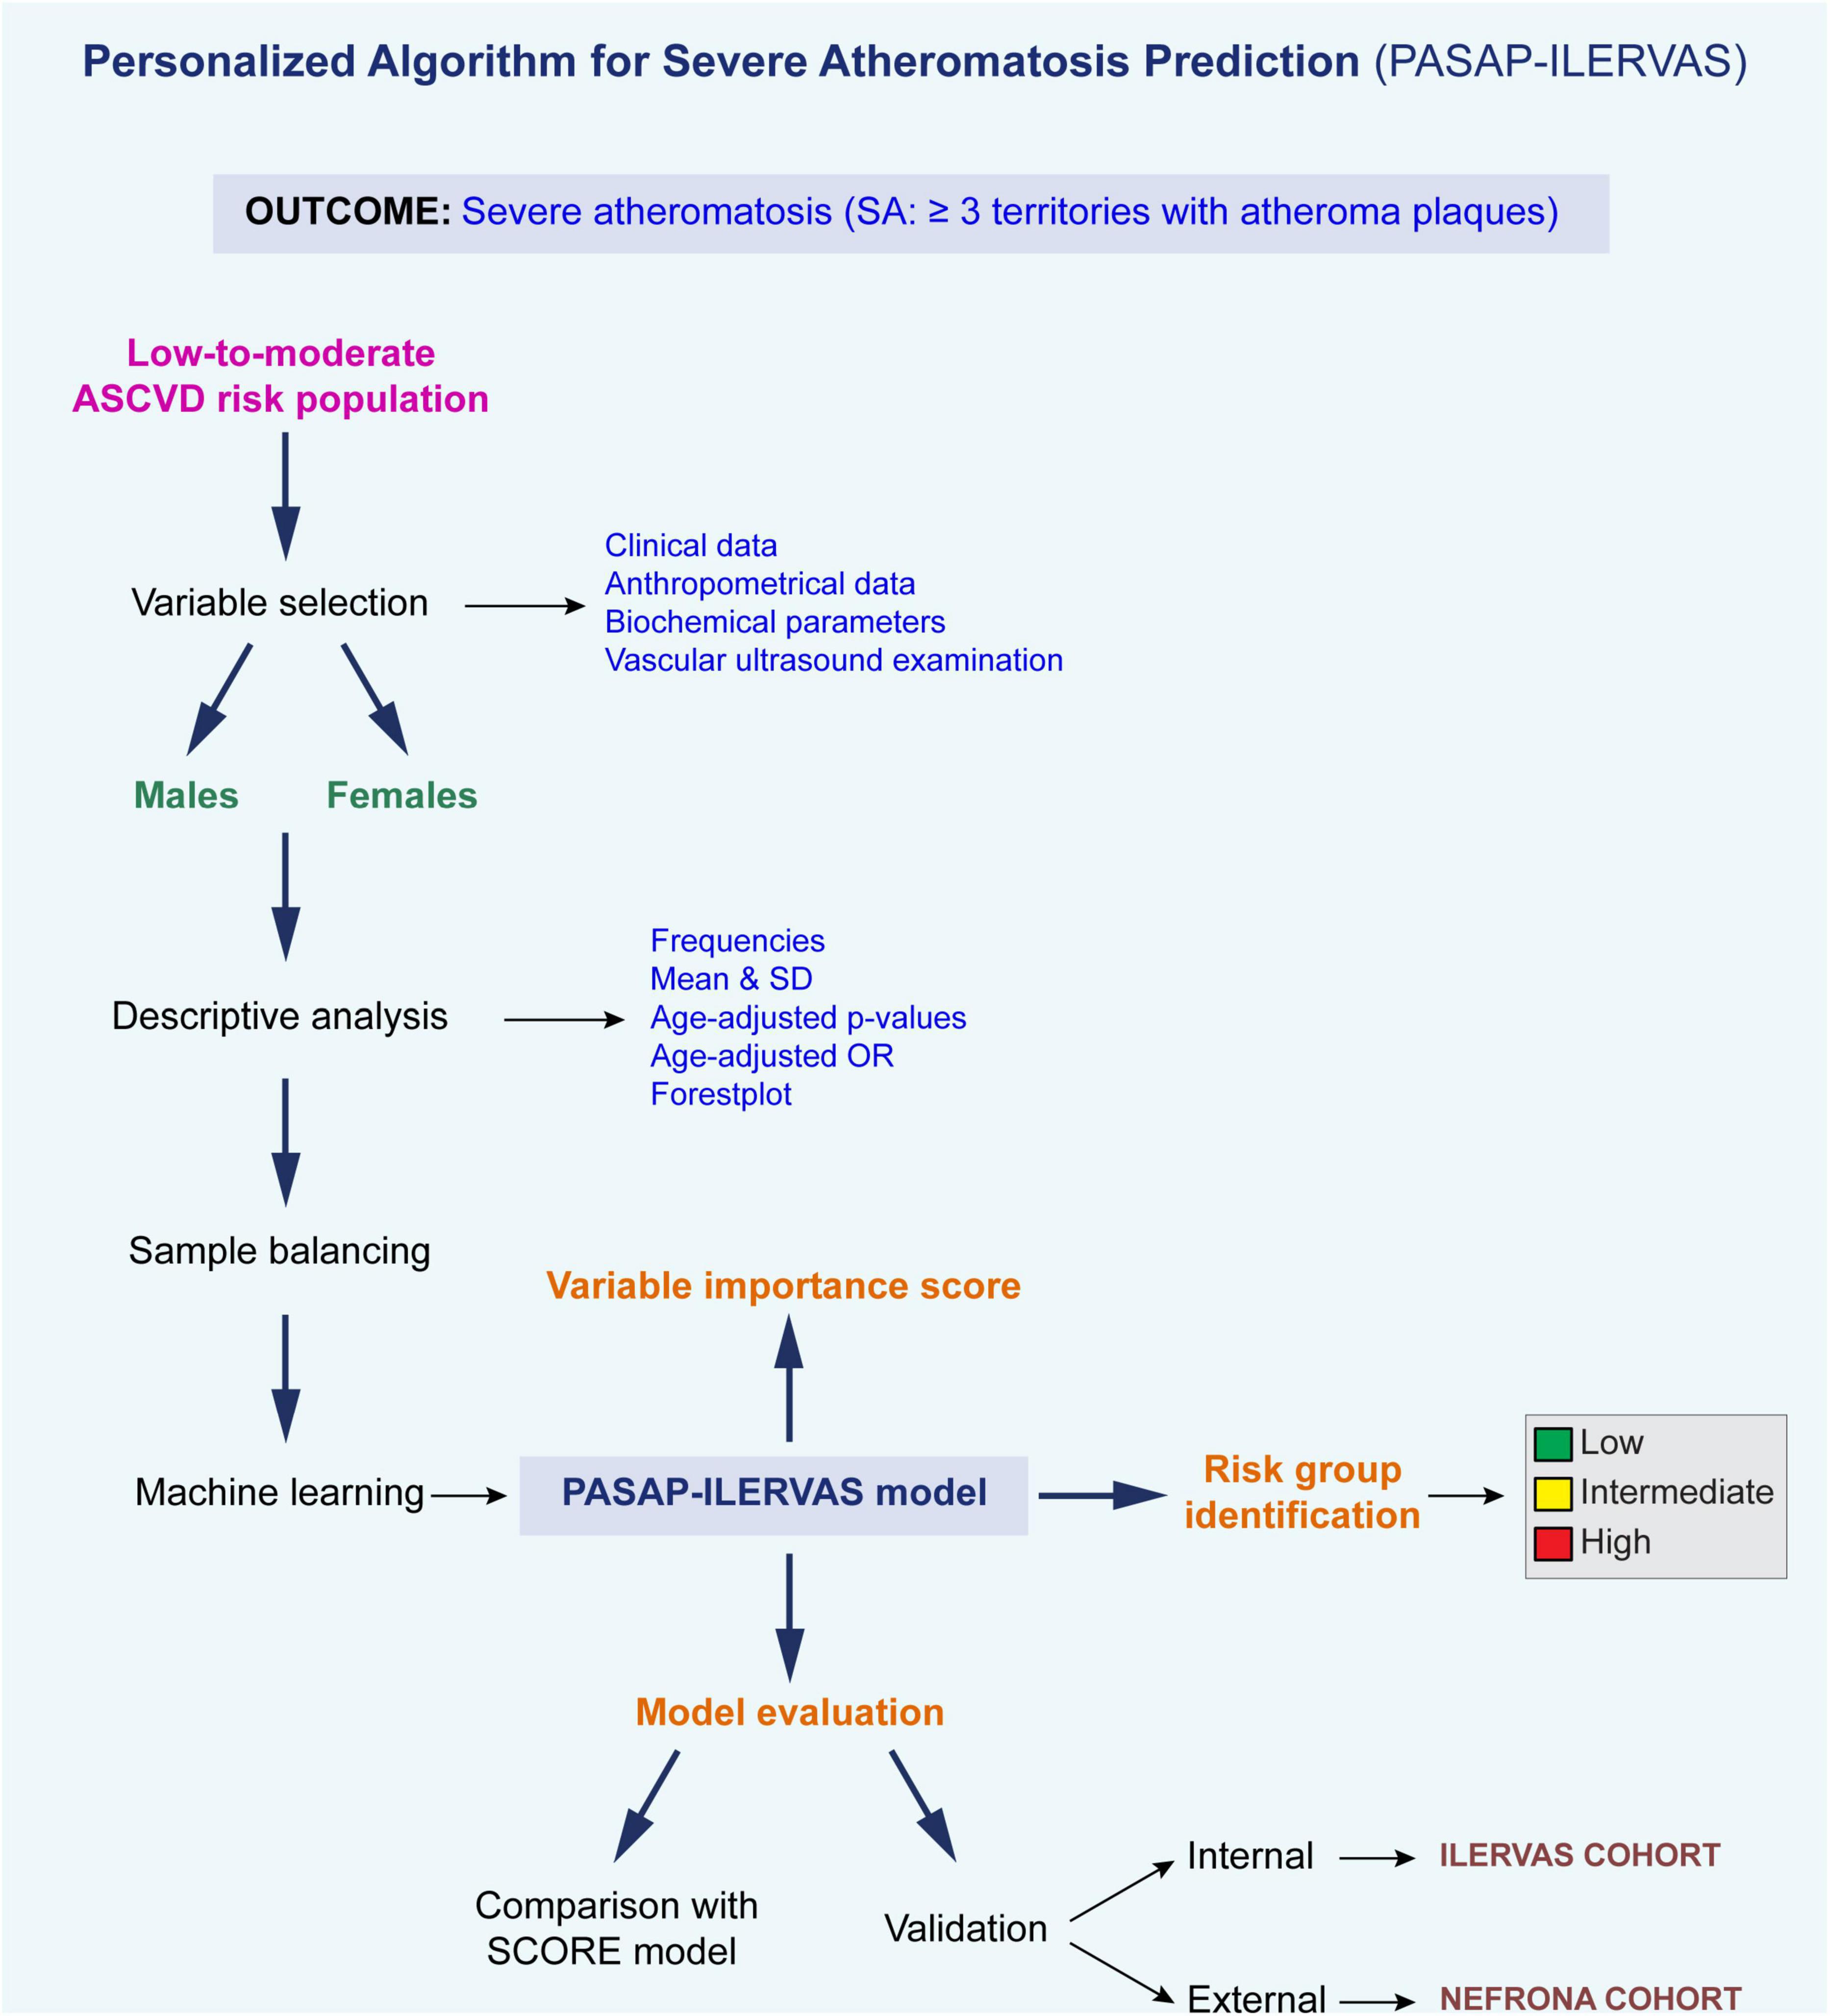
Figure 1. Analysis pipeline. ASCVD, atherosclerotic cardiovascular disease; OR, odds ratio; SD, standard deviation.
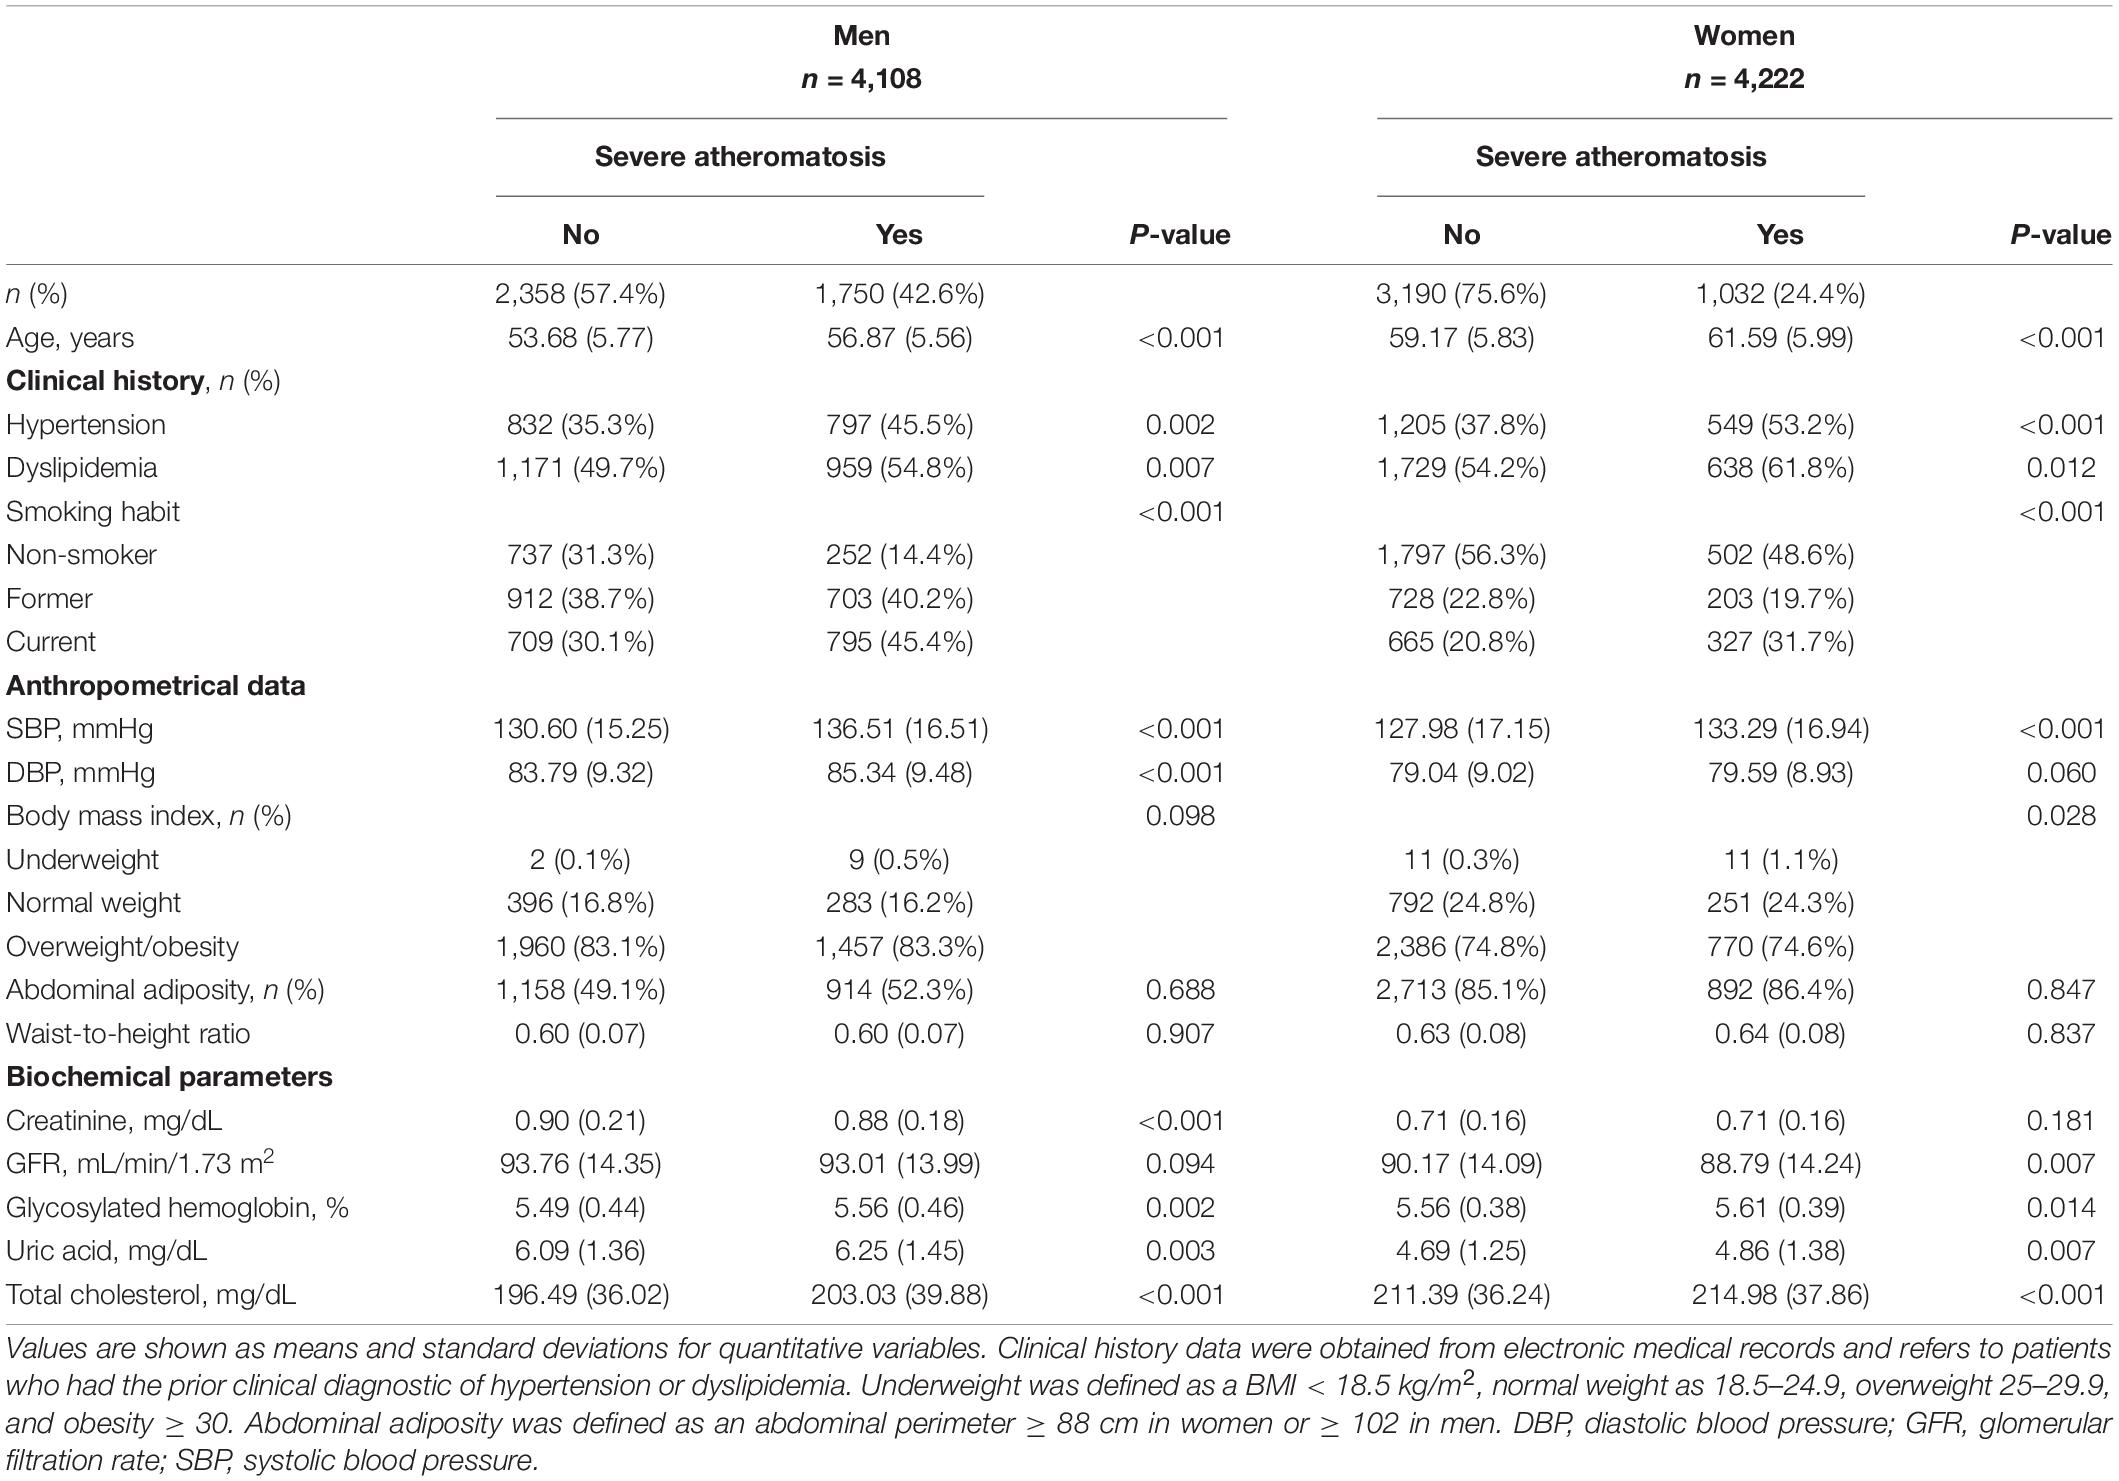
Table 1. Baseline characteristics of the ILERVAS cohort by sex.
Pruning the trees to 13 splits in men and 17 splits in women showed the lowest internal cross-validation error, beyond which tree complexity entailed no additional improvement (Supplementary Figure 2). The structure of the classification tree in men and women in the balanced ILERVAS cohort is shown in Figures 2, 3, respectively. In both genders, patients were first classified by age, followed by the smoking habit. The combination of these two parameters conditioned the clinical threshold of the other predictors, such as systolic blood pressure, total cholesterol, uric acid, GFR, BMI, waist perimeter, and history of dyslipidemia and hypertension.
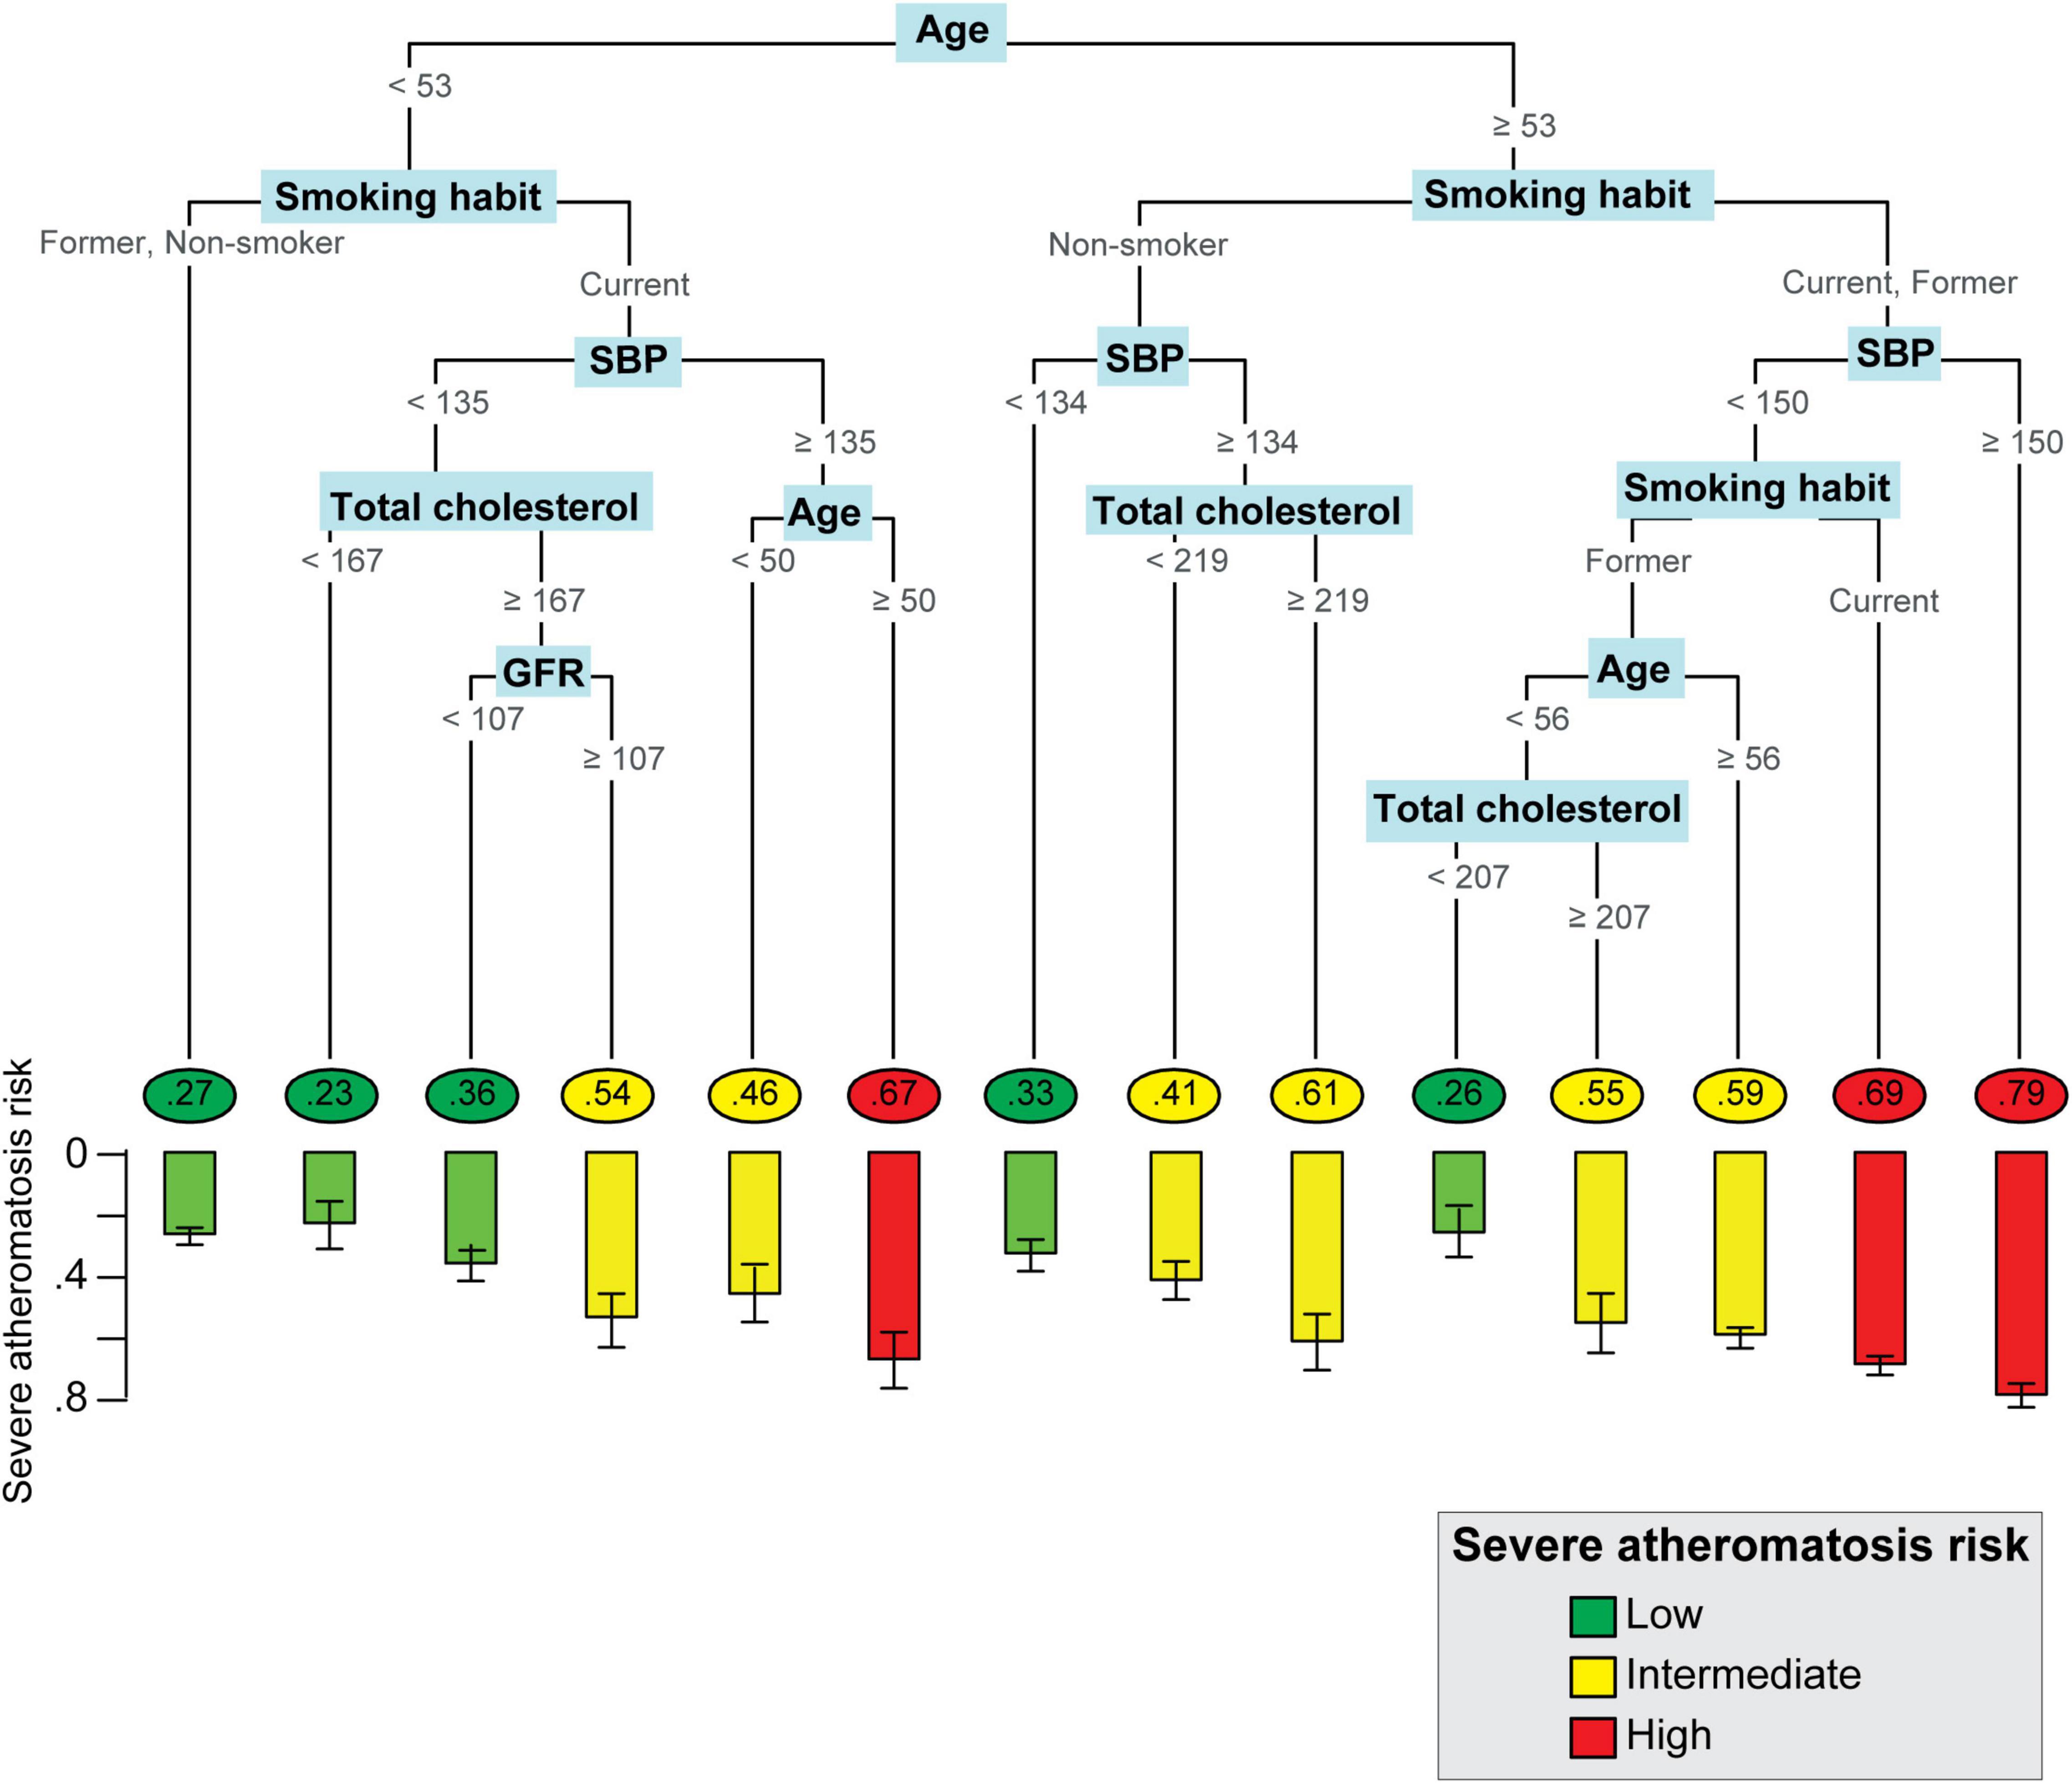
Figure 2. Personalized Algorithm for Severe Atheromatosis Prediction in men. The structure of the classification tree in men is represented. The probability of severe atheromatosis, which corresponds to the proportion of affected patients, is shown inside circles in the final nodes. The barplot offers a clearer visualization of this prevalence with its 95% confidence interval. The colors green, yellow, and red indicate the level of risk (low, intermediate, or high) identified after calibration. The units were as follows: age, year; GFR, ml/min/m2; SBP, mmHg; total cholesterol, mg/dl. GFR, glomerular filtration rate, SBP, systolic blood pressure.
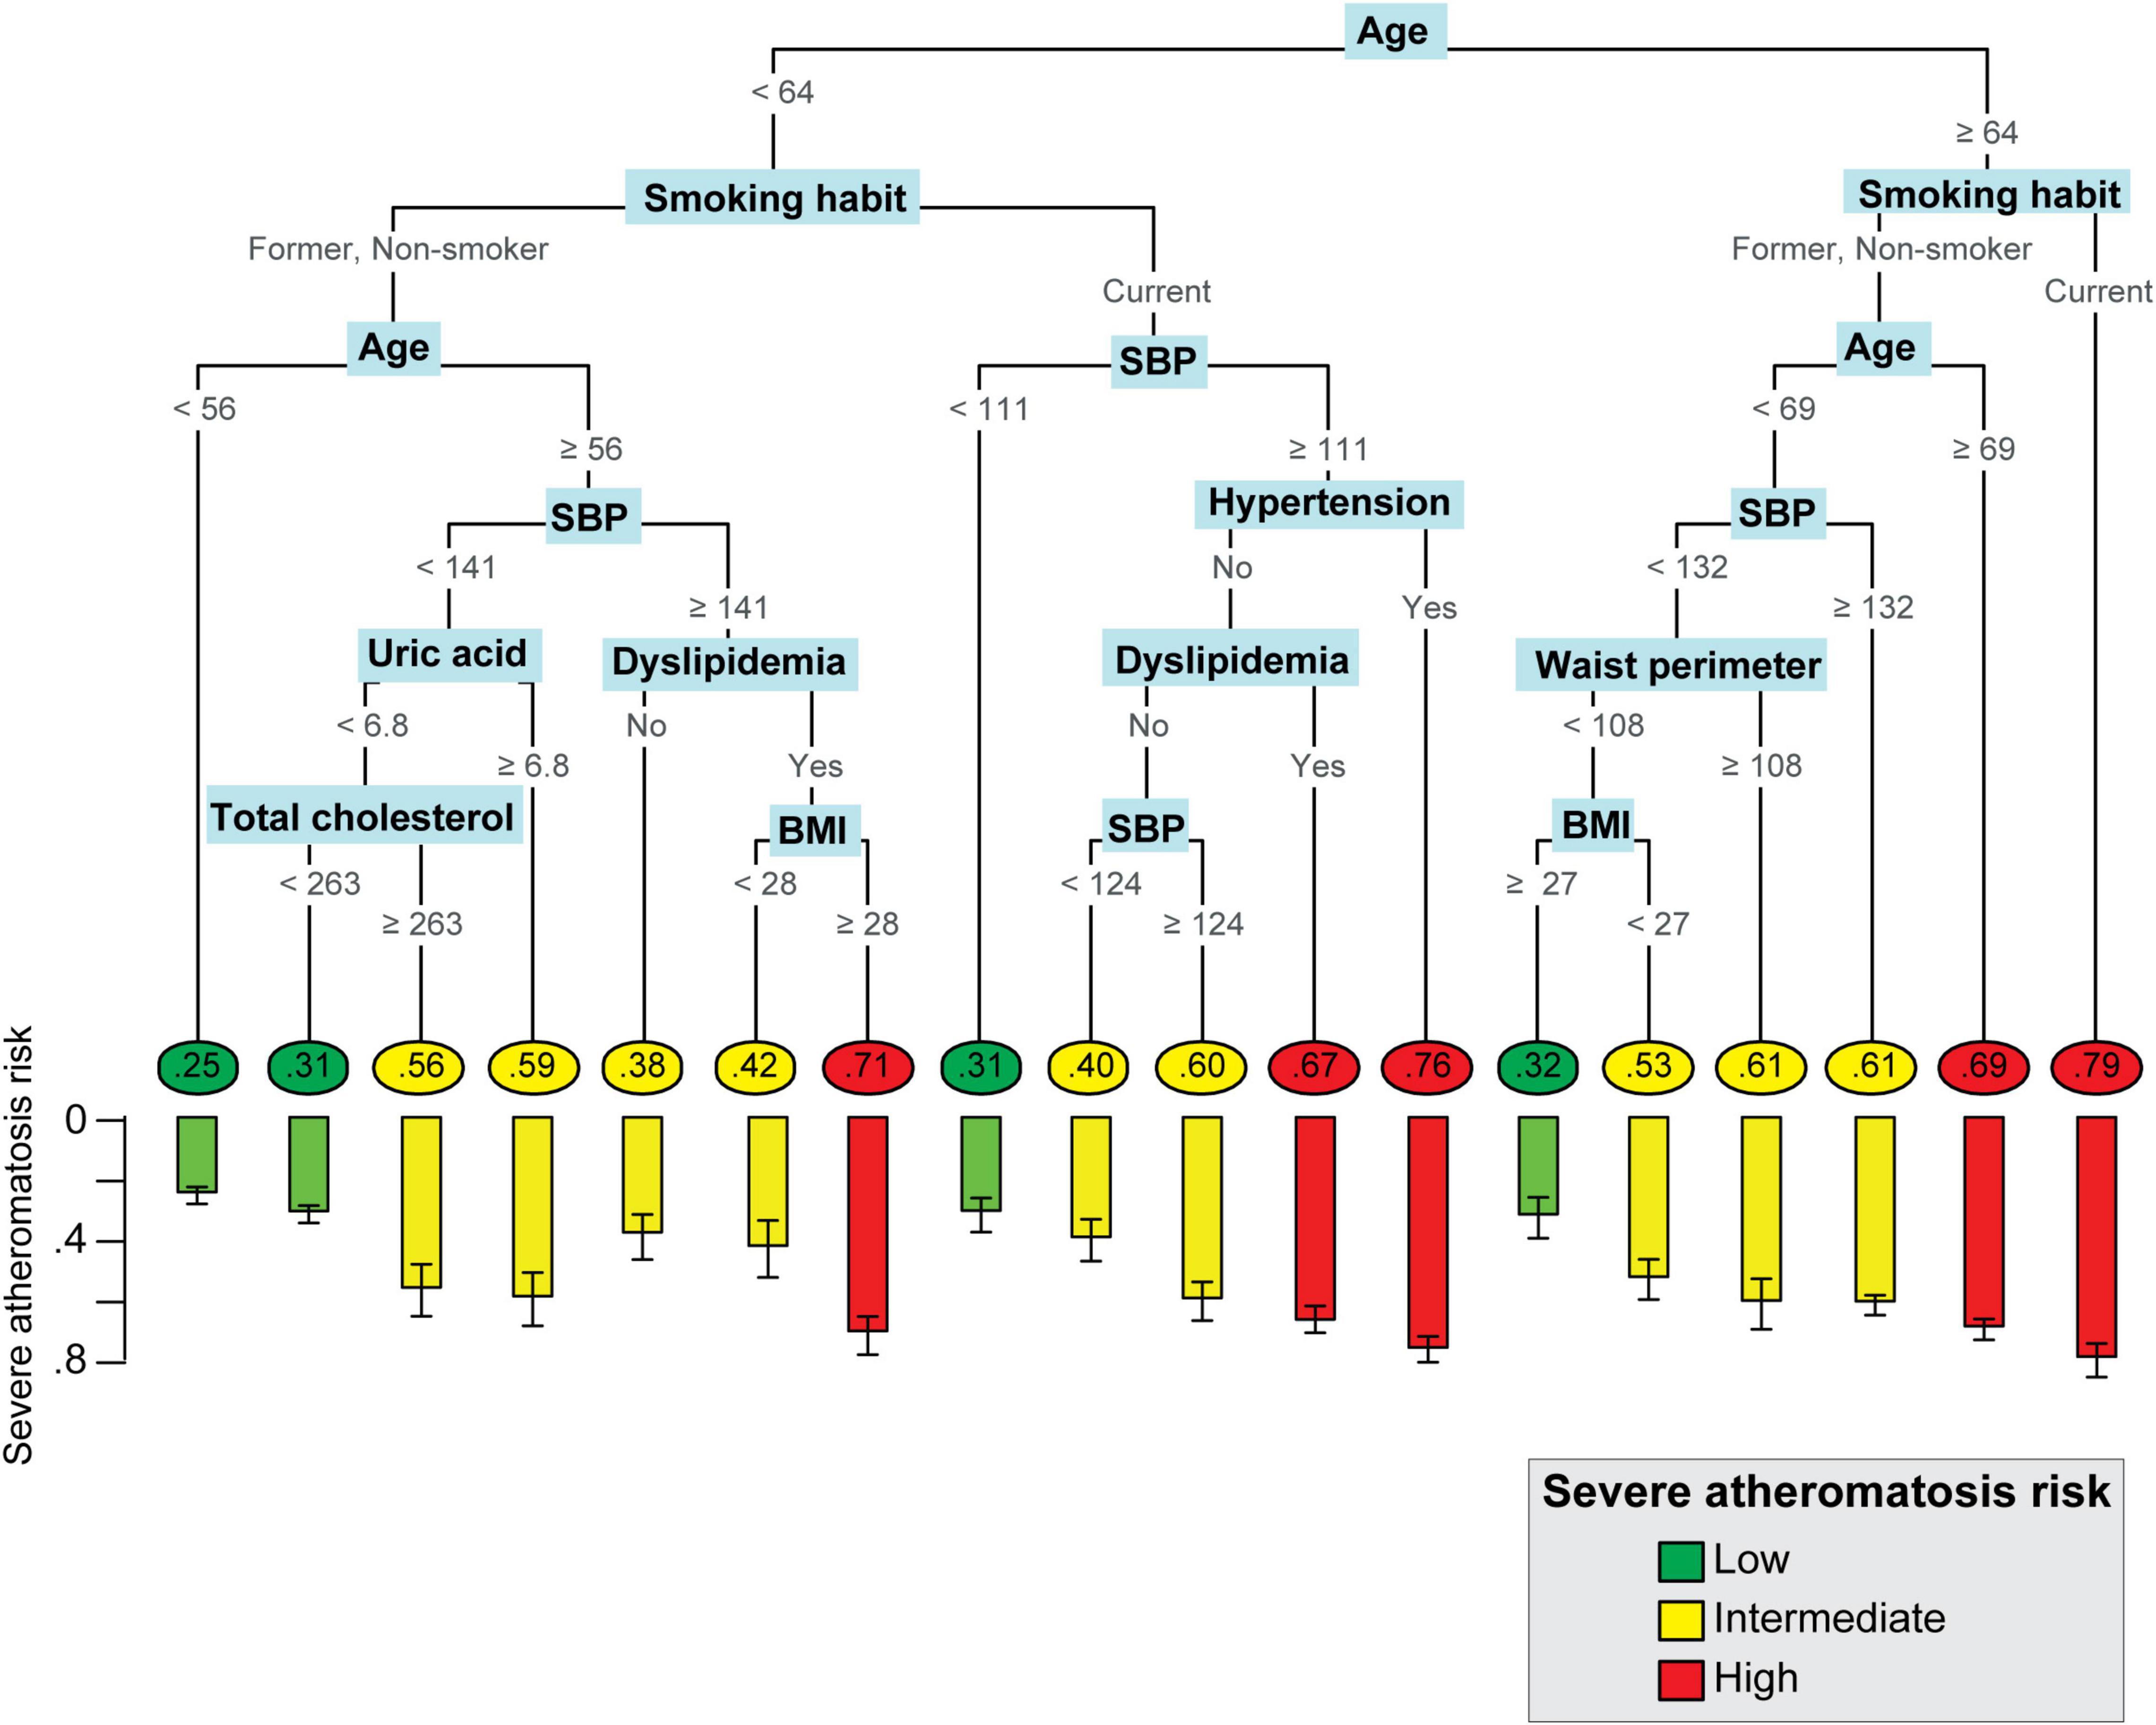
Figure 3. Personalized Algorithm for Severe Atheromatosis Prediction in women. The probability of severe atheromatosis, which corresponds to the proportion of affected patients, was shown inside circles in the final nodes. The barplot offers a clearer visualization of this prevalence with its 95% confidence interval. The colors green, yellow, and red indicate the level of risk (low, intermediate, or high, respectively) identified after calibration. Hypertension and dyslipidemia refer to patients who had prior clinical diagnostic of hypertension or dyslipidemia in their clinical records. The units were as follows: Age: year; BMI: kg/m2; SBP, mmHg; total cholesterol: mg/dL; uric acid: mg/dl; waist perimeter: cm. BMI, body mass index; SBP, systolic blood pressure.
A total number of 14 final nodes were obtained in men and 18 in women. The probability of severe atheromatosis and its 95% CI are shown in each node to improve visualization. In order to agglutinate individual terminal nodes into groups with similar risk, the probability of severe atheromatosis in each node was calibrated. Supplementary Figure 3 shows the absolute frequency of patients with or without severe atheromatosis and its probability of having the disease before and after calibration. Three risk profiles were identified: low-risk nodes with a mean prevalence of severe atheromatosis of 28.8% in men and 28.6% in women, intermediate-risk nodes with 54.8% in men and 54.9% in women, and high-risk nodes with 71.8% in men and 71.2% in women. These profiles are shown in Figures 2, 3 as green, yellow, and red nodes, respectively. Thus, clinicians could easily identify the risk of severe atheromatosis according to the characteristics of the patients.
Variable importance assessment revealed that in both sexes, age, smoking habit, SBP, and total cholesterol were the most important clinical predictors of severe atheromatosis, which account for 98.4% of the predictor importance in men and 82.3% in women. Additionally, a GFR ≥ 107 ml/min/m2 increased the risk in men. In women, other predictors, such as history of dyslipidemia, BMI, history of hypertension, uric acid, and waist perimeter were identified (Figure 4).
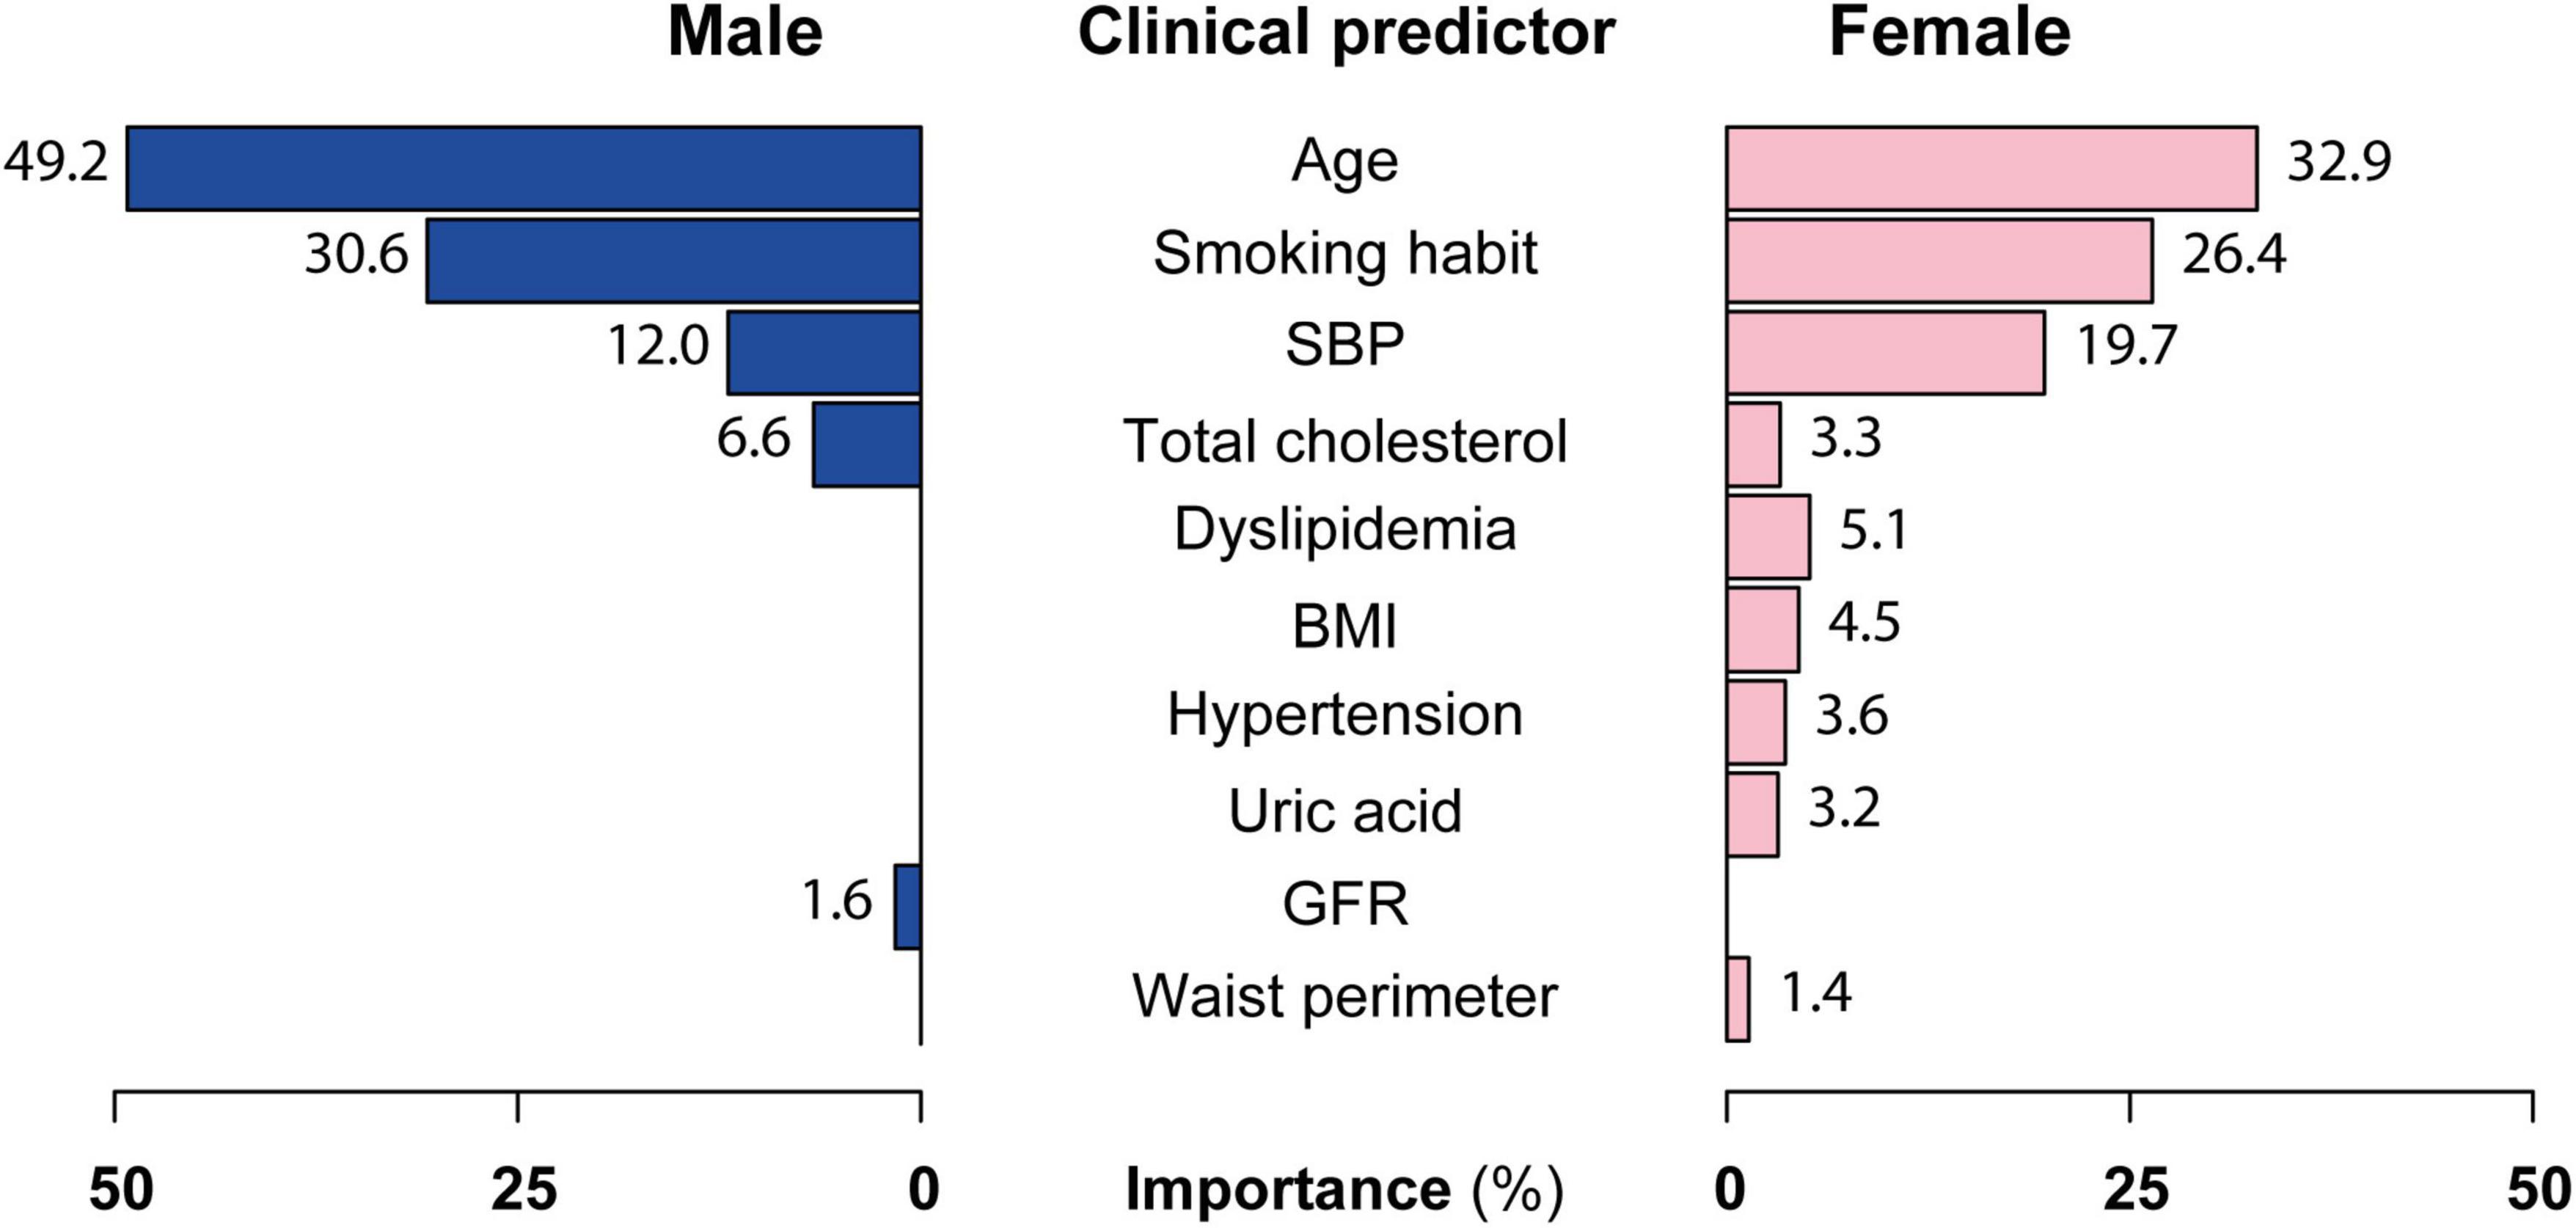
Figure 4. Clinical predictor importance in the PASAP-ILERVAS in both sexes. A variable importance score was calculated using the improvement measure attributable to each predictor in its role as splitter, plus the goodness for all splits in which it was a surrogate. The values of importance were scaled up to sum 100%. SBP, systolic blood pressure; BMI, body mass index; GFR, glomerular filtration rate.
Table 2 shows the internal validation metrics. Specificity, PPV, accuracy, and AUC were higher in L&H-risk individuals compared to the total sample (p-value: < 0.001), which indicate a higher feasibility of the PASAP-ILERVAS in those patients. On the contrary, the negative predictive value (NPV) showed no differences (i-value: > 0.1), and sensitivity was lower in L&H-risk individuals than in the total sample (i-value: < 0.001).
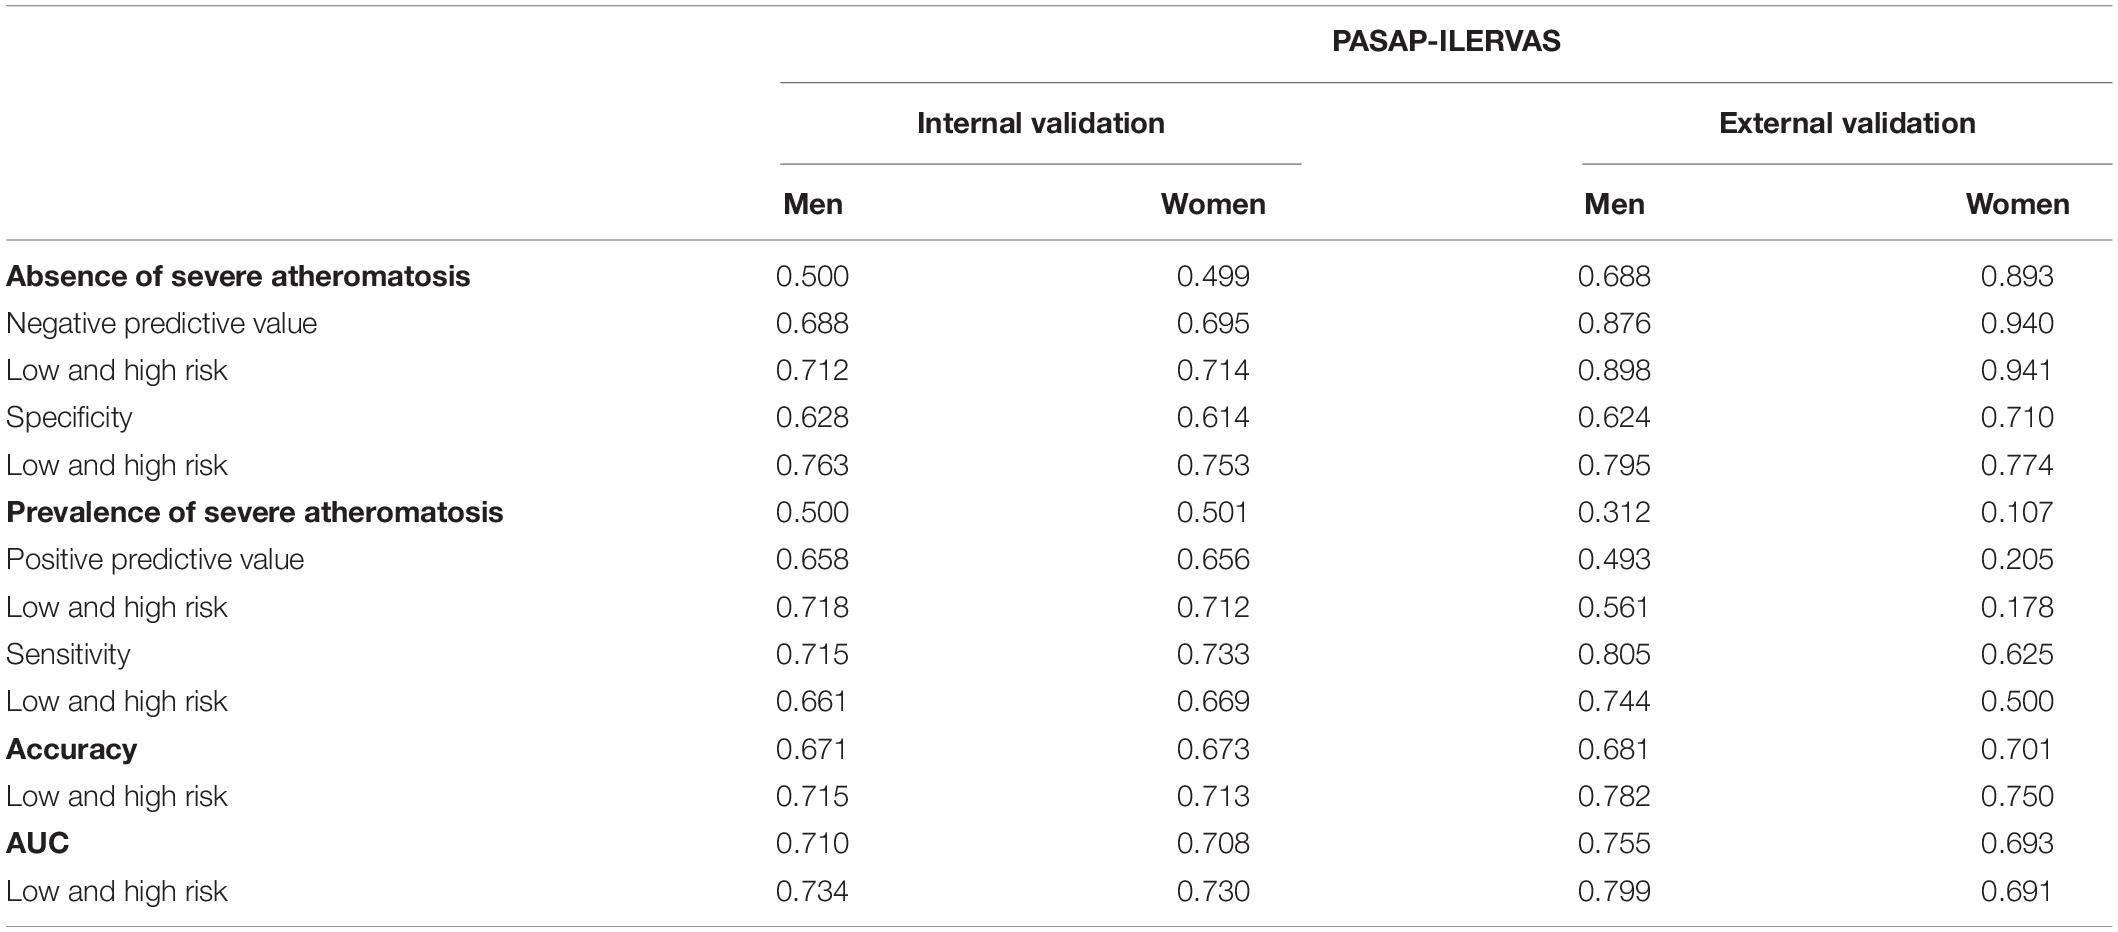
Table 2. Internal and external validation of the PASAP-ILERVAS.
In L&H-risk patients, all parameters were similar in both sexes. The NPV, the PPV, and accuracy were 0.71. Thus, the PASAP-ILERVAS showed a 71% of correct predictions (including both true positive and true negative). Finally, AUC was 0.734 in men and 0.730 in women.
The external validation was performed in an asymptomatic, kidney disease-free, subpopulation of the NEFRONA cohort. Although the prevalence of SA was lower in the NEFRONA cohort compared to the ILERVAS cohort, patients showed similar characteristics (Supplementary Table 3).
Table 2 shows the external validation metrics. In L&H-risk individuals, the specificity was similar in both sexes (men: 0.795; women 0.774, i-value = 0.783). The NPV was extremely high (men: 0.898; women: 0.941). Thus, PASAP-ILERVAS showed a high ability in identifying truly healthy individuals.
The PPV was higher in men than in women (0.561 vs. 0.178, p-value: < 0.001). It is noteworthy that performance metrics were limited by the low prevalence of SA in the external validation cohort (men: 31.2%; women: 10.7%). Sensitivity was similar in both sexes (0.744 vs. 0.500, p-value = 0.141). Accuracy was high in both, indicating a 78.2% and a 75.0% of correct predictions by the PASAP-ILERVAS. Finally, the AUC was 0 .799 in men and 0.691 in women.
The performance of the PASAP-ILERVAS to predict SA in L&H-risk individuals was compared to the traditional SCORE model (Figure 5 and Table 3).
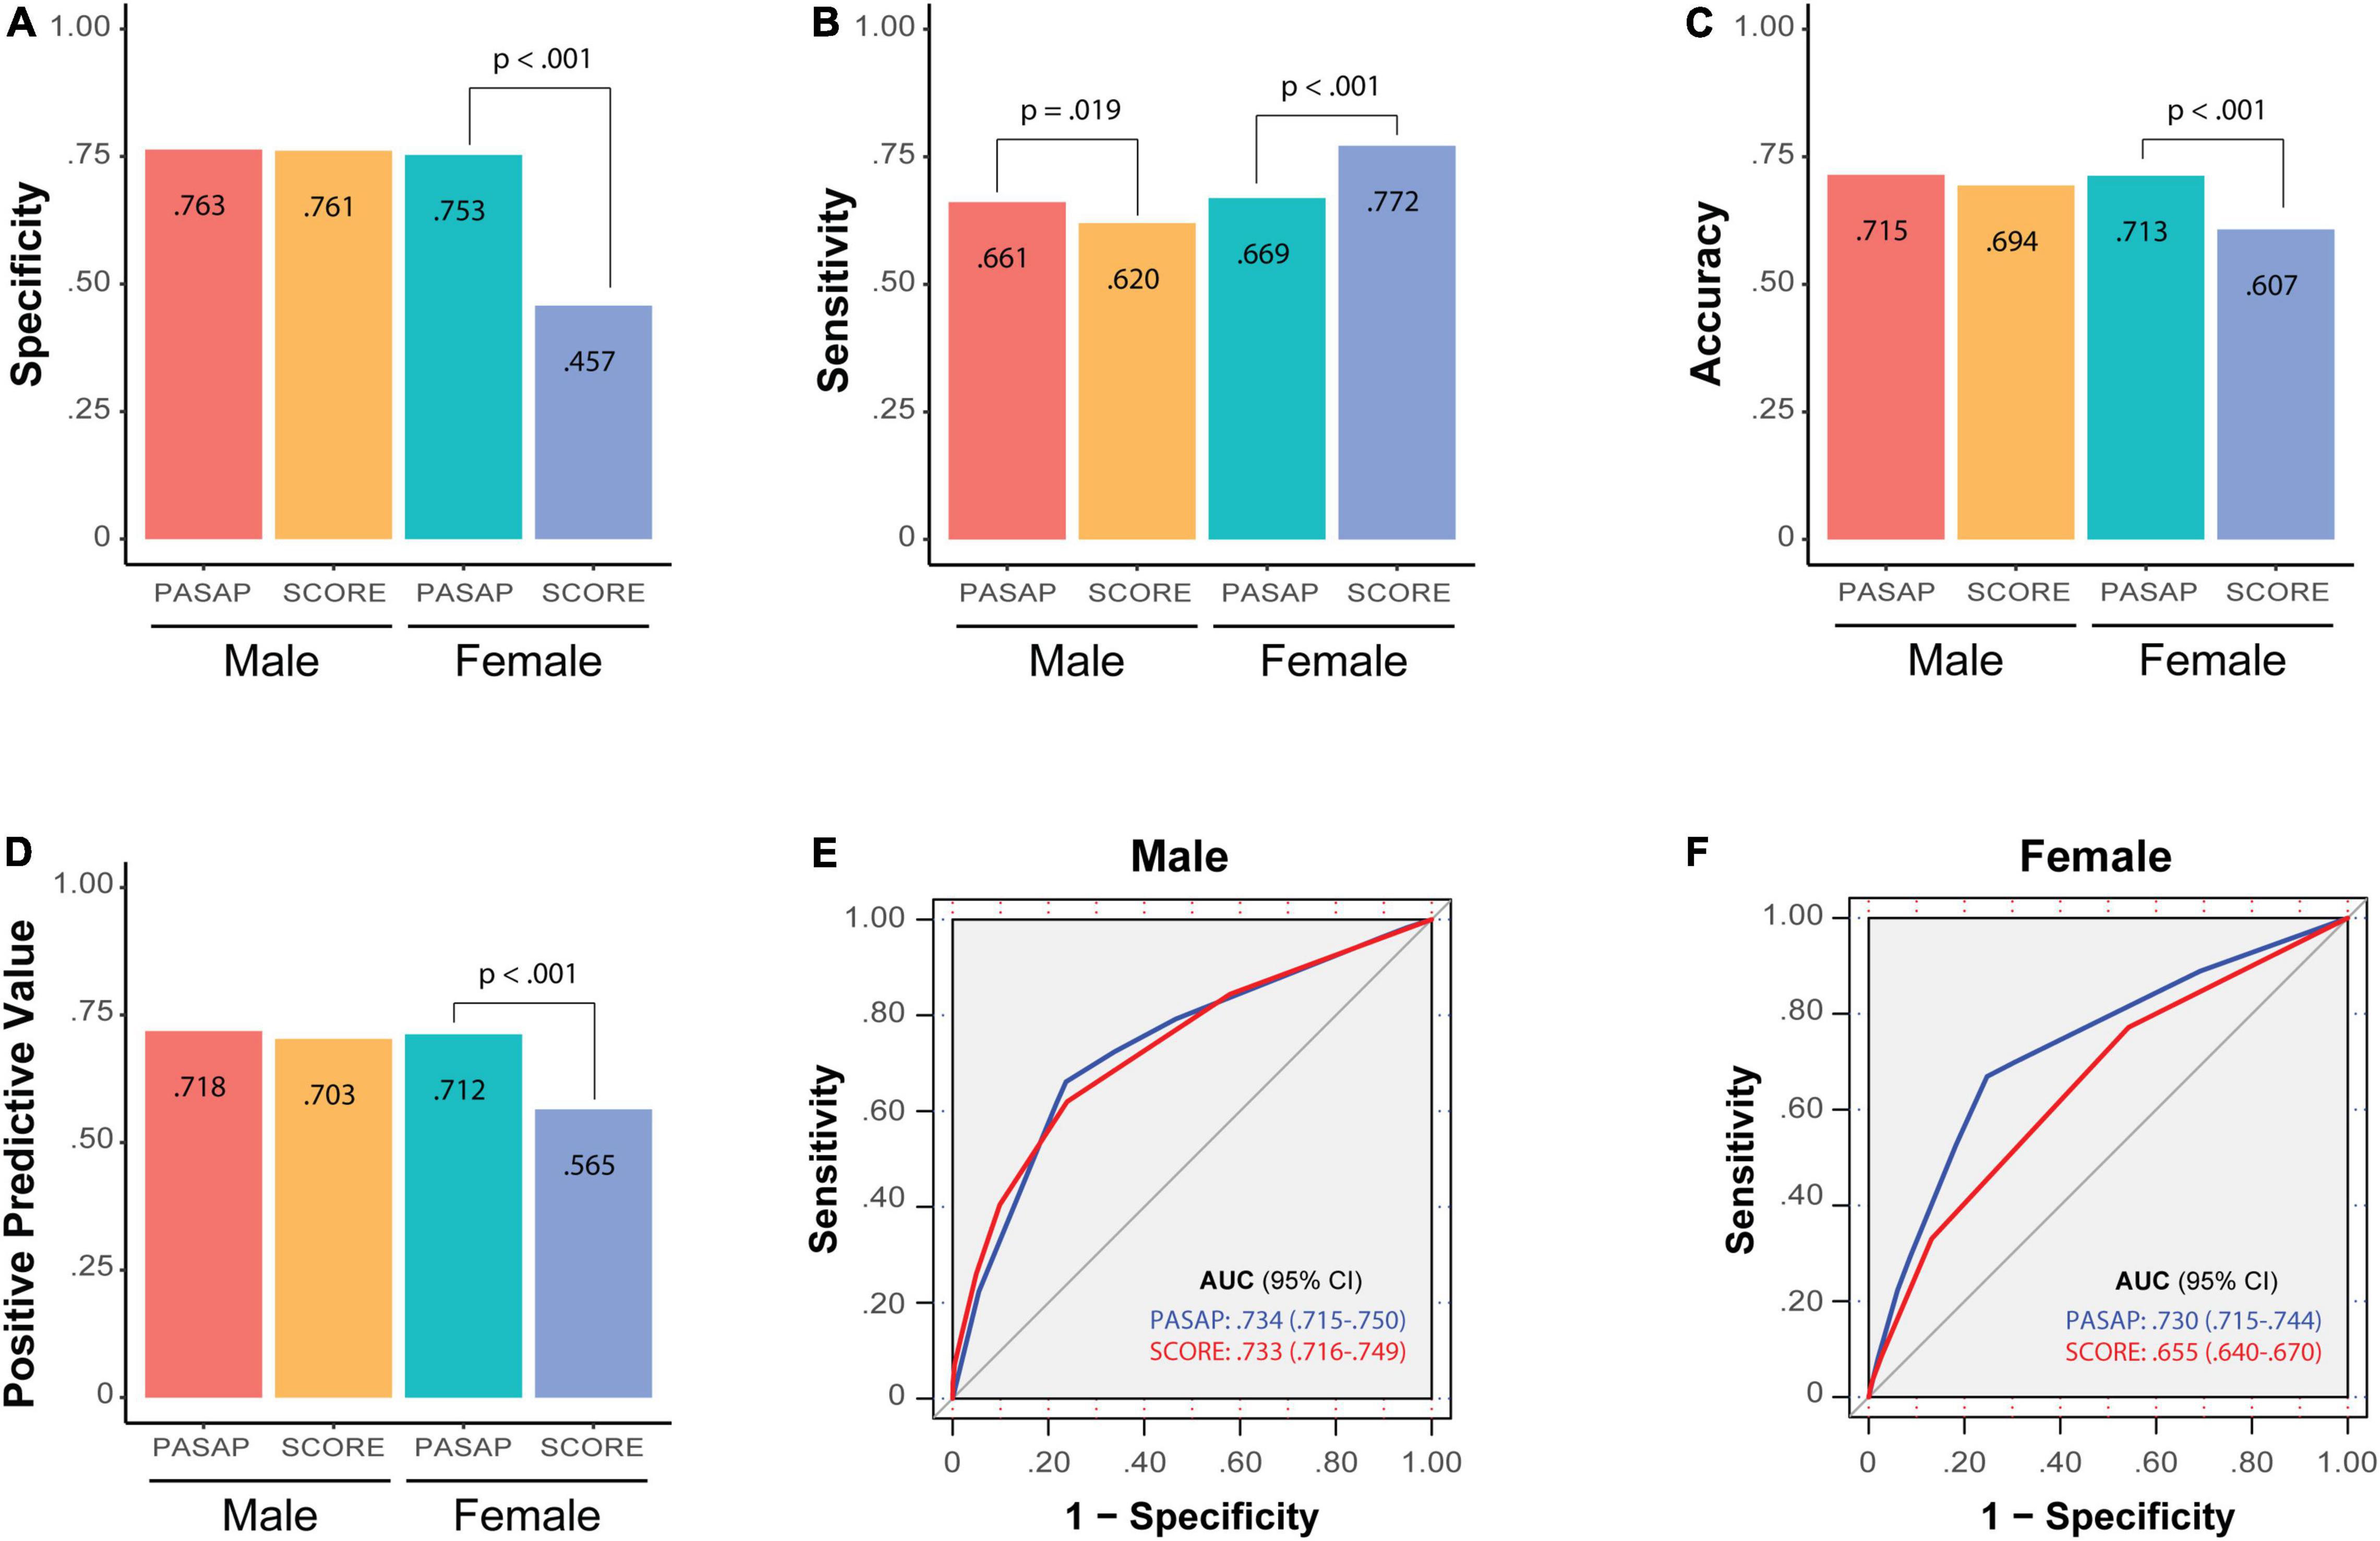
Figure 5. Comparison of the PASAP-ILERVAS with the SCORE risk score. Barplots contain the main performance metrics of PASAP-ILERVAS and SCORE risk model in L&H-risk individuals: (A) specificity; (B) sensitivity; (C) accuracy; (D) positive predictive model; (E) ROC curve in men; (F) ROC curve in women. The ROC curves reflect the area under the curve between sensitivity and complementary of specificity with both models. SCORE, Systematic COronary risk Evaluation; ROC, Receiver Operating Characteristic.
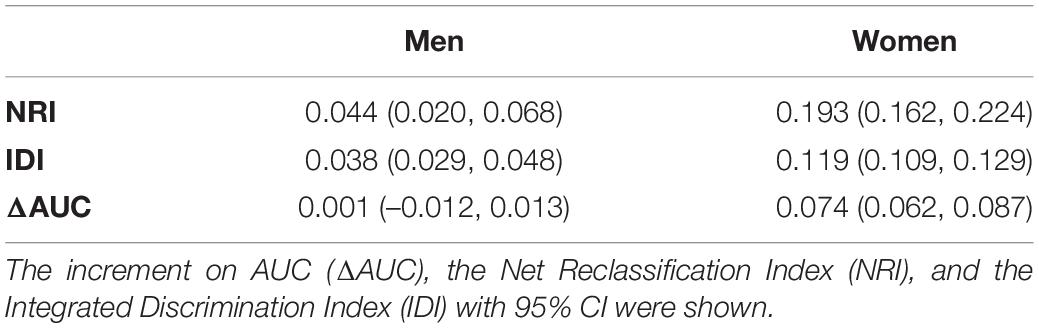
Table 3. Improvement in risk prediction of PASAP-ILERVAS respect to SCORE model.
In men, the PASAP-ILERVAS showed a higher sensitivity than the traditional score (0.661 vs. 0.620, p-value: 0.019). Thus, the new algorithm had a higher ability to detect L&H-risk men who actually were affected by the disease. In contrast, other metrics were very similar in both models (specificity: 0.763 vs. 0.761, p-value: 0.903; PPV: 0.718 vs. 0.703, p-value: 0.398; and accuracy: 0.715 vs. 0.694, p-value: 0.070). However, although the increment of AUC was not significant (p-value: 0.962), the PASAP-ILERVAS showed an NRI of 0.044 (95% CI: 0.020–0.068) and an IDI of 0.038 (95% CI: 0.029–0.048) compared to the SCORE model.
In women, the PASAP-ILERVAS showed a higher specificity than the SCORE (0.753 vs. 0.457, p-value: < 0.001), a lower sensitivity (0.669 vs. 0.772, p-value: < 0.001), and a higher accuracy (0.713 vs. 0.607, p-value: < 0.001). The PPV was also higher in the PASAP-ILERVAS (0.712 vs. 0.565, p-value: < 0.001). The new algorithm showed a significant increase in the AUC of 0.074 (95% CI: 0.062–0.087, p-value: < 0.001). Thus, PASAP-ILERVAS showed a higher percentage of correct predictions in L&H-risk women than the traditional SCORE, especially those women who truly had severe atheromatosis, showing an NRI of 0.193 (95% CI: 0.162–0.224) and an IDI of 0.119 (95% CI: 0.109–0.129) compared to the SCORE model.
In this study, we presented a novel, sex-specific, machine learning-based algorithm for SA prediction in asymptomatic middle-aged individuals. The PASAP-ILERVAS integrates clinical history data, anthropometrical measurements, and affordable biochemical parameters to obtain a hierarchical, flexible, easy-to-interpret, predictive model. This model was validated in an external cohort, showing excellent performance in the L&H-risk individuals. Thus, the algorithm could be useful to select individuals who can benefit from a vascular ultrasound, namely those classified as intermediate risk. Non-invasive imaging techniques can detect the presence of atheromatosis and estimate the burden, which has been proven to improve cardiovascular risk assessment (7), and it is recommended when the coronary artery calcium score is unavailable or not feasible (41). Furthermore, it is a cheap and accessible in most medical offices. However, the implementation of vascular ultrasound, which could help increase accuracy in those patients has not been accomplished in the routine clinical practice due to several reasons. Among them, the high-time burden added to each visit is likely one. Therefore, identifying patients in whom a vascular ultrasound could add prognostic value is of paramount importance.
The novel PASAP-ILERVAS stratifies individuals according to their risk of SA as low, intermediate, and high. First, patients were classified by age, followed by smoking habit. The combination of these two parameters conditioned the clinical threshold of the other predictors. Thus, the ML approach evidenced the additive effect of cardiovascular risk factors. In addition, the algorithm revealed that biological thresholds which conditioned ASCVD risk, must be considered individually.
Age, smoking habit, SBP, and total cholesterol accounts 98.4% of the predictor importance in men and 82.3% in women. Additionally, a GFR ≥ 107 ml/min/m2 increased the risk in men. Although it is amply proven that kidney failure increases ASCVD risk as kidney function decreases, few studies linked an increased glomerular filtration with ASCVD risk. Glomerular hyperfiltration is an initial step of kidney damage in diabetes and obesity, but its threshold remains elusive. However, there are data showing that glomerular hyperfiltration of 107–115 ml/min/m2 is independently associated with increased cardiovascular risk in middle-aged healthy individuals (42). In women, other predictors related to obesity were identified. Obesity is associated with an increased cardiovascular risk since the pro-inflammatory cytokines produced by the adipose tissue itself induce atherosclerotic plaque formation (43), and a larger waist perimeter was independently associated with recurrent atherosclerotic cardiovascular disease (44). The PESA study, which is another large Spanish cohort similar to the ILERVAS cohort with asymptomatic middle-aged individuals without established CVD, revealed that in metabolically healthy individuals the presence of subclinical atherosclerosis increased across BMI categories, whereas fewer differences were observed for metabolically unhealthy individuals. Thus, the presence of subclinical atherosclerosis observed in patients with an abnormal BMI was mainly attributed to the coexistence of other cardiovascular risk factors, such as hypertension, diabetes, and dyslipidemia (45). A recent study in a subpopulation of the PESA study revealed that individuals with metabolic syndrome or its individual components (central obesity, hypertension, low HDL-C, triglycerides, and altered glucose metabolism) showed bone marrow activation, even in the absence of systemic inflammation, which is associated with early atherosclerosis (46). Similarly, uric acid levels have been positively correlated with cardiovascular diseases, including hypertension and atherosclerosis, through oxidative stress and an inflammatory response (47). Women are often older than men when they suffer from their first cardiovascular event (48). This difference is attributed to the protective role of circulating estrogens on the vascular endothelium, maintaining oxide nitric release leading to vasodilation (49), regulating prostaglandin production and inhibiting smooth muscle cell proliferation (50). On the contrary, at menopause, women show endothelial dysfunction and lipid deposition in the artery walls, which can promote atherosclerosis development (51). In women under 55 years of age, smoking is the most important preventable cause of CVD, increasing their risk 7-fold (52). Large cohort studies have demonstrated that high SBP is an important risk factor for cardiovascular disease and a 5-mm Hg reduction of SBP reduced the risk of major cardiovascular events by about 10% (53). Strikingly, hypertension is more strongly associated with CVD in women compared to men (54).
The PASAP-ILERVAS can be used as a prescreening model to determine patients who will further benefit from a vascular ultrasound examination. It identified three risk profiles (low, intermediate, and high). The internal validation showed that specificity, PPV, accuracy, and AUC were higher in L&H-risk individuals compared to the total sample (p-value: < 0.001), which indicate a higher feasibility of the PASAP-ILERVAS in those patients. In L&H-risk individuals, all parameters were similar in both sexes. The NPV and the PPV were higher than 71%, which indicated that PASAP-ILERVAS algorithm correctly identified patients with SA (true positives) or without SA (true negatives). The external validation results were limited by the low prevalence of SA in that cohort. However, the accuracy was high in both sexes (men: 0.782; women: 0.750), indicating a high percentage of correct predictions. Thus, patients with an estimated low- or high-risk are very accurately classified by the algorithm and are not candidates for vascular ultrasound examination. On the contrary, patients in whom the prediction is not so accurate (intermediate-risk) are strong candidates to undergo a vascular ultrasound to truly determine whether they have SA in order to adjust treatments and/or follow-up visits. The NPV was extremely high (men: 0.898; women: 0.941). Thus, PASAP-ILERVAS showed a high ability in identifying truly healthy individuals.
The SCORE is a cardiovascular risk assessment tool that estimates the 10-year risk of fatal CVD (55). At the moment, there is no internationally accepted tool to predict subclinical atheromatosis, so new methods to do so have been previously compared to the SCORE in similar middle-aged asymptomatic cohorts (18, 56, 57). The comparison of the PASAP-ILERVAS with the SCORE model revealed a better performance in both sexes, showing a higher sensitivity in men, and a higher PPV, specificity, accuracy, and AUC in women. Importantly, PASAP-ILERVAS improved patients’ reclassification in both sexes, but was much higher in women [NRI in men: 0.044 (95% CI: 0.020–0.068); women: 0.193 (95% CI: 0.162–0.224)]. Thus, the new algorithm showed a higher percentage of correct predictions in L&H-risk women than the traditional SCORE, especially in healthy women (specificity:0.753 vs. 0.457, p-value: < 0.001) and in those who were positive in screening test and truly had severe atheromatosis (PPV:0.712 vs. 0.565, p-value: < 0.001). Indeed, our algorithm showed a significant increase in the AUC of 0.074 (95% CI: 0.062–0.087, p-value: < 0.001) in women.
Several limitations should be considered when interpreting this study. First, results are based on a cross-sectional analysis from the ILERVAS study cohort. However, the inclusion of history factors, such as hypertension and dyslipidemia, partially overcomes this limitation. Second, the ILERVAS cohort consists of middle-aged symptomatic participants with relatively homogeneous socioeconomic, lifestyle, and ethnic characteristics. However, having a homogenous population increases internal validity, can unveil hidden clinical associations, and is not uncommon (45, 58). Even though the PASAP-ILERVAS was externally validated in another cohort, further analysis would be considered to reinforce data extrapolation. Third, the derivation cohort is different not only in size (< 10% of individuals), and time period, but also in terms of incidence of subclinical atheromatosis, and even baseline characteristics of the patients. Fourth, the levels of glycosylated hemoglobin can be used to identify asymptomatic individuals at higher risk of subclinical atherosclerosis on top of traditional cardiovascular risk factors (58). However, unfortunately, we could not study the contribution of HbA1c in the PASAP-ILERVAS due to a high percentage of missing values in the external validation cohort. Finally, recursive partitioning may be complex or overfit the data. This issue was addressed by a post-pruning technique based on the CP, which shows the trade-off between the tree complexity and how well the tree fits the data.
In contrast, our study has several strengths. First, the study population was randomized, and a stratified sampling was performed from primary care records to reduce selection bias, and to obtain a representative cohort of the entire province. Second, contrary to recent atheromatosis prediction algorithm, a sex-stratified analysis was performed to unveil clinical differences in men and women. Third, rpart is a non-parametric ML method that can handle highly skewed data, does not require data categorization, and generates an easy-to-interpret graphical representation, which is very convenient in the daily clinical practice. Finally, the algorithm combines clinical history data, anthropometrical measurements, and affordable biochemical parameters that can be easily obtained in non-hospital settings, such as primary care centers and even pharmacies. Blood biochemical parameters were obtained by dried blood spot tests, which are highly validated methods.
We developed a personalized, sex-specific, easy-to-interpret model for severe atheromatosis prediction in asymptomatic middle-aged individuals. The PASAP-ILERVAS predicted accurately in L&H-risk patients. However, in intermediate-risk individuals a vascular imaging exploration would be recommended. Thus, the present algorithm could reduce the number of unnecessary complementary explorations selecting candidates for a further imaging study, increasing cost-effectiveness and optimizing health resources.
The raw data supporting the conclusions of this article will be made available by the authors, without undue reservation.
The studies involving human participants were reviewed and approved by CEIC Hospital Universitario Arnau de Vilanova. The patients/participants provided their written informed consent to participate in this study.
Eva Miquel and Marta Ortega: Centre d’Atenció Primària Cappont, Gerència Territorial de Lleida, Institut Català de la Salut, Barcelona, Spain; Research Support Unit Lleida, Fundació Institut Universitari per a la recerca a l’Atenció Primària de Salut Jordi Gol i Gorina (IDIAPJGol), Barcelona, Spain; Ferran Barbé, Jessica González, Silvia Barril, and Manuel Sánchez-de-la-Torre: Departament de Medicina Respiratòria, Hospital Universitari Arnau de Vilanova, Grup Recerca Translational Medicina Respiratòria, IRBLleida, Universitat de Lleida, Lleida, Spain; CIBER de enfermedades respiratorias (CIBERES), Madrid, Spain; Manuel Portero-Otín and Mariona Jové: Departament de Medicina Experimental, IRBLleida, Universitat de Lleida, Lleida, Spain; Marta Hernández and Ferran Rius: Departament d’Endocrinologia i Nutrició, Hospital Universitari Arnau de Vilanova, Grup de Recerca Obesitat i Metabolisme (ODIM), IRBLleida, Universitat de Lleida, Lleida, Spain; Centro de Investigación Biomédica en Red de Diabetes y Enfermedades Metabólicas Asociadas (CIBERDEM), Instituto de Salud Carlos III (ISCIII), Madrid, Spain; Josep Franch-Nadal and Esmeralda Castelblanc: Centro de Investigación Biomédica en Red de Diabetes y Enfermedades Metabólicas Asociadas (CIBERDEM), Instituto de Salud Carlos III (ISCIII), Madrid, Spain; Departament d’Endocrinologia i Nutrició, Hospital de la Santa Creu i Sant Pau, Institut de Recerca Biomèdica Sant Pau (IIB Sant Pau), Barcelona, Spain; Pere Godoy: Agència de Salut Pública de Catalunya, Departament de Salut, IRBLleida, Universitat de Lleida, Lleida, Spain; CIBER de Epidemiología y Salud Pública (CIBERESP), Madrid, Spain; Montse Martinez-Alonso: Unitat de Bioestadística, IRBLleida, Departament de ciències Mèdiques Bàsiques, Universitat de Lleida, Lleida, Spain.
MB-L, JV, and EF: study concept and design. EC-B and CF: data acquisition. MB-L, MM-A, JV, EF, and MB: data interpretation. MM-A and MB-L: statistical analysis and drafting of the manuscript. EF: study supervision. ILERVAS investigators: collected baseline and prospective follow-up data of the cohort. All authors contributed to the critical revision of the manuscript for important intellectual content and article and approved the submitted version.
This work was supported by grants from the Diputació de Lleida, Instituto de Salud Carlos III (RETIC RD16/0009/0011) and Ministerio de Ciencia, Innovación y Universidades (IJC2018-037792-I).
The authors declare that the research was conducted in the absence of any commercial or financial relationships that could be construed as a potential conflict of interest.
All claims expressed in this article are solely those of the authors and do not necessarily represent those of their affiliated organizations, or those of the publisher, the editors and the reviewers. Any product that may be evaluated in this article, or claim that may be made by its manufacturer, is not guaranteed or endorsed by the publisher.
We would like to thank Virtudes María, Marta Elias, Teresa Molí, Cristina Domínguez, Noemí Nova, Alba Prunera, Núria Sans, Meritxell soria, Francesc Pons, Rebeca Senar, Pau Guix, Fundació Renal Jaume Arnó, and the Primary Care teams of the province of Lleida for recruiting participants and their efforts in the accurate development of the ILERVAS project. Samples were obtained with support from IRBLleida Biobank (B.0000682) and PLATAFORMA BIOBANCOS PT17/0015/0027.
The Supplementary Material for this article can be found online at: https://www.frontiersin.org/articles/10.3389/fcvm.2022.895917/full#supplementary-material
1. Mach F, Baigent C, Catapano AL, Koskinas KC, Casula M, Badimon L, et al. 2019 ESC/EAS guidelines for the management of dyslipidaemias: lipid modification to reduce cardiovascular risk. Eur Heart J. (2020) 41:111–88.
2. López-Melgar B, Fernández-Friera L, Oliva B, García-Ruiz JM, Peñalvo JL, Gómez-Talavera S, et al. Subclinical atherosclerosis burden by 3D ultrasound in mid-life: the PESA study. J Am Coll Cardiol. (2017) 70:301–13. doi: 10.1016/j.jacc.2017.05.033
3. Bermúdez-López M, Martínez-Alonso M, Castro-Boqué E, Betriu À, Cambray S, Farràs C, et al. Subclinical atheromatosis localization and burden in a low-to-moderate cardiovascular risk population: the ILERVAS study. Rev Esp Cardiol. (2020) 74:1042–53. doi: 10.1016/j.rec.2020.09.015
4. Marrugat J, Vila J, Baena-Diez JM, Grau M, Sala J, Ramos R, et al. [Relative validity of the 10-year cardiovascular risk estimate in a population cohort of the REGICOR study]. Rev Esp Cardiol. (2011) 64:385–94. doi: 10.1016/j.rec.2010.12.017
5. Gbd 2019 Diseases and Injuries Collaborators. Global burden of 369 diseases and injuries in 204 countries and territories, 1990-2019: a systematic analysis for the global burden of disease study 2019. Lancet. (2020) 396:1204–22.
6. Simon A, Chironi G, Levenson J. Performance of subclinical arterial disease detection as a screening test for coronary heart disease. Hypertension. (2006) 48:392–6. doi: 10.1161/01.HYP.0000236507.76042.72
7. Inaba Y, Chen JA, Bergmann SR. Carotid plaque, compared with carotid intima-media thickness, more accurately predicts coronary artery disease events: a meta-analysis. Atherosclerosis. (2012) 220:128–33. doi: 10.1016/j.atherosclerosis.2011.06.044
8. Li H, Xu X, Luo B, Zhang Y. The predictive value of carotid ultrasonography with cardiovascular risk factors-A “SPIDER” promoting atherosclerosis. Front Cardiovasc Med. (2021) 8:706490. doi: 10.3389/fcvm.2021.706490
9. Aday AW, Matsushita K. Epidemiology of peripheral artery disease and polyvascular disease. Circ Res. (2021) 128:1818–32. doi: 10.1161/CIRCRESAHA.121.318535
10. Laclaustra M, Casasnovas JA, Fernández-Ortiz A, Fuster V, León-Latre M, Jiménez-Borreguero LJ, et al. Femoral and carotid subclinical atherosclerosis association with risk factors and coronary calcium: the AWHS study. J Am Coll Cardiol. (2016) 67:1263–74. doi: 10.1016/j.jacc.2015.12.056
11. Valdivielso JM, Betriu A, Martinez-Alonso M, Arroyo D, Bermudez-Lopez M, Fernandez E, et al. Factors predicting cardiovascular events in chronic kidney disease patients. Role of subclinical atheromatosis extent assessed by vascular ultrasound. PLoS One. (2017) 12:e0186665. doi: 10.1371/journal.pone.0186665
12. Shameer K, Johnson KW, Glicksberg BS, Dudley JT, Sengupta PP. Machine learning in cardiovascular medicine: are we there yet? Heart. (2018) 104:1156–64. doi: 10.1136/heartjnl-2017-311198
13. Motwani M, Dey D, Berman DS, Germano G, Achenbach S, Al-Mallah MH, et al. Machine learning for prediction of all-cause mortality in patients with suspected coronary artery disease: a 5-year multicentre prospective registry analysis. Eur Heart J. (2017) 38:500–7. doi: 10.1093/eurheartj/ehw188
14. Weng SF, Reps J, Kai J, Garibaldi JM, Qureshi N. Can machine-learning improve cardiovascular risk prediction using routine clinical data? PLoS One. (2017) 12:e0174944. doi: 10.1371/journal.pone.0174944
15. Ambale-Venkatesh B, Yang X, Wu CO, Liu K, Hundley WG, McClelland R, et al. Cardiovascular event prediction by machine learning: the multi-ethnic study of atherosclerosis. Circ Res. (2017) 121:1092–101. doi: 10.1161/CIRCRESAHA.117.311312
16. Kakadiaris IA, Vrigkas M, Yen AA, Kuznetsova T, Budoff M, Naghavi M. Machine learning outperforms ACC/AHA CVD Risk calculator in MESA. J Am Heart Assoc. (2018) 7:e009476. doi: 10.1161/JAHA.118.009476
17. Alaa AM, Bolton T, Di Angelantonio E, Rudd JHF, van der Schaar M. Cardiovascular disease risk prediction using automated machine learning: a prospective study of 423,604 UK biobank participants. PLoS One. (2019) 14:e0213653. doi: 10.1371/journal.pone.0213653
18. Sánchez-Cabo F, Rossello X, Fuster V, Benito F, Manzano JP, Silla JC, et al. Machine learning improves cardiovascular risk definition for young, asymptomatic individuals. J Am Coll Cardiol. (2020) 76:1674–85. doi: 10.1016/j.jacc.2020.08.017
19. Fors MM, Viada CE, Gonzalez P. Use of recursive partitioning analysis in clinical trials and meta-analysis of randomized clinical trials, 1990-2016. Rev Recent Clin Trials. (2017) 12:3–7. doi: 10.2174/1574887111666160916144658
20. Junyent M, Martínez M, Borràs M, Coll B, Valdivielso JM, Vidal T, et al. Predicting cardiovascular disease morbidity and mortality in chronic kidney disease in Spain. the rationale and design of NEFRONA: a prospective, multicenter, observational cohort study. BMC Nephrol. (2010) 11:14. doi: 10.1186/1471-2369-11-14
21. Statland BE. A review of the analytic performance of the reflotron system for cholesterol testing. Clin Ther. (1990) 12:281–6.
22. Kridde G, Hirschberger J. [The determination of creatinine in blood and plasma of small animals using the dry chemical system reflotron]. Tierarztl Prax. (1991) 19:447–9.
23. Cattozzo G, Franzini C, Hubbuch A, Tritschler W. Evaluation of determination of uric acid in serum and whole blood with the Reflotron. Clin Chem. (1988) 34:414–6. doi: 10.1093/clinchem/34.2.414
24. Cosentino F, Grant PJ, Aboyans V, Bailey CJ, Ceriello A, Delgado V, et al. 2019 ESC guidelines on diabetes, pre-diabetes, and cardiovascular diseases developed in collaboration with the EASD. Eur Heart J. (2020) 41:255–323.
25. Levey AS, Stevens LA, Schmid CH, Zhang YL, Castro AF, Feldman HI, et al. A new equation to estimate glomerular filtration rate. Ann Intern Med. (2009) 150:604–12. doi: 10.7326/0003-4819-150-9-200905050-00006
26. Touboul PJ, Hennerici MG, Meairs S, Adams H, Amarenco P, Bornstein N, et al. Mannheim carotid intima-media thickness and plaque consensus (2004-2006-2011). An update on behalf of the advisory board of the 3rd, 4th, and 5th watching the risk symposia, at the 13th, 15th, and 20th European stroke conferences, Mannheim, Germany, 2004, Brussels, Belgium, 2006, and Hamburg, Germany, 2011. Cerebrovasc Dis. (2012) 34:290–6. doi: 10.1159/000343145
27. Gordon M, Lumley T Lumley MGaT Forestplot: Advanced Forest Plot Using ‘grid’ Graphics. Vienna: The R Foundation (2020).
28. Lunardon N, Menardi G, Torelli N. ROSE: a package for binary imbalanced learning. R J. (2014) 6:82–92. doi: 10.32614/RJ-2014-008
29. Therneau T, Atkinson B, Ripley B Rpart: Recursive Partitioning and Regression Trees. Vienna: The R Foundation (2019).
30. Milborrow S rpart.plot: Plot ‘rpart’ Models: An Enhanced Version of ‘plot.rpart’. Vienna: The R Foundation (2020).
31. Wickham H. ggplot2: Elegant Graphics for Data Analysis. New York, NY: Springer-Verlag New York (2016). doi: 10.1007/978-3-319-24277-4_9
32. Schwarz J, Heider D. GUESS: projecting machine learning scores to well-calibrated probability estimates for clinical decision-making. Bioinformatics. (2019) 35:2458–65. doi: 10.1093/bioinformatics/bty984
33. Robin X, Turck N, Hainard A, Tiberti N, Lisacek F, Müller MJ. pROC: an open-source package for R and S+ to analyze and compare ROC curves. BMC Bioinformatics. (2011) 12:77. doi: 10.1186/1471-2105-12-77
34. Trevethan R. Sensitivity, specificity, and predictive values: foundations, pliabilities, and pitfalls in research and practice. Front Public Health. (2017) 5:307. doi: 10.3389/fpubh.2017.00307
35. Rossello X, Dorresteijn JA, Janssen A, Lambrinou E, Scherrenberg M, Bonnefoy-Cudraz E, et al. Risk prediction tools in cardiovascular disease prevention: a report from the ESC prevention of CVD programme led by the European association of preventive cardiology (EAPC) in collaboration with the acute cardiovascular care association (ACCA) and the association of cardiovascular nursing and allied professions (ACNAP). Eur J Prev Cardiol. (2019) 26:1534–44. doi: 10.1177/2047487319846715
36. Pickering JW, Endre ZH. New metrics for assessing diagnostic potential of candidate biomarkers. Clin J Am Soc Nephrol. (2012) 7:10. doi: 10.2215/CJN.09590911
37. Inoue E nricens: NRI for Risk Prediction Models with Time to Event and Binary Response Data. R Package Version 1.6. Vienna: The R Foundation (2013).
38. Kundu S, Aulchenko YS, Cecile A, Janssens JW. PredictABEL: assessment of risk prediction models. Eur J Epidemiol. (2011) 26:261–4. doi: 10.1007/s10654-011-9567-4
39. Pickering JW, Endre ZH rap: Risk Assessment Plot and Reclassification Metrics. R Package Version 1.03. Vienna: The R Foundation (2021)
40. Pruim R, Kaplan DT, Horton NJ. The mosaic package: helping students to ‘think with data’ using R. The R J. (2017) 9:26. doi: 10.32614/RJ-2017-024
41. Visseren FLJ, Mach F, Smulders YM, Carballo D, Koskinas KC, Bäck M, et al. 2021 Esc guidelines on cardiovascular disease prevention in clinical practice. Eur J Prev Cardiol. (2021) 42:3227–337.
42. Dupuis ME, Nadeau-Fredette AC, Madore F, Agharazii M, Goupil R. Association of glomerular hyperfiltration and cardiovascular risk in middle-aged healthy individuals. JAMA Netw Open. (2020) 3:e202377. doi: 10.1001/jamanetworkopen.2020.2377
43. Carbone S, Canada JM, Billingsley HE, Siddiqui MS, Elagizi A, Lavie CJ. Obesity paradox in cardiovascular disease: where do we stand? Vasc Health Risk Manag. (2019) 15:89–100. doi: 10.2147/VHRM.S168946
44. Mohammadi H, Ohm J, Discacciati A, Sundstrom J, Hambraeus K, Jernberg T, et al. Abdominal obesity and the risk of recurrent atherosclerotic cardiovascular disease after myocardial infarction. Eur J Prev Cardiol. (2020) 27:1944–52. doi: 10.1177/2047487319898019
45. Rossello X, Fuster V, Oliva B, Sanz J, Fernández Friera LA, López-Melgar B, et al. Association between body size phenotypes and subclinical atherosclerosis. J Clin Endocrinol Metab. (2020) 105:3734–44. doi: 10.1210/clinem/dgaa620
46. Devesa A, Lobo-González M, Martínez-Milla J, Oliva B, García-Lunar I, Mastrangelo A, et al. Bone marrow activation in response to metabolic syndrome and early atherosclerosis. Eur Heart J. (2022) 43:1809–28. doi: 10.1093/eurheartj/ehac102
47. Yu W, Cheng JD. Uric acid and cardiovascular disease: an update from molecular mechanism to clinical perspective. Front Pharmacol. (2020) 11:582680. doi: 10.3389/fphar.2020.582680
48. Mozaffarian D, Benjamin EJ, Go AS, Arnett DK, Blaha MJ, Cushman M, et al. Executive summary: heart disease and stroke statistics–2016 update: a report from the American heart association. Circulation. (2016) 133:447–54. doi: 10.1161/CIR.0000000000000366
49. Mendelsohn ME, Karas RH. The protective effects of estrogen on the cardiovascular system. N Engl J Med. (1999) 340:1801–11. doi: 10.1056/NEJM199906103402306
50. Hermenegildo C, Oviedo PJ, Cano A. Cyclooxygenases regulation by estradiol on endothelium. Curr Pharm Des. (2006) 12:205–15. doi: 10.2174/138161206775193136
51. Taddei S, Virdis A, Ghiadoni L, Mattei P, Sudano I, Bernini G, et al. Menopause is associated with endothelial dysfunction in women. Hypertension. (1996) 28:576–82. doi: 10.1161/01.HYP.28.4.576
52. Njølstad I, Arnesen E, Lund-Larsen PG. Smoking, serum lipids, blood pressure, and sex differences in myocardial infarction. A 12-year follow-up of the Finnmark Study. Circulation. (1996) 93:450–6. doi: 10.1161/01.CIR.93.3.450
53. Collaboration BPLTT. Pharmacological blood pressure lowering for primary and secondary prevention of cardiovascular disease across different levels of blood pressure: an individual participant-level data meta-analysis. Lancet. (2021) 397:1625–36.
54. Yusuf S, Hawken S, Ounpuu S, Dans T, Avezum A, Lanas F, et al. Effect of potentially modifiable risk factors associated with myocardial infarction in 52 countries (the INTERHEART study): case-control study. Lancet. (2004) 364:937–52. doi: 10.1016/S0140-6736(04)17018-9
55. Conroy RM, Pyörälä K, Fitzgerald AP, Sans S, Menotti A, De Backer G, et al. Estimation of ten-year risk of fatal cardiovascular disease in Europe: the SCORE project. Eur Heart J. (2003) 24:987–1003. doi: 10.1016/S0195-668X(03)00114-3
56. Fernández-Alvira JM, Fuster V, Pocock S, Sanz J, Fernández-Friera L, Laclaustra M, et al. Predicting subclinical atherosclerosis in low-risk individuals: ideal cardiovascular health score and fuster-BEWAT Score. J Am Coll Cardiol. (2017) 70:2463–73. doi: 10.1016/j.jacc.2017.09.032
57. Raiko JR, Magnussen CG, Kivimäki M, Taittonen L, Laitinen T, Kähönen M, et al. Cardiovascular risk scores in the prediction of subclinical atherosclerosis in young adults: evidence from the cardiovascular risk in a young Finns study. Eur J Cardiovasc Prev Rehabil. (2010) 17:549–55. doi: 10.1097/HJR.0b013e3283386419
Keywords: cardiovascular disease, atherosclerosis, cardiovascular risk assessment, machine learning, recursive partitioning classification trees, vascular ultrasound
Citation: Bermúdez-López M, Martí-Antonio M, Castro-Boqué E, Bretones MdM, Farràs C, Torres G, Pamplona R, Lecube A, Mauricio D, Valdivielso JM and Fernández E on behalf of the ILERVAS Project Collaborators (2022) Development and Validation of a Personalized, Sex-Specific Prediction Algorithm of Severe Atheromatosis in Middle-Aged Asymptomatic Individuals: The ILERVAS Study. Front. Cardiovasc. Med. 9:895917. doi: 10.3389/fcvm.2022.895917
Received: 14 March 2022; Accepted: 20 June 2022;
Published: 14 July 2022.
Edited by:
Corey Kalbaugh, Clemson University, United StatesReviewed by:
Jennifer Mancio, University of Porto, PortugalCopyright © 2022 Bermúdez-López, Martí-Antonio, Castro-Boqué, Bretones, Farràs, Torres, Pamplona, Lecube, Mauricio, Valdivielso and Fernández on behalf of the ILERVAS Project Collaborators. This is an open-access article distributed under the terms of the Creative Commons Attribution License (CC BY). The use, distribution or reproduction in other forums is permitted, provided the original author(s) and the copyright owner(s) are credited and that the original publication in this journal is cited, in accordance with accepted academic practice. No use, distribution or reproduction is permitted which does not comply with these terms.
*Correspondence: José Manuel Valdivielso, am9zZW1hbnVlbC52YWxkaXZpZWxzb0B1ZGwuY2F0
Disclaimer: All claims expressed in this article are solely those of the authors and do not necessarily represent those of their affiliated organizations, or those of the publisher, the editors and the reviewers. Any product that may be evaluated in this article or claim that may be made by its manufacturer is not guaranteed or endorsed by the publisher.
Research integrity at Frontiers
Learn more about the work of our research integrity team to safeguard the quality of each article we publish.