 Shoupeng Duan1,2,3,4†
 Jun Wang1,2,3,4†
 Fu Yu1,2,3,4†
 Lingpeng Song1,2,3,4
 Chengzhe Liu1,2,3,4
 Ji Sun1,2,3,4Qiang Deng1,2,3,4Yijun Wang1,2,3,4Zhen Zhou1,2,3,4
 Fuding Guo1,2,3,4Liping Zhou1,2,3,4
 Yueyi Wang1,2,3,4Wuping Tan1,2,3,4
 Hong Jiang1,2,3,4*
 Lilei Yu1,2,3,4*
- 1Department of Cardiology, Renmin Hospital of Wuhan University, Wuhan, China
- 2Cardiac Autonomic Nervous System Research Centre of Wuhan University, Wuhan, China
- 3Cardiovascular Research Institute, Wuhan University, Wuhan, China
- 4Hubei Key Laboratory of Cardiology, Wuhan, China
Background: Cardiac autonomic nerve imbalance has been well documented to provide a critical foundation for the development of acute coronary syndrome (ACS) but is not included in the postdischarge GRACE score. We investigated whether capturing cardiac autonomic nervous system (ANS)-related modulations by 24-h deceleration capacity (DC) could improve the capability of existing prognostic models, including the postdischarge Global Registry of Acute Coronary Events (GRACE) score, to predict prognosis after ACS.
Method: Patients with ACS were assessed with 24-h Holter monitoring in our department from June 2017 through June 2019. The GRACE score was calculated for postdischarge 6-month mortality. The patients were followed longitudinally for the incidence of major adverse cardiac events (MACEs), set as a composite of non-fatal myocardial infarction and death. To evaluate the improvement in its discriminative and reclassification capabilities, the GRACE score with DC model was compared with a model using the GRACE score only, using area under the receiver-operator characteristic curve (AUC), Akaike's information criteria, the likelihood ratio test, category-free integrated discrimination index (IDI) and continuous net reclassification improvement (NRI).
Results: Overall, 323 patients were enrolled consecutively. After the follow-up period (mean, 43.78 months), 41 patients were found to have developed MACEs, which were more frequent among patients with DC <2.5 ms. DC adjusted for the GRACE score independently predicted the occurrence of MACEs with an adjusted hazard ratio (HR) of 0.885 and 95% CI of 0.831–0.943 (p < 0.001). Moreover, adding DC to the GRACE score only model increased the discriminatory ability for MACEs, as indicated by the likelihood ratio test (χ2 = 9.277, 1 df; p < 0.001). The model including the GRACE score combined with DC yielded a lower corrected Akaike's information criterion compared to that with the GRACE score alone. Incorporation of the DC into the existing model that uses the GRACE score enriched the net reclassification indices (NRIe>0 7.3%, NRIne>0 12.8%, NRI>0 0.200; p = 0.003). Entering the DC into the GRACE score model enhanced discrimination (IDI of 1.04%, p < 0.001).
Conclusion: DC serves as an independent and effective predictor of long-term adverse outcomes after ACS. Integration of DC and the postdischarge GRACE score significantly enhanced the discriminatory capability and precision in the prediction of poor long-term follow-up prognosis.
Introduction
Acute coronary syndrome (ACS) occurs in people who are prone to exacerbations and adverse outcomes, and optimizing the risk stratification of these patients is of considerable clinical interest (1, 2). Therefore, even if the optimal treatment is known, identifying which ACS patients will benefit the most from early interventional treatment can be challenging. Currently, the Global Registry of Acute Coronary Events (GRACE) score is the most well-established risk stratification tool for the prediction of in-hospital and long-term mortality and the risk of myocardial infarction after ACS (3, 4). Although it has been well established that the overall prognosis after ACS is worse among those with cardiac autonomic nerve imbalance than among those without cardiac autonomic nerve imbalance (5–8), the GRACE score does not include data from wearable devices that test cardiac autonomic function.
Notably, the value of 24-h deceleration capacity (DC), a feasible and non-invasive indicator that captures autonomic activity-related modulations of heart rate, adds valuable and repeatable information for timely identification of ACS patients at higher risk and aid in risk stratification (5–8). Accordingly, previous studies have also demonstrated that DC may serve as a predictor of mortality and outperformed a standard measure of heart rate variability (HRV) (8). Moreover, adjustment of the admission GRACE score, calculated for the prediction of in-hospital mortality, by short-term DC improves the accuracy of prediction of the composite of mortality, including in-hospital, 30 and 180-day mortality, among patients with suspected ACS (9). However, whether the readily accessible clinical 24-h DC remains a significant prognostic factor to enhance the predictability of prognostic models, including the postdischarge GRACE score, for ACS patients after long-term follow-up remains unclear.
Therefore, we investigated the value in long-term prognosis of 24-h DC added to the postdischarge GRACE score among ACS patients and the underlying incremental prognostic value of entering DC into an existing model including the postdischarge GRACE score only.
Methods
Patient Population
We retrospectively enrolled 323 consecutive patients with ACS at Renmin Hospital of Wuhan University from June 2017 through June 2019. The previously established guidelines addressed the process and criteria for acute coronary syndrome diagnosis (10). ACS included non-ST-elevation ACS (NSTE-ACS) and ST-elevation ACS (STE-ACS). Patients with NSTE-ACS included those presenting with unstable angina (UA) and non-ST-segment elevation myocardial infarction (non-STEMI), and patients with STE-ACS included those presenting with ST-elevation myocardial infarction (STEMI). The main exclusion criteria were as follows: atrial fibrillation, pacemaker implantation, use of any medications that affect heart rate, severe liver or renal insufficiency <30 ml/(min 1.73 m2), inflammatory or infectious disease, depressive disorder, hyperthyroidism and excessive alcohol consumption. The flowchart of participant enrollment is presented in Figure 1. Due to the purely retrospective observational, our study was exempt from requiring ethics approval and informed consent from eligible patients by the Renmin Hospital of Wuhan University Ethics Committee.
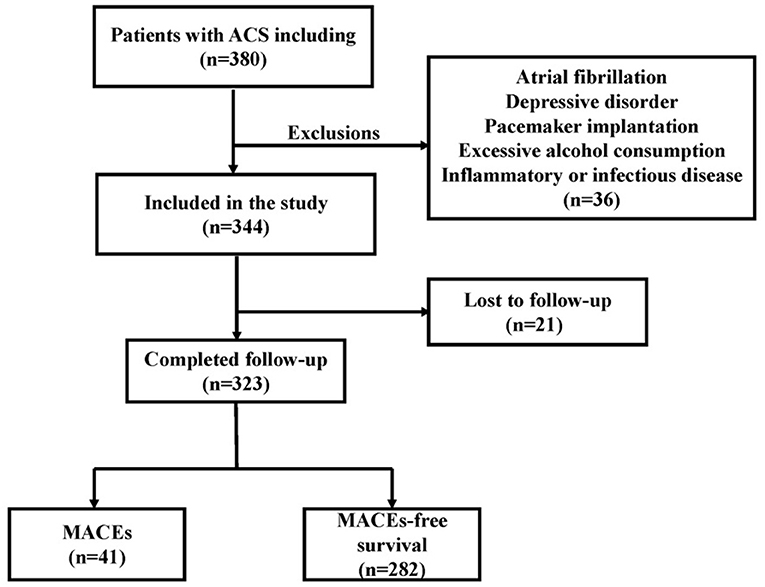
Figure 1. Flowchart of patient enrollment.
Laboratory Examinations
Venous blood specimens were collected when patients were initially referred to the emergency department or cardiology department. All participants were subjected to routine whole blood analysis, including routine blood, blood glucose, kidney function, and plasma lipid analyses.
Holter Monitoring and DC Analysis
All participants included in this study underwent 24-h Holter monitoring (DMS300-4A, DM Software, Inc., USA) recordings after coronary angiography. The 24-h mean heart rate, time-domain parameters [i.e., standard deviation of all normal sinus RR intervals (SDNN), standard deviation average of normal-to-normal (NN) intervals (SDANN), percentage of the number of times that the difference between adjacent normal RR intervals >50 ms in the total number of NN intervals (pNN50), root mean square successive difference (rMSSD)], frequency-domain parameters [i.e., high-frequency power (HF), low-frequency power (LF), and low-frequency/high-frequency ratio (LF/HF)] and DC were automatically specifically calculated via commercial software (H-Scribe Analysis System, Mortara Instrument, Inc., Milwaukee, WI, USA) as shown in a previous reference (11, 12). Frequency domain parameters yield a more accurate and detailed quantification of heart rate than time domain parameters (13, 14). Morevore, the predictive value of LF/HF may be superior to other parameters of HRV (15–17). DC analysis is divided into three steps. First, the RR scatter plot shows the scatter of the full range of beat-to-beat RR intervals, from which the starting time for analysis is selected. The analysis length and number of cardiac cycles were then chosen, with the analysis length generally defaulting to a full 24 h. Finally, the X (0), X (1), X (- 1), and X (- 2) values reflected in the heart rate deceleration curve were substituted into the formula DC = [x (0) + X (1) + X (- 1) + X (- 2)]/4 to compute the 24 h DC, and the resulting unit was ms.
GRACE Score
The GRACE score was calculated at discharge to predict 6-month mortality (https://www.outcomes-umassmed.org/grace). The parameters of the GRACE score include age, heart rate, systolic blood pressure on arrival, creatinine level, percutaneous transluminal coronary intervention (PCI) during in-hospital period, coronary artery bypass grafting (CABG) during in-hospital period, previous myocardial infarction (MI), ST-segment depression, increased levels of cardiac enzyme/marker and congestive heart failure.
Follow-Up
The average time to follow-up was 43.78 months. Patients were discharged, and follow-up was conducted through an outpatient follow-up or telephone follow-up. At the end of the follow-up, a total of 21 cases (6.1%) were lost, and 323 patients (93.9%) were followed to the end. The clinical endpoint of our study was a composite endpoint clinical events of major adverse cardiovascular events (MACEs), including death and non-fatal myocardial infarction. Two experienced physicians adjudicated the endpoint events according to medical record reviewing.
Statistical Analysis
Continuous variables are represented by a mean plus a standard deviation (SD) or as the median with interquartile range (IQR) determined by skewness, whereas categorical variables are summarized as frequencies and percentages. All participants were stratified into three groups based on their DC [low-risk group (DC > 4.5 ms), intermediate-risk group (DC > 2.5 ms, and DC ≤ 4.5 ms), and high-risk group (DC ≤ 2.5 ms)]. Differences between groups were analyzed with one-way analysis of variance (ANOVA), the Mann–Whitney U test or the Kruskal–Wallis test depending on the normality of the distribution. Categorical variables were analyzed with the chi square (χ2) test. Survival free from MACEs was analyzed by the Kaplan–Meier method. Final covariates were age, sex, past history and laboratory results according to the results of the pre-survey. We used univariate Cox regression analyses first performed to determine the potential predictors of MACEs, followed by multivariate Cox analyses of significant variables with a p-value < 0.05 to improve the accuracy of the conclusions. Differences were considered statistically significant at p < 0.05. Statistical analysis was performed with SPSS software (version 23; SPSS).
The predictability of MACEs using DC, GRACE score and GRACE score combine with DC by receiver operator characteristic (ROC) curve analysis. We compared whether adding DC to the GRACE score would enhance the discriminative and reclassification capabilities of the models. The fit of each nested model was compared via the χ2 likelihood ratio test to assess whether the logistic regression model that integrated DC and the postdischarge GRACE score supported a significantly better fit than the model including the GRACE score alone. Comparison of the nested and non-nested models, including the GRACE score or DC or LF/HF added to the GRACE score, was weighted by calculating the corrected Akaike's information criterion (AICc), delta-AICc (δ AICc), and Akaike weights (wi) to represent the probability that a given model was the best predictive model in the set (18).
Predicted probabilities (%) of MACEs were generated by logistic regression models using the GRACE score alone and the GRACE score combined with LF/HF or DC. The addition of DC and LF/HF to the existing models with the GRACE score was evaluated with the predicted probabilities of MACEs implementing multiple methods of improvement in discrimination: increase in the area under the receiver operating characteristic curve (AUC), category-free continuous net reclassification improvement (cNRI>0) and integrated discrimination improvement (IDI). Given the presence of missing specific predefined clinical risk thresholds for the models containing the GRACE score, categorical NRI was not employed. The net percentage of patients with the event of interest correctly assigned a higher predicted risk was defined as the event NRI (NRIe), and the net percentage of persons without the event of interest correctly assigned a lower predicted risk was defined as the non-event NRI (NRIne). Total NRI was defined as the sum of the net percentages of persons with and without the events of interest correctly assigned a different predicted risk. The IDI was equal to the enhancement in discrimination slope defined as the mean difference in predicted risks between those with and without events. The IDI was equal to the difference in the initial and updated models in the discrimination slope formed between the mean predicted probabilities (%) of patients with and without events.
Results
Clinical Baseline Characteristics
The baseline features of all of the enrolled ACS patients classified into three groups according to the DC value are presented in Table 1. Our results indicated that patients with lower DC (≤2.5 ms) were likely to be older (p < 0.001) and have non-ST-elevation ACS (NSTE-ACS) (p = 0.004); higher creatinine levels (p = 0.047), glucose levels (p = 0.032) and average heart rate (p < 0.001); lower esti mated glomerularfiltrationrate (eGFR) (p = 0.016), SDNN (p < 0.001), rMSSD (p < 0.001), Pnn50 (p < 0.001), LF (p < 0.001), HF (p < 0.001), and LF/HF (p = 0.031); a higher GRACE score (p < 0.001) and GRACE risk (p = 0.001); history of MI (p = 0.021); and increased creatine kinase-MB (CK-MB) levels (p = 0.034) and incidence of MACEs (p < 0.001).
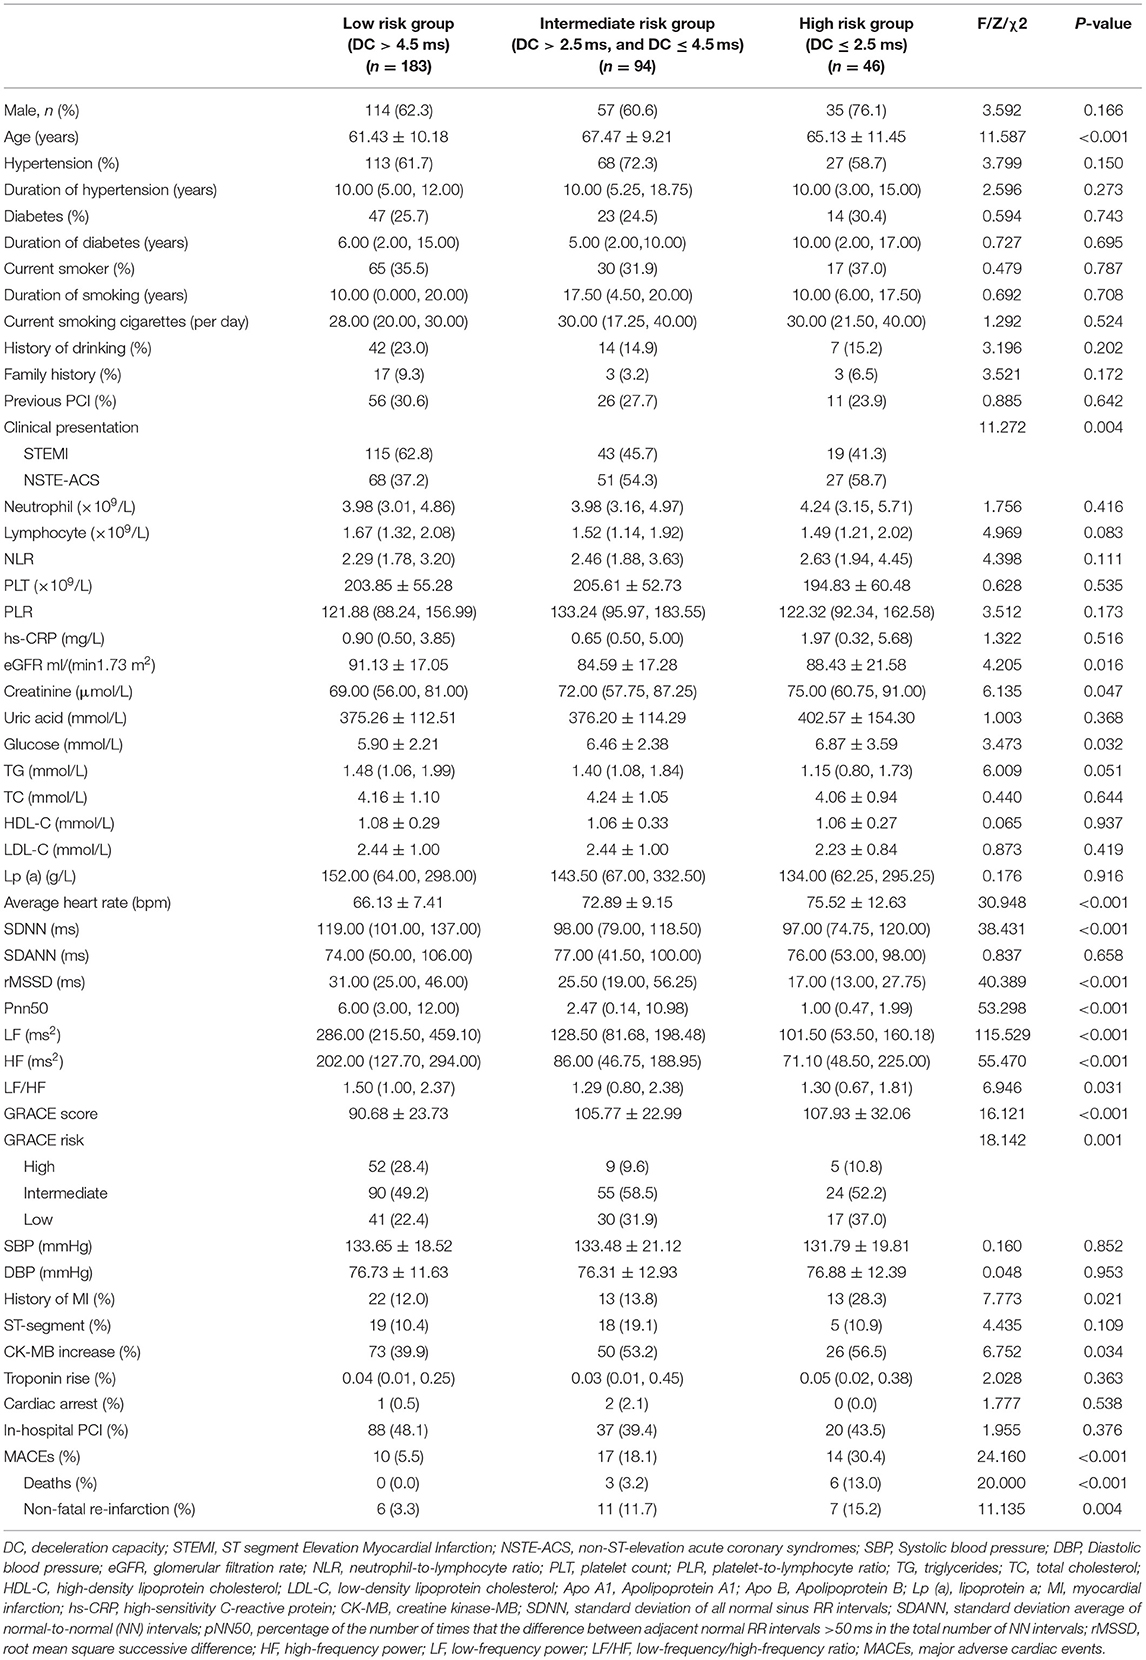
Table 1. Baseline characteristics of the study population categorized by deceleration capacity (DC).
The Relationship Between DC and MACEs
The incidence of MACEs among the patients with ACS in this study was collected over an average follow-up of 43.78 months. Forty-one patients experienced MACEs, including 10 patients in the low-risk group (5.5%, n = 183), 17 patients in the intermediate-risk group (18.1%, n = 94), and 14 patients in the high-risk group (30.4%, n = 46). Kaplan–Meier analysis indicated that the incidence of MACEs was significantly different among patients with ACS based on DC values (χ2 = 26.089, p < 0.001, Figure 2). Besides patients in the high-risk group had a higher incidence of MACEs than those in the intermediate-risk and low-risk groups. In addition, those with intermediate risk were more susceptible to MACEs than those with low risk (p < 0.05).
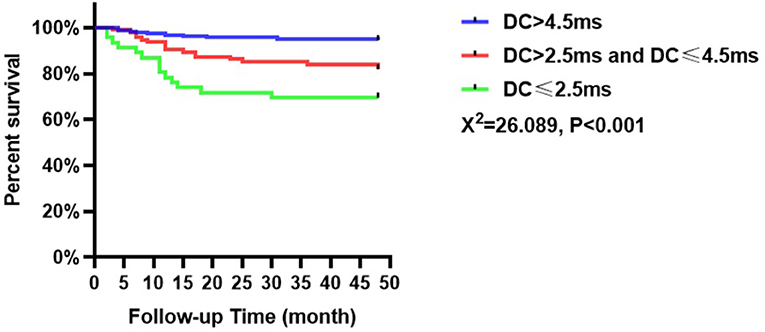
Figure 2. Cumulative survival of MACEs in patients with ACS based on the DC value.
Predictors of MACEs
Univariate Cox analysis showed that history of MI, NSTE-ACS, neutrophil-to-lymphocyte ratio (NLR), platelet-to-lymphocyte ratio (PLR), creatinine, lipoprotein a [Lp (a)], DC, and GRACE score (all p < 0.05) were potential predictors of MACEs in patients with ACS (Table 2). Multivariate Cox analysis consistently showed that DC (HR: 0.885, 95% CI: 0.831–0.943, p < 0.001) and the GRACE score (HR: 1.020, 95% CI: 1.007–1.034, p = 0.002) were risk factors for MACEs at the final follow-up (Table 2).
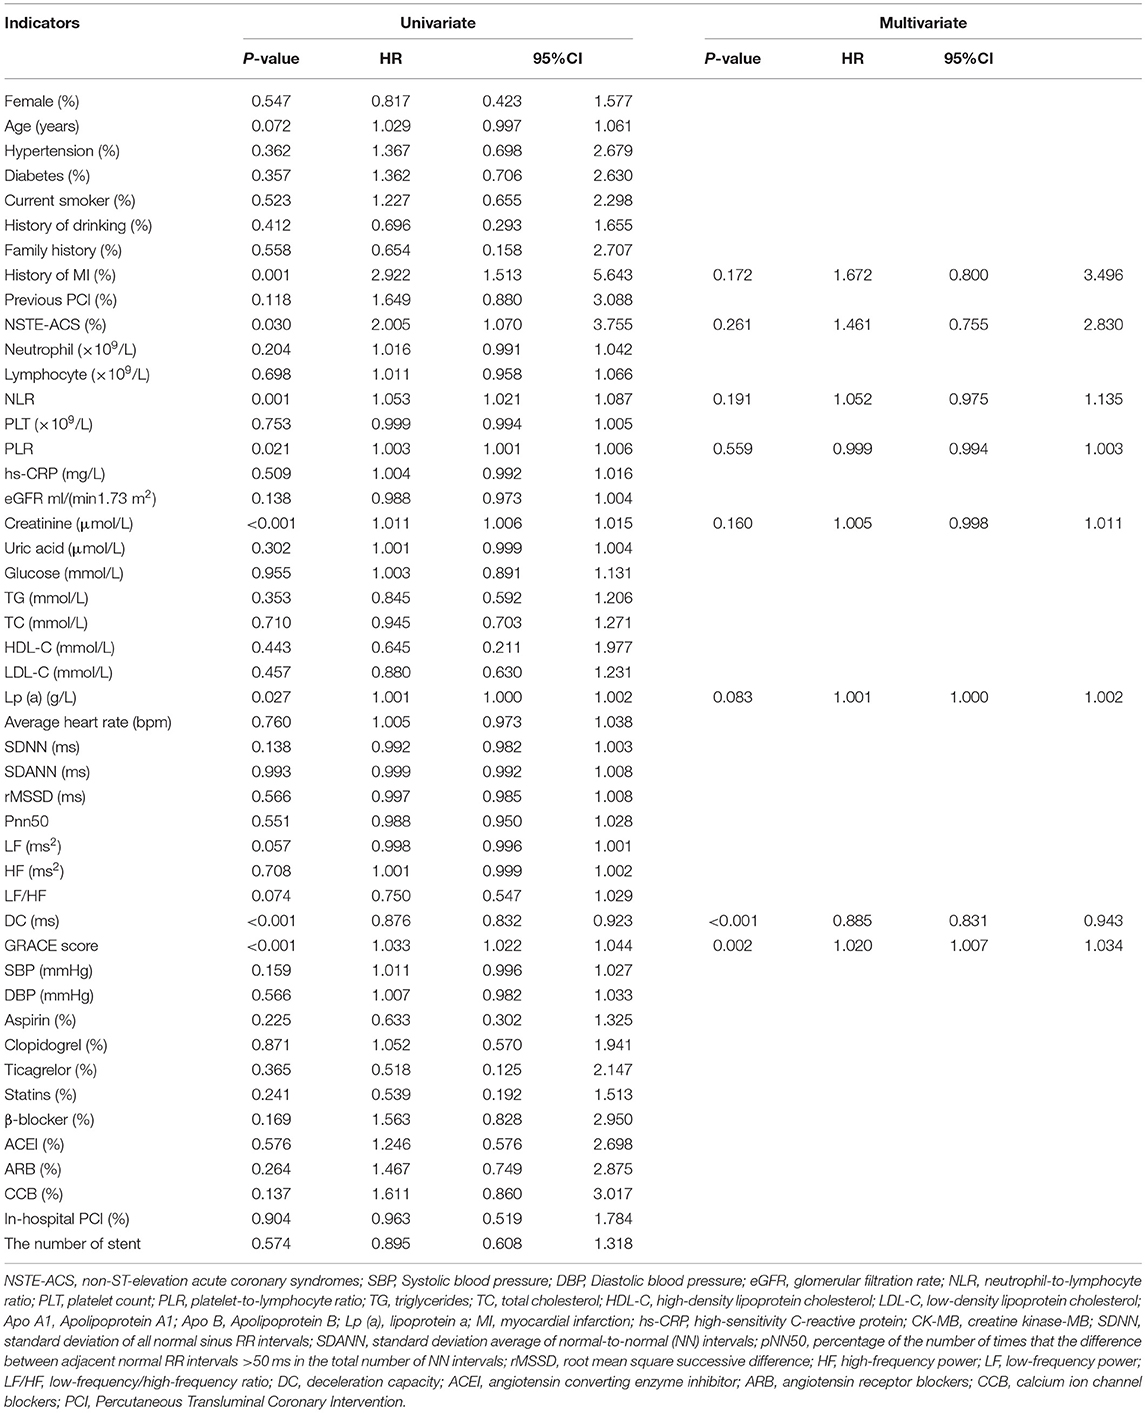
Table 2. Predictors of the occurrence of major adverse cardiovascular events (MACEs) in patients with acute coronary syndrome (ACS): results of univariate and multivariate cox-regression analyses.
Moreover, subgroup analysis was based on STEMI and NSTE-ACS patients. Univariate Cox analysis showed that PLR, NLR, high-sensitivity C-reactive protein (hs-CRP), DC, and GRACE score (all p < 0.05) were predictors of MACEs for all of the evaluated STEMI patients, as shown in Table 3. Furthermore, for all of the evaluated STEMI patients, independent influencing factors for the incidence of MACEs included DC (HR: 0.901, 95% CI: 0.828–0.981, p = 0.016) and the GRACE score (HR: 1.024, 95% CI: 1.001–1.048, p = 0.043) according to multivariate Cox analysis (Table 3).
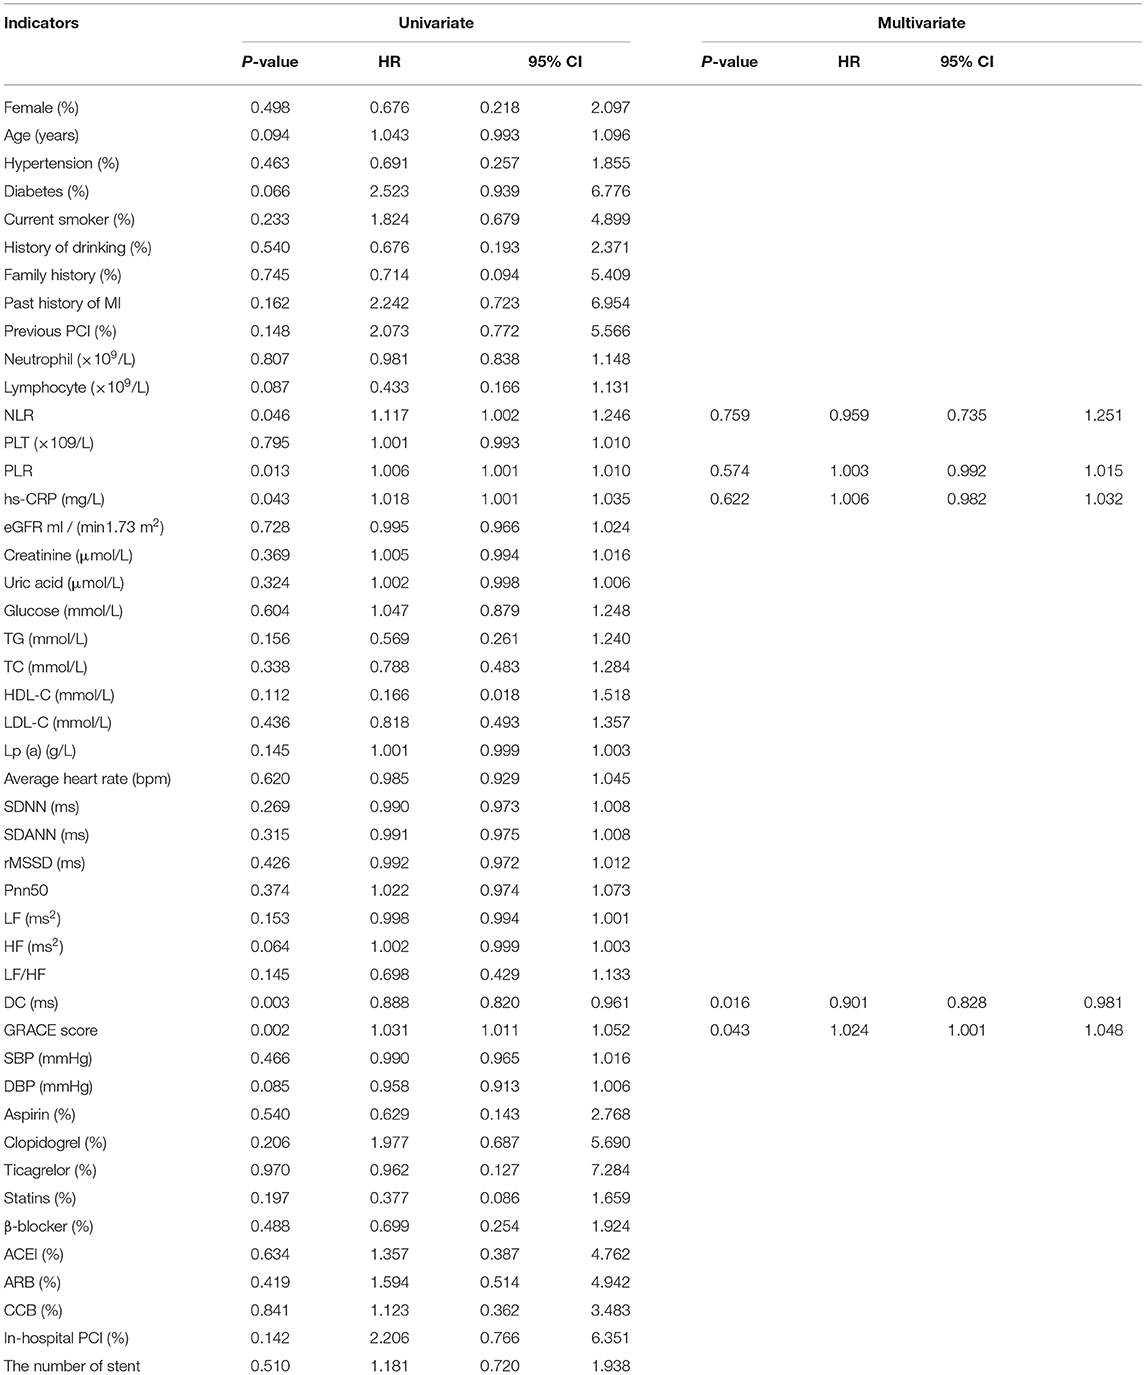
Table 3. Predictors of the occurrence of MACEs in patients with ST- segment Elevation Myocardial Infarction (STEMI): results of univariate and multivariate Cox-regression analyses.
Subsequent univariate Cox analysis further indicated that previous MI, NLR, creatinine, DC, GRACE score, and systolic blood pressure (SBP) (all p < 0.05) were potential predictors of MACEs among patients with NSTE-ACS, as shown in Table 4. For all of the evaluated NSTE-ACS patients, multivariate Cox analysis indicated that NLR (HR: 1.041, 95% CI: 1.000–1.084, p = 0.048), creatinine (HR: 1.013, 95% CI: 1.003–1.024, p = 0.011), DC (HR: 0.894, 95% CI: 0.811–0.986, p = 0.025), GRACE score (HR: 1.019, 95% CI: 1.002–1.036, p = 0.024), and SBP (HR: 1.034, 95% CI: 1.015–1.053, p < 0.001) were independent predictors for MACEs (Table 4).
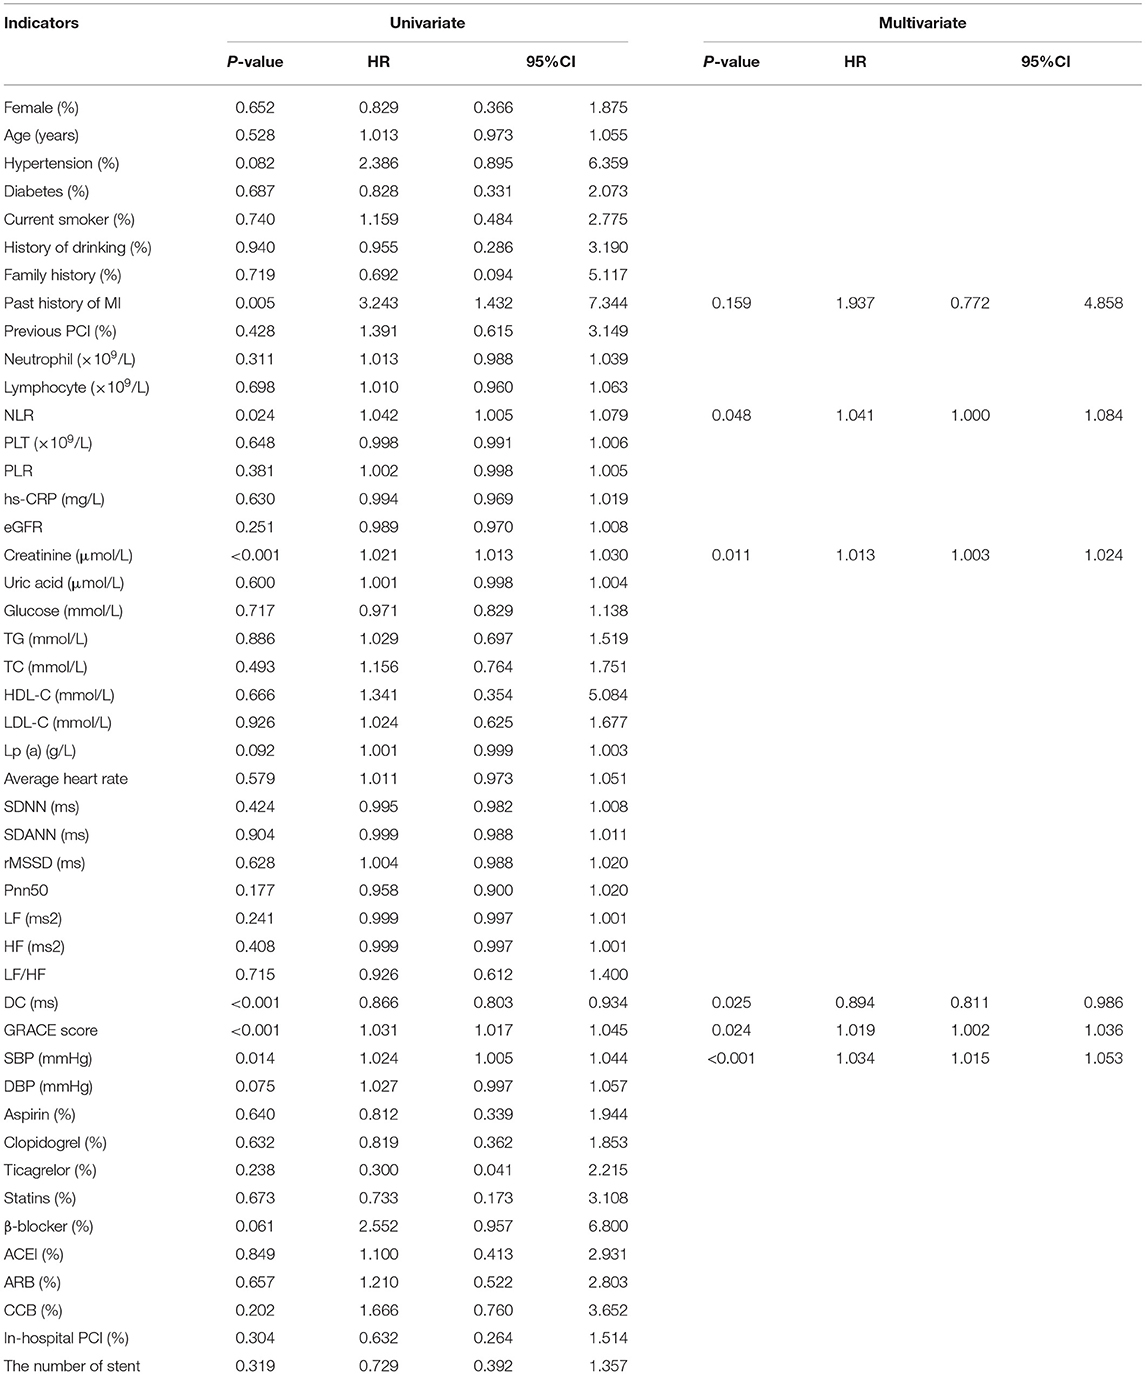
Table 4. Predictors of the occurrence of MACEs in patients with Non-ST segment elevation myocardial infarction/ unstable angina (NSTEMI/UA): results of univariate and multivariate Cox-regression analyses.
To assess whether models that included the GRACE score combined with DC or LF/HF presented a significantly better fit than those limited to the GRACE score alone, we compared nested models using the likelihood-ratio test. Our results demonstrated that the addition of DC (χ2 = 9.227, df = 1, p < 0.001) significantly enriched the predictive power of the existing model including the GRACE score to predict the incidence of MACEs (Table 5). In addition, the inclusion of LF/HF (χ2 = 0.329, df = 1, p = 0.416) did not optimize the model fit.
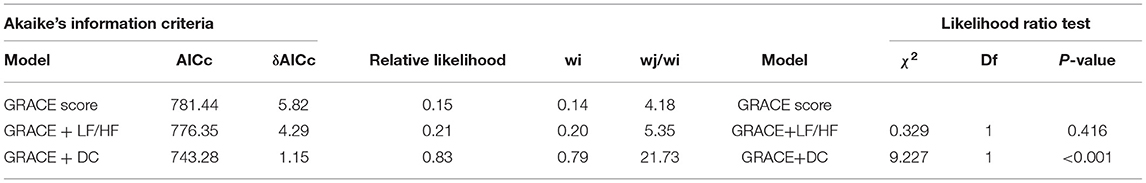
Table 5. Akaike's information criteria and likelihood ratio test to determine the best fitting model for prediction MACEs.
The model including the GRACE score and DC had the lowest AICc and the highest Akaike's weight compared to the other two models, GRACE score alone and GRACE score with LF/HF (Table 5).
DC, but not LF/HF, combined with the GRACE score could improve the net reclassification of the updated model in predicting MACEs at the last follow-up date (Table 6, Central illustration). Employing continuous NRI (NRI>0), DC enhanced reclassification by 7.3% for patients with MACEs and by 12.8% for patients without MACEs, demonstrating a significant overall improvement in net reclassification (NRI 0.200, p = 0.003). Entering DC into a logistic regression model including the GRACE score appeared to predict a lower risk of MACEs than the GRACE score alone in both the MACE and MACE-free survival groups. The addition of LF/HF did not improve reclassification (NRI 0.04, p = 0.573). The addition of DC, but not LF/HF to the established model including the GRACE score promoted integrated discrimination, as evident in Table 6, Figure 3. Moreover, our results generated an IDI of 1.04%, p < 0.001.
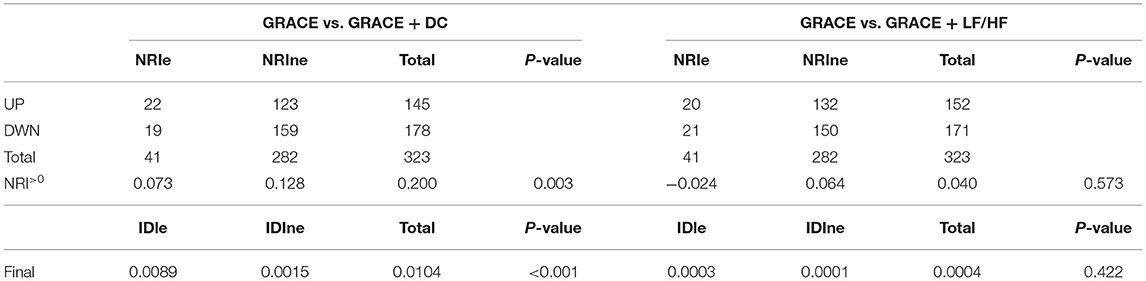
Table 6. Net reclassification improvement for model improvement with the addition of DC or LF/HF to GRACE.
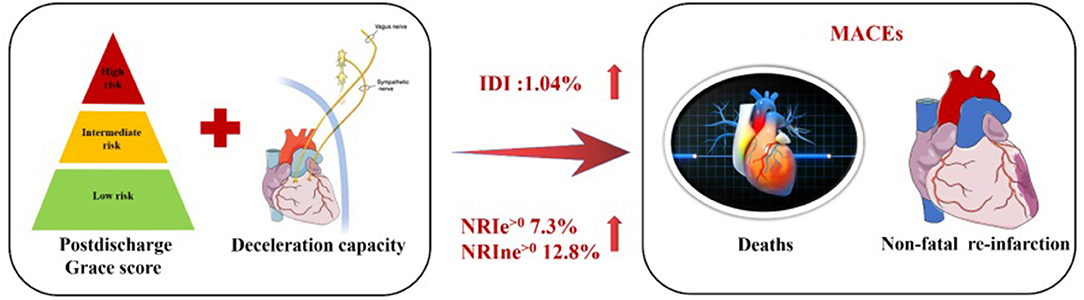
Central illlustration. Combined efficacies of DC and postdischarge GRACE score for risk stratification in patients with ACS.
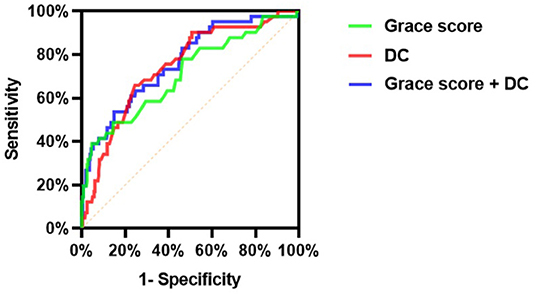
Figure 3. Comparison of discrimination and reclassification abilities of predictive models for MACEs (Model 1: Grace score; Model 2: DC; Model 3: Grace score + DC).
As presented in Figure 3, the c-statistic was 0.711 (95% CI 0.619–0.804, p < 0.001) for model 1 including the GRACE score only and 0.746 (95% CI 0.668–0.824, p < 0.001) for model 2 containing DC only. However, it was 0.765 (95% CI 0.686–0.844, p < 0.001) for the model including the GRACE score and DC (Table 7). For the prediction of MACEs, the positive c-statistic of the combined GRACE score was significantly improved in model 3 (AUC: 0.765; c-statistic: 0.783; 95% CI: 0.686–0.844; p < 0.001).
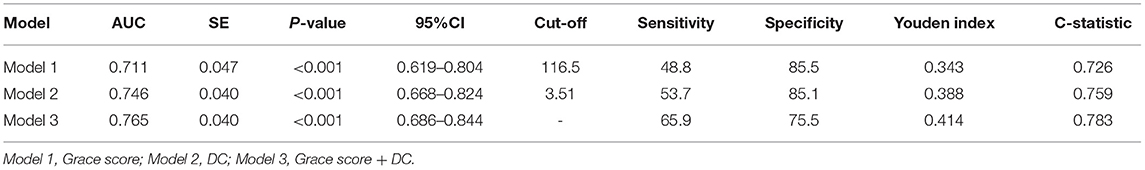
Table 7. ROC analysis comparing the predictive efficacies of related variables for the incidence of MACEs during follow up.
Discussion
Our studies now demonstrate that for ACS patients, wearable monitoring of cardiac ANS-related modulations by means of 24-h DC yields prognostic information beyond the known risk predictors. DC significantly optimizes risk stratification by the GRACE score concerning the prediction of MACEs during long-term follow-up. The prediction model including the postdischarge GRACE score and DC provided incremental prognostic information for long-term cohorts with established ACS. Furthermore, adding DC, rather than LF/HF, to the GRACE score could effectively improve the ability and accuracy of the GRACE score alone to predict MACEs after ACS.
Accumulating evidence supports the notion that the GRACE score provides valuable and independent prognostic information for ACS and enriches reliable risk stratification for identifying whether performing early PCI will benefit patients with ACS (3, 4, 19). In addition, previous study indicated that the GRACE score could predict short-term and long-term prognosis for ACS patients (20, 21). Although it is well established that the strong and effective prognostic value of the GRACE score has been confirmed by much evidence (3, 4, 19–21), early risk stratification remains urgently needed for further optimization, especially for low-risk patients with ACS. Therefore, previous studies have recently explored ways to improve the predictability of the prognostic GRACE score, including adding NT-pro-BNP (22), 2-h postload plasma glucose (23), plasma glucose blood inflammation-related indicators (24), plasma myeloperoxidase and trimethylamine N-oxide (25), serum acid uric acid (26) and nutritional risk index (27) to the GRACE score. The findings indicate that blood biochemical indexes and biomarkers provide incremental prognostic information for the predictive capacity of the GRACE score-based prognostic models. However, few studies have specifically focused on non-invasive markers and the GRACE score together to assess the joint prognostic effect.
Notably, the routine detection index of 24-h DC has also been considered to be a useful means for the screening and surveillance of high-risk post-MI patients (8). Moreover, our data are consistent with the finding that autonomic nervous system (ANS) imbalance carries a high risk for acute adverse events (28–30). The difference in risk between STEMI and NSTE-ACS may be explained by the different pathogenesis of the two diseases (31, 32). Therefore, our available data further demonstrated that DC remains an effective predictor in STEMI or NSTE-ACS.
In addition, other non-invasive indicators for the assessment of cardiac autonomic nerve function include HRV (7) and heart rate turbulence (33). However, heart rate turbulence and HRV indirectly reflect ANS modulation due to their poor stability, which limits their application in clinical practice (34–36). Nevertheless, DC is not susceptible to external interference and can reflect parasympathetic activity. Thus, in our study, DC, rather than LF/HF, could effectively increase the predictive capability of the postdischarge GRACE score-based prognostic models. A retrospective study that enrolled 1,821 patients with suspected ACS indicated a positive and independent correlation between short-term DC and short-term mortality among patients with suspected ACS (9). However, another study focused on the association between short-term DC combined with the admission GRACE score and short-term mortality, rather than the potential association between the 24-h DC combined with postdischarge GRACE score and long-term MACEs, which previously limited our understanding of the insights into the potential association between integration of the 24-h DC and postdischarge GRACE score and long-term poor outcomes. In addition, we used the 24-h Holter recordings to estimate the 24-h DC, which has been used as a daily clinical indicator in our practice. Additionally, patient's restrictively selected in the current study to minimize the impact of confounding factors on DC. Furthermore, we found that DC combined with the postdischarge GRACE score may reflect the interactions between ANS imbalance and adverse events, which may better predict poor long-term ensuing episodes of ACS. Given the recent increasing interest in individualized therapy for risk assessment, we believe that DC provides early valuable information for lifestyle modifications and monitoring of patients with ACS.
Physiologically, the ANS plays a crucial role in maintaining and promoting cardiac physiological function (37, 38). Pathologically, increasing research has confirmed that the context of acute myocardial ischemia could trigger an organismal stress response, induce cardiac sympathetic hyperactivity and suppress vagal activity, subsequently leading to coronary constriction, especially culprit vessel vasoconstriction, thus accelerating focal ischemia and hypoxia and causing the deterioration of myocardial ischemia (34, 39). In addition, previous clinical and basic research has shown that the vagus nerve of the ANS is involved in the regulation of the inflammatory response (40, 41), and the potential link among the ANS, inflammation and coronary artery physiology was confirmed by our previous studies (42, 43). Furthermore, our data confirmed that injured cardiac autonomic nerves in the setting of myocardial ischemia subsequently developed an elevated risk of MACEs after ACS. Therefore, we believe that the combination of DC and the GRACE score could enhance risk discrimination and provide important incremental prognostic information for long-term follow-up after ACS.
Study Limitations
First, due to the purely retrospective observational design with long-term follow-up, our results were almost inevitably affected by recall bias and lost follow-up (44, 45). Second, this study has a small sample size and likely suffered from a lack of power. Our findings should be validated with larger samples and prospective studies in the future. Third, our study did not include coronary physiology, which might improve the predictive power when combined with DC and postdischarge GRACE scores. Thus, many known confounding factors were eliminated, but there was no guarantee about other unknown confounding factors. Finally, because it was a purely observational study, whether individualized and comprehensive therapy based on DC-optimized risk models translates into better outcomes remains to be established. Finally, we included only patients wih sinusrhythm, and the influence of the non-sinus rhythm in patients with ACS remains to be seen.
Conclusions
Our study indicates that wearable devices that automatically evaluate the cardiac ANS by means of the 24-h DC value tend to be a useful risk-stratified indicator for MACEs among ACS patients, regardless of the type of ACS. Moreover, DC further optimized the GRACE score, which has long been regarded as the gold standard for quantitative risk assessment after ACS, providing increased discriminatory ability and accuracy for prognostic information. Where applicable, we highlight that attention should be given to implementing DC as part of comprehensive cardiovascular evaluation and clinical decision-making to enable us to design individualized prognostic therapies.
Data Availability Statement
The datasets used and/or analyzed during this study are available from the corresponding author on reasonable request. Requests to access these datasets should be directed to LY, bGlsZWl5dUB3aHUuZWR1LmNu.
Ethics Statement
Ethical approval was not provided for this study on human participants because this was a retrospective observational study, the Renmin Hospital of Wuhan University Ethics Committee granted an exemption from requiring ethics approval and informed consent from eligible patients was waived. The Ethics Committee waived the requirement of written informed consent for participation.
Author Contributions
LY and HJ: substantial contributions to conception and design, data acquisition, or data analysis, and interpretation. LS, CL, JS, QD, YiW, ZZ, FG, LZ, YuW, and WT: drafting the article or critically revising it for important intellectual content. SD, JW, and FY: final approval of the version to be published and agreement to be accountable for all aspects of the work in ensuring that questions related to the accuracy or integrity of the work are appropriately investigated and resolved. All authors contributed to the article and approved the submitted version.
Funding
National Natural Science Foundation of China [81871486, 81970287, and 82100530].
Conflict of Interest
The authors declare that the research was conducted in the absence of any commercial or financial relationships that could be construed as a potential conflict of interest.
Publisher's Note
All claims expressed in this article are solely those of the authors and do not necessarily represent those of their affiliated organizations, or those of the publisher, the editors and the reviewers. Any product that may be evaluated in this article, or claim that may be made by its manufacturer, is not guaranteed or endorsed by the publisher.
Abbreviations
GRACE, Global Registry of Acute Coronary Events; CABG, coronary artery bypass grafting; PCI, Percutaneous Transluminal Coronary Intervention; ACS, acute coronary syndromes; STEMI, ST segment Elevation Myocardial Infarction; NSTE-ACS, non-ST-elevation acute coronary syndromes; MI, myocardial infarction; SBP, Systolic blood pressure; DBP, Diastolic blood pressure; eGFR, glomerular filtration rate; NLR, neutrophil-to-lymphocyte ratio; PLT, platelet count; PLR, platelet-to-lymphocyte ratio; TG, triglycerides; TC, total cholesterol; HDL-C, high-density lipoprotein cholesterol; LDL-C, low-density lipoprotein cholesterol; Apo A1, Apolipoprotein A1; Apo B, Apolipoprotein B; Lp (a), lipoprotein a; hs-CRP, high-sensitivity C-reactive protein; CK-MB, creatine kinase-MB; SDNN, standard deviation of all normal sinus RR intervals; SDANN, standard deviation average of normal-to-normal (NN) intervals; pNN50, percentage of the number of times that the difference between adjacent normal RR intervals > 50 ms in the total number of NN intervals; rMSSD, root mean square successive difference; HF, high-frequency power; LF, low-frequency power; LF/HF, low-frequency/high-frequency ratio; DC, deceleration capacity; MACEs, major adverse cardiac events; AUC, receiver-operator characteristic curve; NRI, net reclassification index; IDI, integrated discrimination improvement; IQR, interquartile range.
References
1. Khot UN, Khot MB, Bajzer CT, Sapp SK, Ohman EM, Brener SJ, et al. Prevalence of conventional risk factors in patients with coronary heart disease. JAMA. (2003) 290:898–904. doi: 10.1001/jama.290.7.898
2. Greenland P, Knoll MD, Stamler J, Neaton JD, Dyer AR, Garside DB, et al. Major risk factors as antecedents of fatal and nonfatal coronary heart disease events. JAMA. (2003) 290:891–7. doi: 10.1001/jama.290.7.891
3. Fox KA, Dabbous OH, Goldberg RJ, Pieper KS, Eagle KA, Van de Werf F, et al. Prediction of risk of death and myocardial infarction in the six months after presentation with acute coronary syndrome: prospective multinational observational study (GRACE). BMJ. (2006) 333:1091. doi: 10.1136/bmj.38985.646481.55
4. Eagle KA, Lim MJ, Dabbous OH, Pieper KS, Goldberg RJ, Van de Werf F, et al. A validated prediction model for all forms of acute coronary syndrome: estimating the risk of 6-month postdischarge death in an international registry. JAMA. (2004) 291:2727–33. doi: 10.1001/jama.291.22.2727
5. Bauer A, Barthel P, Müller A, Ulm K, Huikuri H, Malik M, et al. Risk prediction by heart rate turbulence and deceleration capacity in postinfarction patients with preserved left ventricular function retrospective analysis of 4 independent trials. J Electrocardiol. (2009) 42:597–601. doi: 10.1016/j.jelectrocard.2009.07.013
6. Kisohara M, Stein PK, Yoshida Y, Suzuki M, Iizuka N, Carney RM, et al. Multi-scale heart rate dynamics detected by phase-rectified signal averaging predicts mortality after acute myocardial infarction. Europace. (2013) 15:437–43. doi: 10.1093/europace/eus409
7. Tsuji H, Larson MG, Venditti FJ Jr, Manders ES, Evans JC, Feldman CL, et al. Impact of reduced heart rate variability on risk for cardiac events. the framingham heart study. Circulation. (1996) 94:2850–5. doi: 10.1161/01.CIR.94.11.2850
8. Bauer A, Kantelhardt JW, Barthel P, Schneider R, Mäkikallio T, Ulm K, et al. Deceleration capacity of heart rate as a predictor of mortality after myocardial infarction: cohort study. Lancet. (2006) 367:1674–81. doi: 10.1016/S0140-6736(06)68735-7
9. Eick C, Duckheim M, Groga-Bada P, Klumpp N, Mannes S, Zuern CS, et al. Point-of-care testing of cardiac autonomic function for risk assessment in patients with suspected acute coronary syndromes. Clin Res Cardiol. (2017) 106:686–94. doi: 10.1007/s00392-017-1104-3
10. Mendis S, Thygesen K, Kuulasmaa K, Giampaoli S, Mähönen M, Ngu Blackett K, et al. World Health Organization definition of myocardial infarction: 2008-09 revision. Int J Epidemiol. (2011) 40:139–46. doi: 10.1093/ije/dyq165
11. Eick C, Rizas KD, Zuern CS, Bauer A. Automated assessment of cardiac autonomic function by means of deceleration capacity from noisy, nonstationary ECG signals: validation study. Ann Noninvasive Electrocardiol. (2014) 19:122–8. doi: 10.1111/anec.12107
12. Catai AM, Pastre CM, Godoy MF, Silva ED, Takahashi ACM, Vanderlei LCM. Heart rate variability: are you using it properly? standardisation checklist of procedures. Braz J Phys Ther. (2020) 24:91–102. doi: 10.1016/j.bjpt.2019.02.006
13. Wang X, Liu B, Xie L, Yu X, Li M, Zhang J. Cerebral and neural regulation of cardiovascular activity during mental stress. Biomed Eng Online. (2016) 15:160. doi: 10.1186/s12938-016-0255-1
14. Heart rate variability. Standards of measurement, physiological interpretation, and clinical use. task force of the European society of cardiology and the North American society of pacing and electrophysiology. Eur Heart J. (1996) 17:354–81.
15. Hanss R, Bein B, Weseloh H, Bauer M, Cavus E, Steinfath M, et al. Heart rate variability predicts severe hypotension after spinal anesthesia. Anesthesiology. (2006) 104:537–45. doi: 10.1097/00000542-200603000-00022
16. Pan Y, Yu Z, Yuan Y, Han J, Wang Z, Chen H, et al. Alteration of autonomic nervous system is associated with severity and outcomes in patients with COVID-19. Front Physiol. (2021) 12:630038. doi: 10.3389/fphys.2021.630038
17. Filipovic M, Jeger R, Probst C, Girard T, Pfisterer M, Gürke L, et al. Heart rate variability and cardiac troponin I are incremental and independent predictors of one-year all-cause mortality after major noncardiac surgery in patients at risk of coronary artery disease. J Am Coll Cardiol. (2003) 42:1767–76. doi: 10.1016/j.jacc.2003.05.008
18. Wagenmakers EJ, Farrell S. AIC model selection using Akaike weights. Psychon Bull Rev. (2004) 11:192–6. doi: 10.3758/BF03206482
19. Elbarouni B, Goodman SG, Yan RT, Welsh RC, Kornder JM, Deyoung JP, et al. Validation of the global registry of acute coronary event (GRACE) risk score for in-hospital mortality in patients with acute coronary syndrome in Canada. Am Heart J. (2009) 158:392–9. doi: 10.1016/j.ahj.2009.06.010
20. Raposeiras-Roubín S, Abu-Assi E, Cambeiro-González C, Álvarez-Álvarez B, Pereira-López E, Gestal-Romaní S, et al. Mortality and cardiovascular morbidity within 30 days of discharge following acute coronary syndrome in a contemporary European cohort of patients: How can early risk prediction be improved? the six-month GRACE risk score. Rev Port Cardiol. (2015) 34:383–91. doi: 10.1016/j.repc.2014.11.020
21. Alnasser SM, Huang W, Gore JM, Steg PG, Eagle KA, Anderson FA Jr, et al. Late consequences of acute coronary syndromes: global registry of acute coronary events (GRACE) follow-up. Am J Med. (2015) 128:766–75. doi: 10.1016/j.amjmed.2014.12.007
22. Onda T, Inoue K, Suwa S, Nishizaki Y, Kasai T, Kimura Y, et al. Reevaluation of cardiac risk scores and multiple biomarkers for the prediction of first major cardiovascular events and death in the drug-eluting stent era. Int J Cardiol. (2016) 219:180–5. doi: 10.1016/j.ijcard.2016.06.014
23. Chattopadhyay S, George A, John J, Sathyapalan T. Adjustment of the GRACE score by 2-hour post-load glucose improves prediction of long-term major adverse cardiac events in acute coronary syndrome in patients without known diabetes. Eur Heart J. (2018) 39:2740–5. doi: 10.1093/eurheartj/ehy233
24. Oncel RC, Ucar M, Karakas MS, Akdemir B, Yanikoglu A, Gulcan AR, et al. Relation of neutrophil-to-lymphocyte ratio with GRACE risk score to in-hospital cardiac events in patients with ST-segment elevated myocardial infarction. Clin Appl Thromb Hemost. (2015) 21:383–8. doi: 10.1177/1076029613505763
25. Tan Y, Zhou J, Yang S, Li J, Zhao H, Song L, et al. Addition of plasma myeloperoxidase and trimethylamine N-Oxide to the GRACE score improves prediction of near-term major adverse cardiovascular events in patients with ST-segment elevation myocardial infarction. Front Pharmacol. (2021) 12:632075. doi: 10.3389/fphar.2021.632075
26. Centola M, Maloberti A, Castini D, Persampieri S, Sabatelli L, Ferrante G, et al. Impact of admission serum acid uric levels on in-hospital outcomes in patients with acute coronary syndrome. Eur J Intern Med. (2020) 82:62–7. doi: 10.1016/j.ejim.2020.07.013
27. Ma XT, Shao QY, Li QX, Yang ZQ, Han KN, Liang J, et al. Nutritional risk index improves the grace score prediction of clinical outcomes in patients with acute coronary syndrome undergoing percutaneous coronary intervention. Front Cardiovasc Med. (2021) 8:773200. doi: 10.3389/fcvm.2021.773200
28. Schwartz PJ, La Rovere MT, Vanoli E. Autonomic nervous system and sudden cardiac death. experimental basis and clinical observations for post-myocardial infarction risk stratification. Circulation. (1992) 85:I77–91.
29. Münzel T, Schmidt FP, Steven S, Herzog J, Daiber A, Sørensen M. Environmental noise and the cardiovascular system. J Am Coll Cardiol. (2018) 71:688–97. doi: 10.1016/j.jacc.2017.12.015
30. Dutta P, Courties G, Wei Y, Leuschner F, Gorbatov R, Robbins CS, et al. Myocardial infarction accelerates atherosclerosis. Nature. (2012) 487:325–9. doi: 10.1038/nature11260
31. McManus DD, Gore J, Yarzebski J, Spencer F, Lessard D, Goldberg RJ. Recent trends in the incidence, treatment, and outcomes of patients with STEMI and NSTEMI. Am J Med. (2011) 124:40–7. doi: 10.1016/j.amjmed.2010.07.023
32. Park HW, Yoon CH, Kang SH, Choi DJ, Kim HS, Cho MC, et al. Early- and late-term clinical outcome and their predictors in patients with ST-segment elevation myocardial infarction and non-ST-segment elevation myocardial infarction. Int J Cardiol. (2013) 169:254–61. doi: 10.1016/j.ijcard.2013.08.132
33. Schmidt G, Malik M, Barthel P, Schneider R, Ulm K, Rolnitzky L, et al. Heart-rate turbulence after ventricular premature beats as a predictor of mortality after acute myocardial infarction. Lancet. (1999) 353:1390–6. doi: 10.1016/S0140-6736(98)08428-1
34. Huikuri HV, Stein PK. Heart rate variability in risk stratification of cardiac patients. Prog Cardiovasc Dis. (2013) 56:153–9. doi: 10.1016/j.pcad.2013.07.003
35. Makai A, Korsós A, Makra P, Forster T, Abrahám G, Rudas L. Spontaneous baroreflex sensitivity and heart rate turbulence parameters: parallel responses to orthostasis. Clin Auton Res. (2008) 18:74–9. doi: 10.1007/s10286-008-0458-z
36. Segerson NM, Wasmund SL, Abedin M, Pai RK, Daccarett M, Akoum N, et al. Heart rate turbulence parameters correlate with post-premature ventricular contraction changes in muscle sympathetic activity. Heart Rhythm. (2007) 4:84–9. doi: 10.1016/j.hrthm.2006.10.020
37. Horackova M, Armour JA. Role of peripheral autonomic neurones in maintaining adequate cardiac function. Cardiovasc Res. (1995) 30:26–35. doi: 10.1016/0008-6363(95)00105-0
38. Dyavanapalli J, Dergacheva O, Wang X, Mendelowitz D. Parasympathetic vagal control of cardiac function. Curr Hypertens Rep. (2016) 18:22. doi: 10.1007/s11906-016-0630-0
39. Schäfer D, Nil M, Herzig D, Eser P, Saner H, Wilhelm M. Good reproducibility of heart rate variability after orthostatic challenge in patients with a history of acute coronary syndrome. J Electrocardiol. (2015) 48:696–702. doi: 10.1016/j.jelectrocard.2015.04.004
40. Williams DP, Koenig J, Carnevali L, Sgoifo A, Jarczok MN, Sternberg EM, et al. Heart rate variability and inflammation: A meta-analysis of human studies. Brain Behav Immun. (2019) 80:219–26. doi: 10.1016/j.bbi.2019.03.009
42. Wang J, Liu W, Chen H, Liu C, Wang M, Chen H, et al. Novel insights into the interaction between the autonomic nervous system and inflammation on coronary physiology: a quantitative flow ratio study. Front Cardiovasc Med. (2021) 8:700943. doi: 10.3389/fcvm.2021.700943
43. Liu C, Yu Z, Chen H, Wang J, Liu W, Zhou L, et al. Relationship between immunoinflammation and coronary physiology evaluated by quantitative flow ratio in patients with coronary artery disease. Front Cardiovasc Med. (2021) 8:714276. doi: 10.3389/fcvm.2021.714276
44. Xiaonan X, Ilir A, Kim Mimi Y, Wang T, Lin J, Ghavamian R, et al. New methods for estimating follow-up rates in cohort studies. BMC Med Res Methodol. (2017) 17:155. doi: 10.1186/s12874-017-0436-z
Keywords: acute coronary syndrome, GRACE score, deceleration capacity, autonomic nerve, long-term prognosis
Citation: Duan S, Wang J, Yu F, Song L, Liu C, Sun J, Deng Q, Wang Y, Zhou Z, Guo F, Zhou L, Wang Y, Tan W, Jiang H and Yu L (2022) Enrichment of the Postdischarge GRACE Score With Deceleration Capacity Enhances the Prediction Accuracy of the Long-Term Prognosis After Acute Coronary Syndrome. Front. Cardiovasc. Med. 9:888753. doi: 10.3389/fcvm.2022.888753
Received: 03 March 2022; Accepted: 01 April 2022;
Published: 27 April 2022.
Edited by:
Jinwei Tian, The Second Affiliated Hospital of Harbin Medical University, ChinaReviewed by:
Liliane Lins-Kusterer, Universidade Federal da Bahia, BrazilXiaoxiang Yan, Shanghai Jiao Tong University, China
Yisong Cheng, Sichuan University, China
Copyright © 2022 Duan, Wang, Yu, Song, Liu, Sun, Deng, Wang, Zhou, Guo, Zhou, Wang, Tan, Jiang and Yu. This is an open-access article distributed under the terms of the Creative Commons Attribution License (CC BY). The use, distribution or reproduction in other forums is permitted, provided the original author(s) and the copyright owner(s) are credited and that the original publication in this journal is cited, in accordance with accepted academic practice. No use, distribution or reproduction is permitted which does not comply with these terms.
*Correspondence: Lilei Yu, bGlsZWl5dUB3aHUuZWR1LmNu; Hong Jiang, aG9uZy1qaWFuZ0B3aHUuZWR1LmNu
†These authors have contributed equally to this work