- 1Department of Clinical Medicine, Queen Mary College of Nanchang University, Nanchang, China
- 2Department of Cardiovascular Medicine, The Second Affiliated Hospital of Nanchang University, Nanchang, China
Background: Existing evidence on the association between blood pressure (BP) and mortality risk in intensive care unit (ICU) patients with atrial fibrillation (AF) is scarce.
Aim: This study aimed to assess the associations between blood pressure (BP) and risks of in-hospital and all-cause mortality in ICU patients with AF.
Methods: A total of 2,345 records of patients with AF whose BP was monitored after admission to the ICU were obtained from the MIMIC-III database. Incidences were calculated for endpoints (hospital mortality, 7-day mortality, 30-day mortality, and 1-year mortality). We performed smooth curve and logistic regression analyses to evaluate the association between BP and the risk of each endpoint.
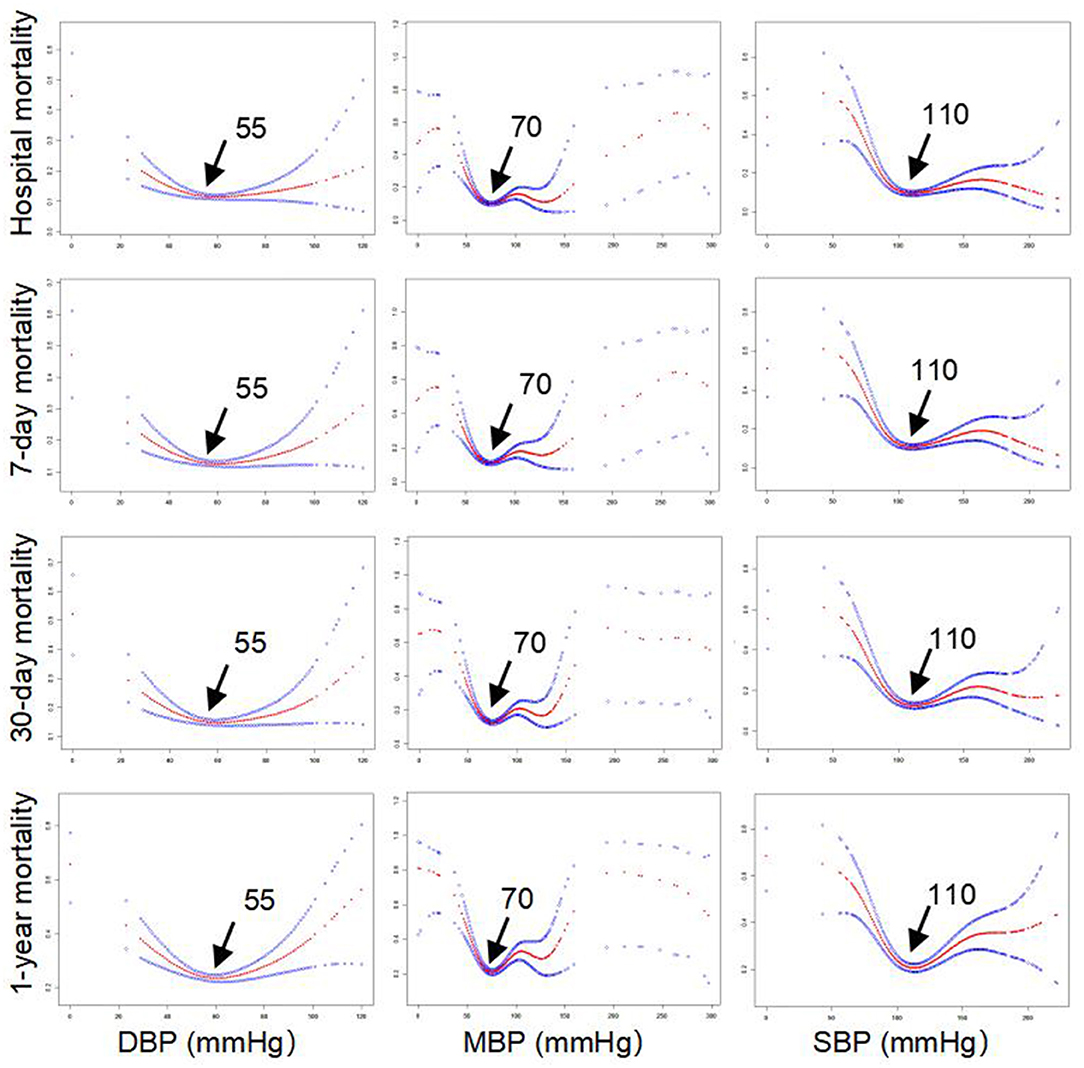
Results: Smooth curve regression showed that systolic blood pressure (SBP), mean arterial pressure (MBP), and diastolic blood pressure (DBP) followed U-shaped curves with respect to endpoints (hospital mortality, 7-day mortality, 30-day mortality, and 1-year mortality). The incidence of these endpoints was lowest at 110/70/55 mm Hg. There was an increased risk of 1-year mortality observed with BP > 110/70/55 mm Hg (SBP, odds ratio [OR] = 1.008, 95% CI 1.001–1.015, p = 0.0022; MBP, OR = 1.010, 95% CI 1.005–1.016, p < 0.001) after adjusting for age, sex, and medical history. In contrast, an inverse association between BP and the risk of 1-year mortality was observed with BP ≤ 110/70/55 mm Hg (SBP, OR = 0.981, 95% CI 0.974–0.988, p < 0.001; MBP OR = 0.959, 95% CI 0.939–0.979, p < 0.001; and DBP, OR = 0.970, 95% CI 0.957–0.983, p < 0.001).
Conclusions: We observed a U-shaped association between BP and in-hospital/all-cause mortality in ICU patients with AF. However, the underlying causes need to be investigated.
Introduction
As a common cardiac arrhythmia, atrial fibrillation (AF) has increased considerably in prevalence in the general population aged ≥65 years (1). Evidence from previous studies has demonstrated that AF strongly contributes to an increased long-term risk of all-cause mortality. Existing studies suggest that demographic characteristics, such as advanced age and male sex; lifestyle factors, such as high body mass index (BMI) and low levels of physical exercise; and history of the disease, such as hypertension, myocardial infarction, valvular disease, heart failure, and diabetes mellitus, are all important factors contributing to AF (2–4). However, hypertension may be more important than other factors (2, 5) due to its high prevalence in the general population. Consequently, hypertension tends to be the most important target in the prevention of AF.
Blood pressure (BP) also has an important effect on mortality. Every 20/10 mm Hg increase in BP doubles cardiovascular risk in seniors with BP >115/75 mm Hg (6, 7). Previous studies have confirmed the strong association between BP and cardiovascular events. For instance, in certain individuals, such as patients with acute coronary syndrome or older adults, a J-shaped association between BP and adverse outcomes has been observed (8, 9). Low BP (<110/70 mm Hg) is related to increased incidence of negative outcomes, with mortality risk lowest at BP values ranging from (130 to 140)/(80 to 90) mm Hg (8). Similar results have also been demonstrated in individuals with stroke and chronic coronary artery disease (CAD) (10–13). However, few studies exist on the association between BP and mortality in specific individuals with AF. Only one study focused only on patients with AF, reporting a U-shaped association of BP with all-cause mortality. Their results showed that the incidence of all-cause mortality was lowest at 140/78 mm Hg (14). These correlative differences may have been due to differences among participants in various demographic characteristics, lifestyles, comorbidities, and different statistical methods.
Patients in the intensive care unit (ICU), as a special department, have high mortality risk, of which patients with AF account for a certain proportion. Reducing the mortality of ICU patients with AF has always been a major clinical objective. However, no study has focused on the association between BP and mortality risk and the optimal BP target in ICU patients with AF (14). Considering the loss of atrial contractility, the optimal value of BP in patients with AF may differ from that in the general population, which would be of great clinical significance for defining thresholds of BP below which adverse events may increase or decline in frequency. Therefore, by using records of patients obtained from the MIMIC-III database, we investigated whether a strong association exists between BP and mortality in ICU patients with AF. Our main objective was to investigate the nonlinear association between BP and mortality (hospital mortality, 7-day mortality, 30-day mortality, and 1-year mortality) in a large cohort of patients with AF and determine the optimal BP at the lowest mortality. Furthermore, we attempted to evaluate the possible effects of age, sex, comorbidity, and medical treatment on the association of BP with mortality, and these confounding factors may be important moderators that few have previously taken into account.
Materials and Methods
The data used in the present study were obtained from the MIMIC-III database (15). Briefly, the MIMIC-III database contains information on 46,520 patients admitted to the Beth Israel Deaconess Medical Center (BIDMC) from 2001 to 2012 (15). The establishment of this freely available database was approved by the Institutional Review Boards (IRBs) of the Massachusetts Institute of Technology (MIT) and BIDMC. The database includes demographic data, laboratory tests, fluid balance data, vital status and blood gas analysis data, discharge summaries, electrocardiography, imaging examinations, and diagnostic information. We included ICU patients diagnosed with AF using diagnosis codes from the International Classification of Diseases, Ninth Revision (ICD-9), and a total of 2,345 patients were considered eligible for inclusion in this study after excluding patients with the absence of important variables. The study was conducted in accordance with the Declaration of Helsinki. This was consistent with the Strengthening the Reporting of Observational Studies in Epidemiology (STROBE) statement (16).
BP and Mortality
The BP was measured and recorded when entering the ICU, and the initial BP record values were further used for analysis in this study. The endpoints of the study were defined as hospital mortality, 7-day mortality, 30-day mortality, and 1-year mortality after the date of ICU admission. Hospital mortality was defined as death during hospitalization in the ICU. Furthermore, the 7-day mortality, 30-day mortality, and 1-year mortality were defined based on the time from the discharge date to the date of death.
Confounding Variables
A large amount of admission information was collected for each patient from MIMIC-III by the Structured Query Language, such as demographic data (age and sex), laboratory results [white blood cell count (WBC), red blood cell count (RBC), platelet count (PLC), hemoglobin, serum creatinine, and blood urea nitrogen], medication records [β receptor blockers (βRBs), statins, nitrates, warfarin, and heparin], and clinical comorbidities [hypertension, chronic heart failure (CHF), valvular disease, chronic kidney disease (CKD), stroke, diabetes, chronic bronchitis, depression, and malignancy].
Statistical Analysis
All statistical analyses in our study were conducted using SPSS 26.0 and EmpowerStats 3.0. Categorical data are presented as percentages, while continuous data are presented as the median (interquartile range, IQR). First, a smooth curve analysis was performed to determine the relationships between BP (systolic blood pressure [SBP], diastolic blood pressure [DBP], and mean arterial pressure [MBP]) and endpoints (hospital mortality, 7-day mortality, 30-day mortality, and 1-year mortality) and to further define the optimal value of BP with the lowest risk of mortality. According to the BP threshold, restrictive logistic regression models were then applied to determine whether BP was independently associated with endpoints (hospital mortality, 7-day mortality, 30-day mortality, and 1-year mortality) after adjusting for potential confounders. The crude model had no adjustment. Model 1 was adjusted for age and gender. Model 2 was adjusted for Model 1 plus CHF, valvular disease, and stroke. Model 3 was adjusted for Model 2 plus CKD, chronic bronchitis, depression, diabetes, and malignancy. Furthermore, interaction analysis was conducted to determine the impacts of belonging in various subgroups, classified by age, sex, CHF, valvular disease, hypertension, and medication (βRBs, statins, nitrates, warfarin, and heparin).
Results
Clinical Characteristics of Patients With AF in the ICU
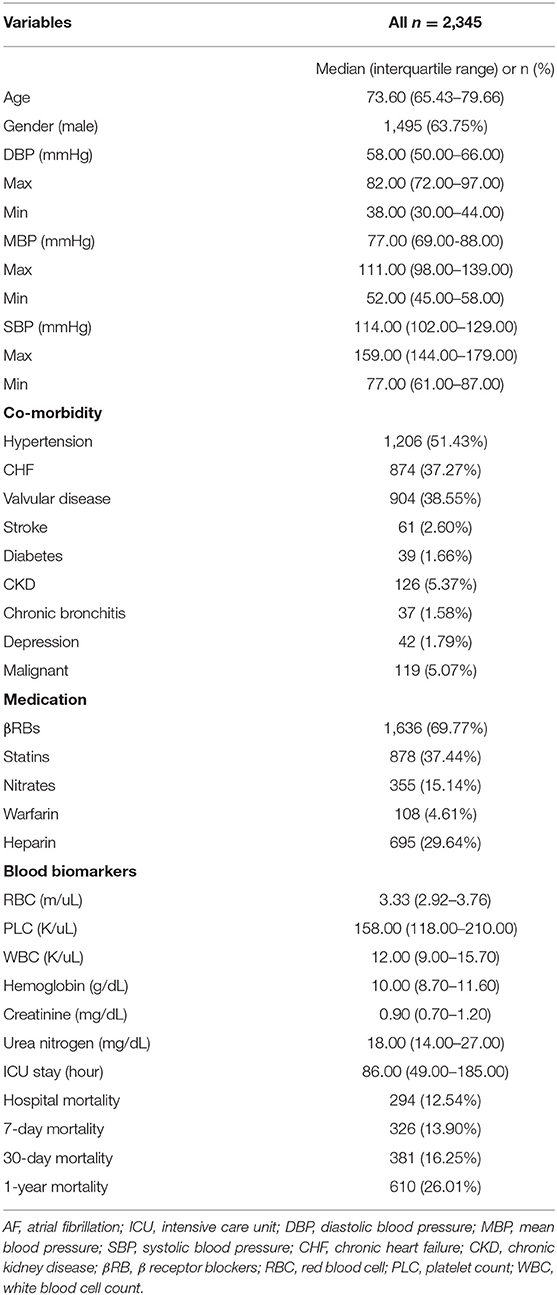
The clinical characteristics of these included patients with AF are presented in Table 1. Their median age was 73.6 years, and the number of men was 1,497 (63.8%). The median levels of SBP, MBP, and DBP were 114, 77, and 58 mm Hg, respectively. The incidence of hospital mortality, 7-day mortality, 30-day mortality, and 1-year mortality was 294 (12.54%), 326 (13.90%), 381 (16.25%), and 610 (26.01%), respectively. Other clinical information, such as comorbidities, medication, and blood biomarkers in the ICU, is also described in Table 1. Importantly, smooth curve analysis showed approximate U-shaped relations of SBP, MBP, and DBP with mortality (hospital mortality, 7-day mortality, 30-day mortality, and 1-year mortality), as shown in Figure 1. The BP levels with the lowest mortality risk, including those for SBP, MBP, and DBP, in these patients with AF were 110, 70, and 55 mm Hg, respectively.
Multivariable Analysis Suggested a Significant Association of DBP With Mortality Stratified by the DBP Value With the Lowest Mortality Risk (55 mm Hg)
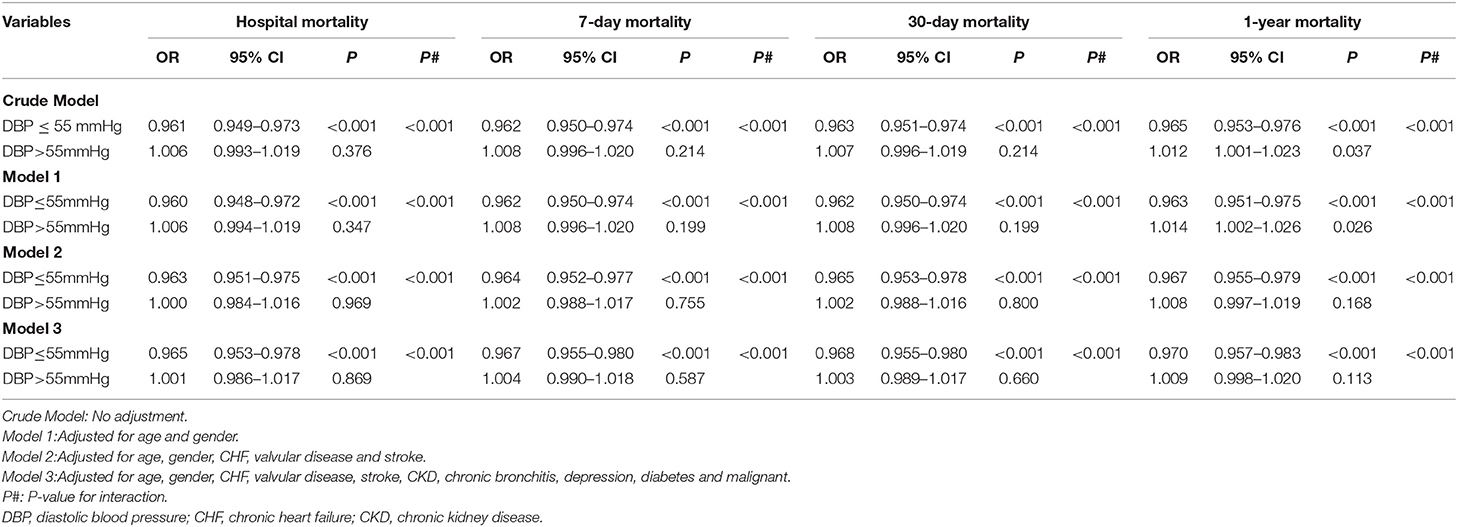
Based on the lowest of the BP thresholds reported above, stratified analysis was performed to evaluate the associations of DBP with mortality in our study. As shown in Table 2, increased DBP levels were associated with reduced risks of hospital mortality (odds ration [OR] = 0.961, 95% CI 0.949–0.973, p < 0.001, crude model), 7-day mortality (OR = 0.962, 95% CI 0.950–0.974, p < 0.001, crude model), 30-day mortality (OR = 0.963, 95% CI 0.951–0.975, p < 0.001, crude model), and 1-year mortality (OR = 0.965, 95% CI 0.953–0.976, p < 0.001, crude model) in AF patients with DBP ≤ 55 mm Hg. However, in patients with DBP > 55 mm Hg, increased DBP levels were only associated with the increased risk of 1-year mortality (OR = 1.012, 95% CI 1.001–1.023, p = 0.037, crude model) and not with those of hospital mortality (OR = 1.006, 95% CI 0.993–1.019, p = 0.376, crude model), 7-day mortality (OR = 1.008, 95% CI 0.996–1.020, p = 0.214 crude model), or 30-day mortality (OR = 1.007, 95% CI 0.996–1.019, p = 0.214, crude model). Importantly, the interactions (all values of p < 0.001) of hospital mortality, 7-day mortality, 30-day mortality, and 1-year mortality with the BP threshold (separating patients into a group with DBP ≤ 55 mm Hg and a group with DBP > 55 mm Hg) were significant. Furthermore, after adjusting for confounding factors, such as age, sex, CHF, valvular disease, stroke, CKD, chronic bronchitis, depression, diabetes, and malignancy, these independent associations in Model 3 were only slightly changed, and significant interactions for hospital mortality, 7-day mortality, 30-day mortality, and 1-year mortality still existed.
Multivariable Analysis Suggested a Significant Association of MBP With Mortality Stratified by the MBP Value With the Lowest Mortality Risk (70 mm Hg)
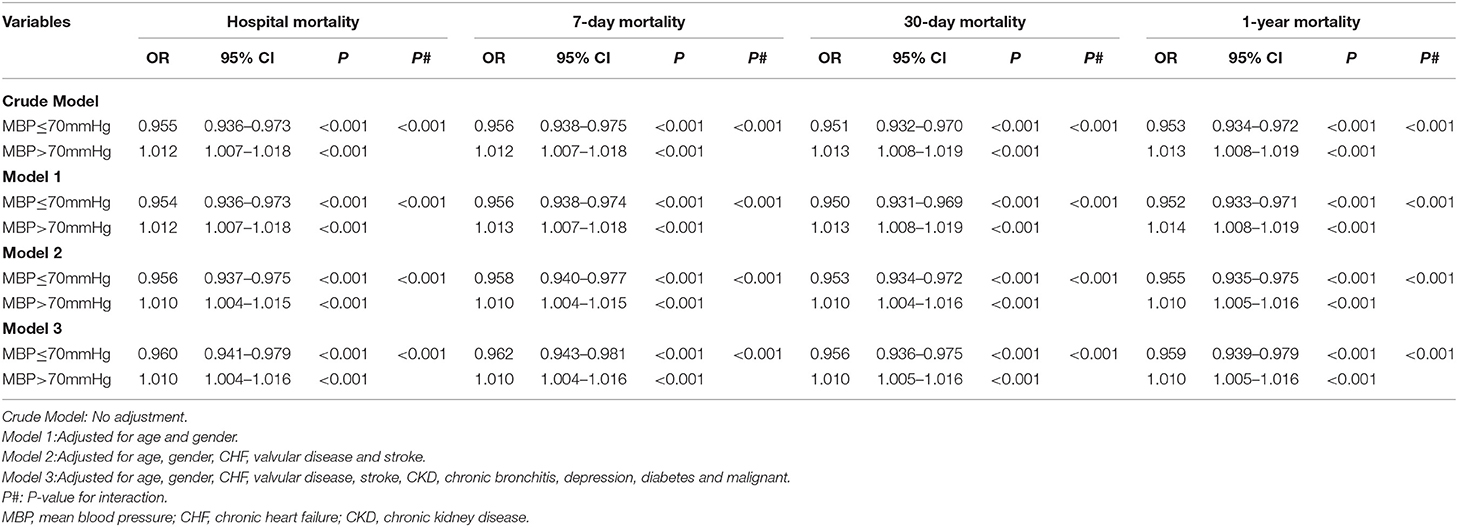
As shown in Table 3, higher MBP levels were related to reduced risks of hospital mortality (OR = 0.955, 95% CI 0.936–0.973, p < 0.001, crude model), 7-day mortality (OR = 0.956, 95% CI 0.938–0.975, p <0.001, crude model), 30-day mortality (OR = 0.951, 95% CI 0.932–0.970, p < 0.001, crude model), and 1-year mortality (OR = 0.953, 95% CI 0.934–0.972, p < 0.001, crude model) in AF patients with MBP ≤ 70 mm Hg. However, in patients with MBP > 70 mm Hg, higher MBP levels were associated with increased risks of hospital mortality (OR = 1.012, 95% CI 1.007–1.018, p < 0.001, crude model), 7-day mortality (OR = 1.012, 95% CI 1.007–1.018, p < 0.001, crude model), 30-day mortality (OR = 1.013, 95% CI 1.008–1.019, p < 0.001, crude model), and 1-year mortality (OR = 1.013, 95% CI 1.008–1.019, p < 0.001, crude model). Similarly, these independent associations in Model 3 were changed only slightly, and significant interactions with hospital mortality, 7-day mortality, 30-day mortality, and 1-year mortality still existed after adjusting for confounding factors, such as age, sex, CHF, valvular disease, stroke, CKD, chronic bronchitis, depression, diabetes, and malignancy.
Multivariable Analysis Suggested a Significant Association of MBP With Mortality Stratified by the SBP Value With the Lowest Mortality Risk (110 mm Hg)
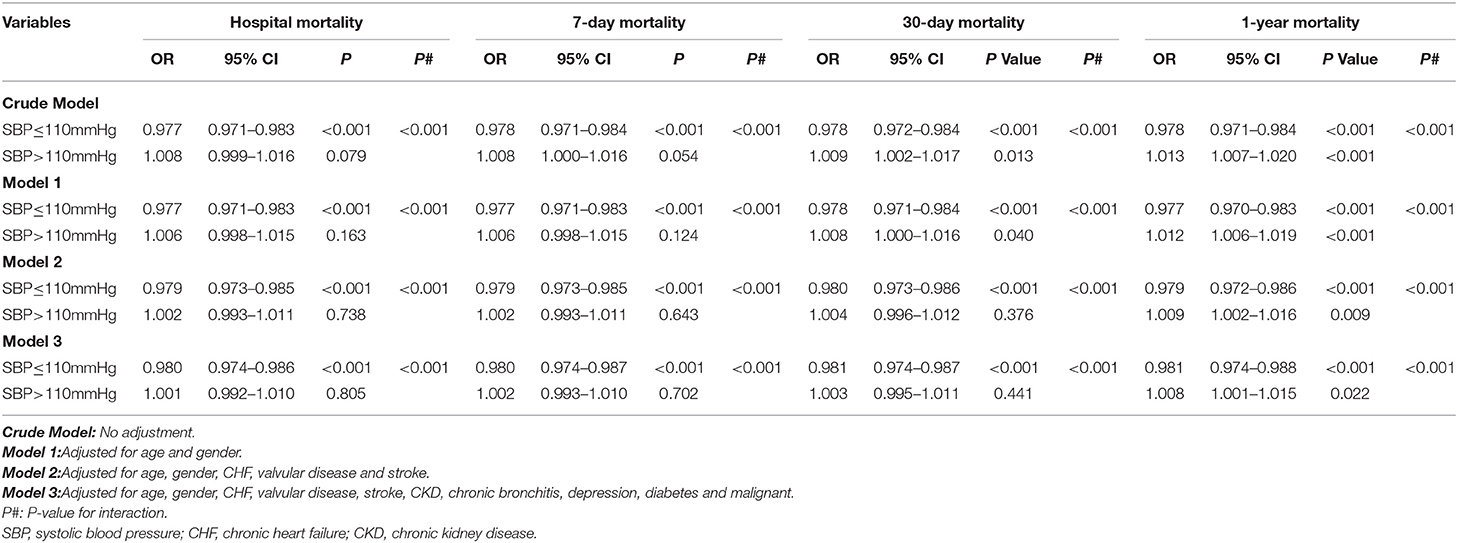
As shown in Table 4, our results suggested that increased SBP levels contributed to lower risks of hospital mortality (OR = 0.977, 95% CI 0.971–0.983, p < 0.001, crude model), 7-day mortality (OR = 0.978, 95% CI 0.971–0.984, p < 0.001 crude model), 30-day mortality (OR = 0.978, 95% CI 0.972–0.984, p < 0.001, crude model), and 1-year mortality (OR = 0.978, 95% CI 0.971–0.984, p < 0.001, crude model) in AF patients with SBP ≤ 110 mm Hg. However, in patients with SBP > 110 mm Hg, increased SBP levels only contributed to increased risks of 30-day mortality (OR = 1.009, 95% CI 1.002–1.017, p = 0.013, crude model), and 1-year mortality (OR = 1.013, 95% CI 1.007–1.020, p < 0.001, crude model) but not that of hospital mortality (OR = 1.008, 95% CI 0.009–1.016, p = 0.079, crude model), and 7-day mortality (OR = 1.008, 95% CI 1.000–1.016, p = 0.051, crude model). Furthermore, after adjustment for confounding factors, such as age, sex, CHF, valvular disease, stroke, CKD, chronic bronchitis, depression, diabetes, and malignancy, the independent associations in Model 3 remained significant, and the values of p of the interactions with hospital mortality, 7-day mortality, 30-day mortality, and 1-year mortality were < 0.001.
Analysis of Correlations Between BP and Mortality Stratified by Comorbidities and Medication
Interestingly, as shown in Table 5, in patients with MBP > 70 mm Hg, CHF (p = 0.026), nitrates (p < 0.001), and heparin (p = 0.021) modified the association between MBP and 1-year mortality. In patients with SBP > 110 mm Hg, nitrates modified the association between SBP and 1-year mortality (p = 0.019). Furthermore, hypertension (p = 0.002) and heparin (p < 0.001) modified the association between DBP and mortality in patients with DBP ≤ 55 mm Hg (Table 6). CHF (p = 0.046) and hypertension (p = 0.025) modified the association between MBP and mortality in patients with MBP ≤ 70 mm Hg, respectively, as well as in patients with SBP ≤ 110 mm Hg.
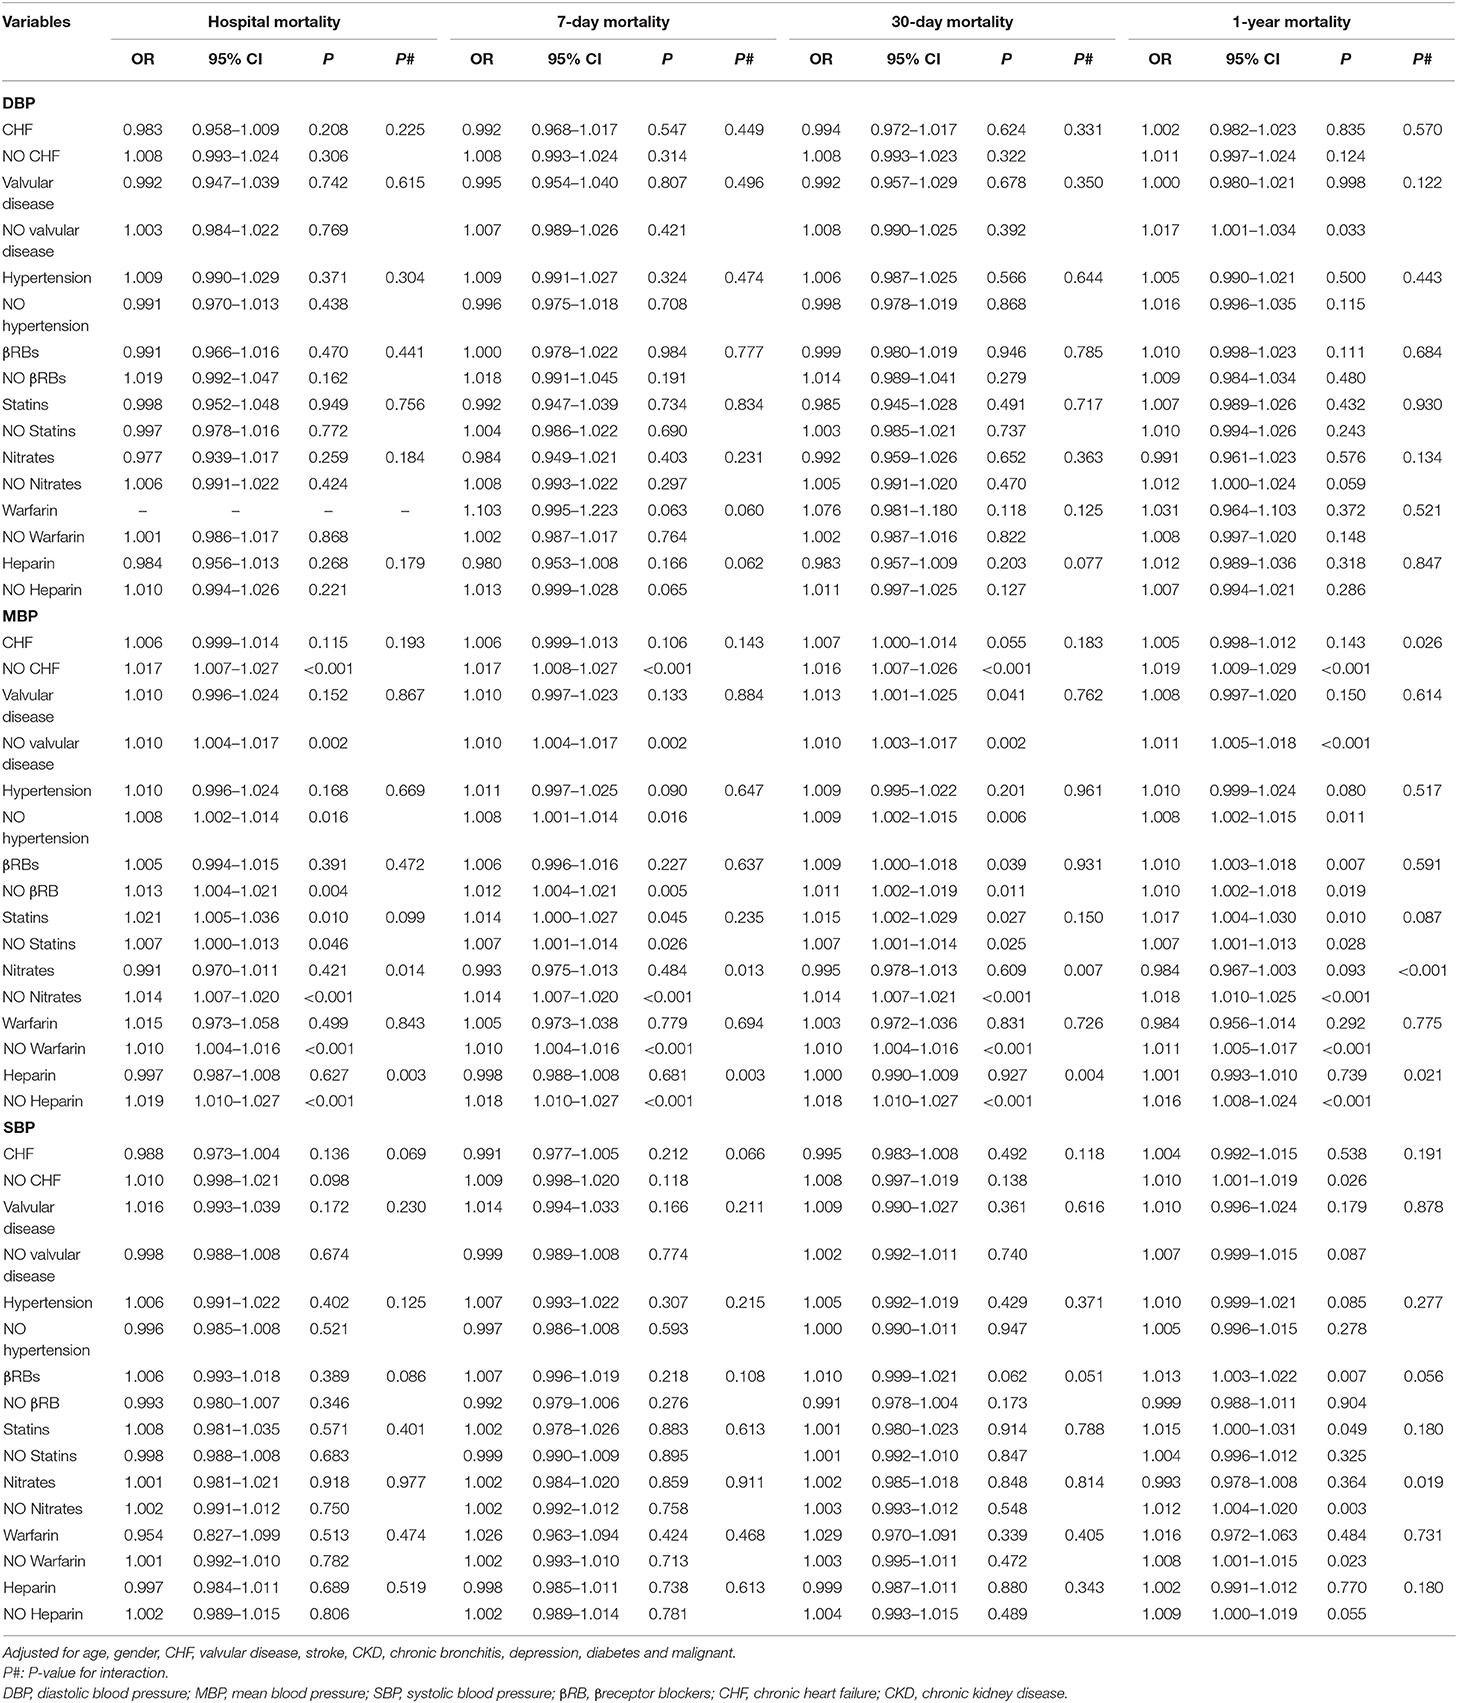
Table 5. Multiple logistic regression analysis for relationship between BP (>55/70/110 mmHg) and mortality by stratified analysis.
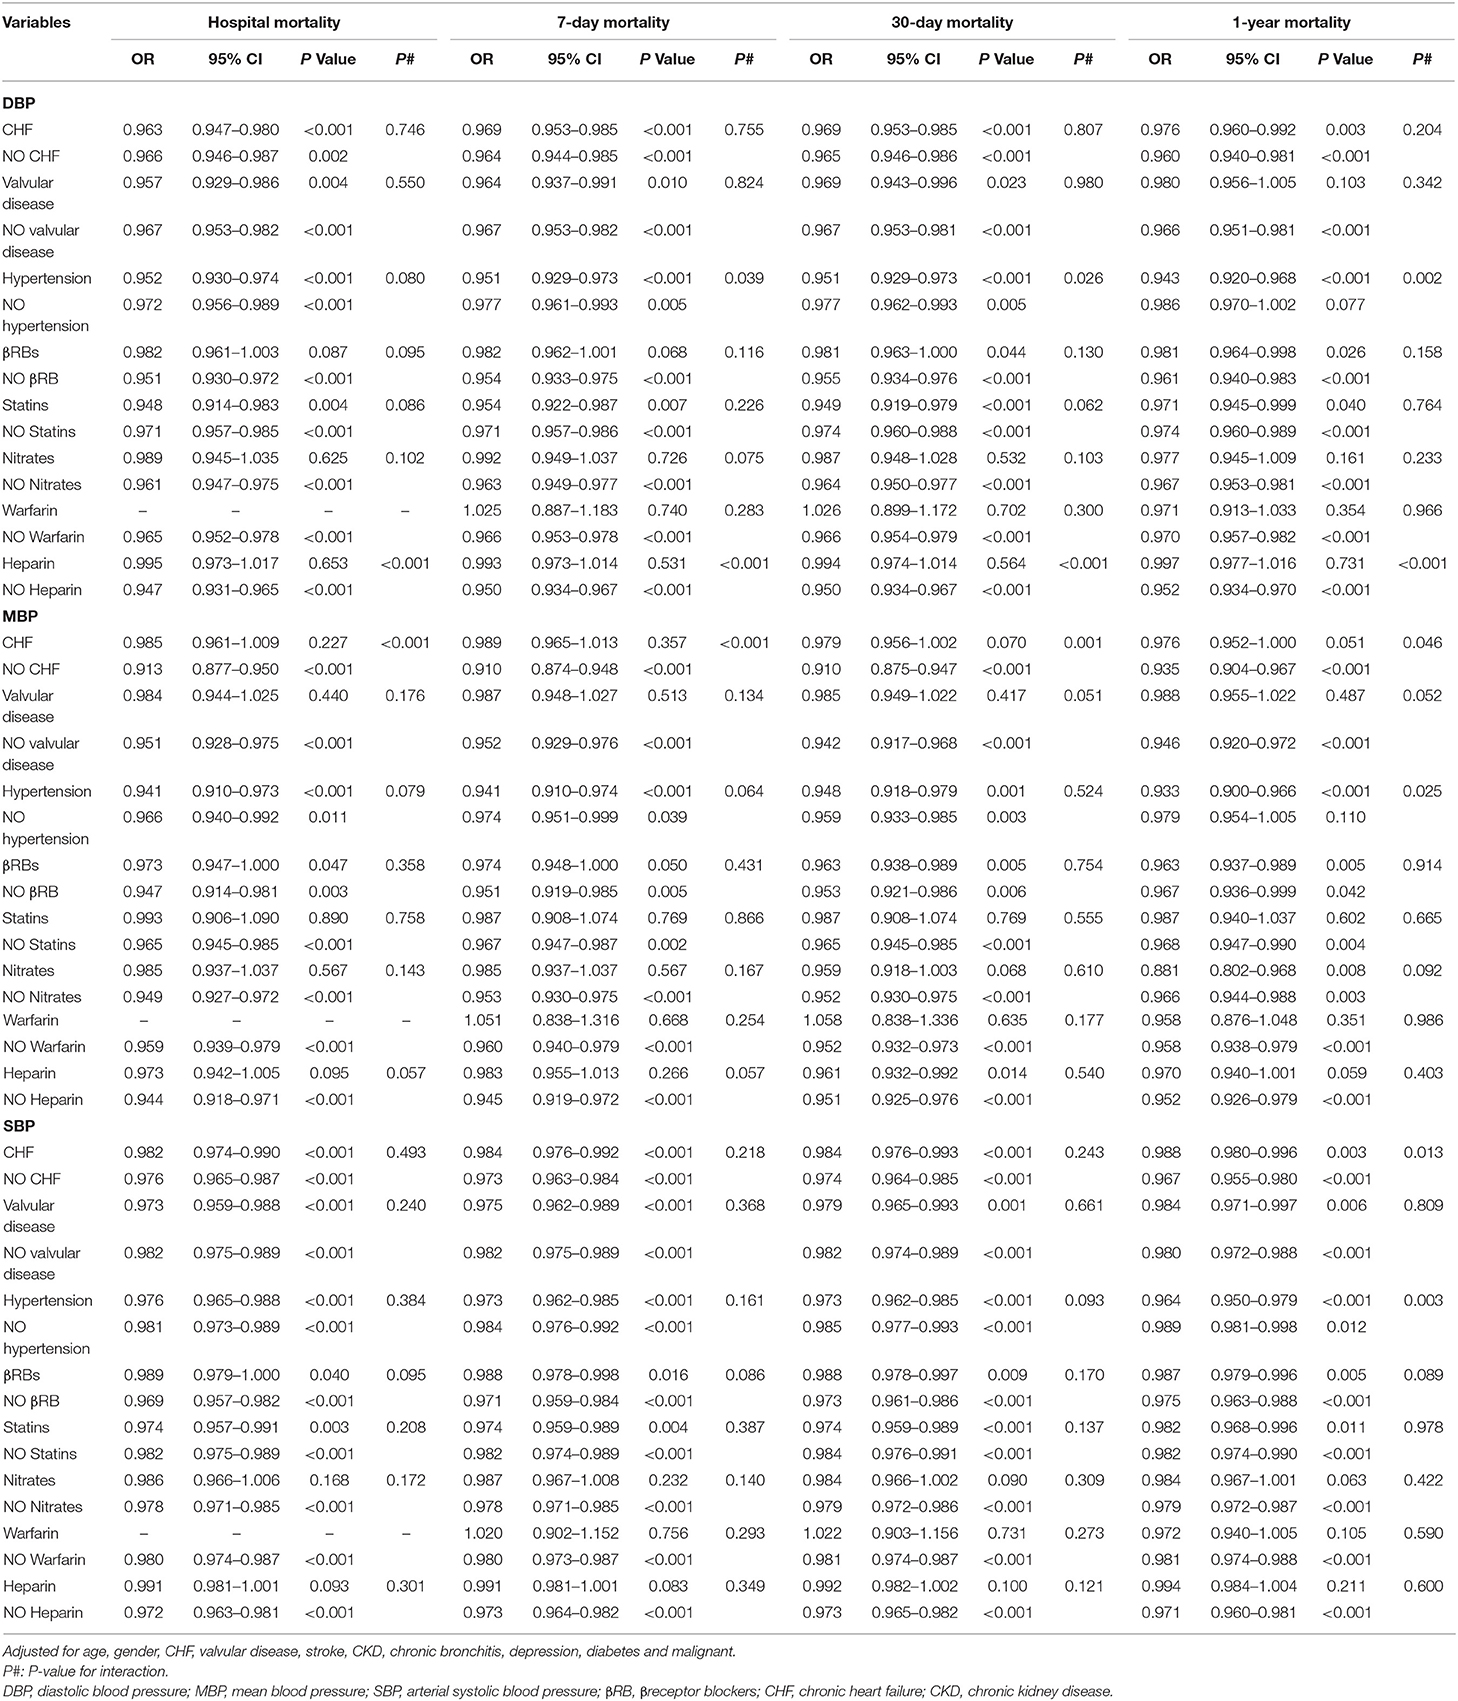
Table 6. Multiple logistic regression analysis for relationship between between BP (≤55/70/110 mmHg) and mortality by stratified analysis.
Discussion
We observed U-shaped relations between BP (SBP, MBP, and DBP) and mortality (hospital mortality, 7-day mortality, 30-day mortality, and 1-year mortality). The BP points for SBP, MBP, and DBP with the lowest mortality risk in patients with AF in our study were 110, 70, and 55 mm Hg, respectively (Figure 1). Studies on optimal BP in patients with AF have been few in the past and previous guidelines on hypertension therapy recommend tight control of BP (17–19). The clinical study including 3,947 patients with AF from the Atrial Fibrillation Follow-Up Investigation of Rhythm Management trial (AFFIRM) also suggested U-shaped curves between BP and all-cause mortality, and the risk of all-cause mortality was lowest at 140/78 mm Hg (14). In the AFFIRM study, patients with AF were either older adults or had at least one risk factor for cardiovascular events (20, 21). However, the authors further observed significantly greater mortality when patients with AF had an average BP (SBP/DBP) below 110/60 mm Hg, which is inconsistent with our finding that AF patients with SBP ≤ 110, MBP ≤ 70, or DBP ≤ 55 mm Hg tended to exhibit a reduced risk of mortality. This discrepancy may originate from different demographic characteristics and lifestyles, differences in comorbidities and treatment histories, different statistical methods, and different BP measurement methods. For example, the sample in the current study consists only of patients from the ICU. Their physiological status is worse, and there are more accompanying diseases than in ordinary patients. Previous studies have found that every 20/10 mm Hg increase in BP contributed to an increased risk of cardiovascular events in seniors with BP >115/75 mm Hg (6, 7). Roughly consistent with the findings of these previous studies, our results demonstrated that higher BP was associated with an increased risk of mortality in AF patients with SBP > 110, MBP > 70, or DBP > 55 mm Hg.
Although AF prevalence is affected by various factors, advanced age is the most important risk factor for AF (22). Existing epidemiological analyses have consistently confirmed a gradual increase in AF prevalence with advancing age (23–25). Thus, we also performed a stratified analysis by adding age as the stratification variable to evaluate the correlation between BP and mortality in patients with AF. However, our results showed that different age groups (age ≥ 65 and age <65; age ≥ 73, and age <73 years) have a little modifying effect on this relationship (data not shown). One possible explanation for these results is that the study sample consists of older adult ICU patients, and the influence of age on BP and mortality in patients with AF is disturbed by poor physiological state and accompanying diseases. Current epidemiological evidence also suggests a sex difference in the epidemiology of AF (26). A study of North American and European populations showed that the rate of AF was higher in men than women after adjustment for age. The results from the Framingham Heart Study (HFS) showed that the incidence of AF (per 1,000 person-years) was 1.6 in men and 3.8 in women (22). A significantly higher rate of AF in the male population is also observed in Asians, although there are few data (27, 28). Furthermore, one study showed that the AF prevalence was 7.4% in women and 10.3% in men among adults aged ≥65 years with Medicare beneficiaries (29). In our study, we still did not observe a modifying effect of sex, which suggests that there is no significant sex difference in this association between BP and mortality in patients with AF (data not shown). In addition to the explanation for the results described above, other potential factors need to be further studied in the future. Additionally, in AF patients with MBP >70 mm Hg or SBP >110 mm Hg, our results suggest that nitrates significantly modified the association between BP and 1-year mortality. Moreover, hypertension modified the association between DBP and mortality in patients with DBP ≤ 55 mm Hg. CHF and hypertension modified the association between MBP and mortality in AF patients with MBP ≤ 70 mm Hg and in patients with SBP ≤ 110 mm Hg, respectively. These significant results are also well explained by comorbidity and medication.
This study has several notable advantages. Our study data were obtained from the MIMIC-III database (15), which is a public critical care database that contains records from tens of thousands of ICU admissions to the Beth Israel Deaconess Medical Center from 2001 to 2012 and provides high-quality data. Professional researchers ensured the reliability and standardization of the data. Second, our study identified U-shaped associations of BP with risks of in-hospital mortality and post-hospital mortality in ICU patients with AF, providing the research evidence for controversial results on patients with AF. The SBP, MBP, and DBP levels with the lowest mortality risks in patients with AF in our study were 110, 70, and 50 mm Hg, respectively, which is inconsistent with the findings of previous relevant studies. Third, numerous disease histories and treatment histories were corrected for and stratified in our study, which improves the credibility of the conclusions of this study.
Of course, common defects in clinical research are also present in our study. Despite the MIMIC-III database prospectively providing high-quality data on ICU patients, the inevitable shortcomings of post-hoc analyses must be taken into consideration. Although meticulous adjustment for numerous potential confounding factors was made, regression analyses could not eliminate unknown or unmeasured variables. Overfitting models of regression analyses are likely to produce a bias toward the study hypothesis with the potential to conservatively underestimate the relationship between BP and mortality. In our results, baseline BP was recorded repeatedly, but we mainly used BP value from the first record after each patient entered the ICU ward. Therefore, the relationships of two BP measurements (maximum and minimum value BP during ICU) with mortality risk in these patients with AF were also analyzed (Supplementary Materials), suggesting a similarly U-shaped relationship, which suggested that our research results were reliable.
Conclusions
We identified U-shaped associations between BP and in-hospital/all-cause mortality in ICU patients with AF. The BP levels with the lowest mortality risks were 110, 70, and 55 for SBP, MBP, and DBP, respectively. This study demonstrated that increased BP values when SBP >110, MBP >70, or DBP >55 mmHg are associated with a higher risk of all-cause mortality. In contrast, mortality risk declines with increasing BP when SBP ≤110, MBP ≤70, or DBP ≤55.
Data Availability Statement
The datasets presented in this study can be found in online repositories. The names of the repository/repositories and accession number(s) can be found in the article/Supplementary Material.
Ethics Statement
The study was conducted in accordance with the Declaration of Helsinki. The Institutional Review Boards (IRB) of BIDMC and MIT approved the project and informed consents were exempted due to all patients' data were anonymized before the data were obtained.
Author Contributions
YS is responsible for the data analysis and writing. JH is responsible for the supervision and revision. Both authors contributed to the article and approved the submitted version.
Conflict of Interest
The authors declare that the research was conducted in the absence of any commercial or financial relationships that could be construed as a potential conflict of interest.
Publisher's Note
All claims expressed in this article are solely those of the authors and do not necessarily represent those of their affiliated organizations, or those of the publisher, the editors and the reviewers. Any product that may be evaluated in this article, or claim that may be made by its manufacturer, is not guaranteed or endorsed by the publisher.
Supplementary Material
The Supplementary Material for this article can be found online at: https://www.frontiersin.org/articles/10.3389/fcvm.2022.866260/full#supplementary-material
References
1. Davis RC, Hobbs FD, Kenkre JE, Roalfe AK, Iles R, Lip GY, et al. Prevalence of atrial fibrillation in the general population and in high-risk groups: the ECHOES study. Europace. (2012) 14:1553–9. doi: 10.1093/europace/eus087
2. Staerk L, Sherer JA, Ko D, Benjamin EJ, Helm RH. Atrial fibrillation: epidemiology, pathophysiology, and clinical outcomes. Circ Res. (2017) 120:1501–17. doi: 10.1161/CIRCRESAHA.117.309732
3. Mont L, Tamborero D, Elosua R, Molina I, Coll-Vinent B, Sitges M, et al. Physical activity, height, and left atrial size are independent risk factors for lone atrial fibrillation in middle-aged healthy individuals. Europace. (2008) 10:15–20. doi: 10.1093/europace/eum263
4. Benjamin EJ, Levy D, Vaziri SM, D'Agostino RB, Belanger AJ, Wolf PA. Independent risk factors for atrial fibrillation in a population-based cohort. The Framingham Heart Study. JAMA. (1994) 271:840–4. doi: 10.1001/jama.1994.03510350050036
5. O'Neal WT, Judd SE, Limdi NA, McIntyre WF, Kleindorfer DO, Cushman M, et al. Differential Impact of Risk Factors in Blacks and Whites in the Development of Atrial Fibrillation: the Reasons for Geographic And Racial Differences in Stroke (REGARDS) Study. J Racial Ethn Health Disparities. (2017) 4:718-724.
6. Chobanian AV, Bakris GL, Black HR, Cushman WC, Green LA, Izzo JL, et al. Seventh report of the Joint National Committee on Prevention, Detection, Evaluation, and Treatment of High Blood Pressure. Hypertension. (2003) 42:1206–52. doi: 10.1007/s40615-016-0275-3
7. Badheka A, Shenoy M, Rathod A, Tuliani T, Afonso L. Long-term mortality and role of troponin elevation in hypertensive emergencies. Am J Cardiol. (2012) 109:600. doi: 10.1016/j.amjcard.2011.11.005
8. Bangalore S, Qin J, Sloan S, Murphy SA, Cannon CP, PROVE IT-TIMI. 22 Trial Investigators. What is the optimal blood pressure in patients after acute coronary syndromes?: Relationship of blood pressure and cardiovascular events in the PRavastatin OR atorVastatin Evaluation and Infection Therapy-Thrombolysis In Myocardial Infarction (PROVE IT-TIMI) 22 trial. Circulation. (2010) 122:2142–51. doi: 10.1161/CIRCULATIONAHA.109.905687
9. Boutitie F, Gueyffier F, Pocock S, Fagard R, Boissel JP, INDANA Project Steering Committee. Individual Data ANalysis of Antihypertensive intervention J-shaped relationship between blood pressure and mortality in hypertensive patients: new insights from a meta-analysis of individual-patient data. Ann Intern Med. (2002) 136:438–48. doi: 10.7326/0003-4819-136-6-200203190-00007
10. Lee TT, Chen J, Cohen DJ, Tsao L. The association between blood pressure and mortality in patients with heart failure. Am Heart J. (2006) 151:76–83. doi: 10.1016/j.ahj.2005.03.009
11. Vagaonescu TD, Wilson AC, Kostis JB. Atrial fibrillation and isolated systolic hypertension: the systolic hypertension in the elderly program and systolic hypertension in the elderly program-extension study. Hypertension. (2008) 51:1552–6. doi: 10.1161/HYPERTENSIONAHA.108.110775
12. Vokó Z, Bots ML, Hofman A, Koudstaal PJ, Witteman JC, Breteler MM. J-shaped relation between blood pressure and stroke in treated hypertensives. Hypertension. (1999) 34:1181–5. doi: 10.1161/01.HYP.34.6.1181
13. Leonardi-Bee J, Bath PM, Phillips SJ, Sandercock PA, IST Collaborative Group. Blood pressure and clinical outcomes in the International Stroke Trial. Stroke. (2002) 33:1315–20. doi: 10.1161/01.STR.0000014509.11540.66
14. Badheka AO, Patel NJ, Grover PM, Shah N, Patel N, Singh V, et al. Optimal blood pressure in patients with atrial fibrillation (from the AFFIRM Trial). Am J Cardiol. (2014) 114:727–36. doi: 10.1016/j.amjcard.2014.06.002
15. Johnson AEW, Pollard TJ, Shen L et al. MIMIC-III, a freely accessible critical care database. Sci Data. (2016) 3:160035. doi: 10.1038/sdata.2016.35
16. STROBE Group. STROBE Statement: Home. (2016). Available online at: http://www.strobe-statement.org/index.php?id=strobe-homehttp://www.strobe-statement.org/index.php?id=strobe-home
17. Whitworth JA, World Health Organization, International Society of Hypertension Writing Group. 2003 World Health Organization (WHO)/International Society of Hypertension (ISH) statement on management of hypertension. J Hypertens. (2003) 21:1983–92. doi: 10.1097/00004872-200311000-00002
18. Williams B, Poulter NR, Brown MJ, Davis M, McInnes GT, Potter JF, et al. British Hypertension Society guidelines for hypertension management 2004 (BHS-IV): summary. BMJ. (2004) 328:634–40. doi: 10.1136/bmj.328.7440.634
19. Cooper-DeHoff RM, Gong Y, Handberg EM, Bavry AA, Denardo SJ, Bakris GL, et al. Tight blood pressure control and cardiovascular outcomes among hypertensive patients with diabetes and coronary artery disease. JAMA. (2010) 304:61–8. doi: 10.1001/jama.2010.884
20. Wyse DG, Waldo AL, DiMarco JP, Domanski MJ, Rosenberg Y, Schron EB, et al. A comparison of rate control and rhythm control in patients with atrial fibrillation. N Engl J Med. (2002) 347:1825–33. doi: 10.1056/NEJMoa021328
21. Corley SD, Epstein AE, DiMarco JP, Domanski MJ, Geller N, Greene HL, et al. Relationships between sinus rhythm, treatment, and survival in the Atrial Fibrillation Follow-Up Investigation of Rhythm Management (AFFIRM) Study. Circulation. (2004) 109:1509–13. doi: 10.1161/01.CIR.0000121736.16643.11
22. Schnabel RB, Yin X, Gona P, Larson MG, Beiser AS, McManus DD, et al. 50 year trends in atrial fibrillation prevalence, incidence, risk factors, and mortality in the Framingham Heart Study: a cohort study. Lancet. (2015) 386:154–62. doi: 10.1016/S0140-6736(14)61774-8
23. Rodriguez CJ, Soliman EZ, Alonso A, Swett K, Okin PM, Goff DC Jr, Heckbert SR. Atrial fibrillation incidence and risk factors in relation to race-ethnicity and the population attributable fraction of atrial fibrillation risk factors: the Multi-Ethnic Study of Atherosclerosis. Ann Epidemiol. (2015) 25:71-6, 76.e1. doi: 10.1016/j.annepidem.2014.11.024
24. Guo Y, Tian Y, Wang H, Si Q, Wang Y, Lip GYH. Prevalence, incidence, and lifetime risk of atrial fibrillation in China: new insights into the global burden of atrial fibrillation. Chest. (2015) 147:109–19. doi: 10.1378/chest.14-0321
25. Murphy NF, Simpson CR, Jhund PS, Stewart S, Kirkpatrick M, Chalmers J, et al. national survey of the prevalence, incidence, primary care burden and treatment of atrial fibrillation in Scotland. Heart. (2007) 93:606–12. doi: 10.1136/hrt.2006.107573
26. Ko D, Rahman F, Schnabel RB, Yin X, Benjamin EJ, Christophersen IE. Atrial fibrillation in women: epidemiology, pathophysiology, presentation, and prognosis. Nat Rev Cardiol. (2016) 13:321–32. doi: 10.1038/nrcardio.2016.45
27. Chugh SS, Havmoeller R, Narayanan K, Singh D, Rienstra M, Benjamin EJ, et al. Worldwide epidemiology of atrial fibrillation: a Global Burden of Disease 2010 Study. Circulation. (2014) 129:837–47. doi: 10.1161/CIRCULATIONAHA.113.005119
28. Chien KL, Su TC, Hsu HC, Chang WT, Chen PC, Chen MF, et al. Atrial fibrillation prevalence, incidence and risk of stroke and all-cause death among Chinese. Int J Cardiol. (2010) 139:173–80. doi: 10.1016/j.ijcard.2008.10.045
Keywords: blood pressure, atrial fibrillation, smooth curve, mortality, intensive care unit
Citation: Shao Y and Hu J (2022) U-Shaped Association Between Blood Pressure and Mortality Risk in ICU Patients With Atrial Fibrillation: The MIMIC-III Database. Front. Cardiovasc. Med. 9:866260. doi: 10.3389/fcvm.2022.866260
Received: 31 January 2022; Accepted: 10 May 2022;
Published: 20 June 2022.
Edited by:
Edoardo Sciatti, Local Social Health Agency Garda, ItalyReviewed by:
Serena Migliarino, University of Magna Graecia, ItalyTlili Barhoumi, King Abdullah International Medical Research Center (KAIMRC), Saudi Arabia
Copyright © 2022 Shao and Hu. This is an open-access article distributed under the terms of the Creative Commons Attribution License (CC BY). The use, distribution or reproduction in other forums is permitted, provided the original author(s) and the copyright owner(s) are credited and that the original publication in this journal is cited, in accordance with accepted academic practice. No use, distribution or reproduction is permitted which does not comply with these terms.
*Correspondence: Jinzhu Hu, aHVqaW56aHUxOTgzQHNpbmEuY29t
†These author share first authorship
 Ying Shao1†
 Jinzhu Hu