
94% of researchers rate our articles as excellent or good
Learn more about the work of our research integrity team to safeguard the quality of each article we publish.
Find out more
ORIGINAL RESEARCH article
Front. Cardiovasc. Med. , 03 May 2022
Sec. Cardiovascular Surgery
Volume 9 - 2022 | https://doi.org/10.3389/fcvm.2022.831390
 Yue Yu1†
 Chi Peng2†
 Zhiyuan Zhang3†
 Kejia Shen4†
 Yufeng Zhang1
 Jian Xiao1
 Wang Xi1
 Pei Wang1
 Jin Rao1
 Zhichao Jin2*
 Zhinong Wang1*
Objective: This study aims to construct and validate several machine learning (ML) algorithms to predict long-term mortality and identify risk factors in unselected patients post-cardiac surgery.
Methods: The Medical Information Mart for Intensive Care (MIMIC-III) database was used to perform a retrospective administrative database study. Candidate predictors consisted of the demographics, comorbidity, vital signs, laboratory test results, scoring systems, and treatment information on the first day of ICU admission. Four-year mortality was set as the study outcome. We used the ML methods of logistic regression (LR), artificial neural network (NNET), naïve bayes (NB), gradient boosting machine (GBM), adapting boosting (Ada), random forest (RF), bagged trees (BT), and eXtreme Gradient Boosting (XGB). The prognostic capacity and clinical utility of these ML models were compared using the area under the receiver operating characteristic curves (AUC), calibration curves, and decision curve analysis (DCA).
Results: Of 7,368 patients in MIMIC-III included in the final cohort, a total of 1,337 (18.15%) patients died during a 4-year follow-up. Among 65 variables extracted from the database, a total of 25 predictors were selected using recursive feature elimination and included in the subsequent analysis. The Ada model performed best among eight models in both discriminatory ability with the highest AUC of 0.801 and goodness of fit (visualized by calibration curve). Moreover, the DCA shows that the net benefit of the RF, Ada, and BT models surpassed that of other ML models for almost all threshold probability values. Additionally, through the Ada technique, we determined that red blood cell distribution width (RDW), blood urea nitrogen (BUN), SAPS II, anion gap (AG), age, urine output, chloride, creatinine, congestive heart failure, and SOFA were the Top 10 predictors in the feature importance rankings.
Conclusions: The Ada model performs best in predicting 4-year mortality after cardiac surgery among the eight ML models, which might have significant application in the development of early warning systems for patients following operations.
Every year, two million cardiac surgical procedures are being performed around the world (1). Risk prediction models of patients undergoing cardiac surgery might be helpful for clinicians for alerting, judgment, and intervention to improve postoperative survival (2). Some risk stratifications scores and models have been created to aid clinical decision making such as the original European System for Cardiac Operative Risk Evaluation (EuroSCORE) (3), EuroSCORE II (4), and the North American Society of Thoracic Surgeons (STS) (5–7). The majority of attention in such models has, however, been focused on those that predict short-term outcomes. There has been much less attention paid to the prediction of long-term outcomes, which are probably an equivalent indication of surgeon performance and surgical treatment appropriateness. Additionally, most of the prediction scores, using the traditional logistic regression method, were developed assuming that the predictors interact in a linear and additive way (8), despite the reality that the interactions are often non-linear and multifactorial (9). It might influence the predictive power of these scores. Several studies have reported that some of these scores overestimate the risk of mortality for patients with low risk in actuality while underestimating the risk for high-risk patients (10–15).
Machine learning (ML), a branch of artificial intelligence, is a relatively new technique that arose from the development of complicated algorithms and the analysis of enormous datasets (16). ML has been applied in areas of medicine such as diagnosis, interpretation of medical imaging, treatment strategies, and outcome prediction (17). ML models can provide new insight into complicated interactions, non-linearities, unrecognized patterns and correlations, and the importance of trends in the explanatory variables (18). There are a growing number of studies that ML models could provide a more accurate risk prediction compared to conventional statistical methods. Moreover, several recent studies have applied ML to predict short-term mortality in patients after cardiac surgery (19–21). However, to the best of our knowledge, no predictive model for long-term mortality has been constructed targeting unselected patients post-cardiac surgery using ML techniques.
In the present study, we aimed to construct and validate eight ML models using easily accessible, early-stage, and well-generalized variables to predict long-term mortality and identify risk factors in patients after cardiac surgery during a 4-year follow-up.
Based on the methods employed in our previous studies (22–25), we conducted a retrospective analysis using all the relevant data extracted from the Medical Information Mart for Intensive Care (MIMIC-III) database. The MIMIC-III database is an open and publicly available database that contains high-quality data from over 50,000 patients admitted to intensive care units (ICU) at the Beth Israel Deaconess Medical Center (26). After passing the “Protecting Human Research Participants” exam, we were granted access to the dataset (authorization codes: 33281932 and 41657645). Since the study was an analysis of a third-party anonymized publicly available database with pre-existing institutional review board approval, the ethical approval statement and the requirement for informed consent were waived. In summary, this study conformed to the provisions of the Declaration of Helsinki (as revised in Edinburgh 2000). This study was reported according to the transparent reporting of a multivariable prediction model for individual prognosis or diagnosis (TRIPOD) guideline (27).
Of all patients in the MIMIC-III database, we included patients as follows: (1) age older than 18 years; (2) those who underwent cardiac surgery including coronary artery bypass grafting (CABG), valvular operation, revision procedures, and some indicators of cardiac surgery. Patients were excluded if they had: (1) multiple ICU admission; (2) a length of stay in the ICU <24 h; and (3) incomplete follow-up information.
Demographics, vital signs, laboratory tests, scoring systems, treatment information, and others were extracted from the MIMIC-III database using structured query language with PostgreSQL (version 9.4.6, www.postgresql.org). Only early-stage clinical and laboratory variables that can be obtained on the first day of ICU admission were incorporated in the prediction model. If patients received vital signs measurement or laboratory tests more than once on the first day of admission, only the initial test results were considered for subsequent analyses. For privacy considerations, the MIMIC-III database changes the date of birth to exactly 300 years before admission for those patients over the age of 89 at the time of admission. As a result, values of 300 for “age” were reverted to 89.
The subject IDs were used to identify distinct adult patients. The predictors included: (1) demographics: age, gender, and ethnicity; (2) comorbidities: coronary artery disease, congestive heart failure, valvular disease, active endocarditis, cardiac arrhythmias, hypertension, pulmonary circulation disorders, chronic pulmonary disease, peripheral vascular disease, stroke, diabetes, dyslipidemia, anemia, renal failure, liver disease, coagulopathy, metastatic cancer, solid tumor (without metastasis), hypothyroidism, fluid and electrolyte disorders, obesity, weight loss, alcohol abuse, drug abuse, and smoker; (3) vital signs: systolic blood pressure (SBP), diastolic blood pressure (DBP), mean blood pressure (MBP), heart rate, respiratory rate, temperature, and urine output; (4) Laboratory findings: white blood cell (WBC), red blood cell (RBC), platelet, red blood cell distribution width (RDW), hematocrit, hemoglobin, sodium, potassium, calcium, magnesium, chloride, phosphate, prothrombin time (PT), international normalized ratio (INR), SpO2, pH, base excess (BE), anion gap (AG), bicarbonate, glucose, blood urea nitrogen (BUN), and creatinine; (5) prognostic scoring system: Sequential Organ Failure Assessment (SOFA), quick Sequential Organ Failure Assessment (qSOFA), and Simplified Acute Physiology Score II (SAPS II); (6) Treatment information: surgical type, mechanical ventilation, renal replacement therapy (RRT), and extracorporeal membrane oxygenation (ECMO). Finally, 4-year mortality was set as the study outcome.
As extensive missing data might lead to bias, variables with over 20% missing values were excluded. Correspondingly, multivariable imputation was applied for variables with fewer than 20% missing values (28). Additionally, the extreme and error values were not omitted and treated as missing data for imputation. Variables for which multivariable imputation was adopted were listed in Supplementary Table 1.
Values were presented as total numbers with percentages for categorical variables and the means with standard deviations (if normal) or medians with interquartile ranges (IQR) (if non-normal) for continuous variables. Proportions were compared using χ2 test or Fisher exact tests while continuous variables were compared using the Student t-test, or Wilcoxon rank-sum test, as appropriate.
In this study, the data were divided at random, with 70% utilized for training and 30% for testing. The most relevant variables were selected using recursive feature elimination (RFE) as a feature selection approach. In short, RFE recursively fits a model based on smaller feature sets until a specified termination criterion is reached. In each loop, in the trained model, features are ranked based on their importance. Finally, dependency and collinearity were eliminated. Features were then considered in groups of 5/15/25/35/45/55/ALL (ALL = 65 variables) organized by the ranks obtained after the feature selection method. To find the optimal hyperparameters, 5-fold cross-validation was used as a resampling method. In each iteration, every 9 folds are used as a training subset, and the remaining 1 fold was processed to tune the hyperparameters. This training-testing process was repeated thirty times. And in this way, each sample would be involved in the training model, and also participate in the testing model, so that all data were used to the greatest extent. In this study, we employed multiple diverse ML algorithms to develop models, containing artificial neural network (NNET), naïve bayes (NB), gradient boosting machine (GBM), adapting boosting (Ada), random forest (RF), bagged trees (BT), eXtreme Gradient Boosting (XGB), and logistic regression (LR). Initially, we conducted internal validation on the development sets to quantify optimism in the predictive performance and evaluate the stability of the prediction model. We use the Cross-validation technique with 30 repeats of 5-fold cross-validation to evaluate the internal validity of each model. All the models were assessed in multiple dimensions regarding their model performance. The median and 95% confidence intervals of the area under the receiver operating characteristic curves (AUC) were calculated, where an AUC value of 1.0 means perfect discrimination and 0.5 represents no discrimination. And the accuracy, sensitivity, specificity, negative predictive value, and positive predictive value were also calculated. Calibration plots were drawn to visualize the prediction abilities of the models. To determine the clinical usefulness of the included variables by quantifying the net benefit at different threshold probabilities, we conducted the decision curve analysis (DCA) (19). For the best-performing model, the significance of the model parameters was identified and reported. Finally, the “Shiny” package in the R was used to construct a visual data analysis platform.
All analyses were performed by the statistical software packages R version 4.0.2 (http://www.R-project.org, The R Foundation). In our study, we used the “Caret” R packages to achieve the process. P < 0.05 (two-sided test) were considered statistically significant.
In total, 7,368 patients fulfilled the selection criteria and comprised the final study cohort (Figure 1). The mortality rate of the cohort was 18.15% (6,301 survivors and 1,337 non-survivors) during a 4-year follow-up. The comparison of characteristics between the survivors and the non-survivors is reported in Table 1. Non-survivors were older (P < 0.001) and tended to be female (P < 0.001) with the medical history of congestive heart failure (P < 0.001), valvular disease (P = 0.005), active endocarditis (P = 0.048), cardiac arrhythmias (P < 0.001), pulmonary circulation disorders (P < 0.001), chronic pulmonary disease (P < 0.001), peripheral vascular disease (P < 0.001), stroke (P = 0.047), diabetes (P = 0.009), renal failure (P < 0.001), liver disease (P < 0.001), coagulopathy (P < 0.001), metastatic cancer (P < 0.001), solid tumor (P = 0.013), fluid and electrolyte disorders (P < 0.001), and weight loss (P < 0.001). Regarding vital signs and laboratory findings, non-survivors were more likely to have higher SBP (P = 0.014), higher heart rate (P = 0.010), higher respiratory rate (P = 0.009), lower temperature (P < 0.001), lower urine output (P < 0.001), higher anion gap (P < 0.001), lower RBC (P = 0.010), higher platelet (P < 0.001), higher RDW (P < 0.001), lower hemoglobin (P < 0.001), BUN (P < 0.001), higher creatinine (P < 0.001), higher calcium (P < 0.001), higher potassium (P < 0.001), lower sodium (P < 0.001), higher phosphate (P < 0.001), lower chloride (P < 0.001), higher SOFA (P < 0.001), and higher SAPS II (P < 0.001). Moreover, patients who died during follow-up were also more likely to receive RRT (P < 0.001) and ECMO (P < 0.001).
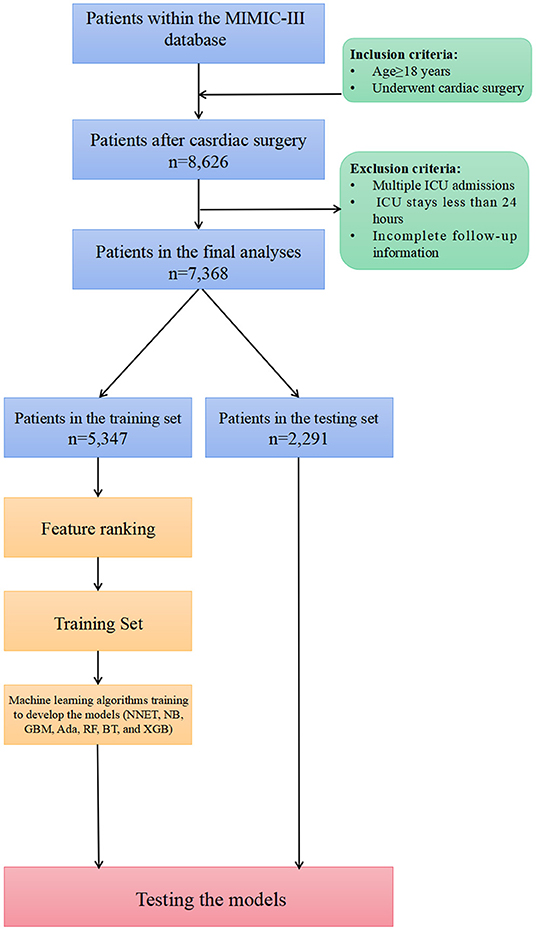
Figure 1. Overview of the methods used for data extraction, training, and testing. MIMIC, Medical Information Mart for Intensive Care; ICU, intensive care units; NNET, artificial neural network; NB, naïve bayes; GBM, gradient boosting machine; Ada, adapting boosting; RF, random forest; BT, bagged trees; XGB, eXtreme Gradient Boosting; LR, logistic regression.
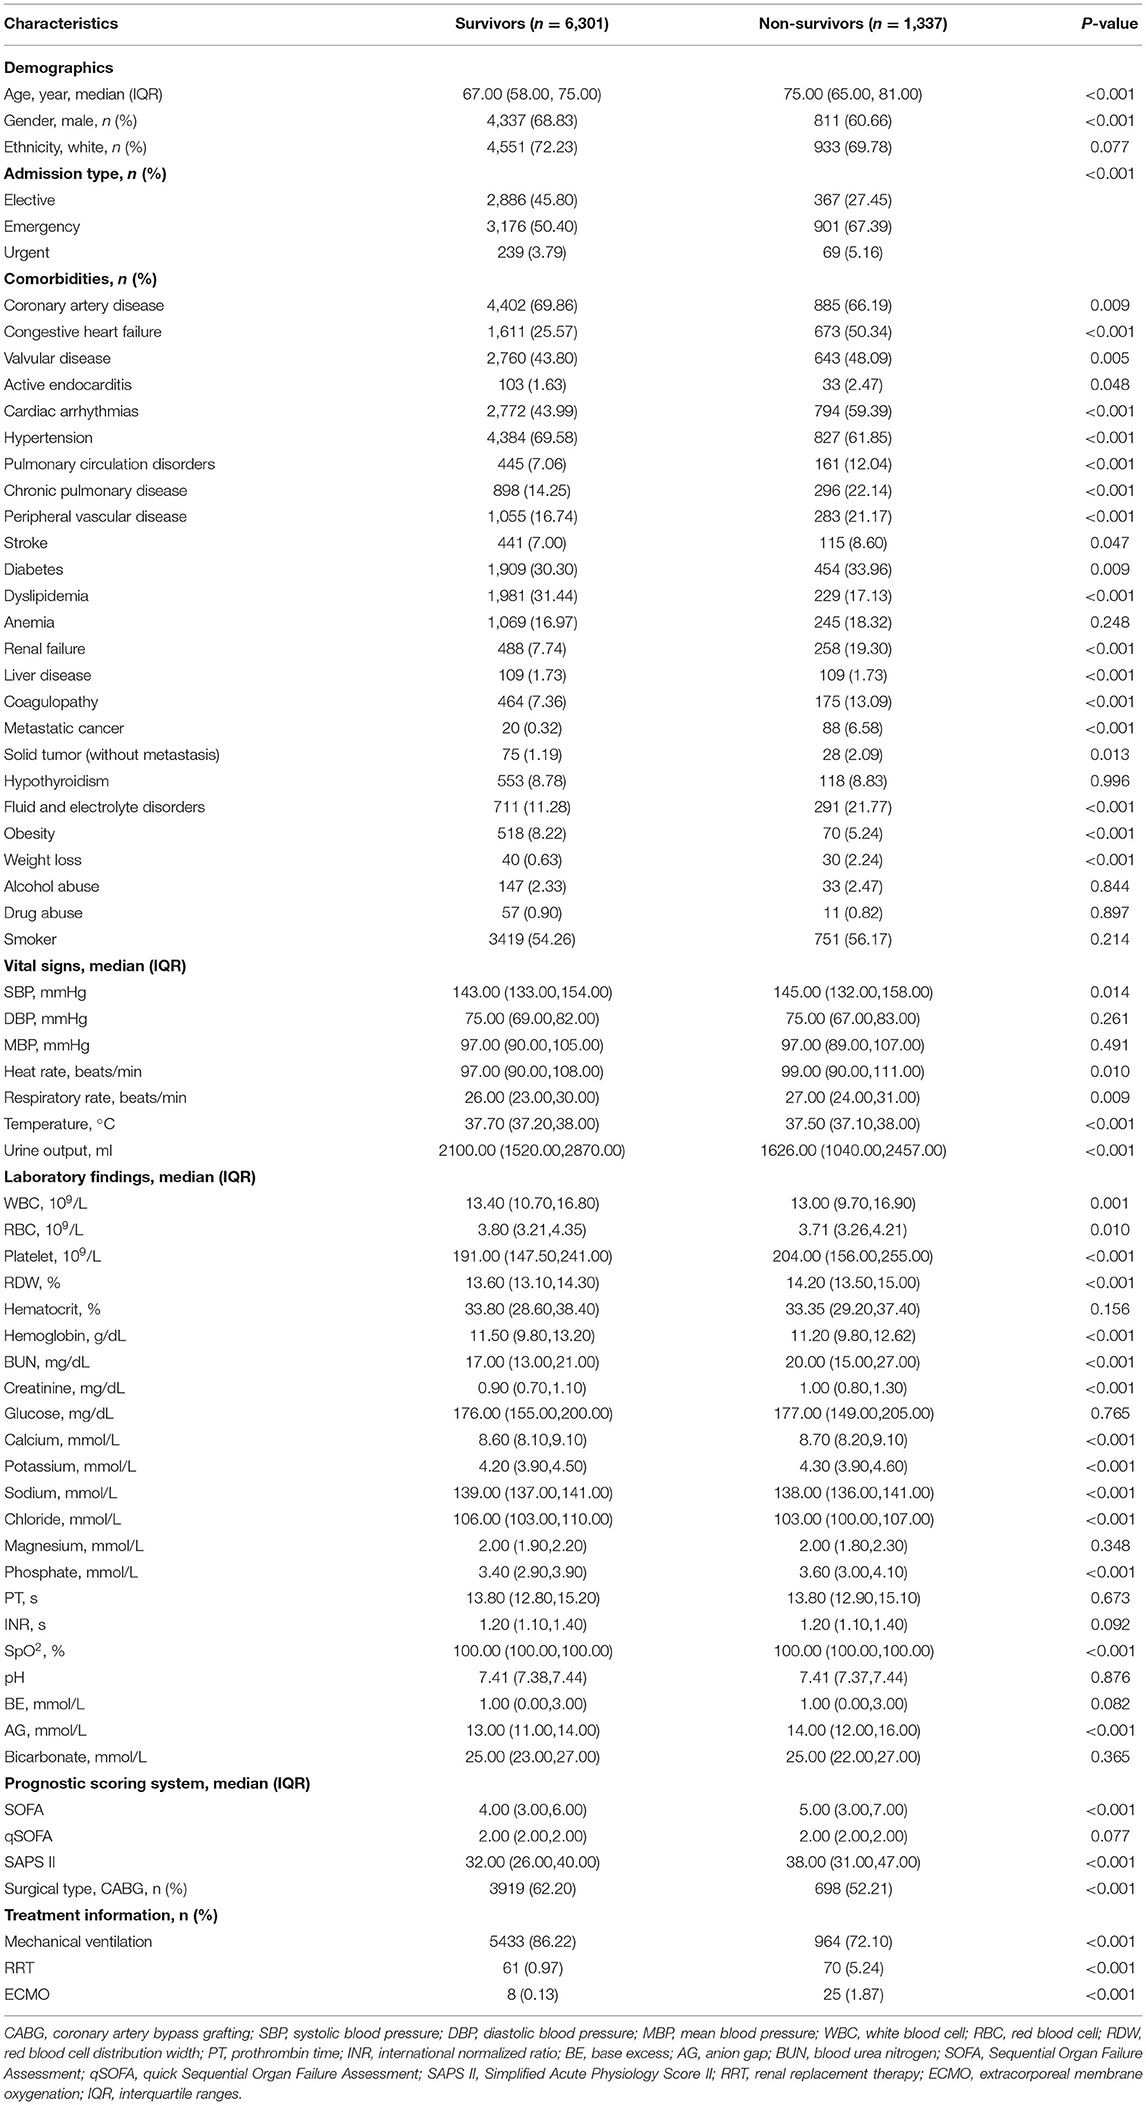
Table 1. Baseline characteristics between survivors and non-survivors.
A total of 65 predictors were extracted from the database. Finally, 25 important predictors were selected by the RFE algorithm, including metastatic cancer, urine output, ECMO, RDW, AG, congestive heart failure, mechanical ventilation, sodium, SBP, bicarbonate, DBP, RBC, hemoglobin, age, BUN, chloride, SAPS II, creatinine, RRT, BE, renal failure, dyslipidemia, platelet, SOFA, and glucose (Figure 2). Then, these variables were used in all the subsequent analyses for all models in both training and testing sets. Each variable included in the study had varying importance over 4-year mortality relying on the ML approach (Figure 3). In the Ada model, we determined that RDW, BUN, SAPS II, AG, age, urine output, chloride, creatinine, congestive heart failure, and SOFA were the Top 10 predictors in the feature importance rankings.
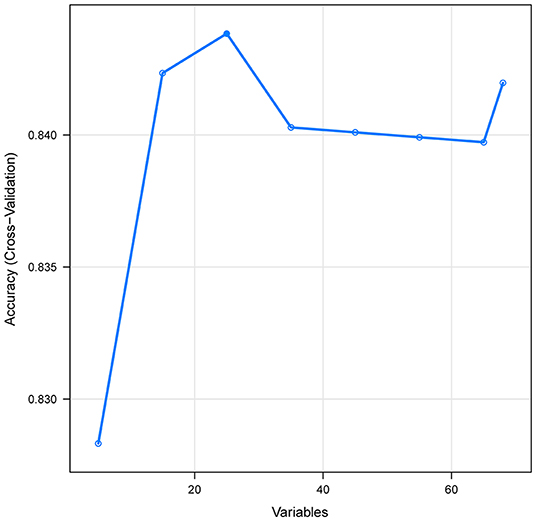
Figure 2. Association between the numbers of variables allowed to be considered at each split and the prediction accuracy in the REF algorithm. REF, recursive feature elimination.
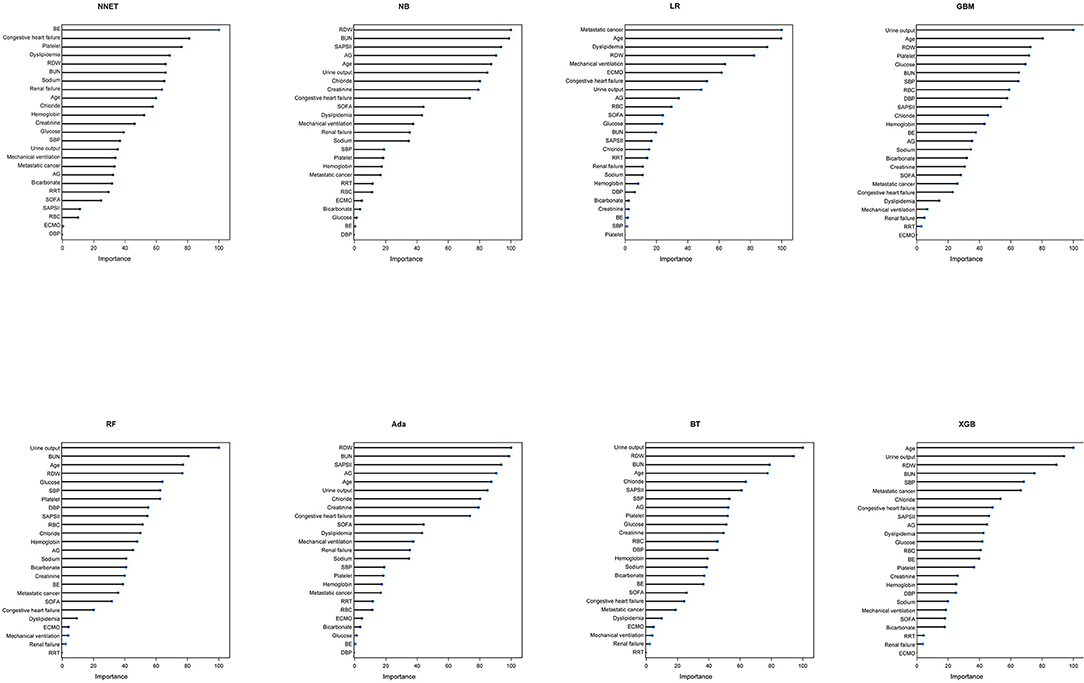
Figure 3. Variable importance in different models. NNET, artificial neural network; NB, naïve bayes; GBM, gradient boosting machine; Ada, adapting boosting; RF, random forest; BT, bagged trees; XGB, eXtreme Gradient Boosting; LR, logistic regression; RDW, red blood cell distribution width; BUN, blood urea nitrogen; SAPS II, Simplified Acute Physiology Score II; AG, anion gap; SOFA, Sequential Organ Failure Assessment; SBP, systolic blood pressure; RRT, renal replacement therapy; RBC, red blood cell; ECMO, extracorporeal membrane oxygenation; BE, base excess; DBP, diastolic blood pressure.
The discriminatory abilities of all models for the prediction of mortality are in Figure 4, Table 2. Within the training set, the NNET, NB, LR, GBM, Ada, RF, BT, and XGB models were established, and the testing set obtained AUCs of 0.790, 0.786, 0.797, 0.748, 0.801, 0.789, 0.752, and 0.781, respectively. Comparatively, the Ada model had the highest predictive performance among these eight models (AUC 0.801, 95% CI: 0.784–0.817). Calibration plots of the eight models are presented in Figure 5. The calibration curves of NNET and Ada performed better than the other models. The decision curve compared the net benefit of the best model and alternative approaches for clinical decision making. As is shown in Figure 6, the net benefit of the RF, Ada, and BT models surpassed that of other ML models for almost all threshold values, showing that these three models were more superior in predicting the risk of 4-year deaths in this cohort.
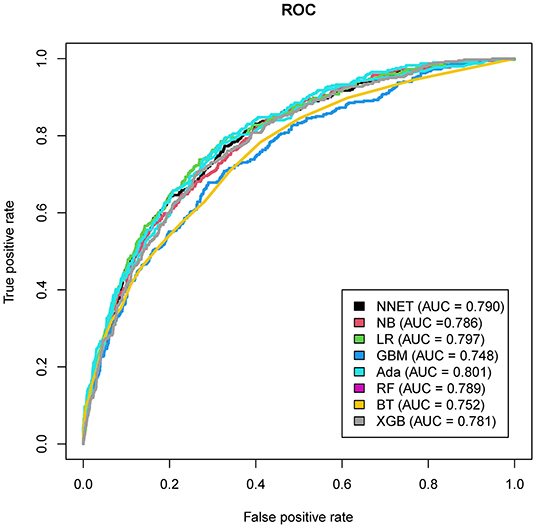
Figure 4. Area under the curve of receiver operating characteristic curve by machine learning models in the validation cohort. ROC, receiver operate characteristics; NNET, artificial neural network; NB, naïve bayes; GBM, gradient boosting machine; Ada, adapting boosting; RF, random forest; BT, bagged trees; XGB, eXtreme Gradient Boosting; LR, logistic regression.
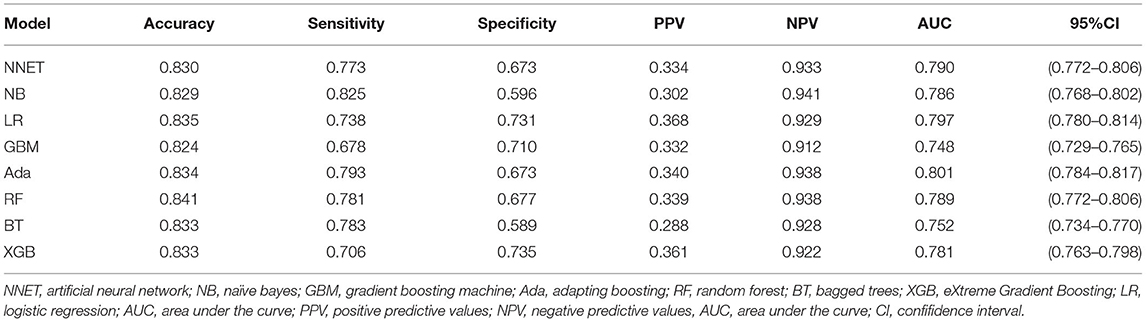
Table 2. Prediction performance of the machine learning models in the test set.
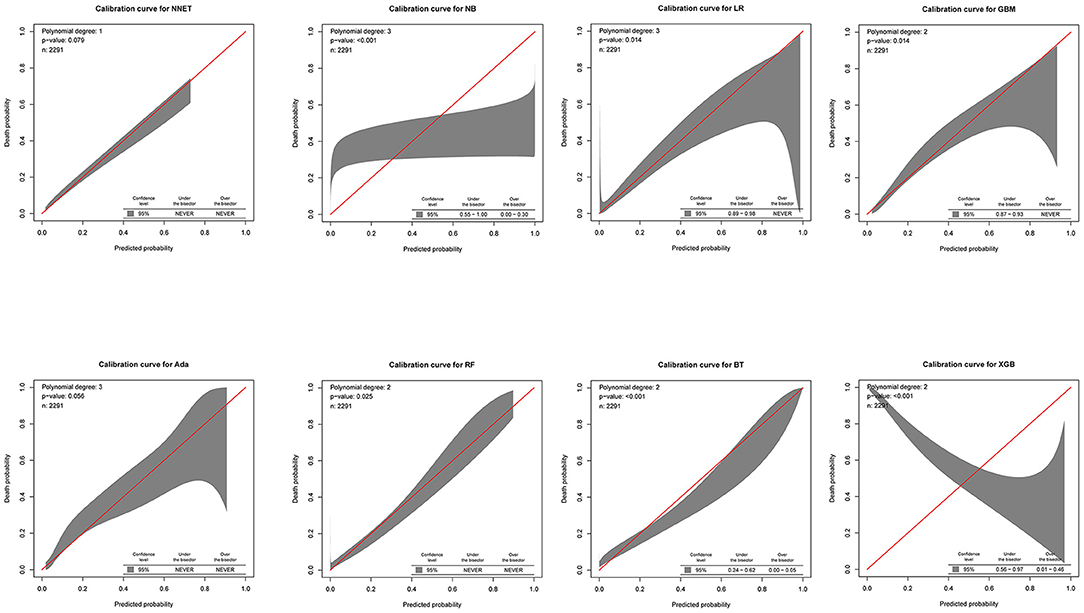
Figure 5. Calibration plots of the eight models. NNET, artificial neural network; NB, naïve bayes; GBM, gradient boosting machine; Ada, adapting boosting; RF, random forest; BT, bagged trees; XGB, eXtreme Gradient Boosting; LR, logistic regression.
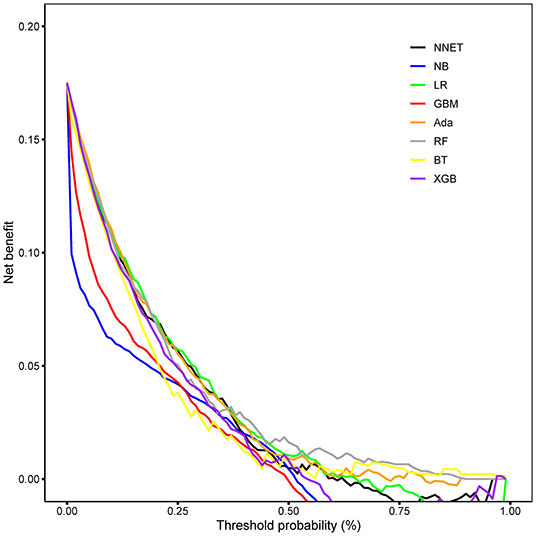
Figure 6. Decision curve analysis of the eight models. NNET, artificial neural network; NB, naïve bayes; GBM, gradient boosting machine; Ada, adapting boosting; RF, random forest; BT, bagged trees; XGB, eXtreme Gradient Boosting; LR, logistic regression.
We next used the Shiny to illustrate the impacts of key features on the death prediction model in individual patients. One visualized and publicly accessible online calculator based on the Ada model was built (https://pengchi2009.shinyapps.io/cardic/) (Figure 7). The webservers may generate an estimated survival probability by entering the covariates.
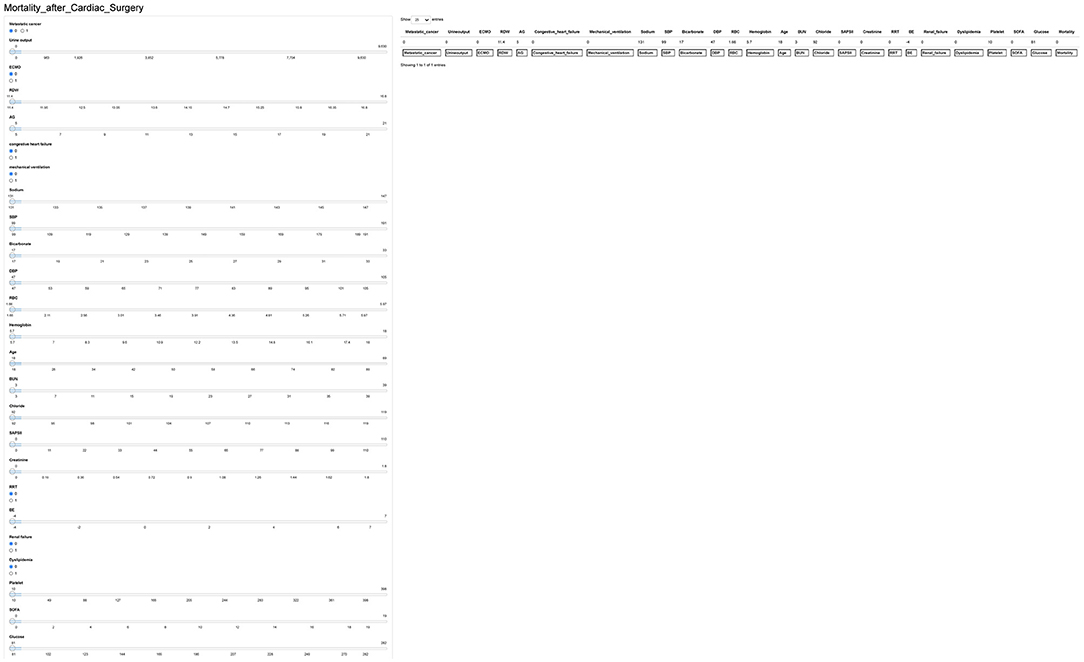
Figure 7. Interface of website usage. RDW, red blood cell distribution width; BUN, blood urea nitrogen; SAPS II, Simplified Acute Physiology Score II; AG, anion gap; SOFA, Sequential Organ Failure Assessment; SBP, systolic blood pressure; RRT, renal replacement therapy; RBC, red blood cell; ECMO, extracorporeal membrane oxygenation; BE, base excess; DBP, diastolic blood pressure.
Long-term mortality risk prediction tools for cardiac surgery can play an important role in enhancing continuity of care and planning resource allocation appropriately. With the advancement of electronic medical records and artificial intelligence, ML algorithms have become more widely utilized in individualized medicine to assist clinical decision-making (29). In this study, several ML algorithms (NNET, NB, GBM, Ada, RF, BT, LR, and XGB) were developed and validated to predict 4-year mortality of patients undergoing cardiac surgery. Concerning the predictive performance, the Ada model exhibited the greatest AUC and outperformed the remaining ML models. Moreover, to help surgeons use the model, a visualized and publicly accessible online calculator was developed, which provided a user-friendly interface. This study was the first to establish a long-term prediction model after cardiac surgery using early-stage and easily obtained variables based on ML methods. It is worth noting that early and accurate prediction of long-term mortality in patients post-cardiac surgery could provide more time for clinicians to offer individualized treatment strategies.
Cardiac surgery, as a unique operation type, had a significant impact on circulation and physiology, as well as posing significant hurdles in terms of lowering mortality (30). In the field of cardiac surgery, there has been an increasing interest in risk prediction models for clinical use. Various risk stratification methods were cited in European guidelines for decision making, even though these scores cannot replace clinical judgment and multidisciplinary dialogue (31). Among the many scores that have been proposed, the original EuroSCORE, EuroSCORE II and STS scores are the most widely used to predict mortality after cardiac surgery. However, several studies have reported that these scores have limitations in some surgeries or patient subgroups (11–13). Recently, a growing number of studies have focused on mid-term or long-term mortality after cardiac surgery (32–36). For example, Wu et al. (37) created a risk score predicting long-term mortality following isolated CABG surgery with the C-statistics ranging from 0.768 to 0.783 for mortality at 1, 3, 5, and 7 years of follow-up. Due to the need for more precise prediction models, the application of ML approaches has been increasingly studied. A recent meta-analysis using 15 studies showed that when compared with LR, ML models provide better discrimination in operative mortality prediction after cardiac surgery (38). In the present study, the Ada model had a better performance in both discriminatory ability with the higher AUC of 0.804 and goodness of fit (visualized by calibration curve) compared to the traditional LR methods.
The potential advantage of ML models is their capacity to capture nonlinearity and the interactions among features without the need for the modeler to manually specify all interactions, as needed with LR. Moreover, compared with traditional statistical methods, ML algorithms can handle missing data more efficiently because they do not rely on data distribution assumptions and are capable of more complex calculations. Clinical models constructed by ML have been used to predict short-term mortality in cardiac surgery with the performance regarding AUC ranging from 0.77 to 0.92 (19, 20, 39–47). Zhou et al. (39) and Ong et al. (40). Found that the RF models predict short-term mortality better than other models in cardiac surgical procedures. Additionally, several studies showed that the XGBoost method performed better in predicting operative or in-hospital mortality than the other ML methods (19, 20, 41–43). In our study, the study outcome was set as long-term mortality, and the Ada model performed better than the RF and XGBoost model. This also supports the so-called No Free-Lunch theorem in ML (48), which shows that there is no one model that works best for every problem or every dataset. Therefore, it is necessary to try and evaluate multiple ML models to determine which one performs best for a specific problem or study cohort. Actually, The Ada model is a technique that is gaining increasing application in clinical research (49–51). Our study is the first to apply the Ada model in the context of cardiac surgery.
Through sophisticated ML methods, we determined that RDW, BUN, SAPS II, AG, age, urine output, chloride, creatinine, congestive heart failure, and SOFA were the Top 10 predictors in the feature importance rankings. In general, the predictors for long-term mortality identified in the Ada model in this study are consistent with other studies. RDW is a simple measure of the broadness of erythrocyte size distribution, conventionally called anisocytosis (52). A growing body of evidence demonstrated that higher RDW is strong correlation with a higher mortality rate in widespread cardiovascular diseases such as cardiac surgery, heart failure, and acute coronary syndrome (53–56). However, there is less research available about whether RDW affects long-term outcomes after cardiac surgery, for which our study is a novel contribution to the published literature. The SAPS II, based on a large international sample of patients, provides an estimate of the risk of death without having to specify a primary diagnosis (57). According to our findings, the SAPS II score seems to be more important than the SOFA score in the feature importance rankings of the Ada model. Similar to our findings, Schoe et al. (58) found that the SOFA score used as a mortality prediction model underperformed compared to the SAPS-II score in this large cohort of cardiac surgery patients. Urine output, BUN, and creatinine were all Top 10 important variables. Lassnigg et al. (59) reported that even a slight increase in serum creatinine is correlated with a considerable increase in 30-day mortality following cardiac surgery. Tseng et al. (60) developed and validated ML algorithms using 94 preoperative and intraoperative features to predict cardiac surgery-associated acute kidney injury, which is closely associated with increased morbidity and mortality. In their model, the importance matrix plot reveals that the most important variables contributing to the model were intraoperative urine output. Our results also underline the importance of detecting, evaluating, and improving preoperative renal function in patients requiring cardiac surgery, which might serve as a target for improving outcomes.
There are several strengths of our study. Firstly, this is the first study that established advanced ML death prediction models focusing on the long-term mortality of patients undergoing all types of cardiovascular surgery. Given the heterogeneity of patients on ICU admission, our findings can be used to identify patients at high-risk for death, and determine which patients would benefit most from cardiac surgery. Providers can then offer targeted individualized care such as more extensive evaluation, post-discharge home visits, closer surveillance by primary care physician, or earlier post-operative follow-up appointments for these patients, actions that might mitigate future adverse outcomes. Secondly, we used MIMIC-III, a high-quality database with large sample size and extensive clinical data. Thirdly, we utilized advanced statistical methods, including eight ML models. To evaluate the performance of these models, the AUCs, calibration curves, and DCA were calculated and plotted, representing the discrimination, goodness of fit, and clinical application, respectively. Fourthly, the models were created based on the data readily available collected within the first 24 h after patients' admission. It is worth noting that early and accurate prediction of mortality can provide more time for clinicians to adjust corresponding treatment strategies. Finally, to help surgeons use the model at the bedside, a calculator was developed, which provided a user-friendly interface.
Our study had several limitations. Firstly, we used data from a single academic medical center in the USA, with the earliest cases from almost 20 years ago, when care may have been inconsistent with currently accepted standards. Therefore, a multicenter registry, prospective studies are needed to confirm these findings. Secondly, derived from the ICU adult participants, the results of our study cannot be generalized to other populations such as children and non-ICU patients. Thirdly, we did not obtain information including laboratory testing and interventions before ICU admission, which may cause confounders to some extent. Fourthly, restricted by the contents of the MIMIC-III database, some important information, including preoperative data (i.e., lactate, left ventricular ejection fraction, NYHA functional class, EuroSCORE score, and STS score), intraoperative data (i.e., intraoperative hypotension, vasopressor-inotropes and cardiopulmonary bypass time), and postoperative data (i.e., complications, late extubation, and length of ICU stay) were recorded incompletely and not included in the analysis. Fifthly, although we included patients in the database with the primary diagnosis of receiving cardiac surgery, it cannot be ruled out that some patients were admitted to treating other diseases. Finally, although our study deeply explored 4-year mortality in the ICU settings, other outcomes, such as acute kidney injury incidence, are also needed for further investigation.
The Ada model performs better than the LR, NNET, NB, GBM, RF, BT, and XGB models in predicting long-term mortality after cardiac surgery. Our results suggest that RDW, BUN, SAPS II, AG, age, urine output, chloride, creatinine, congestive heart failure, and SOFA might be closely associated with 4-year mortality after cardiac surgery. We anticipate that this new risk model can become a handy risk stratification tool that can be used by clinicians and patients in the choice of treatment for cardiac disease. However, further external validations are warranted to test the generalization of our models.
The raw data supporting the conclusions of this article will be made available by the authors, without undue reservation.
YY, ZW, and ZJ conceived the analysis. YY and CP extracted all data. YY, ZZ, and KS undertook and refined the inclusion process. YY, CP, and ZW co-wrote the paper. YY, CP, YZ, and JX undertook the statistical analyses. WX, PW, and ZW were consulted for clinical issues. All authors contributed to and revised the final manuscript.
This work was supported by the National Nature Science Foundation of China (No. 81770244), Medical Science and Technology Youth Cultivation Plan (Nos. 17QNP013 and 20QNPY038), Shanghai Municipal Commission of Science and Technology (No. 17ZR1439100), Shanghai Shenkang Medicine Developing Project (No. SHDC12014107), and Shanghai Science and Technology Committee Medicine Leading Project (No. 15411960100).
The authors declare that the research was conducted in the absence of any commercial or financial relationships that could be construed as a potential conflict of interest.
All claims expressed in this article are solely those of the authors and do not necessarily represent those of their affiliated organizations, or those of the publisher, the editors and the reviewers. Any product that may be evaluated in this article, or claim that may be made by its manufacturer, is not guaranteed or endorsed by the publisher.
This manuscript has been released as a pre-print at Research Square (doi: 10.21203/rs.3.rs-1140660/v1).
The Supplementary Material for this article can be found online at: https://www.frontiersin.org/articles/10.3389/fcvm.2022.831390/full#supplementary-material
EuroSCORE, European System for Cardiac Operative Risk Evaluation; STS, Society of Thoracic Surgeons; ML, machine learning; MIMIC, Medical Information Mart for Intensive Care; ICU, intensive care units; CABG, coronary artery bypass grafting; SBP, systolic blood pressure; DBP, diastolic blood pressure; MBP, mean blood pressure; WBC, white blood cell; RBC, red blood cell; RDW, red blood cell distribution width; PT, prothrombin time; INR, international normalized ratio; BE, base excess; AG, anion gap; BUN, blood urea nitrogen; SOFA, Sequential Organ Failure Assessment; qSOFA, quick Sequential Organ Failure Assessment; SAPS II, Simplified Acute Physiology Score II; RRT, renal replacement therapy; ECMO, extracorporeal membrane oxygenation; IQR, interquartile ranges; RFE, recursive feature elimination; NNET, artificial neural network; NB, naïve bayes; GBM, gradient boosting machine; Ada, adapting boosting; RF, random forest; BT, bagged trees; XGB, eXtreme Gradient Boosting; LR, logistic regression; AUC, area under the curve; DCA, decision curve analysis.
1. Kang HC, Chung MY. Images in clinical medicine. Peripheral artery disease. N Engl J Med. (2007) 357:e19. doi: 10.1056/NEJMicm064659
2. García-Gallo JE, Fonseca-Ruiz NJ, Celi LA, Duitama-Muñoz JF. A machine learning-based model for 1-year mortality prediction in patients admitted to an Intensive Care Unit with a diagnosis of sepsis. Med Intensiva. (2020) 44:160–70. doi: 10.1016/j.medin.2018.07.016
3. Nashef SA, Roques F, Michel P, Gauducheau E, Lemeshow S, Salamon R. European system for cardiac operative risk evaluation (EuroSCORE). Eur J Cardiothorac Surg. (1999) 16:9–13. doi: 10.1016/S1010-7940(99)00134-7
4. Nashef SA, Roques F, Sharples LD, Nilsson J, Smith C, Goldstone AR, et al. EuroSCORE II. Eur J Cardiothorac Surg. (2012) 41:734–44. doi: 10.1093/ejcts/ezs043
5. Shahian DM, O'Brien SM, Filardo G, Ferraris VA, Haan CK, Rich JB, et al. The society of thoracic surgeons 2008 cardiac surgery risk models: part 1–coronary artery bypass grafting surgery. Ann Thorac Surg. (2009) 88:S2–22. doi: 10.1016/j.athoracsur.2009.05.053
6. O'Brien SM, Shahian DM, Filardo G, Ferraris VA, Haan CK, Rich JB, et al. The society of thoracic surgeons 2008 cardiac surgery risk models: part 2–isolated valve surgery. Ann Thorac Surg. (2009) 88:S23–42. doi: 10.1016/j.athoracsur.2009.05.056
7. Shahian DM, O'Brien SM, Filardo G, Ferraris VA, Haan CK, Rich JB, et al. The society of thoracic surgeons 2008 cardiac surgery risk models: part 3–valve plus coronary artery bypass grafting surgery. Ann Thorac Surg. (2009) 88:S43–62. doi: 10.1016/j.athoracsur.2009.05.055
8. Merath K, Hyer JM, Mehta R, Farooq A, Bagante F, Sahara K, et al. Use of machine learning for prediction of patient risk of postoperative complications after liver, pancreatic, and colorectal surgery. J Gastrointest Surg. (2020) 24:1843–51. doi: 10.1007/s11605-019-04338-2
9. Bertsimas D, Dunn J, Velmahos GC, Kaafarani HMA. Surgical Risk Is Not Linear: Derivation and Validation of a Novel, User-friendly, and Machine-learning-based Predictive OpTimal Trees in Emergency Surgery Risk (POTTER). Calculator Ann Surg. (2018) 268:574–83. doi: 10.1097/SLA.0000000000002956
10. Kunt AG, Kurtcephe M, Hidiroglu M, Cetin L, Kucuker A, Bakuy V, et al. Comparison of original EuroSCORE, EuroSCORE II and STS risk models in a Turkish cardiac surgical cohort. Interact Cardiovasc Thorac Surg. (2013) 16:625–9. doi: 10.1093/icvts/ivt022
11. Gummert JF, Funkat A, Osswald B, Beckmann A, Schiller W, Krian A, et al. EuroSCORE overestimates the risk of cardiac surgery: results from the national registry of the German Society of Thoracic and Cardiovascular Surgery. Clin Res Cardiol. (2009) 98:363–9. doi: 10.1007/s00392-009-0010-8
12. Kieser TM, Rose MS, Head SJ. Comparison of logistic EuroSCORE and EuroSCORE II in predicting operative mortality of 1125 total arterial operations. Eur J Cardiothorac Surg. (2016) 50:509–18. doi: 10.1093/ejcts/ezw072
13. Chhor V, Merceron S, Ricome S, Baron G, Daoud O, Dilly MP, et al. Poor performances of EuroSCORE and CARE score for prediction of perioperative mortality in octogenarians undergoing aortic valve replacement for aortic stenosis. Eur J Anaesthesiol. (2010) 27:702–7. doi: 10.1097/EJA.0b013e32833a45de
14. Provenchère S, Chevalier A, Ghodbane W, Bouleti C, Montravers P, Longrois D, et al. Is the EuroSCORE II reliable to estimate operative mortality among octogenarians? PLoS ONE. (2017) 12:e0187056. doi: 10.1371/journal.pone.0187056
15. Guida P, Mastro F, Scrascia G, Whitlock R, Paparella D. Performance of the European System for Cardiac Operative Risk Evaluation II: a meta-analysis of 22 studies involving 145,592 cardiac surgery procedures. J Thorac Cardiovasc Surg. (2014) 148:3049–57.e3041. doi: 10.1016/j.jtcvs.2014.07.039
16. Deo RC. Machine learning in medicine. Circulation. (2015) 132:1920–30. doi: 10.1161/CIRCULATIONAHA.115.001593
17. Jiang F, Jiang Y, Zhi H, Dong Y, Li H, Ma S, et al. Artificial intelligence in healthcare: past, present and future. Stroke Vasc Neurol. (2017) 2:230–43. doi: 10.1136/svn-2017-000101
18. Ramesh AN, Kambhampati C, Monson JR, Drew PJ. Artificial intelligence in medicine. Ann R Coll Surg Engl. (2004) 86:334–8. doi: 10.1308/147870804290
19. Nistal-Nuño B. Machine learning applied to a Cardiac Surgery Recovery Unit and to a Coronary Care Unit for mortality prediction. J Clin Monit Comput. (2021) doi: 10.1007/s10877-021-00703-2
20. Fernandes MPB, Armengol de la Hoz M, Rangasamy V, Subramaniam B. Machine learning models with preoperative risk factors and intraoperative hypotension parameters predict mortality after cardiac surgery. J Cardiothorac Vasc Anesth. (2021) 35:857–65. doi: 10.1053/j.jvca.2020.07.029
21. Allyn J, Allou N, Augustin P, Philip I, Martinet O, Belghiti M, et al. A comparison of a machine learning model with EuroSCORE II in predicting mortality after elective cardiac surgery: a decision curve analysis. PLoS ONE. (2017) 12:e0169772. doi: 10.1371/journal.pone.0169772
22. Yu Y, Wang J, Wang Q, Wang J, Min J, Wang S, et al. Admission oxygen saturation and all-cause in-hospital mortality in acute myocardial infarction patients: data from the MIMIC-III database. Ann Transl Med. (2020) 8:1371. doi: 10.21037/atm-20-2614
23. Yao RQ, Jin X, Wang GW Yu Y, Wu GS, Zhu YB, et al. A machine learning-based prediction of hospital mortality in patients with postoperative sepsis. Front Med. (2020) 7:445. doi: 10.3389/fmed.2020.00445
24. Yu Y, Yu J, Yao R, Wang P, Zhang Y, Xiao J, et al. Admission serum ionized and total calcium as new predictors of mortality in patients with cardiogenic shock. Biomed Res Int. (2021) 2021:6612276. doi: 10.1155/2021/6612276
25. Yu Y, Liu Y, Ling X, Huang R, Wang S, Min J, et al. The neutrophil percentage-to-albumin ratio as a new predictor of all-cause mortality in patients with cardiogenic shock. Biomed Res Int. (2020) 2020:7458451. doi: 10.1155/2020/7458451
26. Johnson AE, Pollard TJ, Shen L, Lehman LW, Feng M, Ghassemi M, et al. MIMIC-III, a freely accessible critical care database. Sci Data. (2016) 3:160035. doi: 10.1038/sdata.2016.35
27. Collins GS, Reitsma JB, Altman DG, Moons KG. Transparent reporting of a multivariable prediction model for individual prognosis or diagnosis (TRIPOD): the TRIPOD statement. BMJ. (2015) 350:g7594. doi: 10.1136/bmj.g7594
28. White IR, Royston P, Wood AM. Multiple imputation using chained equations: issues and guidance for practice. Stat Med. (2011) 30:377–99. doi: 10.1002/sim.4067
29. Fröhlich H, Balling R, Beerenwinkel N, Kohlbacher O, Kumar S, Lengauer T, et al. From hype to reality: data science enabling personalized medicine. BMC Med. (2018) 16:150. doi: 10.1186/s12916-018-1122-7
30. Kara A, Akin S, Ince C. The response of the microcirculation to cardiac surgery. Curr Opin Anaesthesiol. (2016) 29:85–93. doi: 10.1097/ACO.0000000000000280
31. Windecker S, Kolh P, Alfonso F, Collet JP, Cremer J, Falk V, et al. 2014 ESC/EACTS Guidelines on myocardial revascularization: The Task Force on Myocardial Revascularization of the European Society of Cardiology (ESC) and the European Association for Cardio-Thoracic Surgery (EACTS)Developed with the special contribution of the European Association of Percutaneous Cardiovascular Interventions (EAPCI). Eur Heart J. (2014) 35:2541–619. doi: 10.1093/eurheartj/ehu278
32. McDonald B, van Walraven C, McIsaac DI. Predicting 1-year mortality after cardiac surgery complicated by prolonged critical illness: derivation and validation of a population-based risk model. J Cardiothorac Vasc Anesth. (2020) 34:2628–37. doi: 10.1053/j.jvca.2020.04.052
33. Farooq V, van Klaveren D, Steyerberg EW, Meliga E, Vergouwe Y, Chieffo A, et al. Anatomical and clinical characteristics to guide decision making between coronary artery bypass surgery and percutaneous coronary intervention for individual patients: development and validation of SYNTAX score II. Lancet. (2013) 381:639–50. doi: 10.1016/S0140-6736(13)60108-7
34. Aktuerk D, McNulty D, Ray D, Begaj I, Howell N, Freemantle N, et al. National administrative data produces an accurate and stable risk prediction model for short-term and 1-year mortality following cardiac surgery. Int J Cardiol. (2016) 203:196–203. doi: 10.1016/j.ijcard.2015.10.086
35. Spoon DB, Lennon RJ, Psaltis PJ, Prasad A, Holmes DR Jr, Lerman A, et al. Prediction of cardiac and noncardiac mortality after percutaneous coronary intervention. Circ Cardiovasc Interv. (2015) 8:e002121. doi: 10.1161/CIRCINTERVENTIONS.114.002121
36. Luo HD, Teoh LK, Gaudino MF, Fremes S, Kofidis T. The Asian system for cardiac operative risk evaluation for predicting mortality after isolated coronary artery bypass graft surgery (ASCORE-C). J Card Surg. (2020) 35:2574–82. doi: 10.1111/jocs.14836
37. Wu C, Camacho FT, Wechsler AS, Lahey S, Culliford AT, Jordan D, et al. Risk score for predicting long-term mortality after coronary artery bypass graft surgery. Circulation. (2012) 125:2423–30. doi: 10.1161/CIRCULATIONAHA.111.055939
38. Benedetto U, Dimagli A, Sinha S, Cocomello L, Gibbison B, Caputo M, et al. Machine learning improves mortality risk prediction after cardiac surgery: Systematic review and meta-analysis. J Thorac Cardiovasc Surg. (2020) 160:1–13. doi: 10.1016/j.jtcvs.2020.07.105
39. Zhou Y, Chen S, Rao Z, Yang D, Liu X, Dong N, et al. Prediction of 1-year mortality after heart transplantation using machine learning approaches: a single-center study from China. Int J Cardiol. (2021) 339:21–7. doi: 10.1016/j.ijcard.2021.07.024
40. Ong CS, Reinertsen E, Sun H, Moonsamy P, Mohan N, Funamoto M, et al. Prediction of operative mortality for patients undergoing cardiac surgical procedures without established risk scores. J Thorac Cardiovasc Surg. (2021). doi: 10.1016/j.jtcvs.2021.09.010 [Epub ahead of print]
41. Kilic A, Goyal A, Miller JK, Gjekmarkaj E, Tam WL, Gleason TG, et al. Predictive utility of a machine learning algorithm in estimating mortality risk in cardiac surgery. Ann Thorac Surg. (2020) 109:1811–9. doi: 10.1016/j.athoracsur.2019.09.049
42. Orfanoudaki A, Giannoutsou A, Hashim S, Bertsimas D, Hagberg RC. Machine learning models for mitral valve replacement: a comparative analysis with the society of thoracic surgeons risk score. J Card Surg. (2021) 37:18–28. doi: 10.1111/jocs.16072
43. Mori M, Durant TJS, Huang C, Mortazavi BJ, Coppi A, Jean RA, et al. Toward dynamic risk prediction of outcomes after coronary artery bypass graft: improving risk prediction with intraoperative events using gradient boosting. Circ Cardiovasc Qual Outcomes. (2021) 14:e007363. doi: 10.1161/CIRCOUTCOMES.120.007363
44. Mejia OAV, Antunes MJ, Goncharov M, Dallan LRP, Veronese E, Lapenna GA, et al. Predictive performance of six mortality risk scores and the development of a novel model in a prospective cohort of patients undergoing valve surgery secondary to rheumatic fever. PLoS ONE. (2018) 13:e0199277. doi: 10.1371/journal.pone.0199277
45. Ghavidel AA, Javadikasgari H, Maleki M, Karbassi A, Omrani G, Noohi F. Two new mathematical models for prediction of early mortality risk in coronary artery bypass graft surgery. J Thorac Cardiovasc Surg. (2014) 148:1291–8.e1291. doi: 10.1016/j.jtcvs.2014.02.028
46. Macrina F, Puddu PE, Sciangula A, Trigilia F, Totaro M, Miraldi F, et al. Artificial neural networks versus multiple logistic regression to predict 30-day mortality after operations for type a ascending aortic dissection. Open Cardiovasc Med J. (2009) 3:81–95. doi: 10.2174/1874192400903010081
47. Mendes RG, de Souza CR, Machado MN, Correa PR, Di Thommazo-Luporini L, Arena R, et al. Predicting reintubation, prolonged mechanical ventilation and death in post-coronary artery bypass graft surgery: a comparison between artificial neural networks and logistic regression models. Arch Med Sci. (2015) 11:756–63. doi: 10.5114/aoms.2015.48145
48. Gómez D, Rojas A. An empirical overview of the no free lunch theorem and its effect on real-world machine learning classification. Neural Comput. (2016) 28:216–28. doi: 10.1162/NECO_a_00793
49. Blanchard M, Feuilloy M, Gervès-Pinquié C, Trzepizur W, Meslier N, Goupil F, et al. Cardiovascular risk and mortality prediction in patients suspected of sleep apnea: a model based on an artificial intelligence system. Physiol Meas. (2021) 42. doi: 10.1088/1361-6579/ac2a8f
50. Xu F, Chen X, Li C, Liu J, Qiu Q, He M, et al. Prediction of multiple organ failure complicated by moderately severe or severe acute pancreatitis based on machine learning: a multicenter cohort study. Mediators Inflamm. (2021) 2021:5525118. doi: 10.1155/2021/5525118
51. Ming C, Viassolo V, Probst-Hensch N, Chappuis PO, Dinov ID, Katapodi MC. Machine learning techniques for personalized breast cancer risk prediction: comparison with the BCRAT and BOADICEA models. Breast Cancer Res. (2019) 21:75. doi: 10.1186/s13058-019-1158-4
52. van Kimmenade RR, Mohammed AA, Uthamalingam S, van der Meer P, Felker GM, Januzzi JL Jr, et al. Red blood cell distribution width and 1-year mortality in acute heart failure. Eur J Heart Fail. (2010) 12:129–36. doi: 10.1093/eurjhf/hfp179
53. Seth HS, Mishra P, Khandekar JV, Raut C, Mohapatra CKR, Ammannaya GKK, et al. Relationship between high red cell distribution width and systemic inflammatory response syndrome after extracorporeal circulation. Braz J Cardiovasc Surg. (2017) 32:288–94. doi: 10.21470/1678-9741-2017-0023
54. Bujak K, Wasilewski J, Osadnik T, Jonczyk S, Kołodziejska A, Gierlotka M, et al. The prognostic role of red blood cell distribution width in coronary artery disease: a review of the pathophysiology. Dis Markers. (2015) 2015:824624. doi: 10.1155/2015/824624
55. Lechiancole A, Sponga S, Vendramin I, Valdi G, Ferrara V, Nalli C, et al. Red blood distribution width and heart transplantation: any predictive role on patient outcome? J Cardiovasc Med. (2019) 20:145–51. doi: 10.2459/JCM.0000000000000747
56. Benedetto U, Angeloni E, Melina G, Pisano C, Lechiancole A, Roscitano A, et al. Red blood cell distribution width predicts mortality after coronary artery bypass grafting. Int J Cardiol. (2013) 165:369–71. doi: 10.1016/j.ijcard.2012.08.029
57. Le Gall JR, Lemeshow S, Saulnier F. A new Simplified Acute Physiology Score (SAPS II) based on a European/North American multicenter study. JAMA. (1993) 270:2957–63. doi: 10.1001/jama.1993.03510240069035
58. Schoe A, Bakhshi-Raiez F, de Keizer N, van Dissel JT, de Jonge E. Mortality prediction by SOFA score in ICU-patients after cardiac surgery; comparison with traditional prognostic-models. BMC Anesthesiol. (2020) 20:65. doi: 10.1186/s12871-020-00975-2
59. Lassnigg A, Schmidlin D, Mouhieddine M, Bachmann LM, Druml W, Bauer P, et al. Minimal changes of serum creatinine predict prognosis in patients after cardiothoracic surgery: a prospective cohort study. J Am Soc Nephrol. (2004) 15:1597–605. doi: 10.1097/01.ASN.0000130340.93930.DD
Keywords: prediction model, machine learning, cardiac surgery, intensive care unit, long-term mortality, MIMIC-III database
Citation: Yu Y, Peng C, Zhang Z, Shen K, Zhang Y, Xiao J, Xi W, Wang P, Rao J, Jin Z and Wang Z (2022) Machine Learning Methods for Predicting Long-Term Mortality in Patients After Cardiac Surgery. Front. Cardiovasc. Med. 9:831390. doi: 10.3389/fcvm.2022.831390
Received: 08 December 2021; Accepted: 21 March 2022;
Published: 03 May 2022.
Edited by:
Massimo Bonacchi, University of Florence, ItalyReviewed by:
Antonino S. Rubino, University of Campania Luigi Vanvitelli, ItalyCopyright © 2022 Yu, Peng, Zhang, Shen, Zhang, Xiao, Xi, Wang, Rao, Jin and Wang. This is an open-access article distributed under the terms of the Creative Commons Attribution License (CC BY). The use, distribution or reproduction in other forums is permitted, provided the original author(s) and the copyright owner(s) are credited and that the original publication in this journal is cited, in accordance with accepted academic practice. No use, distribution or reproduction is permitted which does not comply with these terms.
*Correspondence: Zhichao Jin, amluemhpY2hhb0BzbW11LmVkdS5jbg==; Zhinong Wang, d2FuZ3puMDA3QHNtbXUuZWR1LmNu
†These authors have contributed equally to this work and share first authorship
Disclaimer: All claims expressed in this article are solely those of the authors and do not necessarily represent those of their affiliated organizations, or those of the publisher, the editors and the reviewers. Any product that may be evaluated in this article or claim that may be made by its manufacturer is not guaranteed or endorsed by the publisher.
Research integrity at Frontiers
Learn more about the work of our research integrity team to safeguard the quality of each article we publish.