
95% of researchers rate our articles as excellent or good
Learn more about the work of our research integrity team to safeguard the quality of each article we publish.
Find out more
ORIGINAL RESEARCH article
Front. Cardiovasc. Med. , 22 March 2022
Sec. Cardiovascular Imaging
Volume 9 - 2022 | https://doi.org/10.3389/fcvm.2022.823436
This article is part of the Research Topic Emerging Methods in Non-invasive Vascular Imaging View all 11 articles
 Danli Shi1
 Zhihong Lin2
 Wei Wang1
 Zachary Tan3
 Xianwen Shang4
 Xueli Zhang4
 Wei Meng5
 Zongyuan Ge6
 Mingguang He1,3,4*
Motivation: Retinal microvasculature is a unique window for predicting and monitoring major cardiovascular diseases, but high throughput tools based on deep learning for in-detail retinal vessel analysis are lacking. As such, we aim to develop and validate an artificial intelligence system (Retina-based Microvascular Health Assessment System, RMHAS) for fully automated vessel segmentation and quantification of the retinal microvasculature.
Results: RMHAS achieved good segmentation accuracy across datasets with diverse eye conditions and image resolutions, having AUCs of 0.91, 0.88, 0.95, 0.93, 0.97, 0.95, 0.94 for artery segmentation and 0.92, 0.90, 0.96, 0.95, 0.97, 0.95, 0.96 for vein segmentation on the AV-WIDE, AVRDB, HRF, IOSTAR, LES-AV, RITE, and our internal datasets. Agreement and repeatability analysis supported the robustness of the algorithm. For vessel analysis in quantity, less than 2 s were needed to complete all required analysis.
The morphology of the retinal vessels is closely correlated with the microvascular state of the body. The retinal vasculature is organized within a delicate, optimized structure that minimizes shear stresses due to blood flow and energy used for perfusion, achieving sufficient energy supply with minimal cost (1). Changes in retinal vascular morphology have previously been reported to be associated with a wide range of ocular and systemic diseases (2–5), including life-threatening cardiovascular disease. Deviation from the geometric ideal and measurement of vessel changes may provide a quantitative assessment of vessel deformity and pathology. Quantification of these changes may enhance our understanding of the relationship between ocular and systemic changes and promote the use of the retinal vessels as novel biomarkers in the management of chronic diseases.
Computer-assisted technology has enabled the quantification of retinal morphology. A series of machine learning methods and software tools have been developed for the quantified assessment of the retinal vasculature. Widespread use of these tools however has been limited due to their need for manual input [IVAN (6), SIVA (7), VAMPIRE (8)], time-consuming nature [IVAN (6), SIVA (7)], applicability to only specific retinal regions [IVAN (6), SIVA (7)], or a limited number of measurement parameters [IVAN (6), VAMPIRE (8), QUARTZ (9, 10)].
Deep learning (DL) has been established in recent years as the dominant paradigm for retinal image processing. It has outperformed other machine learning (ML) methods in achieving retinal vessel segmentation with minimal time and state-of-the-art accuracy (11). Widespread adoption in real-world settings however depends on its ability to address variations in image quality and artifacts, resolutions and modality of various fundus cameras, and the interference of pathologic lesions on vessel segmentation. A further common challenge for vessel segmentation is broken vessels at branching or crossing points, which often result in misclassification of arteries and veins, or discontinued vessels. In addition to vessel segmentation, SIVA-DLS (12) is a recently developed deep learning system that directly predicts vessel caliber based on cropped retinal fundus without performing segmentation. However, this tool is restricted to a limited region of the retina and evaluates only a small number of vessel parameters.
Training deep learning algorithms with larger datasets and sufficient variation may help address these challenges. However, given the labor intensiveness in labeling vessels manually, there are much fewer training data available for vessel segmentation than disease classification. Most databases with annotated vessels used in algorithm development are homogeneous, small, and free of eye diseases, compromising the adoption of algorithms trained on these data in real-world clinical settings.
As such, we developed and validated a deep learning system (Retina-based Microvascular Health Assessment System, RMHAS) using multi-source data to provide fast, reliable, and detailed retinal vessel quantification. We intend to provide RMHAS as a public tool to enable automated high-throughput retinal vessel analysis on large collections of fundus images.
RMHAS consisted of several functional parts. Firstly, the image quality assessment module assessed overall image quality before segmentation. Secondly, the segmentation module generated artery, vein, and optic disc segmentation maps. Thirdly, based on segmentation, the measurement module computed region-specific measurements within the Standard zone (a zone 0.5–1.0 disc diameter away from the optic disk margin), (13) and global physical or geometric measures for the whole fundus image. Lastly, a second quality assessment was carried out to filter out abnormal measurements and exclude incompetent detections based on specific criteria. Final results were subsequently generated. Figure 1A outlines a flowchart of the software development process.
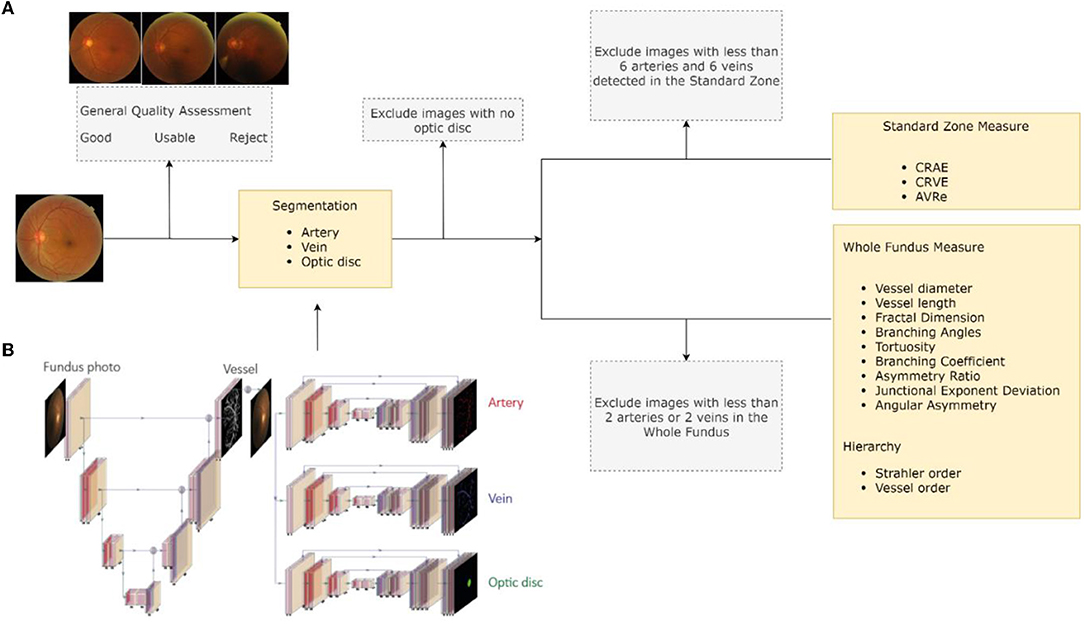
Figure 1. Software development flowchart. (A) Retina-based Microvascular Health Assessment System (RMHAS) workflow. (B) The multi-branch U-Net used in RMHAS for segmentation. The trunk generates an intermediate retinal vessel feature map, which is concatenated with the input image and divided into three separate branches for retinal artery, vein, and optic disc segmentation.
To train the segmentation algorithm for RMHAS, we built a large manually labeled retinal artery/vein segmentation database. This database included diverse eye diseases, age groups, and imaging devices. Two hundred and twenty images with significant variations were initially included, of which 20 came from the UK Biobank (14), 120 from the LabelMe platform (15). 50 from the Lingtou Eye Cohort Study (LECS) (16). and 30 from the Guangzhou Twin Eye Study (GTES) (17). These images were composed of 60 images with diabetic retinopathy ranging from mild to severe non-proliferative, 20 images with age-related macular degeneration (AMD), 20 with glaucoma, 20 with pathologic myopia (PM), and 20 with hypertension. 20 images for each age group of <18, 18 to 50, and ≥ 50 years were included. To represent healthy images, another 200 images were randomly selected from the UK Biobank population-based study (Table 1).
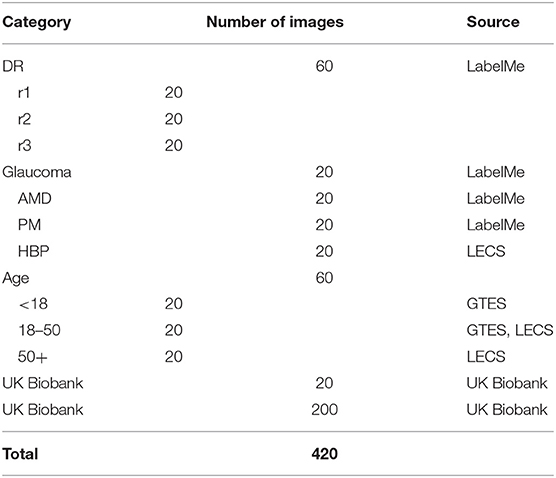
Table 1. The composition of the newly-built dataset for retinal artery, vein, and optic disc segmentation. LECS, Lingtou Eye Cohort Study; GTES, Guangzhou Twin Eye Study.
Vessel annotation was performed according to the following procedure. Firstly, we generated artery/vein (A/V) segmentation maps by supplying the fundus images to the W-Net model (18). After this, image graders using custom software can modify or fine-tune vessel segmentation as per A/V segmentation maps. Secondly, to make low-contrast small vessels more identifiable, we carried out image enhancements using contrast limited adaptive histogram equalization (CLAHE). Pre-segmentations generated by the W-Net model could be overlaid on the original fundus or the augmented image. Image graders could switch between different modalities to verify their segmentation and erase or add vessels. The custom software interface developed for this image annotation process is illustrated in Supplementary Figure 1.
All images were randomly assigned to one of four image graders who were trained by an ophthalmologist. These image graders were requested to independently modify and segment the retinal arteries, veins, and optic disc. To assess inter-observer variability, ~10 percent of images were repeatedly labeled between different graders. To assess intra-observer consistency, around 10 percent of the images were repeatedly labeled by the same grader. Cohen's kappa score was computed to assess inter-observer and intra-observer reliability.
To improve model generalizability and robustness, data from 20 public datasets were also used in the development of the segmentation algorithm. The STARE (19), VEVIO (20, 21). CHASEDB (22), DR HAGIS (23), UoA-DR (24), and PRIME-FP20 (25) datasets were used for vessel segmentation. The RITE (26), HRF (27), AV-WIDE (28, 29), IOSTAR (30, 31), LES-AV (32), and AVRDB (33) datasets were used for artery and vein classification. For optic disc segmentation, the ONHSD (34), DRIONS-DB (35), Drishti-GS (36), RIGA (37), REFUGE (38), G1020 (39), PALM (40), and ADAM (41) datasets were used. Although those datasets have previously been used to develop segmentation algorithms, their label quality varies.
In summary, a diverse collection of datasets composed of fundus images of varying image qualities, resolutions, pathologies, and modalities were included in developing this algorithm. As the size of datasets varied significantly, training and validation set splits were carried out as follows: 20 official training and test set images were split from the CHASEDB dataset; if the dataset had fewer than 100 total images, training and test images followed an 80/20 split; and if the dataset had more than 100 images, only 20 images were split into the test set. Table 2 describes the characteristics of the 21 datasets used to develop the segmentation algorithm. Diagrams in Supplementary Figure 2 outlines the train/test division.
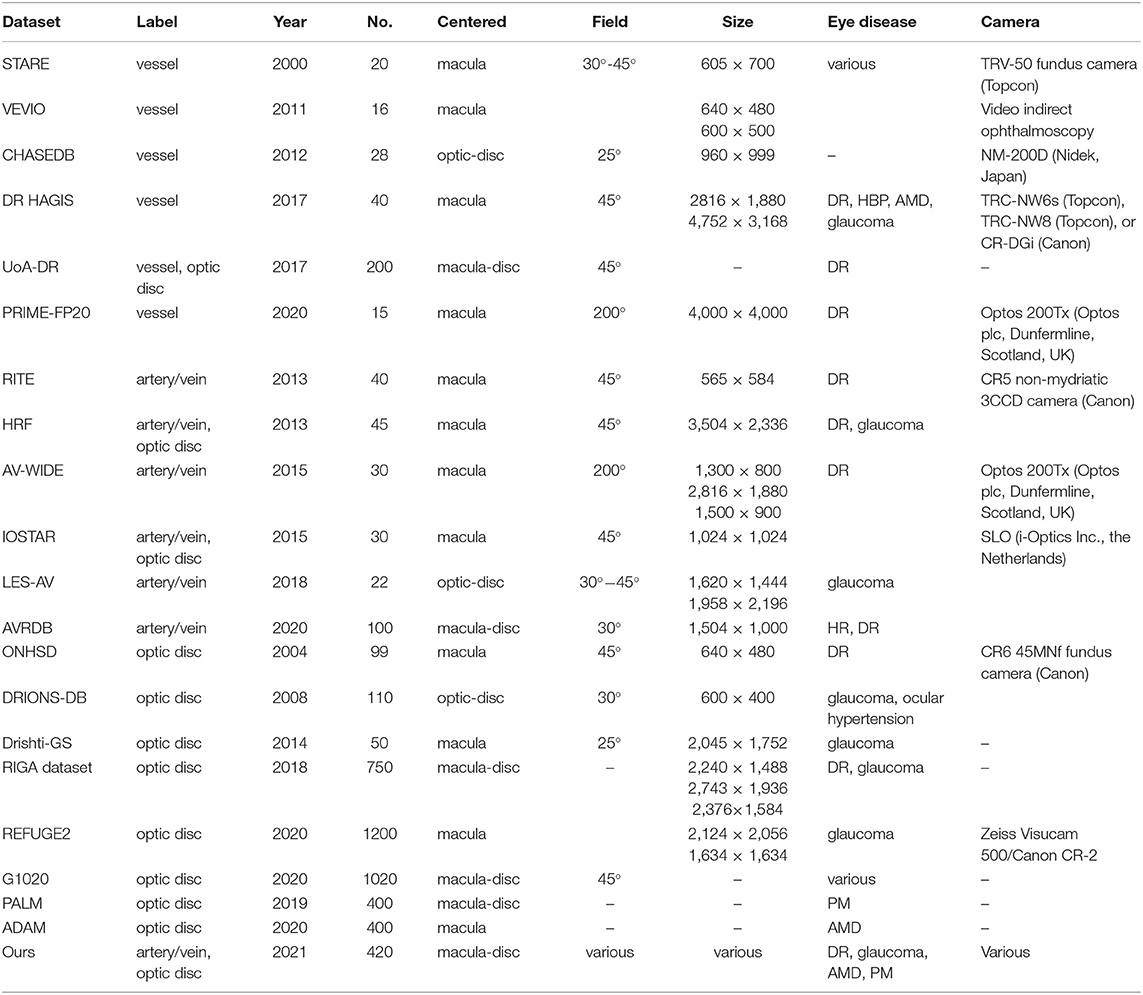
Table 2. Characteristics of the 21 datasets used to develop the segmentation algorithm. Only images with available labels were included. AMD, age-related macular degeneration; HR, hypertensive retinopathy; PM, pathologic myopia; DR, diabetic retinopathy.
The study was conducted in accordance with the Declaration of Helsinki, using deidentified retinal photographs from previously published studies. Ethics Committee ruled that approval was not required for this study.
As noted earlier, the first functional part of RMHAS is a classification of overall image quality before before vessel segmentation. This was carried out using a convolutional neural network (CNN) model built from the EyeQ dataset (42), and enabled classification of overall image quality into three grades: “good,” “usable,” and “reject.” Images with clear and identifiable main structures and lesions, but with some low-quality factors (blur, insufficient illumination, shadows) were classified as “usable”. Images with serious quality issues that could not be reliably diagnosed by an ophthalmologist were classified as “reject”.
A second quality assessment was performed after segmentation. Images with the following conditions were excluded: no detectable optic disc; <6 arteries six veins detectable in the Standard zone; or <2 arteries and two veins detected in the whole fundus. Excluded images, the reason for their exclusion, and their available measurements were saved separately from the main measurements.
We extended the U-Net component from W-Net (18) into multiple branches to enable simultaneous and efficient retinal artery, vein, and optic disc segmentation. Figure 1B outlines the details of the RMHAS segmentation architecture. The input for RMHAS was a fundus image, cropped to the field of view (FOV) and resized to 512 ×512 pixels. The first intermediate layer generated a segmentation map based on the whole retinal vessel map and concatenated it to the original fundus image. This first segmentation map could then be used by the downstream network as an attention map, to focus more on targeted areas of the image. The following segmentations were carried out in three separate branches for the retinal arteries, veins, and optic disc, using these features as guidance.
We trained the RMHAS step-by-step by first training the root branch to generate an intact vessel map. The root branch was then frozen, with the artery, vein, and optic branches unfrozen and trained iteratively. We trained RMHAS with a preset of 200 epochs, a batch size of 8, and a cosine-shaped learning rate from 0.1 to 0.00001. To tackle class imbalance issues – i.e., far more background pixels than foreground (vessel) pixels, we used a weighted combination of Cross-entropy loss and Dice loss (1:3) as the objective function (detailed in the Supplementary Methods). The Adam optimizer (43) was used in backpropagation to minimize the objective function by optimizing the model parameters. To reduce overfitting, we did data augmentation by random horizontal and vertical flipping, rotating between 0 and 45°, and by transforming contrast and illumination (Supplementary Methods). We also used early stopping if validation loss did not improve for 10 epochs. To alleviate issues of broken vessels at branch-ing/crossing points, we performed further data augmentation by specifically cropping out a random number of branching/crossing regions with random sizes for training (to create more pieces of crossing vessel segments and increase variations). This model was trained on the PyTorch platform.
We measured retinal vessel morphology by using custom region-specific summarization and global physical/geometric parameters. For region-specific summarization, the vessel calibers were summarized as central retinal artery equivalent (CRAE) and central retinal vein equivalent (CRVE) from the 6 largest arteries and veins detected in the Standard zone, based on the revised Knudtson-Parr-Hubbard formula (44). Artery to vein ratio from equivalents (AVRe) was generated by dividing CRAE by CRVE. For global physical/geometric parameters, vessels were converted into segments separated by interruptions at the branching or crossing points. Short vessels <10 pixels in length were excluded from the analysis. Using methods similar to SIVA (13), the diameters (mean, standard deviation [SD]), arc length, chord length, length diameter ratio (LDR), tortuosity, branching angle (BA), branching angle from edges (BA_edge), branching coefficient (BC), angular asymmetry (AA), asymmetry ratio (AR), junctional exponent deviation (JED) were measured and computed. The vessel orders and Strahler orders of each segment were built using graphical representation, resulting in a series of hierarchical nodes and edges. In summary, 16 basic parameters were included. Detailed formulas and methods are presented in the Supplementary Methods. Graphs were built using the Python package NetworkX.
We assessed the accuracy of segmentation at the pixel level.
Quantitative evaluation criteria including the area under the receiver operator characteristic curve (AUC), accuracy, sensitivity, specificity, between manually labeled and predicted segmentations were computed.
Qualitative evaluation was performed by overlaying predicted segmentations with manually labeled segmentation, using different colors for visual analysis.
For external validation, we performed retinal vessel segmentation and width measure using the pubic REVIEW (45) dataset as reference.
For reliability, intraclass correlation coefficient (ICC) and Bland–Altman plots were used to assess agreement in Standard zone measurements between manually labeled and predicted segmentation.
For repeatability, the ICCs were computed between all measurements on photographs taken repeatedly under similar illumination and locations for the same eye with the same camera.
ICC values of <0.5, 0.5–0.75, 0.75–0.9, and ≥ 0.90 are indicative of poor, moderate, good, and excellent reliability, respectively (46).
Statistical analysis was completed with R version 4.0.1 and Python 3.6.
The UK Biobank is an open-access resource to researchers through registration of proposed research. The remaining in-house dataset is available from the corresponding author upon reasonable request.
The code of this study is available from the corresponding author upon request. All models were built using publicly available software and packages.
The four observers achieved moderate consistency in intra- and inter-observer agreement analysis. Detailed kappa scores are presented in Supplementary Table 1. For segmentation accuracy, the algorithm achieved AUC (95% CI) of 0.914 (0.914–0.915), 0.913 (0.913–0.914), 0.948 (0.948–0.948), 0.919 (0.918–0.920), 0.959 (0.959–0.960), 0.953 (0.952–0.953), 0.922 (0.922–0.922) for artery segmentation and 0.930 (0.929–0.931), 0.940 (0.939–0.940), 0.956 (0.956–0.956), 0.935 (0.934–0.936), 0.961 (0.961–0.962), 0.959 (0.959–0.960), 0.948 (0.948–0.949) for vein segmentation on the AV-WIDE, AVRDB, HRF, IOSTAR, LES-AV, RITE and our dataset, respectively. Figure 2 plots the model's ROC curves in different datasets. Detailed evaluation results are presented in Table 3. Figure 3 shows representative examples of overlaid segmentations for images with different features, including a normal fundus, fundus image from young participants with prominent retinal nerve fiber layer reflections, blurred image from older participants, fundus with AMD, PM, and severe DR. Blue pixels represent false negatives (pixels that were manually labeled but missed by the model). Red pixels represent false positives (pixels identified by the model but missed by manual labeling). Green pixels represent pixels with consistent segmentation between model and manual labeling.
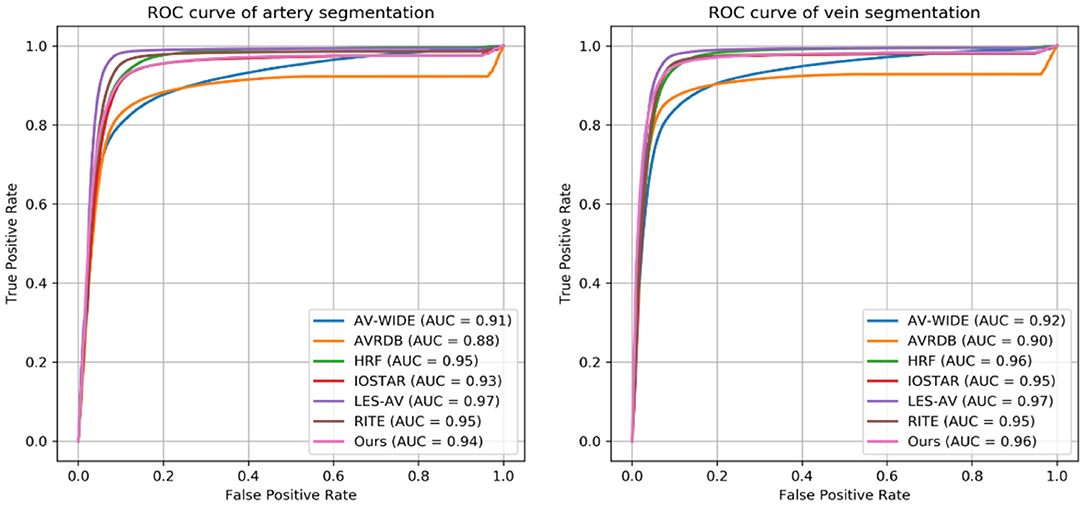
Figure 2. Receiver operating characteristic (ROC) curves of Retina-based Microvascular Health Assessment System (RMHAS) for segmentation of artery and vein within different datasets.
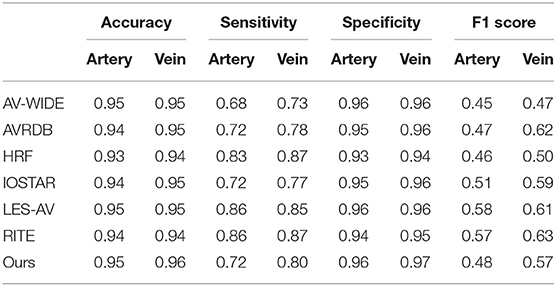
Table 3. Segmentation performance of Retina-based Microvascular Health Assessment System (RMHAS) on the test set in different datasets.
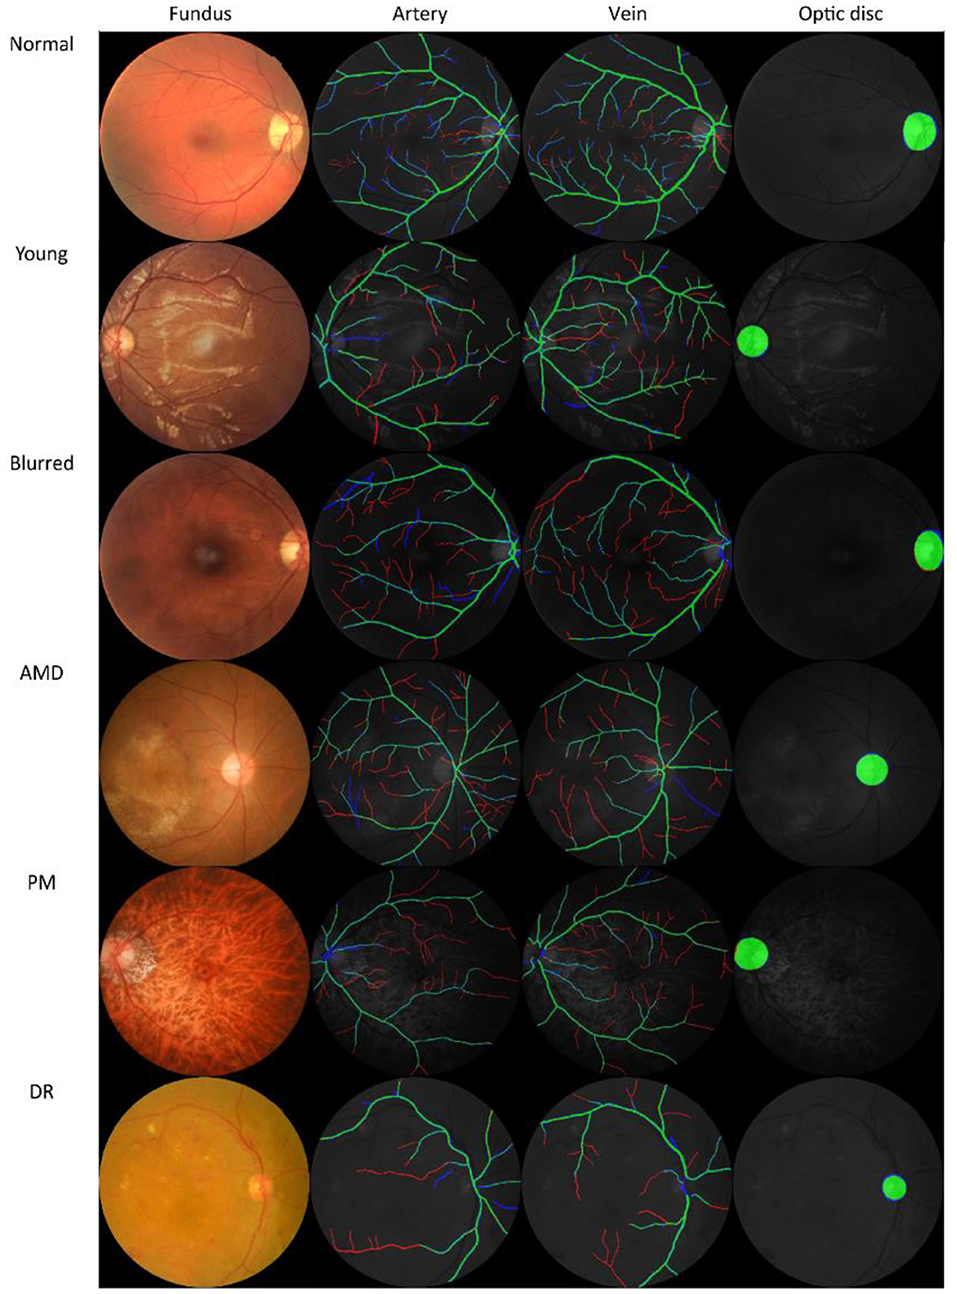
Figure 3. Examples of model prediction by Retina-based Microvascular Health Assessment System (RMHAS) versus manual segmentation. Blue pixels: false negatives (pixels that were manually labeled but missed by the model). Red pixels: false positives (pixels identified by the model but missed by manual labeling). Green pixels: pixels with consistent segmentation between model and manual labeling. AMD, age-related macular degeneration; PM, pathologic myopia; DR, diabetic retinopathy.
For external validation, the vessel segmentation performance and width measure results in the REVIEW database are shown in the Supplementary Table 2 and Supplementary Figure 3.
Agreement between retinal vessel caliber in the Standard zone, measured on RMHAS predicted segmentation and human segmentations were estimated using ICC. Agreements of vessel equivalent measurements on our dataset were excellent, good, or excellent on LES-AV (a dataset composed purely of disc-centered fundus images) but moderate or below on AVRDB, HRF, RITE (composed of macula-centered photos), suggesting to achieve ideal Standard zone measures, images should be optic-disc centered (similar to SIVA). Detailed ICC results are presented in Table 4. Bland-Altman plots of the agreement of (a) retinal arteriolar caliber and (b) retinal venular caliber, (c) AVRe between manual and predicted vessel maps, (d) differences between AVRe measures on manual and predicted vessel maps; vs. the distance of the optic disc center to the edge of FOV are displayed in Supplementary Figure 3.
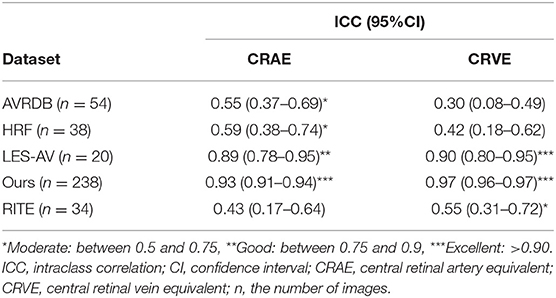
Table 4. Agreement estimates of retinal-vessel caliber in the Standard zone for measurements on RMHAS segmentation and manual segmentation.
The reproducibility and robustness of the measurements were measured by comparing measurements generated from photographs taken repeatedly under similar conditions. For measurements in the Standard zone, 198 of 1290 (15.3%) images failed quality control in Standard zone measures. Of these, 9, 22, and 120 images were classified as good, usable, and reject in the first quality assessment module. The model achieved excellent agreement for measurements generated under similar conditions (Table 5A). For measurements within the whole fundus, 8 (0.6%) of images failed quality control in whole fundus measures and generated 114,809 vessel segments for analysis. The model achieved moderate to good agreement for measurements based on all vessels (Table 5B).
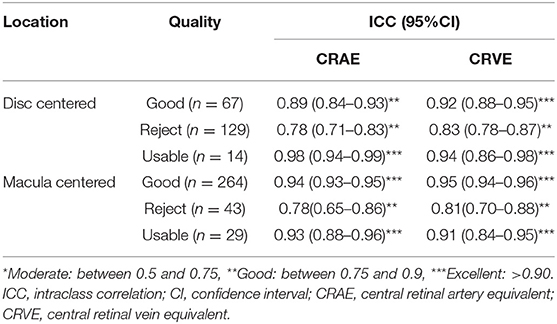
Table 5A. Agreement estimates of measurements in the Standard zone on photographs taken repeatedly under similar conditions.

Table 5B. Agreement estimates of measurements based on the whole fundus on photographs taken repeatedly under similar conditions.
Figure 4 shows an example of the RMHAS model output. Measures are demonstrated and plotted visually. Users can easily evaluate the performance of each functional part throughout the analysis.
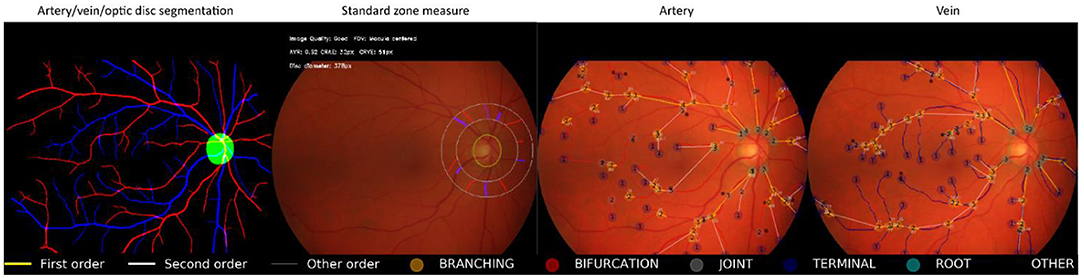
Figure 4. Illustration of Retina-based Microvascular Health Assessment System (RMHAS) output. From left to right: artery, vein, and optic disc segmentation; parameters measured in the standard zone; parameters measured in the whole fundus for artery and vein, respectively. Measures are demonstrated and plotted visually. Users can examine the performance of each functional part throughout the analysis.
Retinal vessel segmentation is challenging and often compromised by interference from the central light reflex, image quality variation and artifact, poor image contrast of small vessels, broken vessels at branching/crossing points, and pathological retinal lesions.
To tackle these challenges, we first built the largest manually labeled retinal artery and vein segmentation dataset known to date, to train the segmentation algorithm. Secondly, we specifically designed a deep learning architecture that harnessed a two-stage sequential segmentation, where the intermediate vessel segmentation was used to guide subsequent multi-branch segmentations. The separate branches that segmented arteries, veins, and the optic disc reduced the difficulty in distinguishing artery and vein pixels from a single branch. Thirdly, we carried out data augmentation specifically for artery and vein crossing areas.
RMHAS addresses the limitations of existing algorithms and software, including IVAN (6), SIVA (7), and VAMPIRE (8). which are semi-automatic and have limited regions of interest (ROI). IVAN (6) and SIVA (7) require more than 20 min to process each image, and QUARTZ (9) takes on average 53.6 s per analysis. The QUARTZ (9) platform can analyze whole fundus images but has few output parameters (artery/vein width and tortuosity). SIVA-DLS (12) is the only published deep learning system to use fundus images and predict vessel caliber end-to-end without vessel segmentation. It was built based on measured CRAE, CRVE values from SIVA. This method is straightforward but might lack interpretability. Further, SIVA-DLS is restricted to examining the Extended zone (from 0.5 to 2.0-disc diameter) (13) and has limited output parameters (CRAE, CRVE, AVR only).
In comparison, the RMHAS algorithm provides a far larger number of physical and geometric parameters without sacrificing efficiency. In addition to standard vessel caliber measurements, RMHAS provides measurements on tortuosity, LDR, JED, AR with additional topological information. These measurements are unitless and are less sensitive to diametric measurement noise. The Strahler order corresponds to branching complexity (47). Vessel order describes the conventional order of division of each branch of a vessel. These measurements facilitate flexibility in subsequent analysis. For example, they could be stratified when summarizing the thickness or length of a vessel; or calculated as a global representation of the overall or specified retinal vascular network.
AUC scores were high across different datasets, achieving high pixel-level segmentation accuracy. Interestingly, the visualization of overlaid manual-predicted segmentation suggested that model predictions outperformed manual labeling, especially for small vessels that human graders often missed. For challenging cases, including images from young participants with highly reflective retinal nerve fiber layers, elderly participants with blurred retinal images, or retinal images with existing eye diseases, the algorithm provided segmentations more accurate than human graders.
Internal validation demonstrated reproducibility and robustness in vessel measurements. In general, vessel calibers measured within the Standard zone in disc-centered images were most robust. All measurements achieved good or better agreement.
For external validation, we should note that measurements are often not directly comparable between different algorithms or software, particularly for measurements with units. For example, CRAE and CRVE measurements between SIVA and other software tools have been previously reported as not equivalent, despite these caliber measurements being associated with the same systemic health risk factors (48). Discrepancy in caliber measurement is often due to variation in magnification during image acquisition. A meaningful comparison would require Littmann's method (49) to adjust the magnification factor by considering refractive error, corneal curvature, and axial length and adapting them for Gullstrand's schematic eye. More importantly, this adjustment method would require fundus cameras to be constructed based on a telecentric ray path. However, most fundus cameras currently on the market do not strictly follow this principl (50). Further, even when magnification is appropriately adjusted, caliber should ideally be measured when the structure of interest is in the same position within the photo, although this is virtually impossible. All of these factors may result in variations in the caliber measurement (50). Given these challenges and the need to enable measures on images with unknown fundus camera and magnification settings, we chose to present caliber measurements in pixel units rather than micron values. Notably in the Bland-Altmann plots (Supplementary Figure 3), the variance in differences increases as retinal vessel caliber increases for both venules and arterioles in our dataset, which we assume was resulted from the diversity of the dataset, which is constituted of images from different cameras. However, their ratios were more stable. This suggests when analyzing images across different cameras, relevant measurements should be adjusted, for example, CRAE be adjusted by CRAE, or use the ratio values instead.
Table 6 summarizes and compares existing retinal vessel measurement algorithms and software. RMHAS achieved sufficient reliability and efficiency in critical retinal vessel measurements. With 558,420 parameters, the algorithm required <2 s to complete all the segmentation and analysis when running images in batches on a server with one GeForce GTX TITAN GPU (Nvidia Inc., CA, USA) and an Intel Core i7-4790K CPU. The mean time cost for each task within the algorithm, as tested by analyzing 100 images, were as follows: image quality: 0.02 s; artery, vein, optic disc segmentation: 0.05 s; Standard zone measure: 0.17 s; vessel graph building: 0.51 s; graph plotting: 1 s.
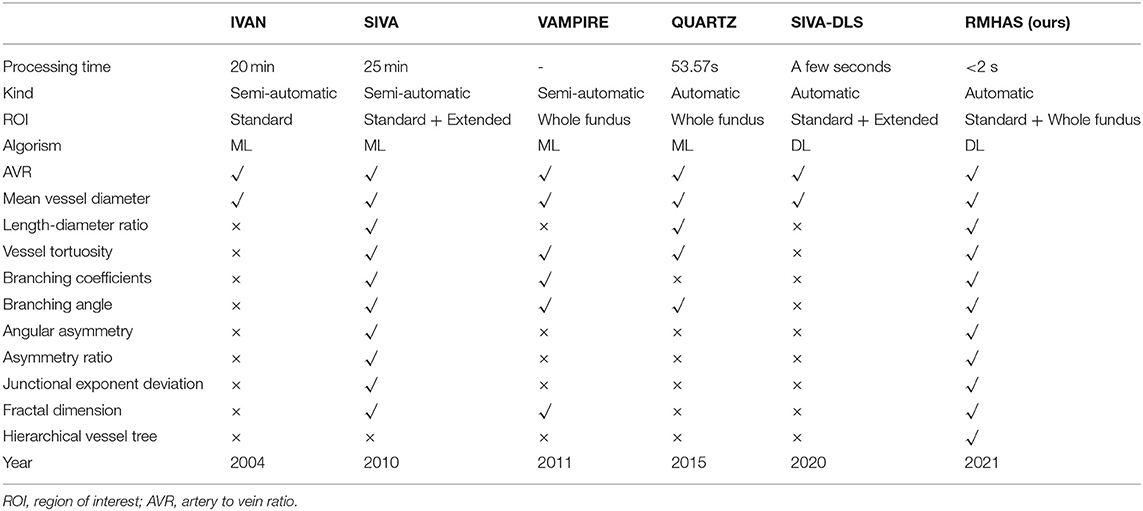
Table 6. Comparison of different algorithms and software for retinal vessel analysis.
RMHAS has several strengths. It is fast, fully automatic, interpretable, easily accessible, and provides a wide range of measurement parameters with orders. It can handle challenging images, including retinal images with DR, AMD, glaucoma, or images collected from the very young or elderly. Finally, the algorithm is compatible with images obtained from various fundus cameras with different image resolutions. RMHAS limitations include its measurement of retinal caliber value based on pixel units rather than micron measures due to unknown image magnification factors.
RMHAS achieved good segmentation accuracy across datasets with diverse eye conditions and image resolutions. Compared with manual segmentation, RMHAS performed better at outlining small vessels than human graders, especially in challenging cases. The agreement and repeatability analysis supported the robustness of the algorithm. RMHAS was feasible for application in automated high throughput retinal vessel analysis and required minimal time. We intend to provide RMHAS as a public tool for the research community. The algorithm demo is publicly available (https://www.retinavessel.com/) for testing and analysis. For batch analysis in large quantities, please contact us.
The raw data supporting the conclusions of this article will be made available by the authors, without undue reservation.
MH conceptualized and designed the study and had full access to all data. DS and ZL did the deep learning modeling. DS did the literature search and wrote the first draft of the manuscript. DS, WW, and XS did the statistical analysis. ZT, WW, XZ, ZG, and MH reviewed and modified the manuscript. All authors commented on the manuscript.
This work was supported by Fundamental Research Funds of the State Key Laboratory of Ophthalmology, National Natural Science Foundation of China (82171075), Science and Technology Program of Guangzhou, China (202002020049), and Project of Special Research on Cardiovascular Diseases (2020XXG007). MH receives support from the University of Melbourne Research Accelerator Program and the CERA Foundation. The Center for Eye Research Australia receives Operational Infrastructure Support from the Victorian State Government. The sponsor or funding organization had no role in the design or conduct of this research. The sponsor or funding organization had no role in the design, conduct, analysis, or reporting of this study. The funding sources did not participate in the design and conduct of the study, collection, management, analysis interpretation of the data, preparation, review, or approval of the manuscript, and decision to submit the manuscript for publication.
WM was employed by Guangzhou Vision Tech Medical Technology Co., Ltd.
The remaining authors declare that the research was conducted in the absence of any commercial or financial relationships that could be construed as a potential conflict of interest.
All claims expressed in this article are solely those of the authors and do not necessarily represent those of their affiliated organizations, or those of the publisher, the editors and the reviewers. Any product that may be evaluated in this article, or claim that may be made by its manufacturer, is not guaranteed or endorsed by the publisher.
The Supplementary Material for this article can be found online at: https://www.frontiersin.org/articles/10.3389/fcvm.2022.823436/full#supplementary-material
RMHAS, retina-based microvascular health assessment system; AMD, age-related macular degeneration; PM, pathologic myopia; DR, diabetic retinopathy; HR, hypertensive retinopathy; LECS, lingtou eye cohort study; GTES, guangzhou twin eye study; CLAHE, contrast limited adaptive histogram equalization; CNN, convolutional neural network; FOV, field of view; CRAE, central retinal artery equivalent; CRVE, central retinal vein equivalent; AVRe, artery to vein ratio from equivalents; LDR, length diameter ratio; BA, branching angle; BA_edge, branching angle from edges; BC, branching coefficient; AA, angular asymmetry; AR, asymmetry ratio; JED, Junctional exponent deviation; SD, standard deviation; CI, confidence interval; ICC, intraclass correlation coefficient; ROC, receiver operator characteristic; AUC, area under the receiver operator characteristic curve; ROI, region of interest.
1. Murray CD. The Physiological Principle of Minimum Work. Proc Natl Acad Sci U S A. (1926) 12:207–14. doi: 10.1073/pnas.12.3.207
2. Ikram MK, Ong YT, Cheung CY, Wong TY. Retinal Vascular Caliber Measurements: Clinical Significance, Current Knowledge and Future Perspectives. Ophthalmologica. (2013) 229:125–36. doi: 10.1159/000342158
3. Newman A, Andrew N, Casson R. Review of the association between retinal microvascular characteristics and eye disease. Clin Experiment Ophthalmol. (2018) 46:531–52. doi: 10.1111/ceo.13119
4. Farrah TE, Dhillon B, Keane PA, Webb DJ, Dhaun N. The eye, the kidney, and cardiovascular disease: old concepts, better tools, and new horizons. Kidney Int. (2020) 98:323–42. doi: 10.1016/j.kint.2020.01.039
5. Kashani AH, Asanad S, Chan JW, Singer MB, Zhang J, Sharifi M, et al. Past, present and future role of retinal imaging in neurodegenerative disease. Prog Retin Eye Res. (2021) 83:100938. doi: 10.1016/j.preteyeres.2020.100938
6. Wong T. Computer-assisted measurement of retinal vessel diameters in the Beaver Dam Eye Study*1methodology, correlation between eyes, and effect of refractive errors. Ophthalmology. (2004) 111:1183–90. doi: 10.1016/j.ophtha.2003.09.039
7. Yim-lui Cheung C, Hsu W, Lee ML, Wang JJ, Mitchell P, Peter Lau Q, et al. A New Method to Measure Peripheral Retinal Vascular Caliber over an Extended Area. Microcirculation. (2010) 17:495–503. doi: 10.1111/j.1549-8719.2010.00048.x
8. Perez-Rovira A, MacGillivray T, Trucco E, Chin KS, Zutis K, Lupascu C, et al. VAMPIRE: Vessel assessment and measurement platform for images of the REtina. In: 2011 Annual International Conference of the IEEE Engineering in Medicine and Biology Society. Boston, MA: IEEE (2011). p. 3391–4.
9. Fraz MM, Welikala RA, Rudnicka AR, Owen CG, Strachan DP, Barman SA, et al. Quantitative Analysis of Retinal Vessel Topology and size – An automated system for quantification of retinal vessels morphology. Expert Syst Appl. (2015) 42:7221–34. doi: 10.1016/j.eswa.2015.05.022
10. AlBadawi S, Fraz MM. Arterioles and venules classification in retinal images using fully convolutional deep neural network. In: Campilho A, Karray F, ter Haar Romeny B, editors. Image Analysis and Recognition. Cham: Springer International Publishing (2018). p. 659–68.
11. Mookiah MRK, Hogg S, MacGillivray TJ, Prathiba V, Pradeepa R, Mohan V, et al. A review of machine learning methods for retinal blood vessel segmentation and artery/vein classification. Med Image Anal. (2021) 68:101905. doi: 10.1016/j.media.2020.101905
12. Cheung CY, Xu D, Cheng CY, Sabanayagam C, Tham YC, Yu M, et al. A deep-learning system for the assessment of cardiovascular disease risk via the measurement of retinal-vessel calibre. Nat Biomed Eng. (2020) 5:498–508. doi: 10.1038/s41551-020-00626-4
13. Ng EYK, Acharya UR, Suri JS, Campilho A. Image Analysis and Modeling in Ophthalmology. CRC press (2014) p. 402.
14. Chua SYL, Thomas D, Allen N, Lotery A, Desai P, Patel P, et al. Cohort profile: design and methods in the eye and vision consortium of UK Biobank. BMJ Open. (2019) 9:e025077. doi: 10.1136/bmjopen-2018-025077
15. Li Z, Keel S, Liu C, He Y, Meng W, Scheetz J, et al. An Automated Grading System for Detection of Vision-Threatening Referable Diabetic Retinopathy on the Basis of Color Fundus Photographs. Dia Care. (2018) 41:2509–16. doi: 10.2337/dc18-0147
16. Hu Y, Niu Y, Wang D, Wang Y, Holden BA, He M. The association of longitudinal trend of fasting plasma glucose with retinal microvasculature in people without established diabetes. Invest Ophthalmol Vis Sci. (2015) 56:842–8. doi: 10.1167/iovs.14-15943
17. Ding X, Wang W, Scheetz J, He M. The Guangzhou Twin Eye Study: 2019 Update. Twin Res Hum Genet. (2019) 22:492–8. doi: 10.1017/thg.2019.118
18. Galdran A, Anjos A, Dolz J, Chakor H, Lombaert H, Ayed IB. The Little W-Net That Could: State-of-the-Art Retinal Vessel Segmentation with Minimalistic Models. ArXiv. 200901907 [Cs, Eess] (2020).
19. The STARE Project n.d. Available online at: http://cecas.clemson.edu/ahoover/stare/ (accessed December 1, 2020).
20. Estrada R, Tomasi C, Cabrera MT, Wallace DK, Freedman SF, Farsiu S. Exploratory Dijkstra forest based automatic vessel segmentation: applications in video indirect ophthalmoscopy (VIO). Biomed Opt Express, BOE. (2012) 3:327–39. doi: 10.1364/BOE.3.000327
21. Estrada R, Tomasi C, Cabrera MT, Wallace DK, Freedman SF, Farsiu S. Enhanced video indirect ophthalmoscopy (VIO) via robust mosaicing. Biomed Opt Express, BOE. (2011) 2:2871–87. doi: 10.1364/BOE.2.002871
22. Fraz MM, Remagnino P, Hoppe A, Uyyanonvara B, Rudnicka AR, Owen CG, et al. An Ensemble Classification-Based Approach Applied to Retinal Blood Vessel Segmentation. IEEE Trans Biomed Eng. (2012) 59:2538–48. doi: 10.1109/TBME.2012.2205687
23. Holm S, Russell G, Nourrit V, McLoughlin N DR. HAGIS—a fundus image database for the automatic extraction of retinal surface vessels from diabetic patients. J Med Imag. (2017) 4:014503. doi: 10.1117/1.JMI.4.1.014503
24. Chalakkal RJ, Abdulla WH, Sinumol S. Comparative Analysis of University of Auckland Diabetic Retinopathy Database. In: Proceedings of the 9th International Conference on Signal Processing Systems. New York, NY, USA: Association for Computing Machinery (2017). p. 235–239.
25. Ding L, Kuriyan AE, Ramchandran RS, Wykoff CC, Sharma G. Weakly-Supervised Vessel Detection in Ultra-Widefield Fundus Photography Via Iterative Multi-Modal Registration and Learning. IEEE Trans Med Imaging. (2020) 40:2748–58. doi: 10.36227/techrxiv.12283736.v1
26. Hu Q, Abràmoff MD, Garvin MK. Automated separation of binary overlapping trees in low-contrast color retinal images. Med Image Comput Comput Assist Interv. (2013) 16:436–43. doi: 10.1007/978-3-642-40763-5_54
27. Budai A, Bock R, Maier A, Hornegger J, Michelson G. Robust Vessel Segmentation in Fundus Images. Int J Biomed Imaging. (2013) 2013:154860. doi: 10.1155/2013/154860
28. Estrada R, Tomasi C, Schmidler SC, Farsiu S. Tree Topology Estimation. IEEE Trans Pattern Anal Mach Intell. (2015) 37:1688–701. doi: 10.1109/TPAMI.2014.2382116
29. Estrada R, Allingham MJ, Mettu PS, Cousins SW, Tomasi C, Farsiu S. Retinal artery-vein classification via topology estimation. IEEE Trans Med Imaging. (2015) 34:2518–34. doi: 10.1109/TMI.2015.2443117
30. Abbasi-Sureshjani S, Smit-Ockeloen I, Zhang J, Ter Haar Romeny B. Biologically-Inspired Supervised Vasculature Segmentation in SLO Retinal Fundus Images. In: Kamel M, Campilho A, editors. Image Analysis and Recognition. Cham: Springer International Publishing (2015). p. 325–334. doi: 10.1007/978-3-319-20801-5_35
31. Zhang J, Dashtbozorg B, Bekkers E, Pluim JPW, Duits R, Romeny BM. Robust Retinal Vessel Segmentation via Locally Adaptive Derivative Frames in Orientation Scores. IEEE Trans Med Imaging. (2016) 35:2631–44. doi: 10.1109/TMI.2016.2587062
32. Orlando JI, Breda JB, Keer K, Blaschko MB, Blanco PJ, Bulant CA. Towards a Glaucoma Risk Index Based on Simulated Hemodynamics from Fundus Images. Medical Image Computing and Computer Assisted Intervention – MICCAI 2018. Cham: Springer (2018). p. 65–73.
33. Akram MU, Akbar S, Hassan T, Khawaja SG, Yasin U, Basit I. Data on fundus images for vessels segmentation, detection of hypertensive retinopathy, diabetic retinopathy and papilledema. Data Brief. (2020) 29:105282. doi: 10.1016/j.dib.2020.105282
34. Lowell J, Hunter A, Steel D, Basu A, Ryder R, Fletcher E, et al. Optic Nerve Head Segmentation. IEEE Trans Med Imaging. (2004) 23:256–64. doi: 10.1109/TMI.2003.823261
35. Carmona EJ, Rincón M, García-Feijoó J. Martínez-de-la-Casa JM. Identification of the optic nerve head with genetic algorithms. Artif Intell Med. (2008) 43:243–59. doi: 10.1016/j.artmed.2008.04.005
36. Sivaswamy J, Krishnadas SR, Joshi GD, Jain M, Tabish AUS. Drishti-GS: Retinal image dataset for optic nerve head (ONH) segmentation. In: 2014 IEEE 11th International Symposium on Biomedical Imaging (ISBI). IEEE (2014). p. 53–56.
37. Almazroa A, Alodhayb S, Osman E, Ramadan E, Hummadi M, Dlaim M, et al. Retinal fundus images for glaucoma analysis: the RIGA dataset. Medical Imaging 2018: Imaging Informatics for Healthcare, Research, and Applications. Int Soc Opt Photon. (2018) 10579:105790B. doi: 10.1117/12.2293584
38. Orlando JI, Fu H, Barbossa Breda J, van Keer K, Bathula DR, Diaz-Pinto A, et al. REFUGE Challenge: A unified framework for evaluating automated methods for glaucoma assessment from fundus photographs. Med Image Anal. (2020) 59:101570. doi: 10.1016/j.media.2019.101570
39. Bajwa MN, Singh GAP, Neumeier W, Malik MI, Dengel A, Ahmed S. G1020: A Benchmark Retinal Fundus Image Dataset for Computer-Aided Glaucoma Detection. ArXiv. 200609158 [Cs, Eess] (2020). doi: 10.1109/IJCNN48605.2020.9207664
40. Fu H, Li F, Orlando JI, Bogunovic H, Sun X, Liao J, et al. PALM: Pathologic myopia challenge. IEEE Dataport. (2019).
42. Fu H, Wang B, Shen J, Cui S, Xu Y, Liu J, et al. Evaluation of Retinal Image Quality Assessment Networks in Different Color-spaces. ArXiv. 190705345 [Cs] (2019) 11764:48–56. doi: 10.1007/978-3-030-32239-7_6
44. Knudtson MD, Lee KE, Hubbard LD, Wong TY, Klein R, Klein BEK. Revised formulas for summarizing retinal vessel diameters. Curr Eye Res. (2003) 27:143–9. doi: 10.1076/ceyr.27.3.143.16049
45. Al-Diri B, Hunter A, Steel D, Habib M, Hudaib T, Berry S. REVIEW - A reference data set for retinal vessel profiles. In: 2008 30th Annual International Conference of the IEEE Engineering in Medicine and Biology Society. Vancouver, BC: IEEE (2008). p. 2262–2265. doi: 10.1109/IEMBS.2008.4649647
46. Koo TK, Li MY. A Guideline of Selecting and Reporting Intraclass Correlation Coefficients for Reliability Research. J Chiropr Med. (2016) 15:155–63. doi: 10.1016/j.jcm.2016.02.012
47. Reeb C, Kaandorp J, Jansson F, Puillandre N, Dubuisson JY, Cornette R, et al. Quantification of complex modular architecture in plants. New Phytol. (2018) 218:859–72. doi: 10.1111/nph.15045
48. Yip W, Tham YC, Hsu W, Lee ML, Klein R, Klein B, et al. Comparison of Common Retinal Vessel Caliber Measurement Software and a Conversion Algorithm. Trans Vis Sci Tech. (2016) 5:11. doi: 10.1167/tvst.5.5.11
49. Bennett AG, Rudnicka AR, Edgar DF. Improvements on Littmann's method of determining the size of retinal features by fundus photography. Graefe's Arch Clin Exp Ophthalmol. (1994) 232:361–7. doi: 10.1007/BF00175988
Keywords: artificial intelligence, automated analysis, hierarchical vessel morphology, cardiovascular disease, epidemiology
Citation: Shi D, Lin Z, Wang W, Tan Z, Shang X, Zhang X, Meng W, Ge Z and He M (2022) A Deep Learning System for Fully Automated Retinal Vessel Measurement in High Throughput Image Analysis. Front. Cardiovasc. Med. 9:823436. doi: 10.3389/fcvm.2022.823436
Received: 27 November 2021; Accepted: 22 February 2022;
Published: 22 March 2022.
Edited by:
Luca Biasiolli, University of Oxford, United KingdomReviewed by:
Rolando Jose Estrada, Georgia State University, United StatesCopyright © 2022 Shi, Lin, Wang, Tan, Shang, Zhang, Meng, Ge and He. This is an open-access article distributed under the terms of the Creative Commons Attribution License (CC BY). The use, distribution or reproduction in other forums is permitted, provided the original author(s) and the copyright owner(s) are credited and that the original publication in this journal is cited, in accordance with accepted academic practice. No use, distribution or reproduction is permitted which does not comply with these terms.
*Correspondence: Mingguang He, bWluZ2d1YW5nLmhlQHVuaW1lbGIuZWR1LmF1
Disclaimer: All claims expressed in this article are solely those of the authors and do not necessarily represent those of their affiliated organizations, or those of the publisher, the editors and the reviewers. Any product that may be evaluated in this article or claim that may be made by its manufacturer is not guaranteed or endorsed by the publisher.
Research integrity at Frontiers
Learn more about the work of our research integrity team to safeguard the quality of each article we publish.