 Karina P. Gomes1,2Anshul S. Jadli1,2Luiz G. N. de Almeida1,3Noura N. Ballasy1,2Pariya Edalat1,2Ruchita Shandilya1,2Daniel Young1,3Darrell Belke2,4Jane Shearer5,6Antoine Dufour1,3,5,6Vaibhav B. Patel1,2*
- 1Department of Physiology and Pharmacology, Cumming School of Medicine, Calgary, AB, Canada
- 2Libin Cardiovascular Institute, Calgary, AB, Canada
- 3McCaig Institute for Bone and Joint Health, Calgary, AB, Canada
- 4Department of Cardiac Sciences, Cumming School of Medicine, Calgary, AB, Canada
- 5Faculty of Kinesiology, University of Calgary, Calgary, AB, Canada
- 6Department of Biochemistry and Molecular Biology, Cumming School of Medicine, University of Calgary, Calgary, AB, Canada
Diabetic cardiomyopathy (DbCM) occurs independently of cardiovascular diseases or hypertension, leading to heart failure and increased risk for death in diabetic patients. To investigate the molecular mechanisms involved in DbCM, we performed a quantitative proteomic profiling analysis in the left ventricle (LV) of type 2 diabetic mice. Six-month-old C57BL/6J-lepr/lepr (db/db) mice exhibited DbCM associated with diastolic dysfunction and cardiac hypertrophy. Using quantitative shotgun proteomic analysis, we identified 53 differentially expressed proteins in the LVs of db/db mice, majorly associated with the regulation of energy metabolism. The subunits of ATP synthase that form the F1 domain, and Cytochrome c1, a catalytic core subunit of the complex III primarily responsible for electron transfer to Cytochrome c, were upregulated in diabetic LVs. Upregulation of these key proteins may represent an adaptive mechanism by diabetic heart, resulting in increased electron transfer and thereby enhancement of mitochondrial ATP production. Conversely, diabetic LVs also showed a decrease in peptide levels of NADH dehydrogenase 1β subcomplex subunit 11, a subunit of complex I that catalyzes the transfer of electrons to ubiquinone. Moreover, the atypical kinase COQ8A, an essential lipid-soluble electron transporter involved in the biosynthesis of ubiquinone, was also downregulated in diabetic LVs. Our study indicates that despite attempts by hearts from diabetic mice to augment mitochondrial ATP energetics, decreased levels of key components of the electron transport chain may contribute to impaired mitochondrial ATP production. Preserved basal mitochondrial respiration along with the markedly reduced maximal respiratory capacity in the LVs of db/db mice corroborate the association between altered mitochondrial metabolic profile and cardiac dysfunction in DbCM.
Introduction
Diabetes mellitus (DM) is one of the major risk factors for cardiovascular disease (CVD), and CVD is the leading cause of morbidity and mortality worldwide. By 2045, DM is expected to affect 700 million people worldwide, with a prevalence of around 10.9% (1). In 1972, Rubler and colleagues first reported a post-mortem study of four diabetic patients who died of heart failure (HF) without evidence of hypertension, coronary artery disease, or congenital or valvular heart disease (2). This unique form of CVD was termed “diabetic cardiomyopathy” (DbCM). Since then, the pathophysiology of DbCM has been under investigation. However, its underlying molecular mechanisms have not yet been fully elucidated. Elusive molecular pathophysiology has resulted in the lack of standard treatment for DbCM.
The occurrence of DbCM is thought to be multifactorial, and various mechanisms have been proposed to be involved in diabetes-induced cardiac dysfunction, including resistance to metabolic actions of insulin, compensatory hyperinsulinemia, and progression of hyperglycemia in cardiac tissue (3). Together, these alterations result in changes in substrate metabolism and cardiac lipotoxicity (4), deposition of advanced glycated end-products (AGE) (5), endothelial and microvascular impairment (6), inappropriate neurohormonal responses (7), oxidative stress (8), subcellular component abnormalities, and maladaptive immune response (9). These changes result in myocardial injury, fibrosis, and hypertrophy leading to diastolic, and eventually systolic, heart failure (10).
The prevalence of DbCM has been estimated between 30% and 60% in preclinical and clinical stages among the diabetic population (11). Although significant progress has been made in recent years in the diagnosis and management of DbCM, until now, there is no specific therapy for myocardial damage induced by DbCM. A better understanding of the underlying pathological mechanisms of DbCM is highly warranted to further improve the clinical management, and therapy, of DbCM. To decipher the underlying mechanisms involved in DbCM at the molecular level, advanced proteomic profiling of left ventricular (LV) tissue specimens from type 2 diabetic mice was carried out.
Materials and Methods
Experimental Animals
All experiments were performed in accordance with the University of Calgary institutional guidelines, which conform to guidelines published by the Canadian Council on Animal Care and the Guide for the Care and Use of Laboratory Animals published by the U.S. National Institutes of Health (revised 2011). Animals were kept at the animal facilities of the Health Sciences Animal Resources Centre of the University of Calgary. Six-month old male C57BL/6J-lepr/lepr (db/db) and age-matched C57BL/6J (wild-type [WT]) mice were used as experimental units, and a total of 37 mice were used in the current study. Mice were housed in standard animal cages and maintained in a constant environment with controlled room temperature, humidity, and light-dark cycle. They had access to laboratory chow pellets and drinking water ad libitum throughout the study, except before the oral glucose tolerance test, when the animals were fasted for 6 h before the procedure. All studies were approved by the Animal Care Committee of the University of Calgary.
Oral Glucose Tolerance Test
An oral glucose tolerance test was performed in 6 h fasted conscious mice, as previously described (12). Briefly, mice were administered with glucose (1 g/kg) by oral gavage, and the blood glucose levels were monitored repeatedly at 0, 15, 30, 60, 90, and 120 min post-glucose administration. Blood glucose levels were plotted against the time curve to determine glucose tolerance.
Echocardiography and Tissue Doppler Imaging
Cardiac function was evaluated using the Vevo 3100 high-resolution imaging system equipped with a 30-MHz transducer (MX250, VisualSonics) (12–14). Mice were anesthetized with 1.5% isoflurane in 100% oxygen and kept on a heating pad, with body temperature maintained at 36.5–37.5°C. Pre-warmed ultrasound gel was placed on the shaved chest of the anesthetized mouse. The temperature and heart rate were constantly monitored during the scanning. M-mode echocardiography images were obtained to measure LV anterior and posterior wall thickness, and LV end-diastolic and end-systolic dimensions, which were used to calculate fractional shortening (FS) and ejection fraction (EF), measures of the LV systolic function. Diastolic transmitral LV inflow images were obtained from apical four-chamber views using color flow mapping-guided pulsed-wave Doppler and were used to measure early (E) and late (atrial, A) peak filling blood flow velocities (and calculate E/A ratio), isovolumic relaxation time (IVRT), and deceleration time, all commonly used indices of LV diastolic function). Transmitral flow and tissue Doppler imaging were used to assess the E/E' ratio. All echocardiographic images were analyzed using Vevo LAB ultrasound analysis software (v5.5.1).
Shotgun Proteomic Analysis
Mice were euthanized under ketamine and xylazine anesthesia. The hearts were immediately dissected, and the LVs were stored in a −80°C for proteomics analysis. Subsequently, protein samples were lysed with 1% sodium dodecyl sulfalte (SDS), 0.1 M dithiothreitol (DTT) in 200 nM HEPES (pH 8), protease inhibitor tablets (Sigma Aldrich, ON, Canada) with a final concentration of 3 M guanidine HCl (pH 8), 100 mM HEPES, and 10 mM DTT. Samples were alkylated by incubation with a final concentration of 15 mM iodoacetamide (IAA) in the dark for 25 min at room temperature, and the pH was adjusted to 6. Samples were then trypsinized overnight at 37°C using Trypsin gold (Promega, WI, USA). The next day, samples were incubated for 18 h at 37°C with isotopically heavy [40 mM 13CD2O + 20 mM NaBH3CN (sodium cyanoborohydride)] or light labels [40mM light formaldehyde (CH2O) + 20 mM NaBH3CN], to label peptide α- and ε-amines. Samples were passed through a C18 chromatography before being subjected to liquid chromatography and tandem mass spectrometry (LC-MS/MS).
High-Performance Liquid Chromatography and Mass Spectrometry
Liquid chromatography and mass spectrometry experiments were performed at the Southern Alberta Mass Spectrometry (SAMS) core facility at the University of Calgary, Canada. An Orbitrap Fusion Lumos Tribrid mass spectrometer (Thermo Scientific) operated with Xcalibur (version 4.0.21.10) and coupled to a Thermo Scientific Easy-nLC (nanoflow Liquid Chromatography) 1200 system was used for the analysis. Tryptic peptides (2 μg) were loaded into a C18 trap (75 um x 2 cm; Acclaim PepMap 100, P/N 164946; ThermoScientific) at a flow rate of 2 μl/min of solvent A (0.1% formic acid and 3% acetonitrile in LC-MS grade water). Peptides were eluted using a 120 min gradient from 5 to 40% (5 to 28% in 105 min followed by an increase to 40% B in 15 min) of solvent B (0.1% formic acid in 80% LC-MS grade acetonitrile) at a flow rate of 0.3 μL/min and separated on a C18 analytical column (75 um × 50 cm; PepMap RSLC C18; P/N ES803; Thermo Scientific).
Peptides were subsequently electrosprayed using a voltage of 2.3 kV into the ion transfer tube (300°C) of the Orbitrap Lumos operating in positive mode. Orbitrap first performed a full MS scan at a resolution of 120,000 FWHM to detect the precursor ion with an m/z between 375 and 1,575 and a +2 to +7 charge. The Orbitrap Auto Gain Control (AGC) and the maximum injection time were set at 4 × 10⁵ and 50 ms, respectively. Orbitrap was operated using full speed mode with a 3 sec cycle time for precursor selection. The most intense precursor ions showing a peptidic isotopic profile and having an intensity threshold of at least 5,000 were isolated using the quadrupole and fragmented with HCD (30% collision energy) in the ion routing multipole. Fragment ions (MS2) were analyzed in the ion trap at a fast scan rate. The AGC and the maximum injection time were set at 1 x 10⁴ and 35 ms, respectively, for the ion trap. Dynamic deletion was enabled for 45 sec to avoid acquiring the same precursor ion with a similar m/z (plus or minus 10 ppm).
Proteomic Data Analysis
Spectral matching of the resulting raw data was done in MaxQuant (15) software package (v.1.6.10.23) implemented with the Andromeda algorithm using a UniProt murine proteome database, at a peptide-spectrum match false discovery rate of <0.01. Search parameters included a mass tolerance of 20 p.p.m. for the parent ion, 0.5 Da for the fragment ion, carbamidomethylation of cysteine residues (+57.021464 Da), variable N-terminal modification by acetylation (+42.010565 Da), and variable methionine oxidation (+15.994915 Da). N-terminal and lysine heavy (+34.063116 Da) and light (+28.031300 Da) dimethylation were defined as labels for relative quantification. The cleavage site specificity was set to Trypsin/P for the proteomics data, with up to two missed cleavages allowed. Significant outlier cut-off values were determined after Log2 transformation by boxplot-and-whiskers analysis using the BoxPlotR tool (16). The dataset was deposited into the PRIDE database and is freely available using the accession code PXD029566.
Protein–Protein Interactions and Pathway Analysis Using Bioinformatics
The selected proteins were uploaded to Metascape (17) to validate various biological functions of the selected proteins. The Search Tool for the Retrieval of Interacting Genes (STRING) database was used to identify interconnectivity among proteins. The protein interaction relationship is encoded into networks in the STRING v11 database (https://string-db.org). Mus musculus was used as our model organism at a false discovery rate of 1%.
To further appreciate their biological significance, the differentially expressed proteins were subjected to protein network analysis using the Ingenuity Pathway Analysis (IPA) software (Qiagen Inc.) based on curated databases from the literature. These include binding, activation, inhibition, expression, and other protein interactions to generate pathways according to the function of the molecules involved. IPA is a powerful tool widely used in the omics field to suggest/predict the effects of specific conditions or drugs on biological outcomes. Datasets containing protein identifiers (UniProt) and corresponding expression values (Log2 [Fold change]) of db/db vs. age-matched control were uploaded, and predicted networks were analyzed.
Mitochondrial Bioenergetics
Bioenergetics profile of isolated mitochondria was assessed using Seahorse Analyzer XFe24 (Agilent technologies) (18, 19). Briefly, mitochondria were isolated from the LVs of db/db and age-matched WT mice using Dounce homogenization and differential centrifugation as directed by mitochondrial isolation kit for tissue (#ab110168, Abcam). Isolated mitochondria were resuspended in mitochondrial assay solution [MAS; 220 mM mannitol, 10 mM KH2PO4, 5 mM MgCl2, 2 mM HEPES, 1 mM EGTA, and 0.2% (w/v) fatty acid-free BSA, pH 7.2] containing 10 mM of Glutamate (#G8415, Sigma-Aldrich) and 5 mM Malate (#M6413, Sigma-Aldrich) for complex I-driven respiration. The total protein concentration of isolated mitochondria was determined by a BCA assay (#5000116, Bio-Rad). A stock solution of 40 mM ADP (#A2754, Sigma-Aldrich) was prepared in MAS. Stocks of inhibitors and uncouplers were prepared by dissolving 10 mM FCCP (#C2920, Sigma), 5 mg/mL of oligomycin (#O4876, Sigma), and 40 mM of antimycin A (#A8674, Sigma) in DMSO. The mitochondrial coupling assay for isolated mitochondria using substrates specific for the respiratory chain complex I (RCCI) was performed as described previously (18–20). 50 μl suspension of 10 μg isolated mitochondria was loaded in each well of XFe24 plates, except the wells intended for the background correction. Following final concentrations of substrate, inhibitors and uncouplers were used in wells for RCCI-driven respiration: 4 nM ADP (Port A), 2.5 μg/ml oligomycin (Port B), 4 μM FCCP (Port C), and 4 μM Antimycin A (Port D). All data were analyzed using the XFe Wave software (version 2.6; Agilent Technologies) and displayed as point-to-point oxygen consumption rates (pmol/min/well). Data are presented as the average of 3 replicate wells ±SEM.
Western Blot
Western blot analysis was performed in the mitochondrial and cytoplasmic fractions obtained by the mitochondrial isolation kit for tissue (#ab110168, Abcam) as well as in the whole tissue lysates from LVs of db/db and WT mice to validate the purity of the mitochondrial isolation (Figure 7F). Briefly, equal amounts of proteins were separated using SDS-PAGE and electrophoretically transferred to PVDF membranes. Non-specific binding was blocked by incubation in 5% non-fat milk and 0.1% Tween 20 in Tris-buffered saline. The membranes were probed individually with specific primary antibodies against glyceraldehyde 3-phosphate dehydrogenase (GAPDH; 1:1000, #sc-32233, Santa Cruz Biotechnology), voltage-dependent anion channel 1 (VDAC1; 1:1000, #sc-390996, Santa Cruz Biotechnology) and NADH dehydrogenase (ubiquinone) 1 β subcomplex subunit 11 (NDUFB11; 1:1000, #sc-374370, Santa Cruz Biotechnology). After probing with the HRP-linked secondary antibody (anti-mouse IgG, 1:3000, #7076, Cell Signaling Technology), membranes were incubated with SuperSignal West Femto Maximum Sensitivity Substrate (#34096; Thermo Scientific), and chemiluminescence was recorded using iBright™ FL1500 Imaging System (Invitrogen). Immunoreactive bands were quantified by the iBright Analysis Software using the total protein detection (No-Stain Protein Labeling Reagent, #A44717, Invitrogen) as a normalization control.
Statistical Analysis
All data are presented as mean±SEM. The sample sizes were determined based on 95% confidence level. Hypothesis testing methods included unpaired and two-tailed Student's t-test (two independent groups) and repeated measures ANOVA followed by Sidak's multiple comparisons. Statistical comparisons were performed by GraphPad Prism software. Statistical significance is recognized at p < 0.05.
Results
db/db Mice Exhibit Diastolic Dysfunction and Cardiac Remodeling
Leptin-receptor mutant db/db mice exhibit many of the clinical characteristics of type 2 diabetes and metabolic syndrome, including hyperglycemia, hyperinsulinemia, obesity, hypertension, hyperlipidemia, and glucose intolerance (21, 22). We observed significantly increased obesity in db/db mice at 6 months of age (Figure 1A). Increased obesity in db/db mice was also associated with increased fasting blood glucose levels and glucose intolerance, which validated the induction of severe type 2 diabetes in 6 months old db/db mice (Figures 1B,C). Chronic type 2 diabetes in 6 months old db/db mice resulted in the onset of DbCM (Table 1; Figures 1D–K). Quantitative assessments of transthoracic echocardiography and tissue Doppler imaging are presented in Table 1. Compared with age-matched WT mice, db/db mice exhibited significantly increased LV Posterior Wall thickness at diastole (LVPWd) (Figures 1D,E) and systole (LVPWs) (Figures 1D,F), indicative of cardiac hypertrophy in db/db mice. However, no significant differences were observed in systolic function among diabetic and non-diabetic mice (Figures 1D,G,H; Table 1). db/db mice showed reduced E/A ratio (Figure 1I), and markedly increased E/E' ratio, a sensitive indicator of diastolic dysfunction (Figure 1J). However, myocardial Performance Index (MPI), an index that incorporates both systolic and diastolic time intervals in expressing global systolic and diastolic ventricular function was not different between the groups (Figure 1K). Echocardiographic phenotyping validated the onset of DbCM characterized by diastolic dysfunction and cardiac hypertrophy, without any overt systolic dysfunction in 6 months old male db/db mice.
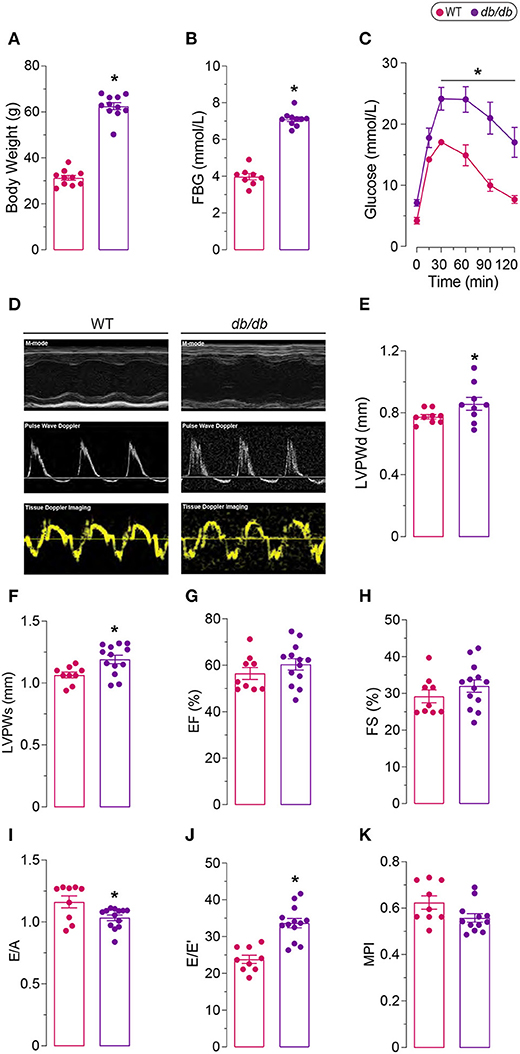
Figure 1. Diabetic phenotype of 6 months old db/db mice. (A) Increased body weight, (B) fasting blood glucose (FBG), and (C) glucose intolerance in db/db mice compared to age-matched controls (WT). (D) Representative M-mode, Pulse Wave Doppler, and Tissue Doppler Imaging echocardiography. Increased left ventricle posterior wall thickness in (E) diastole (LVPWd) and in (F) systole (LVPWs) indicate left ventricular hypertrophy. (G) Ejection fraction (EF) and (H) fractional shortening (FS) remained unaffected, indicating preserved systolic function in db/db mice. (I) Decreased ratio of early to late filling (E/A) and (J) increased ratio of late filling in Pulse Wave Doppler to the late filling in Tissue Doppler (E/E') show abnormal diastolic function. (K) Myocardial performance index (MPI) was not different between the groups. *Represents p-value < 0.05 between WT (n = 8–10) and db/db (n = 9–13) mice. The scale bar shows 1.5 mm [y-axis of (D)], 100 ms [x-axis of (D)].
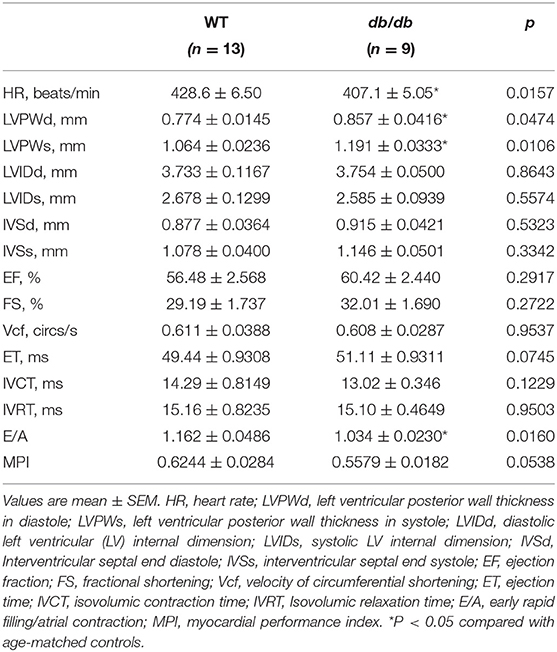
Table 1. Body weight and echocardiographic parameters of 6-wk-old control (WT) and diabetic (db/db) mice.
Differential Protein Expression in the LV of db/db Mice
Quantitative shotgun proteomics analysis performed after light (+28 Da) and heavy (+34 Da) formaldehyde labeling (demethylation) resulted in the identification of 715 proteins, which were subsequently used for comparative analysis (Figure 2A). As shown on the volcano map (Figure 2B), on the basis of an absolute fold change in expression levels and a corrected p-value (p < 0.05), we found 53 proteins that were differentially expressed in db/db LVs compared to the WT LVs. Among the 53 differentially expressed proteins in LV of db/db mice, 30 proteins were downregulated in response to chronic diabetes, while 23 were upregulated. All the differentially expressed proteins are listed in Table 2. In addition to the numerous peptides differently expressed in db/db mice revealed by the proteomic profile, the Metascape (17) analysis identified a top enrichment in the generation of precursor metabolites and energy production (GO:0006091) (Figure 2C).
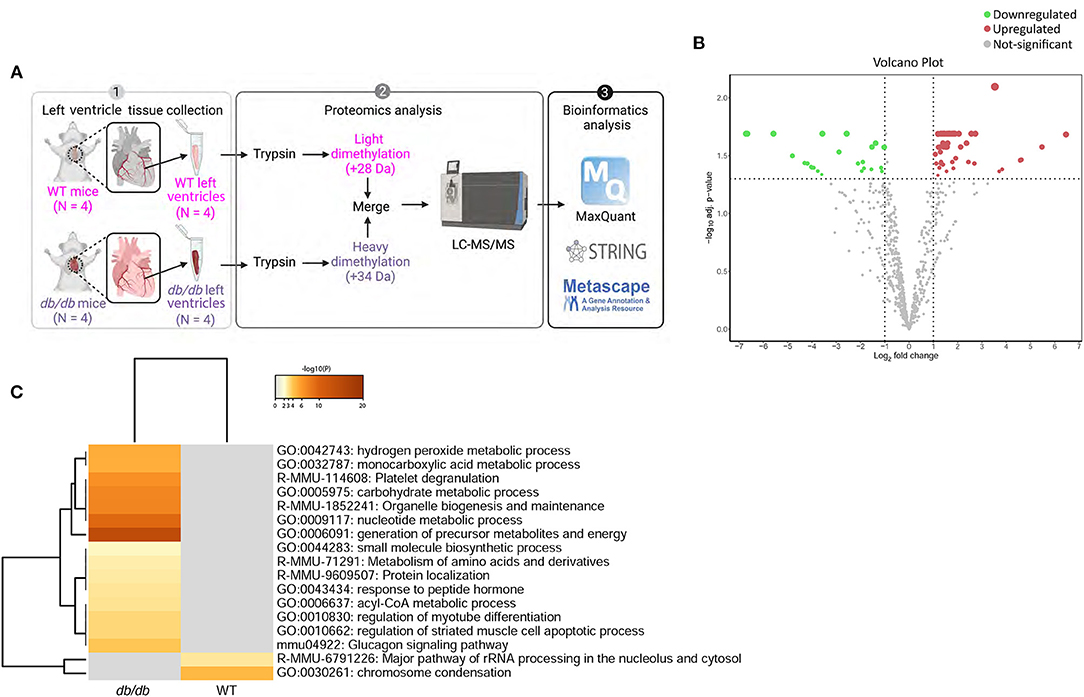
Figure 2. Process enrichment analysis of differentially expressed proteins in db/db mice. (A) Experimental design. Left ventricles from WT-control (n = 4) and db/db (n = 4) mice were labeled with light or heavy formaldehyde, quantified by shotgun proteomics and analyzed using MaxQuant. (B) Volcano plot of all proteins identified. The points indicate different proteins that display both large magnitude fold-changes (x-axis) and high statistical significance (y-axis). The dashed horizontal line shows the p-values cut-off, and the two vertical dashed lines indicate downregulated (green) and upregulated (red) proteins in the left ventricle of db/db mice. Gray points show the non-significantly differently expressed proteins. (C) Heatmap of top 17 enriched terms across upregulated and downregulated proteins in db/db mice using Metascape. Darker color indicates a lower p-value.
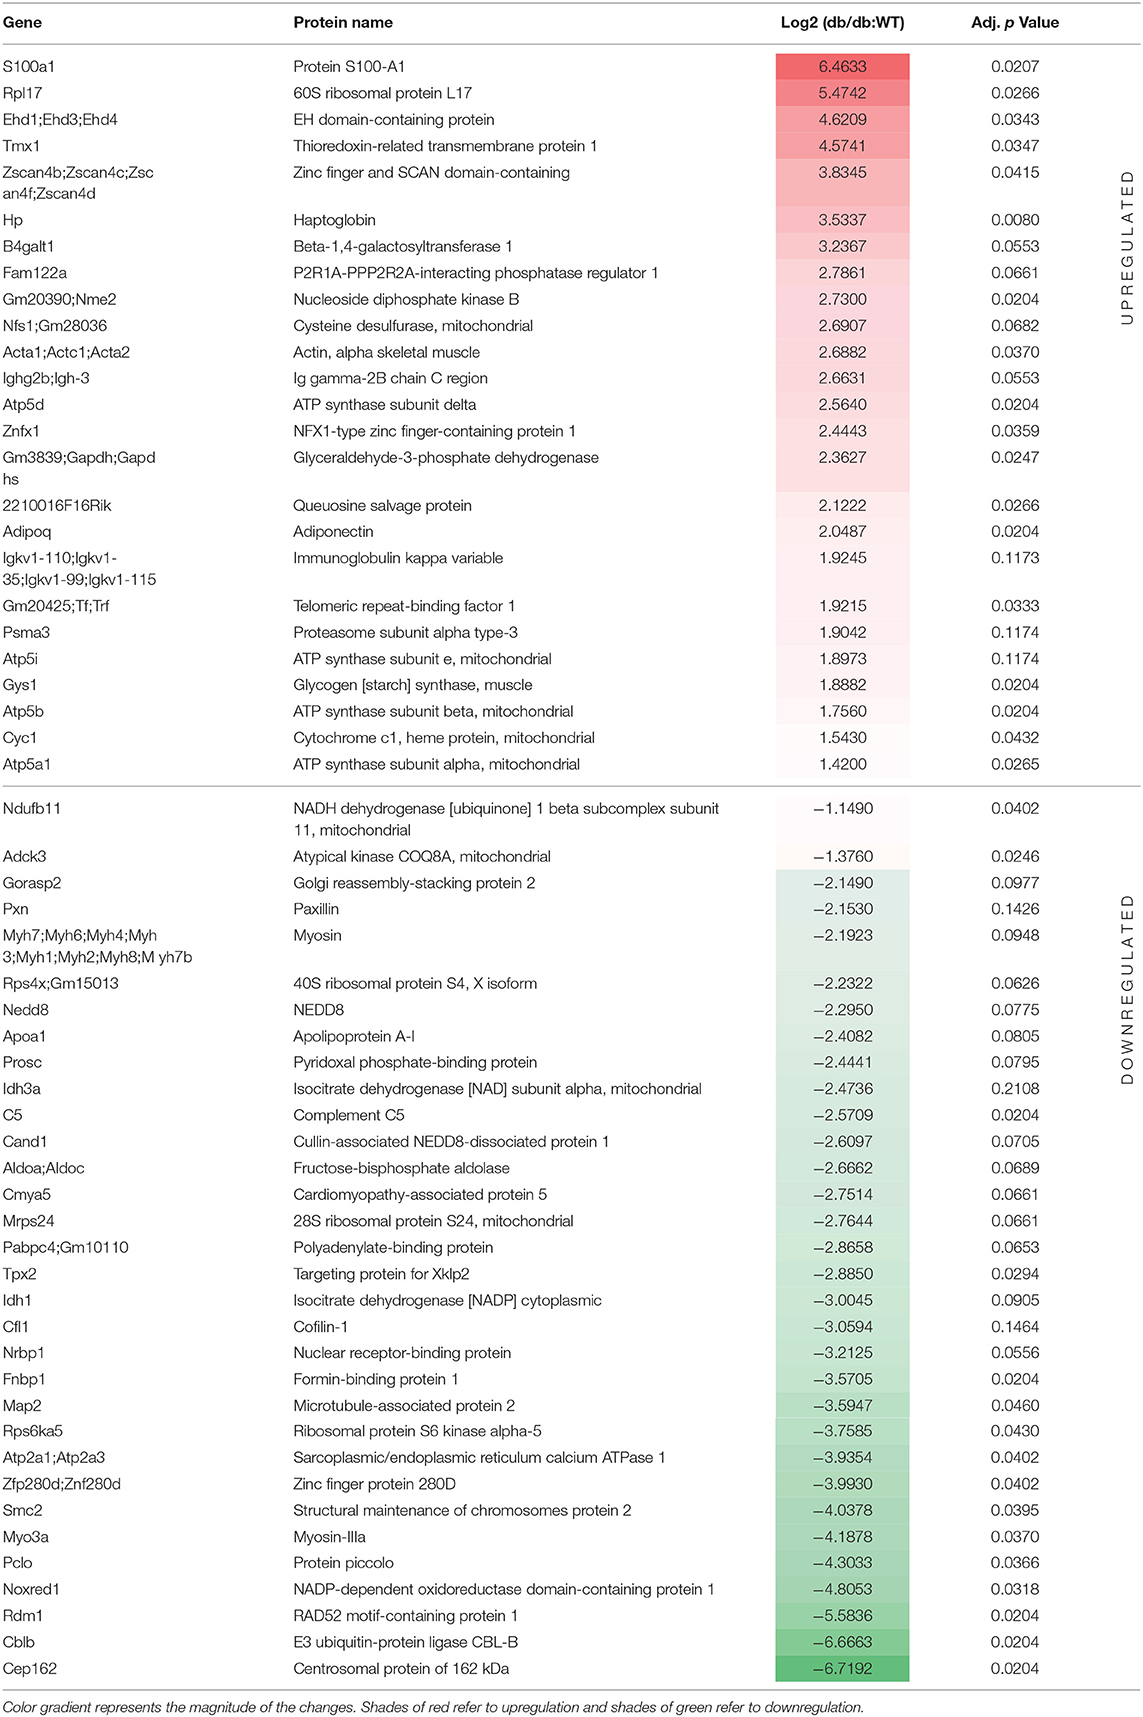
Table 2. Selected peptides that were differentially regulated in the left ventricle of db/db mice.
To characterize the changes in the global protein network in DbCM, we investigated the functional interactions of altered proteins for each condition using STRING (23) protein-protein interaction networks and functional enrichment analysis. In the LV of WT mice, we identified two dominant clusters: six enriched proteins were involved in calcium ion binding, and two were involved in the striated muscle contraction (Figure 3A). However, in the LV of db/db mice we found enrichment for nine proteins involved in metabolism, seven involved in the citric acid cycle and respiratory electron transport, four involved in ATP synthesis-coupled proton transport, three of the tubulin family, and two involved in striated muscle contraction (Figure 3B).
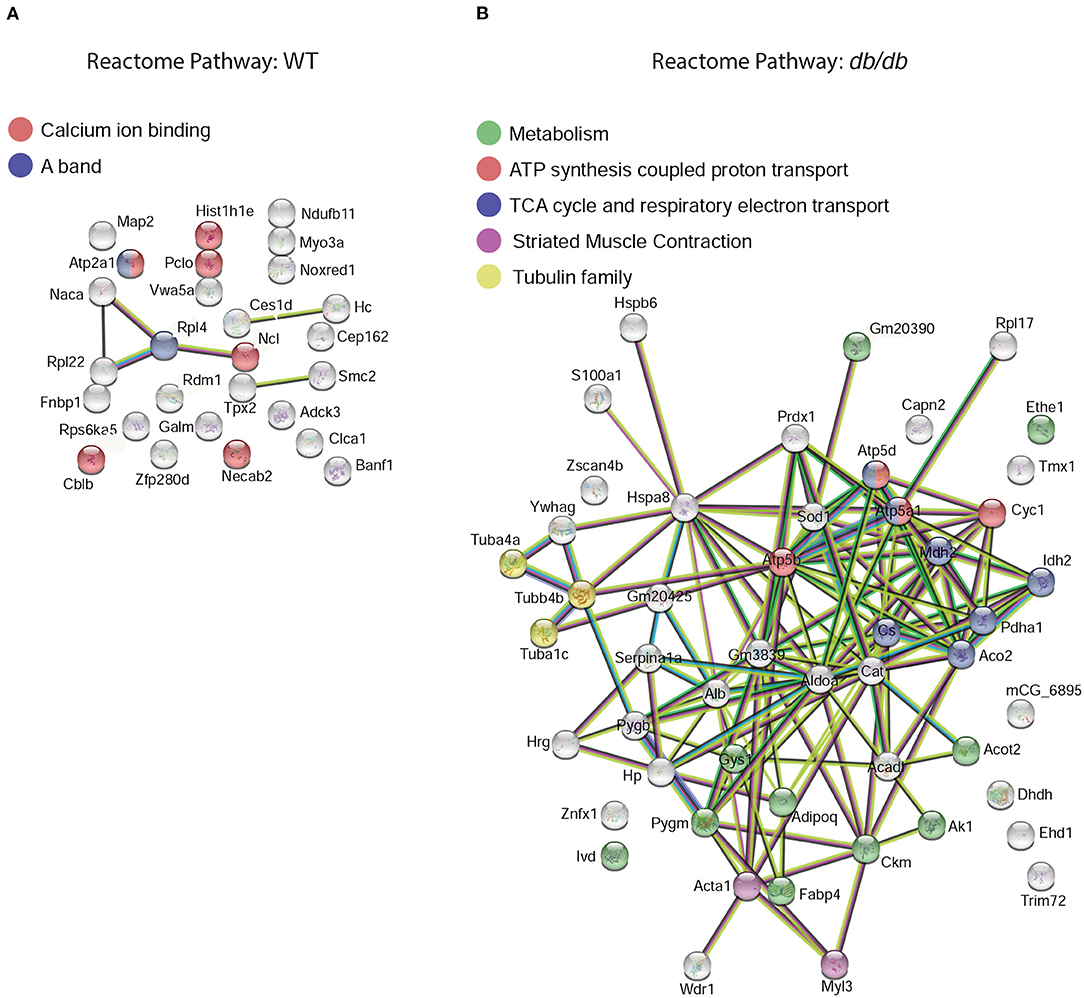
Figure 3. Functional protein-protein network analysis by STRING database. Left ventricular elevated proteins in (A) WT or (B) db/db mice identified from the proteomic analysis were mapped by searching the STRING software with a confidence level of 1% false discovery rate. The global protein network shows the shift in reactome priorities from calcium handling and muscle contraction in healthy mice, to energy metabolism and mitochondrial dysfunction in DbCM. Colored lines between the proteins indicate different types of interaction evidence: known interactions (teal), experimentally determined (pink), predicted interactions gene neighborhood (green), gene fusions (red), gene co-occurrence (blue), text-mining (yellow), co-expression (black), protein homology (purple).
Ingenuity Pathway Analysis Suggests Mitochondrial Dysfunction in db/db Mice Hearts
Specific canonical pathways and their networks functions were further explored using the IPA bioinformatics program to compare common-specific proteins and their pathological or functional implications. Canonical pathway analysis through IPA identified the top 10 pathways in db/db mice as described in Figure 4A. Predictive bioinformatics analysis revealed that the differentially expressed proteins participated in various biological processes, such as carbohydrate metabolism (Figure 4B), mitochondrial dysfunction, cardiac hypertrophy, cardiac necrosis/cell death, and cardiac fibrosis (Figure 4C), the biological responses that are previously known to occur in diabetic hearts (24–26).
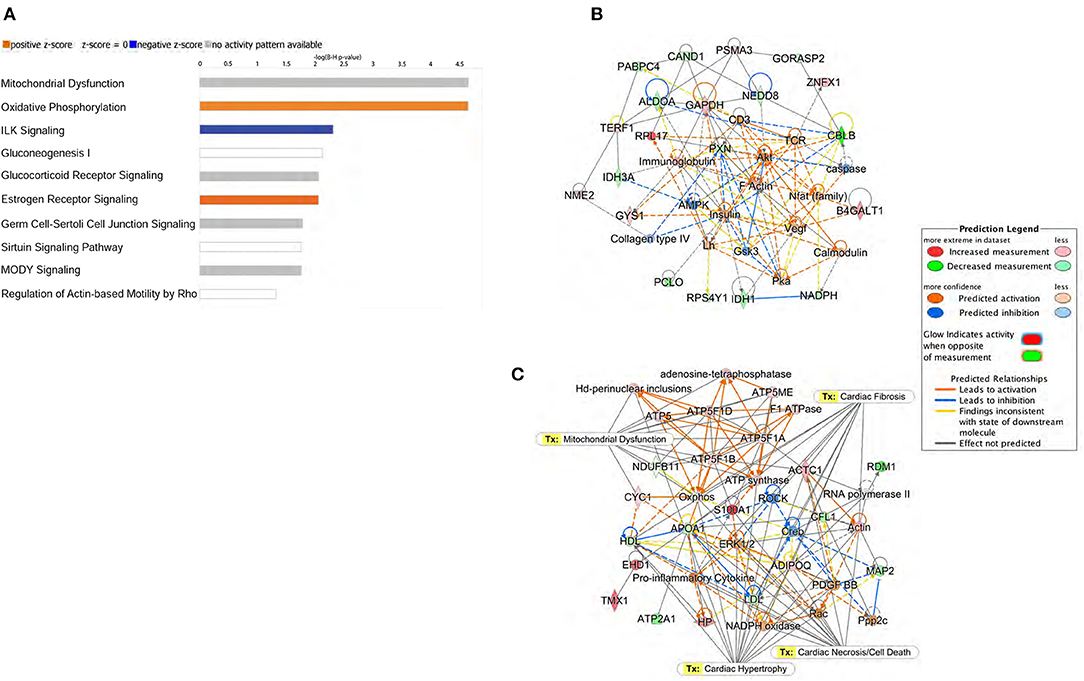
Figure 4. Ingenuity Pathway Analysis (IPA) of proteomic data. (A) Top 10 canonical pathways identified by IPA of proteins differentially expressed in left ventricle of db/db mice. The most statistically significant canonical pathways identified in db/db mice are listed according to their p-value (–log). Blue bars: negative z-score; orange bars: positive z-score. Clear bars are indicative of a z-score of 0, and thus have no difference in activity. Gray shaded bars indicate that there is no activity pattern available identified in IPA, despite highly significant association of the proteins within the pathway. Predictive bioinformatics analysis revealed that the significantly changed proteins participated in various biological processes. (B) Carbohydrate metabolism, (C) energy production, and cellular assembly were the highest scoring molecular networks identified by IPA in db/db mice.
Bioinformatics analysis predicted the mitochondrial dysfunction and oxidative phosphorylation (OXPHOS) to be the highest scoring protein networks impacted in diabetic hearts (Figure 5A). Furthermore, the proteomic analysis also identified the increased peptide levels of alpha, beta, and delta subunits of ATP synthase. Moreover, we also found a marked induction of Cytochrome c1 in db/db LVs compared to WT LVs. Conversely, compared to healthy controls, db/db mice showed a decrease in peptide levels of NDUFB11 and atypical kinase COQ8A/Adck3 (Figure 5B). These data showed both up and downregulation of key regulators of electron transfer in the electron transport chain (ETC) and mitochondrial ATP production (Figure 5C).
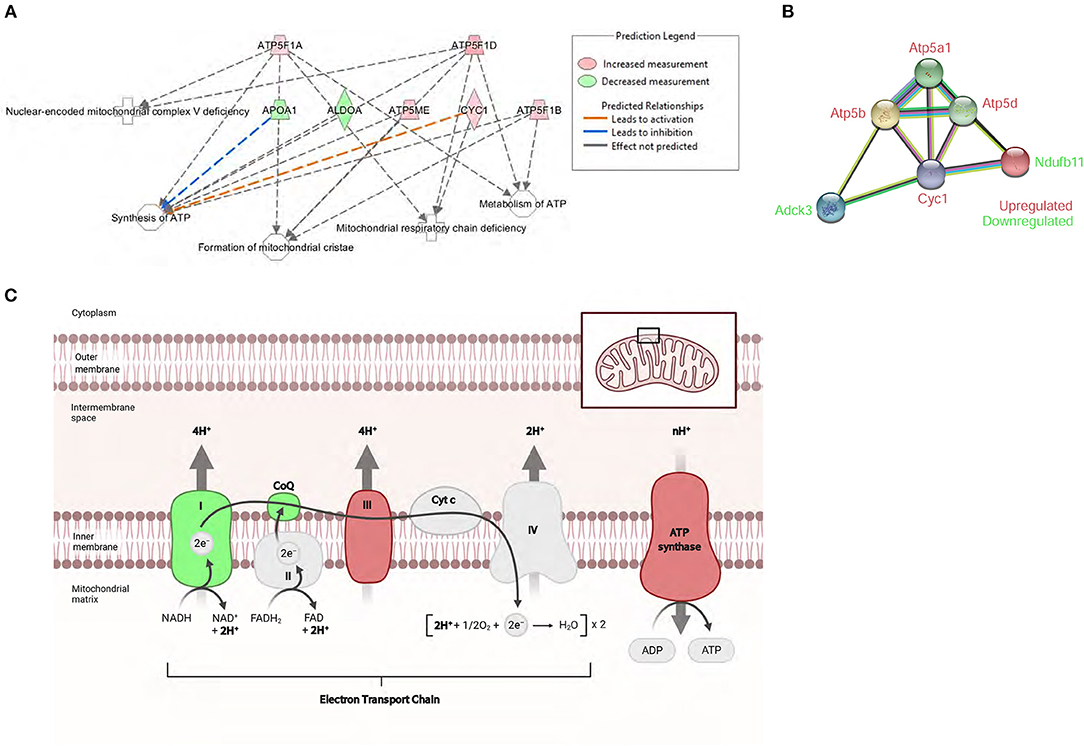
Figure 5. Proteomic profile of db/db mice suggests severe mitochondrial metabolic dysregulation. (A) The top affected cellular function identified by IPA in db/db mice was the ATP synthesis network. (B) STRING interaction network of differentially expressed mitochondrial proteins in the left ventricle of db/db mice. (C) Schematic overview of the mitochondrial respiratory electron transport chain and the differentially expressed mitochondrial proteins associated with diabetic cardiomyopathy. Adapted from “Electron Transport Chain,” by BioRender.com (2021). Retrieved from https://app.Biorender.com/Biorender-templates. Symbol color represents expression value, red indicating an upregulation, and green indicating downregulation in our dataset.
Subsequently, upstream regulator analysis was performed using the IPA program to determine the number of known targets of each transcription regulator present in the db/db dataset obtained from the proteomic analysis. Upstream regulator analysis also allowed to compare each differentially expressed protein to the reported relationship in the literature. The top predicted inhibited upstream regulator in the DbCM was Rapamycin-Insensitive Companion of mTOR (RICTOR), a key regulatory subunit that binds to mTOR to form the mTOR Complex 2 (mTORC2) (27). RICTOR leads to inhibition of alpha, beta, and delta subunits of ATP synthase and Cytochrome c1 (28, 29), and its predicted inhibition in our study was associated with the upregulation of the ETC components in the LV of db/db mice. RICTOR also leads to activation of Paxillin (PXN) (30), a focal adhesion protein whose inactivation results in a progressive decrease of cardiac contractility and heart failure (31). PXN was decreased in diabetic hearts, validating the predicted inhibition of RICTOR (Figure 6A; Table 2). Another predicted inhibited upstream regulator found in the LV of db/db mice was Caseinolytic Peptidase P (CLPP), a mitochondrial matrix ATP-dependent peptidase. CLPP leads to inhibition of alpha and beta subunits of ATP synthase and Cytochrome c1 (32), in addition to Adiponectin (ADIPOQ) and Glyceraldehyde-3-phosphate dehydrogenase (GAPDH). Proteomic analysis identified the upregulation of ATPF1A, ATPF1B, ADIPOQ, and GAPDH in the db/db LVs in our study, validating the predicted inhibition of CLPP (Figure 6B; Table 2).
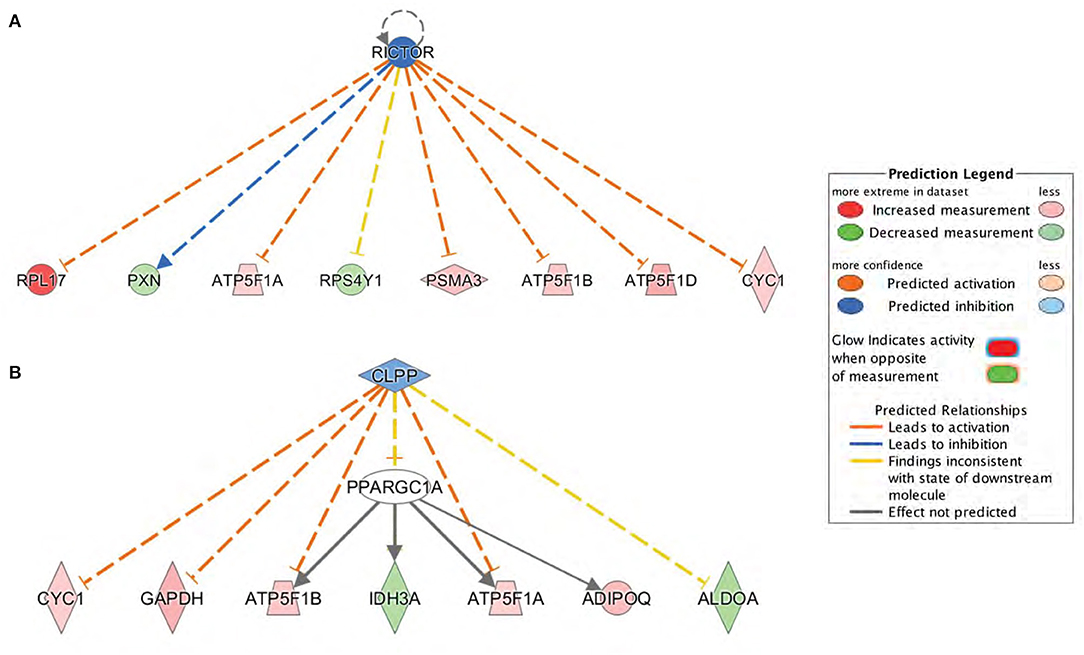
Figure 6. Upstream regulators predicted by Ingenuity Pathway Analysis (IPA) at the proteome level. (A) Rapamycin-Insensitive Companion of mTOR (RICTOR) and (B) Caseinolytic Peptidase P (CLPP) were the top inhibited upstream regulators predicted in db/db mice. Downstream proteins are displayed as networks. Symbol color represents expression value, red indicating an upregulation and blue/green indicating downregulation in our dataset. RICTOR and CLPP modulates the expression or function of downstream proteins listed in figure.
Diabetic Cardiomyopathy-Associated Mitochondrial Dysfunction Exhibits Impaired Complex I-Driven Respiration
As our proteomic analysis suggested key regulations of proteins involved in mitochondrial metabolism, we sought to investigate the changes in mitochondrial bioenergetics and performed a mitochondrial coupling assay. Mitochondria were isolated from db/db and WT LVs, and their purity was validated using western blot analysis. The successful mitochondria isolation was corroborated by the presence and absence of mitochondria-specific (VDAC1 and NDUFB11) and non-mitochondrial (GAPDH) proteins in the mitochondrial fraction, respectively (Figure 7A). The proteomic analysis and bioinformatics prediction (Table 2) revealed reduced levels of NDUFB11 in db/db mice, a subunit of complex I that facilitates electron transfer to ubiquinone (20). The reduced protein levels of NDUFB11 were also confirmed by the western blot analysis performed on the mitochondrial fraction obtained from LVs of db/db mice (Figures 7A,B).
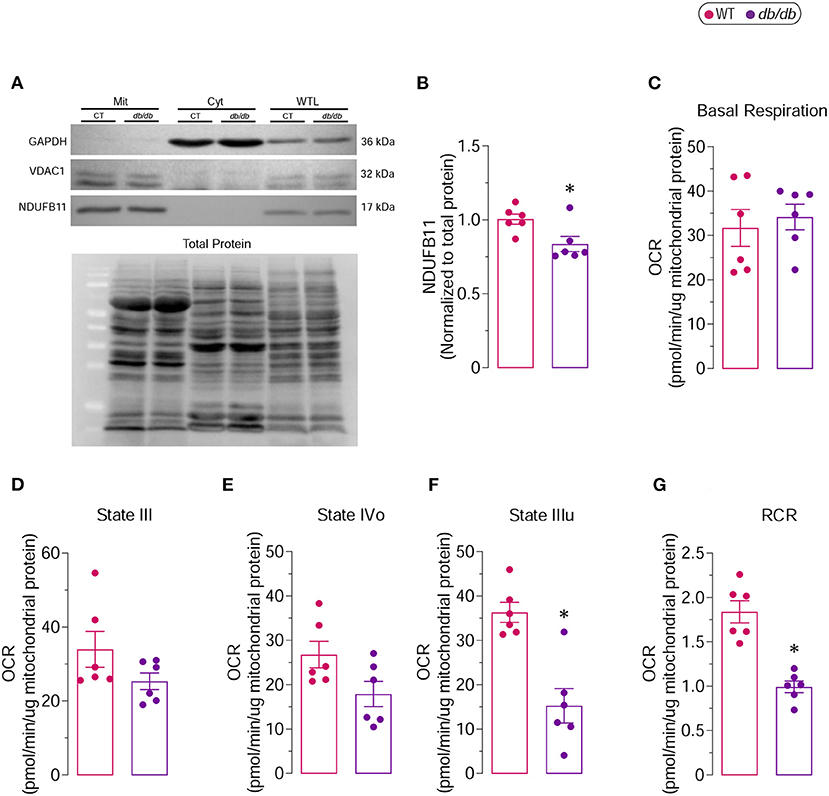
Figure 7. Complex I-driven respiratory capacity in isolated mitochondria from 6 months old db/db mice (A) Representative immunoblot showing the purity of the mitochondrial (Mit) fraction used for determination of mitochondrial respiratory function. VDAC1 and NDUFB11 were used as mitochondrial markers, while GAPDH was used as cytoplasmic (Cyt) marker. Whole tissue lysate (WTL) protein levels were also evaluated. (B) Proteins levels of NDUFB11 normalized to total protein. Oxygen consumption rates (OCR) of isolated mitochondria were measured by Seahorse XF analyzer. (C) Basal Respiration, (D) State III, (E) State IVo, (F) State IIIu and (G) Respiratory Control Ratio (RCR) are shown. *Represents p-value < 0.05 between WT (n = 6) and db/db (n = 6) mice.
The mitochondrial coupling assay examines the degree of coupling between OXPHOS and ETC; an impaired coupling between OXPHOS and ETC would indicate mitochondrial dysfunction. In the Seahorse extracellular flux analysis, the respiratory chain complex I (RCCI)-driven respiration, which represents the respiration of mitochondria in the presence of substrates but without ADP, did not show any difference in basal respiration between WT and db/db groups (Figure 7C). State III, which represents the formation of ATP from ADP and inorganic phosphate, and State IVo, which represents the proton leak due to the inhibition of the ATP synthase by oligomycin, was moderately decreased in mitochondria-derived from db/db LVs compared to WT LVs (Figures 7D,E). The state IIIu, an indicator of the maximal respiratory capacity, was significantly decreased in the mitochondria isolated from db/db LVs compared to the WT LVs (Figure 7F). The respiratory control ratio (RCR), an index of mitochondrial coupling, which is obtained by dividing the corrected values of State IIIu/State Ivo, was markedly reduced in db/db group compared to WT (Figure 7G), indicating increased mitochondrial uncoupling in DbCM. Although the basal respiration remained unchanged, markedly decreased respiratory chain complex I (RCCI)-driven mitochondrial coupling and severely reduced maximal respiratory capacity suggest impaired mitochondrial respiration in db/db mice corroborating proteomic discoveries.
Discussion
DbCM is a complex disorder caused by multifactorial pathology (33). The natural history of DbCM ranges from a short-term physiological adaptation to degenerative changes unable to be repaired by the myocardium, ultimately culminating in an irreversible pathological remodeling (34, 35). Induction of hyperglycemia and hyperlipidemia with progressive accumulation of the respective substrates in cardiomyocytes causes functional and structural changes (36, 37). These gradual changes often begin with diastolic dysfunction, followed by decreased left ventricular systolic function, resulting in HF (3, 38). In the present study, we validated the diabetic phenotype in 6 months old db/db mice, which was associated with structural and functional abnormalities of DbCM, including diastolic dysfunction and cardiac hypertrophy. These essential features are related to an established stage of DbCM, validating our experimental model.
HF-related to DbCM is evidently associated with abnormal myocardial energy metabolism with progressive myocardial hypertrophy and fibrosis (4, 39, 40). Despite the increasing number of studies in recent years that attempt to explain the potential pathophysiological mechanisms involved in the genesis of DbCM (21), there is still no clear and comprehensive integration of the pathways involved due to its multifactorial nature. In our research, we used quantitative shotgun proteomics to track the changes in the protein content, and subsequently, the proteomic profile in LVs of type 2 diabetic db/db mice. Proteomics analysis provides an unbiased experimental tool for the identification of aberrant protein expressions associated with disease, revealing potential signaling cascades that can be targeted therapeutically. Here we identified the shift in reactome priorities from calcium handling and muscle contraction in healthy mice to energy metabolism and mitochondrial dysfunction in DbCM. Mitochondria play a pivotal role in integrating cellular energy metabolism and cell survival (41). In type 2 DM, the impairment of mitochondrial function leads to a significant ROS production, further contributing to DM-induced myocardial dysfunction (42, 43). Proteomic analysis showed that the peptide levels of alpha, beta, and delta subunits of ATP synthase were upregulated in the LVs of db/db mice. These subunits form the F1 domain, a catalytic assembly of the enzyme critically involved in ATP synthesis (44). We also found a marked induction of Cytochrome c1 in LVs of db/db mice, which is a catalytic core subunit of the complex III, that catalyzes the transfer of electrons from coenzyme Q to Cytochrome c (45). By means of electron transfer, Cytochrome c1 plays an important role in the elevation of mitochondrial membrane potential, by using its heme group as a redox intermediate to transport electrons between complex III and complex IV (46). Importantly, studies have shown that increased levels of mitochondrial Cytochrome c are early events that precede the onset of apoptosis (47). We hypothesize that increased Cytochrome c1 levels may represent an adaptive mechanism by which diabetic heart attempts to increase electron transfer, and thereby enhance mitochondrial ATP production.
Contrarily, in db/db mice, we found decreased peptide levels of NDUFB11, a subunit of complex I that catalyzes the transfer of electrons to ubiquinone, and is considered an important factor in the regulation of mitochondrial respiration (20). Although basal respiration remained unchanged in LVs of db/db mice, metabolic assessment exhibited severely reduced rate of state IIIu respiration (maximal respiratory capacity) and decreased respiratory control, during the oxidation of the complex I-linked substrates in isolated mitochondria from db/db LVs. Combination of proteomic and metabolic assessments suggest that the restricted proton pumping by complex I may induce a slower and prolonged proton entry into complex V after the addition of ADP, leading to alterations in mitochondrial oxidative capacity and coupling of oxygen consumption, eventually affecting ATP production (48). We also observed a downregulation of atypical kinase COQ8A in the proteomic profile of type 2 diabetic LVs. COQ8A is an essential lipid-soluble electron transporter involved in the biosynthesis of ubiquinone and in the energetic movement of electrons through the ETC (49). Interestingly, DM-associated mitochondrial dysfunction has also been linked with metabolic deficits. The cardiac demand for energy comes predominantly from mitochondrial OXPHOS, which accounts for 95% of total ATP produced. However, in the chronic diabetic state established in 6 months old db/db mice, the ability of the heart to switch between available oxidizable substrates is impaired, and in this condition, the heart depends almost exclusively on fatty acid metabolism, which increases mitochondrial damage (50, 51). In our study we found that despite attempts by hearts from the diabetic mice to upregulate some ETC elements, which results in preserved basal mitochondrial metabolism, decreased levels of key components contribute to impaired maximal respiratory capacity, critically affecting ability of the diabetic heart to respond to increased metabolic needs. It is likely that ATP synthase subunits and Cytochrome c1 may also be downregulated with prolonged persistence of the diabetic phenotype. At first, the protective mechanism of mitochondrial function seems to be present, favoring the myocardial redox environment essential for the resting contractile. However, our study suggests that diabetic hearts have altered expression of essential mitochondrial peptides, which may contribute to the impaired mitochondrial bioenergetics contributing to the establishment of DbCM in this model.
In type 2 DM, the accumulation of ectopic lipids in the heart has also been associated with reduced cardiac efficiency. As lipid accumulation and plasma free fatty acid levels increase in type 2 DM, adverse effects of lipid accumulation on cardiac structure and function have been discussed as a potential mechanism for DbCM. Ex vivo perfusion of murine hearts from obese mice with free fatty acid demonstrated increased oxygen consumption and reduced ATP-to-Oxygen ratio when compared to glucose perfusion; these changes in the ATP-to-Oxygen ratio were too large to be explained by changes in the substrate metabolism, and were found to be associated with increased mitochondrial uncoupling (52, 53). Moreover, increased fatty acid metabolism in these hearts was associated with increased expression of mitochondrial uncoupling proteins (54). Similarly, reduced mitochondrial oxidative capacity inspite of increased mitochondrial biogenesis were observed in db/db hearts (55). Cytosolic as well as mitochondrial lipidic environment has been proposed to play a key role in regulation of mitochondrial metabolism, and remains to be investigated. Integrated proteomic and lipidomic analyses of diabetic heart may provide novel insight into the molecular state and underlying molecular mechanisms of DbCM.
IPA software was used to facilitate the organization and interpretation of the proteomic data in our study, which enabled prediction of upstream regulators to diseases and functions. RICTOR, an obligate regulatory subunit of mTORC2 (27), was predicted to be inhibited in DbCM. Activation of mTORC2 modulates mitochondrial function via Akt (28), and regulates cell survival via its anti-apoptotic effects in cardiac hypertrophy and myocardial ischemia (56). Inhibition of RICTOR expression has been demonstrated to block mTORC2 assembly and activity (57). RICTOR deletion from cardiomyocytes inactivates mTORC2, but does not modify basal cardiac function and geometry. However, RICTOR-deficient hearts display reduced cardiac performance when challenged by haemodynamic stress, which leads to cardiac dysfunction and dilatation (58). While studies indicate that activating autophagy in cardiomyocytes by inhibiting mTORC1 may prevent the aggravation of DbCM (59, 60), the role of RICTOR/mTORC2 in DbCM remains largely unknown. Additionally, IPA-based bioinformatics analysis also predicted CLPP to be inhibited in the LV of db/db mice. CLPP is a mitochondrial peptidase essential for maintaining protein quality control and mitochondrial function. Protease-mediated quality control is the first line of defense against mitochondrial damage and involves the degradation of non-assembled proteins that result from mitonuclear imbalance, and proteins that are damaged or misfolded as result of ROS (61).
Both RICTOR and CLPP are involved in the maintenance of cardiac homeostasis, and alterations in the levels of these regulators may contribute to pathological remodeling and cardiac dysfunction. Cells with genetic deletion of RICTOR exhibit defects in cell polarity and cytoskeletal architecture (62), whereas cardiac-specific knockdown of RICTOR exacerbated cardiac remodeling and dysfunction after myocardial infarction (63). Accordingly, mTORC2 activation has been shown to mediate the cardioprotective effects of hydrogen sulfide in response to ischemia/reperfusion in rats (64). Muscle-specific CLPP deficiency can partially restore mitochondrial protein synthesis, improving mitochondrial respiratory activity and attenuating pathological cardiac remodeling (65). Whereas, CLPP knockout mice exhibit reduced prenatal/postnatal survival, growth retardation, movement impairment, mild respiratory defects, and female and male infertility (65, 66). Indeed, further investigations are highly warranted to better understand the role of RICTOR and CLPP in initiation, progression and establishment of DbCM. In addition to mitochondrial dysfunction, the Integrin-Linked Kinase (ILK) signaling has also been identified as a top canonical pathway through IPA analysis in db/db mice LVs. ILK is a broadly expressed serine/threonine-protein kinase that binds to the cytoplasmic tail of β integrins, linking the interactions of cellular matrix to signals that regulate cytoskeletal remodeling and cellular processes such as growth, proliferation, survival, and differentiation (67, 68). As a major regulator of cytoskeletal remodeling, ILK pathway remains of a major interest in various cardiovascular disease.
Growing experimental research has been conducted to better understand the sexual dimorphism in the molecular mechanisms and outcomes of DbCM. However, the sex-specific differences at the level of the myocardium remain largely unknown. A potential limitation of our study is the absence of female subjects, as this could support a better comprehension of the sexual dimorphism in DbCM. Interestingly, Estrogen Receptor Signaling has been identified as a top canonical pathway with predicted activation through IPA analysis in male db/db mice LVs. Further research is critical to ascertain the role of estrogen in cardiovascular complications of DM. Furthermore, the validation of our findings in other independent models of DbCM, and explanted human hearts to understand the translational potential of our investigations are paramount. Moreover, although the present study identified mitochondrial dysfunction in diabetic hearts, further studies at various stages of DbCM onset and progression may shed light on “cause-and-effect” relationship between mitochondrial (dys)function and diastolic (dys)function. In summary, the present study found that diabetic LVs displayed altered expression of peptides involved in key mitochondrial metabolic processes together with the coordinated downregulation of cytoskeletal proteins. Further investigations into cause-and-effect relationship may provide novel insight into molecular mechanism of DbCM, with a potential to developing novel therapeutic targets.
Data Availability Statement
The data presented in the study are deposited in the PRIDE repository, accession number PXD029566.
Ethics Statement
The animal study was reviewed and approved by the Animal Care Committee, University of Calgary.
Author Contributions
KG, AJ, and VP designed the research. KG, AJ, LA, NB, PE, RS, DY, DB, JS, and AD acquired and analyzed data. KG and VP wrote the manuscript. VP is the guarantor of this work and, as such, has full access to all the data and takes responsibility for the integrity of data and the accuracy of data analysis, and supervised and managed the funding. All authors critically revised and approved the final version of the manuscript.
Funding
This work received support from Canadian Institutes of Health Research (CIHR; operating grant to VP) Project Grant (PJT-165857), Libin Cardiovascular Institute, Cumming School of Medicine (Start-up operating fund to VP; postdoctoral scholarships to KG and AJ; graduate scholarship in Women Cardiovascular Health to PE), Alberta Diabetes Institute (operating funds to VP), and Natural Sciences and Engineering Research Council (NSERC; operating grant to AD) Discovery Grant (DGECR-2019-00112).
Conflict of Interest
The authors declare that the research was conducted in the absence of any commercial or financial relationships that could be construed as a potential conflict of interest.
Publisher's Note
All claims expressed in this article are solely those of the authors and do not necessarily represent those of their affiliated organizations, or those of the publisher, the editors and the reviewers. Any product that may be evaluated in this article, or claim that may be made by its manufacturer, is not guaranteed or endorsed by the publisher.
Abbreviations
DM, diabetes mellitus; CVD, cardiovascular disease; HF, heart failure; DbCM, diabetic cardiomyopathy; AGE, advanced glycated end-products; LV, left ventricular; WT, wild-type; db/db, membrane-bound leptin receptor deficient mice; FS, fractional shortening; EF, ejection fraction; E, early peak filling; A, late peak filling; IVRT, isovolumic relaxation time; LC-MS/MS, liquid chromatography and tandem mass spectrometry; SAMS, Southern Alberta Mass Spectrometry; Easy-Nlc, nanoflow liquid chromatography; AGC, auto gain control; STRING, search tool for the retrieval of interacting genes; IPA, ingenuity pathway analysis; LVPWd, LV posterior wall thickness at diastole; LVPWs, LV posterior wall thickness at systole; MPI, myocardial performance index; OXPHOS, oxidative phosphorylation system; ETC, electron transport chain; RICTOR, rapamycin-insensitive companion of mTOR; mTORC2, mTOR complex 2; PXN, paxillin; CLPP, caseinolytic peptidase p; ADIPOQ, adiponectin; GAPDH, glyceraldehyde-3-phosphate dehydrogenase; ILK, Integrin-Linked Kinase.
References
1. Saeedi P, Petersohn I, Salpea P, Malanda B, Karuranga S, Unwin N, et al. Global and regional diabetes prevalence estimates for 2019 and projections for 2030 and 2045: results from the international diabetes federation diabetes atlas, 9(th) edition. Diabetes Res Clin Pract. (2019) 157:107843. doi: 10.1016/j.diabres.2019.107843
2. Rubler S, Dlugash J, Yuceoglu YZ, Kumral T, Branwood AW, Grishman A. New type of cardiomyopathy associated with diabetic glomerulosclerosis. Am J Cardiol. (1972) 30:595–602. doi: 10.1016/0002-9149(72)90595-4
3. Jia G, Whaley-Connell A, Sowers JR. Diabetic cardiomyopathy: a hyperglycaemia- and insulin-resistance-induced heart disease. Diabetologia. (2018) 61:21–8. doi: 10.1007/s00125-017-4390-4
4. Sung MM, Hamza SM, Dyck JR. Myocardial metabolism in diabetic cardiomyopathy: potential therapeutic targets. Antioxid Redox Signal. (2015) 22:1606–30. doi: 10.1089/ars.2015.6305
5. Nozynski J, Zakliczynski M, Konecka-Mrowka D, Nikiel B, Mlynarczyk-Liszka J, Zembala-Nozynska E, et al. Advanced glycation end products in the development of ischemic and dilated cardiomyopathy in patients with diabetes mellitus type 2. Transplant Proc. (2009) 41:99–104. doi: 10.1016/j.transproceed.2008.09.065
6. Knapp M, Tu X, Wu R. Vascular endothelial dysfunction, a major mediator in diabetic cardiomyopathy. Acta Pharmacol Sin. (2019) 40:1–8. doi: 10.1038/s41401-018-0042-6
7. Amour J, Loyer X, Le Guen M, Mabrouk N, David JS, Camors E, et al. Altered contractile response due to increased beta3-adrenoceptor stimulation in diabetic cardiomyopathy: the role of nitric oxide synthase 1-derived nitric oxide. Anesthesiology. (2007) 107:452–60. doi: 10.1097/01.anes.0000278909.40408.24
8. Dhalla NS, Shah AK, Tappia PS. Role of oxidative stress in metabolic and subcellular abnormalities in diabetic cardiomyopathy. Int J Mol Sci. (2020) 21(7). doi: 10.3390/ijms21072413
9. Mishra PK, Ying W, Nandi SS, Bandyopadhyay GK, Patel KK, Mahata SK. Diabetic cardiomyopathy: an immunometabolic perspective. Front Endocrinol. (2017) 8:72. doi: 10.3389/fendo.2017.00072
10. Lee MMY, McMurray JJV, Lorenzo-Almoros A, Kristensen SL, Sattar N, Jhund PS, et al. Diabetic cardiomyopathy. Heart. (2019) 105:337–45. doi: 10.1136/heartjnl-2016-310342
11. Authors/Task Force M, Ryden L, Grant PJ, Anker SD, Berne C, Cosentino F, et al. ESC Guidelines on diabetes, pre-diabetes, and cardiovascular diseases developed in collaboration with the EASD: the task force on diabetes, pre-diabetes, and cardiovascular diseases of the european society of cardiology. (ESC) and developed in collaboration with the European Association for the Study of Diabetes. (EASD). Eur Heart J. (2013) 34:3035–87. doi: 10.1093/eurheartj/eht108
12. Patel VB, Mori J, McLean BA, Basu R, Das SK, Ramprasath T, et al. ACE2 deficiency worsens epicardial adipose tissue inflammation and cardiac dysfunction in response to diet-induced obesity. Diabetes. (2016) 65:85–95. doi: 10.2337/db15-0399
13. Mori J, Patel VB, Abo Alrob O, Basu R, Altamimi T, Desaulniers J, et al. Angiotensin 1-7 ameliorates diabetic cardiomyopathy and diastolic dysfunction in db/db mice by reducing lipotoxicity and inflammation. Circ Heart Fail. (2014) 7:327–39. doi: 10.1161/CIRCHEARTFAILURE.113.000672
14. Patel VB, Zhabyeyev P, Chen X, Wang F, Paul M, Fan D, et al. PI3Kalpha-regulated gelsolin activity is a critical determinant of cardiac cytoskeletal remodeling and heart disease. Nat Commun. (2018) 9:5390. doi: 10.1038/s41467-018-07812-8
15. Cox J, Neuhauser N, Michalski A, Scheltema RA, Olsen JV, Mann M. Andromeda: a peptide search engine integrated into the MaxQuant environment. J Proteome Res. (2011) 10:1794–805. doi: 10.1021/pr101065j
16. Spitzer M, Wildenhain J, Rappsilber J, Tyers M. BoxPlotR: a web tool for generation of box plots. Nat Methods. (2014) 11:121–2. doi: 10.1038/nmeth.2811
17. Zhou Y, Zhou B, Pache L, Chang M, Khodabakhshi AH, Tanaseichuk O, et al. Metascape provides a biologist-oriented resource for the analysis of systems-level datasets. Nat Commun. (2019) 10:1523. doi: 10.1038/s41467-019-09234-6
18. Iuso A, Biagosch C, Terrile C, Prokisch H. “Assessing mitochondrial bioenergetics in isolated mitochondria from various mouse tissues using seahorse XF96 analyzer,” In: Methods in Molecular Biology [Internet]. (2017). New York, NY: Humana Press.
19. Rogers GW, Brand MD, Petrosyan S, Ashok D, Elorza AA, Ferrick DA, et al. High throughput microplate respiratory measurements using minimal quantities of isolated mitochondria. PLoS ONE. (2011) 6:e21746. doi: 10.1371/journal.pone.0021746
20. Wirth C, Brandt U, Hunte C, Zickermann V. Structure and function of mitochondrial complex I. Biochim Biophys Acta. (2016) 1857:902–14. doi: 10.1016/j.bbabio.2016.02.013
21. Jia G, Hill MA, Sowers JR. Diabetic cardiomyopathy: an update of mechanisms contributing to this clinical entity. Circ Res. (2018) 122:624–38. doi: 10.1161/CIRCRESAHA.117.311586
22. Burke SJ, Batdorf HM, Burk DH, Noland RC, Eder AE, Boulos MS, et al. db/db mice exhibit features of human type 2 diabetes that are not present in weight-matched C57BL/6J Mice Fed a Western Diet. J Diabetes Res. (2017) 2017:8503754. doi: 10.1155/2017/8503754
23. Szklarczyk D, Gable AL, Nastou KC, Lyon D, Kirsch R, Pyysalo S, et al. The STRING database in 2021: customizable protein-protein networks, and functional characterization of user-uploaded gene/measurement sets. Nucleic Acids Res. (2021) 49:D605–D12. doi: 10.1093/nar/gkab835
24. Chen Y, Hua Y, Li X, Arslan IM, Zhang W, Meng G. Distinct types of cell death and the implication in diabetic cardiomyopathy. Front Pharmacol. (2020) 11:42. doi: 10.3389/fphar.2020.00042
25. Chun-Jun Li LL, Hui Li, De-min Yu. Cardiac fibrosis and dysfunction in experimental diabetic cardiomyopathy are ameliorated by alpha-lipoic acid. Cardiovascular Diabetol. (2012) 11:110. doi: 10.1186/1475-2840-11-73
26. Frustaci A, Kajstura J, Chimenti C, Jakoniuk I, Leri A, Maseri A, et al. Myocardial cell death in human diabetes. Circ Res. (2000) 87:1123–32. doi: 10.1161/01.RES.87.12.1123
27. Sarbassov DD, Ali SM, Kim DH, Guertin DA, Latek RR, Erdjument-Bromage H, et al. Rictor, a novel binding partner of mTOR, defines a rapamycin-insensitive and raptor-independent pathway that regulates the cytoskeleton. Curr Biol. (2004) 14:1296–302. doi: 10.1016/j.cub.2004.06.054
28. Betz C, Stracka D, Prescianotto-Baschong C, Frieden M, Demaurex N, Hall MN. Feature Article: mTOR complex 2-Akt signaling at mitochondria-associated endoplasmic reticulum membranes. (MAM) regulates mitochondrial physiology. Proc Natl Acad Sci U S A. (2013) 110:1252634. doi: 10.1073/pnas.1302455110
29. Cunningham JT, Rodgers JT, Arlow DH, Vazquez F, Mootha VK, Puigserver P. mTOR controls mitochondrial oxidative function through a YY1-PGC-1alpha transcriptional complex. Nature. (2007) 450:736–40. doi: 10.1038/nature06322
30. Hagan GN, Lin Y, Magnuson MA, Avruch J, Czech MP. A Rictor-Myo1c complex participates in dynamic cortical actin events in 3T3-L1 adipocytes. Mol Cell Biol. (2008) 28:4215–26. doi: 10.1128/MCB.00867-07
31. Hirth S, Buhler A, Buhrdel JB, Rudeck S, Dahme T, Rottbauer W, et al. Paxillin and focal adhesion kinase. (FAK) Regulate Cardiac Contractility in the Zebrafish Heart. PLoS One. (2016) 11:e0150323. doi: 10.1371/journal.pone.0150323
32. Nouri K, Feng Y, Schimmer AD. Mitochondrial ClpP serine protease-biological function and emerging target for cancer therapy. Cell Death Dis. (2020) 11:841. doi: 10.1038/s41419-020-03062-z
33. De Rosa S, Arcidiacono B, Chiefari E, Brunetti A, Indolfi C, Foti DP. Type 2 diabetes mellitus and cardiovascular disease: genetic and epigenetic links. Front Endocrinol. (Lausanne). (2018) 9:2. doi: 10.3389/fendo.2018.00002
34. Hu X, Bai T, Xu Z, Liu Q, Zheng Y, Cai L. Pathophysiological fundamentals of diabetic cardiomyopathy. Compr Physiol. (2017) 7:693–711. doi: 10.1002/cphy.c160021
35. Wong C, Marwick TH. Obesity cardiomyopathy: pathogenesis and pathophysiology. Nat Clin Pract Cardiovasc Med. (2007) 4:436–43. doi: 10.1038/ncpcardio0943
36. Jia G, DeMarco VG, Sowers JR. Insulin resistance and hyperinsulinaemia in diabetic cardiomyopathy. Nat Rev Endocrinol. (2016) 12:144–53. doi: 10.1038/nrendo.2015.216
37. Tate M, Deo M, Cao AH, Hood SG, Huynh K, Kiriazis H, et al. Insulin replacement limits progression of diabetic cardiomyopathy in the low-dose streptozotocin-induced diabetic rat. Diab Vasc Dis Res. (2017) 14:423–33. doi: 10.1177/1479164117710390
38. Bahrami H, Bluemke DA, Kronmal R, Bertoni AG, Lloyd-Jones DM, Shahar E, et al. Novel metabolic risk factors for incident heart failure and their relationship with obesity: the MESA. (Multi-Ethnic Study of Atherosclerosis) study. J Am Coll Cardiol. (2008) 51:1775–83. doi: 10.1016/j.jacc.2007.12.048
39. Bugger H, Abel ED. Molecular mechanisms of diabetic cardiomyopathy. Diabetologia. (2014) 57:660–71. doi: 10.1007/s00125-014-3171-6
40. Huynh K, Bernardo BC, McMullen JR, Ritchie RH. Diabetic cardiomyopathy: mechanisms and new treatment strategies targeting antioxidant signaling pathways. Pharmacol Ther. (2014) 142:375–415. doi: 10.1016/j.pharmthera.2014.01.003
41. Darley-Usmar VM, Ball LE, Chatham JC. Protein O-linked beta-N-acetylglucosamine: a novel effector of cardiomyocyte metabolism and function. J Mol Cell Cardiol. (2012) 52:538–49. doi: 10.1016/j.yjmcc.2011.08.009
42. Montaigne D, Marechal X, Coisne A, Debry N, Modine T, Fayad G, et al. Myocardial contractile dysfunction is associated with impaired mitochondrial function and dynamics in type 2 diabetic but not in obese patients. Circulation. (2014) 130:554–64. doi: 10.1161/CIRCULATIONAHA.113.008476
43. Niemann B, Chen Y, Teschner M, Li L, Silber RE, Rohrbach S. Obesity induces signs of premature cardiac aging in younger patients: the role of mitochondria. J Am Coll Cardiol. (2011) 57:577–85. doi: 10.1016/j.jacc.2010.09.040
44. Walker JE, Dickson VK. The peripheral stalk of the mitochondrial ATP synthase. Biochim Biophys Acta. (2006) 1757:286–96. doi: 10.1016/j.bbabio.2006.01.001
45. Maneg O, Malatesta F, Ludwig B, Drosou V. Interaction of cytochrome c with cytochrome oxidase: two different docking scenarios. Biochim Biophys Acta. (2004) 1655:274–81. doi: 10.1016/j.bbabio.2003.10.010
46. Ow YP, Green DR, Hao Z, Mak TW. Cytochrome c: functions beyond respiration. Nat Rev Mol Cell Biol. (2008) 9:532–42. doi: 10.1038/nrm2434
47. Sánchez-Alcázar JA AJ, Khodjakov A, Schneider E. Increased mitochondrial cytochrome c levels and mitochondrial hyperpolarization precede camptothecin-induced apoptosis in Jurkat cells. Cell Death Differentiat. (2000) 7:1090–100. doi: 10.1038/sj.cdd.4400740
48. Rodenburg RJ. Mitochondrial complex I-linked disease. Biochim Biophys Acta. (2016) 1857:938–45. doi: 10.1016/j.bbabio.2016.02.012
49. Stefely JA, Reidenbach AG, Ulbrich A, Oruganty K, Floyd BJ, Jochem A, et al. Mitochondrial ADCK3 employs an atypical protein kinase-like fold to enable coenzyme Q biosynthesis. Mol Cell. (2015) 57:83–94. doi: 10.1016/j.molcel.2014.11.002
50. Bugger H, Abel ED. Mitochondria in the diabetic heart. Cardiovasc Res. (2010) 88:229–40. doi: 10.1093/cvr/cvq239
51. Gambardella J, Lombardi A, Santulli G. Metabolic flexibility of mitochondria plays a key role in balancing glucose and fatty acid metabolism in the diabetic heart. Diabetes. (2020) 69:2054–7. doi: 10.2337/dbi20-0024
52. Taegtmeyer H, McNulty P, Young ME. Adaptation and maladaptation of the heart in diabetes: Part I: general concepts. Circulation. (2002) 105:1727–33. doi: 10.1161/01.CIR.0000012466.50373.E8
53. Stanley WC, Lopaschuk GD, McCormack JG. Regulation of energy substrate metabolism in the diabetic heart. Cardiovasc Res. (1997) 34:25–33. doi: 10.1016/S0008-6363(97)00047-3
54. Boehm EA, Jones BE, Radda GK, Veech RL, Clarke K. Increased uncoupling proteins and decreased efficiency in palmitate-perfused hyperthyroid rat heart. Am J Physiol Heart Circ Physiol. (2001) 280:H977–83. doi: 10.1152/ajpheart.2001.280.3.H977
55. Boudina S, Sena S, Theobald H, Sheng X, Wright JJ, Hu XX, et al. Mitochondrial energetics in the heart in obesity-related diabetes: direct evidence for increased uncoupled respiration and activation of uncoupling proteins. Diabetes. (2007) 56:2457–66. doi: 10.2337/db07-0481
56. Thedieck K, Polak P, Kim ML, Molle KD, Cohen A, Jeno P, et al. PRAS40 and PRR5-like protein are new mTOR interactors that regulate apoptosis. PLoS One. (2007) 2:e1217. doi: 10.1371/journal.pone.0001217
57. Sarbassov DD, Guertin DA, Ali SM, Sabatini DM. Phosphorylation and regulation of Akt/PKB by the rictor-mTOR complex. Science. (2005) 307:1098–101. doi: 10.1126/science.1106148
58. Shende P, Xu L, Morandi C, Pentassuglia L, Heim P, Lebboukh S, et al. Cardiac mTOR complex 2 preserves ventricular function in pressure-overload hypertrophy. Cardiovasc Res. (2016) 109:103–14. doi: 10.1093/cvr/cvv252
59. Kanamori H, Takemura G, Goto K, Tsujimoto A, Mikami A, Ogino A, et al. Autophagic adaptations in diabetic cardiomyopathy differ between type 1 and type 2 diabetes. Autophagy. (2015) 11:1146–60. doi: 10.1080/15548627.2015.1051295
60. Volkers M, Doroudgar S, Nguyen N, Konstandin MH, Quijada P, Din S, et al. PRAS40 prevents development of diabetic cardiomyopathy and improves hepatic insulin sensitivity in obesity. EMBO Mol Med. (2014) 6:57–65. doi: 10.1002/emmm.201303183
61. Quiros PM, Langer T, Lopez-Otin C. New roles for mitochondrial proteases in health, ageing and disease. Nat Rev Mol Cell Biol. (2015) 16:345–59. doi: 10.1038/nrm3984
62. Jacinto E, Loewith R, Schmidt A, Lin S, Ruegg MA, Hall A, et al. Mammalian TOR complex 2 controls the actin cytoskeleton and is rapamycin insensitive. Nat Cell Biol. (2004) 6:1122–8. doi: 10.1038/ncb1183
63. Volkers M, Konstandin MH, Doroudgar S, Toko H, Quijada P, Din S, et al. Mechanistic target of rapamycin complex 2 protects the heart from ischemic damage. Circulation. (2013) 128:2132–44. doi: 10.1161/CIRCULATIONAHA.113.003638
64. Zhou Y, Wang D, Gao X, Lew K, Richards AM, Wang P. mTORC2 phosphorylation of Akt1: a possible mechanism for hydrogen sulfide-induced cardioprotection. PLoS One. (2014) 9:e99665. doi: 10.1371/journal.pone.0099665
65. Seiferling D, Szczepanowska K, Becker C, Senft K, Hermans S, Maiti P, et al. Loss of CLPP alleviates mitochondrial cardiomyopathy without affecting the mammalian UPRmt. EMBO Rep. (2016) 17:953–64. doi: 10.15252/embr.201642077
66. Gispert S, Parganlija D, Klinkenberg M, Drose S, Wittig I, Mittelbronn M, et al. Loss of mitochondrial peptidase Clpp leads to infertility, hearing loss plus growth retardation via accumulation of CLPX, mtDNA and inflammatory factors. Hum Mol Genet. (2013) 22:4871–87. doi: 10.1093/hmg/ddt338
67. Hannigan GE, Leung-Hagesteijn C, Fitz-Gibbon L, Coppolino MG, Radeva G, Filmus J, et al. Regulation of cell adhesion and anchorage-dependent growth by a new beta 1-integrin-linked protein kinase. Nature. (1996) 379:91–6. doi: 10.1038/379091a0
Keywords: diabetes, diabetic cardiomyopathy, diastolic dysfunction, electron transport chain, shotgun proteomics
Citation: Gomes KP, Jadli AS, de Almeida LGN, Ballasy NN, Edalat P, Shandilya R, Young D, Belke D, Shearer J, Dufour A and Patel VB (2022) Proteomic Analysis Suggests Altered Mitochondrial Metabolic Profile Associated With Diabetic Cardiomyopathy. Front. Cardiovasc. Med. 9:791700. doi: 10.3389/fcvm.2022.791700
Received: 08 October 2021; Accepted: 24 January 2022;
Published: 02 March 2022.
Edited by:
Soo-Kyoung Choi, Yonsei University College of Medicine, South KoreaReviewed by:
Matthieu Ruiz, Université de Montréal, CanadaJun Ren, University of Washington, United States
Copyright © 2022 Gomes, Jadli, de Almeida, Ballasy, Edalat, Shandilya, Young, Belke, Shearer, Dufour and Patel. This is an open-access article distributed under the terms of the Creative Commons Attribution License (CC BY). The use, distribution or reproduction in other forums is permitted, provided the original author(s) and the copyright owner(s) are credited and that the original publication in this journal is cited, in accordance with accepted academic practice. No use, distribution or reproduction is permitted which does not comply with these terms.
*Correspondence: Vaibhav B. Patel, vaibhav@ucalgary.ca; vaibhav@patellab.ca