 Himika Ohara1Akiomi Yoshihisa1,2*Yuko Horikoshi2,3Shinji Ishibashi3Mitsuko Matsuda3Yukio Yamadera3Yukiko Sugawara1Yasuhiro Ichijo1Yu Hotsuki1Koichiro Watanabe1Yu Sato1Tomofumi Misaka1Takashi Kaneshiro1Masayoshi Oikawa1Atsushi Kobayashi1Yasuchika Takeishi1
- 1Department of Cardiovascular Medicine, Fukushima Medical University, Fukushima, Japan
- 2Department of Clinical Laboratory Sciences, Fukushima Medical University School of Health Science, Fukushima, Japan
- 3Department of Clinical Laboratory Medicine, Fukushima Medical University, Fukushima, Japan
Background: It has been recently reported that the renal venous stasis index (RVSI) assessed by renal Doppler ultrasonography provides information to stratify pulmonary hypertension that can lead to right-sided heart failure (HF). However, the clinical significance of RVSI in HF patients has not been sufficiently examined. We aimed to examine the associations of RVSI with parameters of cardiac function and right heart catheterization (RHC), as well as with prognosis, in patients with HF.
Methods: We performed renal Doppler ultrasonography, echocardiography and RHC in hospitalized patients with HF (n = 388). RVSI was calculated as follows: RVSI = (cardiac cycle time-venous flow time)/cardiac cycle time. The patients were classified to three groups based on RVSI: control group (RVSI = 0, n = 260, 67%), low RVSI group (0 < RVSI ≤ 0.21, n = 63, 16%) and high RVSI group (RVSI > 0.21, n = 65, 17%). We examined associations of RVSI with parameters of cardiac function and RHC, and followed up for cardiac events defined as cardiac death or worsening HF.
Results: There were significant correlations of RVSI with mean right atrial pressure (mRAP; R = 0.253, P < 0.001), right atrial area (R = 0.327, P < 0.001) and inferior vena cava diameter (R = 0.327, P < 0.001), but not with cardiac index (R = −0.019, P = 0.769). During the follow-up period (median 412 days), cardiac events occurred in 60 patients. In the Kaplan–Meier analysis, the cumulative cardiac event rate increased with increasing RVSI (log-rank, P = 0.001). In the multivariate Cox proportional hazard analysis, the cardiac event rate was independently associated with RVSI (high RVSI group vs. control group: hazard ratio, 1.908; 95% confidence interval, 1.046–3.479, P = 0.035).
Conclusion: RVSI assessed by renal Doppler ultrasonography reflects right-sided overload and is associated with adverse prognosis in HF patients.
Introduction
Heart failure (HF) is a refractory clinical syndrome that originates from various types of structural or functional heart diseases. The number of patients with HF has been rapidly increasing, and HF is becoming a major public health concern worldwide (1, 2). Congestion is a key feature in HF, and its presence is associated with poor prognosis. However, congestion can go unrecognized, as it is sometimes not clinically evident. To evaluate the degree of congestion objectively, non-invasive image testing is required in patients with HF (3–5).
It has already been reported that the intrarenal venous flow (IRVF) patterns assessed by renal Doppler ultrasonography were associated with congestion and prognosis in patients with HF. Specifically, the most adverse prognosis was present in HF patients with monophasic IRVF pattern, followed in order by biphasic IRVF pattern and continuous IRVF pattern (6–9). However, the classification of IRVF patterns is not necessarily clear. There are patterns for which classification is difficult or classification itself may miss important changes in the pattern. Renal venous stasis index (RVSI) is a novel indicator of cardiac cycle-dependent stasis of renal venous flow. RVSI indicates the proportion of the cardiac cycle during which there is no renal venous outlet flow. RVSI can quantify IRVF patterns and completement the weaknesses of the IRVF pattern classification. According to a past study, RVSI provided information to stratify prognosis in patients with pulmonary hypertension (PH) in terms of propensity to develop right-sided HF. Namely, PH patients with high RVSI experienced more adverse events such as worsening PH or all-cause mortality (10). However, the clinical significance of RVSI in HF patients has not been sufficiently examined. We aimed to elucidate the associations of RVSI with parameters of cardiac function and right heart catheterization (RHC), as well as with cardiac events defined as cardiac death and worsening HF, in patients with HF.
Methods
Subjects and Protocol
This was a prospective observational study of 402 patients who were classified as either stage C or stage D of heart failure stage classification in the American College of Cardiology Foundation/ American Heart Association guideline and were hospitalized to Fukushima Medical University Hospital between April 2018 and September 2020 (11). Treatment of decompensated HF was provided by each patient's attending cardiologist based on the established HF guidelines (11, 12). Blood samples, renal Doppler ultrasonography and echocardiography were obtained during hospitalization in the patients in a stable condition before discharge. We subsequently excluded patients with who were undergoing dialysis (n = 14). At last, 388 patients were enrolled in this study. Two hundred and forty five of them had undergone RHC within 3 days of renal Doppler ultrasonography. Of these 388 patients, patients with RVSI of 0 were defined as the control group (n = 260, 67%). Patients with RVSI above 0 were divided into two groups on the basis of the median value of RVSI (0.21): the low RVSI group (0 < RVSI ≤ 0.21, n = 63, 16%) and the high RVSI group (RVSI > 0.21, n = 65, 17%).
First, we compared the clinical features as well as the results from laboratory tests, echocardiography and RHC between the three groups. Second, the patients were followed up until November 2020 for cardiac events defined as cardiac death or worsening HF. Cardiac death was defined as death from acute coronary syndrome, ventricular fibrillation and HF, and worsening HF was defined as unplanned re-hospitalization for HF treatment. For patients who experienced ≥ two events, only the first event was included in the analysis. These patients visited hospital monthly or every other month. Therefore, we could follow up on all patients. Disease status and dates of death were gained from the patient's medical records. The results of the analysis were hidden from those conducting the survey, and written informed consent was gained from all enrolled patients. The protocol for this study was approved by the Ethics Committee of Fukushima Medical University and was conducted in accordance with the principles described in the Declaration of Helsinki. We reported this study in conformity to Strengthening the Reporting of Observational Studies in Epidemiology and the Enhancing the Quality and Transparency of Health Research guidelines.
Ischemic coronary artery disease was confirmed by either myocardial scintigraphy or coronary computed tomography angiography and/or coronary angiography (13). Atrial fibrillation (AF) was confirmed by electrocardiogram performed during hospitalization or from medical records including past medical history. Hypertension was defined as systolic blood pressure of ≥ 140 mmHg, diastolic blood pressure of ≥ 90 mmHg, or taking antihypertensive drugs. Dyslipidemia was defined as levels of triglyceride ≥ 150 mg/dL, levels of low-density lipoprotein cholesterol ≥ 140 mg/dL, levels of high-density lipoprotein cholesterol <40 mg/dL, or taking cholesterol-lowering drugs. Diabetes mellitus was defined as recent use of antidiabetic drugs, levels of fasting glucose ≥ 126 mg/dL, levels of casual glucose ≥ 200 mg/dL and/or levels of HbA1c ≥ 6.5% (National Glycohemoglobin Standardization Program) (14). Chronic kidney disease (CKD) was defined as estimated glomerular filtration rate (eGFR) of <60 mL/min per 1.73 m2 (15–17). Anemia was defined as levels of hemoglobin <12.0 g/dL in female and <13.0 g/dL in male (18, 19).
Renal Doppler Ultrasonography
The actual methods of acquisition were as follows. The patients were performed renal Doppler ultrasonography in a stable condition after treatment. Two experienced sonographers (M.M, with 27 years of experience in abdominal ultrasonography, and S.I, with 19 years of experience) performed renal Doppler ultrasonography, using an Aplio i800 system (Canon Medical Systems Corporation, Tochigi, Japan) with a convex transducer frequency range of 2.5–5.0 MHz. The velocity range of the color Doppler was set to approximately 10–20 cm/s. The two examiners were blinded to all clinical data. The patients fasted for at least 12 h before the renal Doppler ultrasonography and were placed in the lateral position. All renal Doppler ultrasonography examinations were performed in the right renal vein. This was because left renal vein is entrapped in the fork between the abdominal aorta and the superior mesenteric artery, thus attenuating its phasicity. Furthermore, although this is a rare event in cases of ovarian or testicular varicose veins, the left ovarian or testicular veins draining into the left renal vein may have affected renal venous flow. The transducer was placed in the lateral abdominal region, and the patient's arms were raised above the chest to obtain a proper acoustic window. The patients were holding their breath while measurements. As shown in Figure 1, we used color Doppler images to record pulsed Doppler waveforms of the interlobar arteries and veins simultaneously. Transducer was placed with an angle of <60 degrees. The upward Doppler signal indicates the intrarenal arterial flow, and the downward Doppler signal indicates the venous flow. We used the interlobar vein flow to calculate RVSI. In patients with sinus rhythm, we selected the most stable value among five cardiac cycles. In patients with AF, an index beat (the beat following two preceding cardiac cycles of equal duration) was used for each measurement. We calculated RVSI, which indicates the proportion of the cardiac cycle during which there was no renal venous outlet flow, as follows: (cardiac cycle time - venous flow time)/cardiac cycle time (10). IRVF patterns were broadly categorized into continuous (RVSI = 0, non-congestive) and discontinuous (RVSI > 0, nadir velocity = 0) flow patterns. We further classified the discontinuous IRVF patterns into two stages: biphasic (with venous peaks during systole and diastole), and monophasic (with venous peak during diastole) (7). Figure 1 shows representative RVSI along with IRVF patterns. Figure 1a, RVSI = 0 (control) with continuous pattern; Figure 1b, low RVSI with biphasic pattern; Figure 1c, high RVSI with biphasic pattern; and Figure 1d, high RVSI with monophasic pattern. Although both Figures 1b, c are classified into biphasic IRVF pattern, these patterns could be distinguished by RVSI (i.e., Figure 1b: Low RVSI and Figure 1c: High RVSI). On the contrary, both Figures 1c, d belonged to high RVSI, but classified into different IRVF patterns (i.e., Figure 1c: Biphasic pattern and Figure 1d: Monophasic pattern).
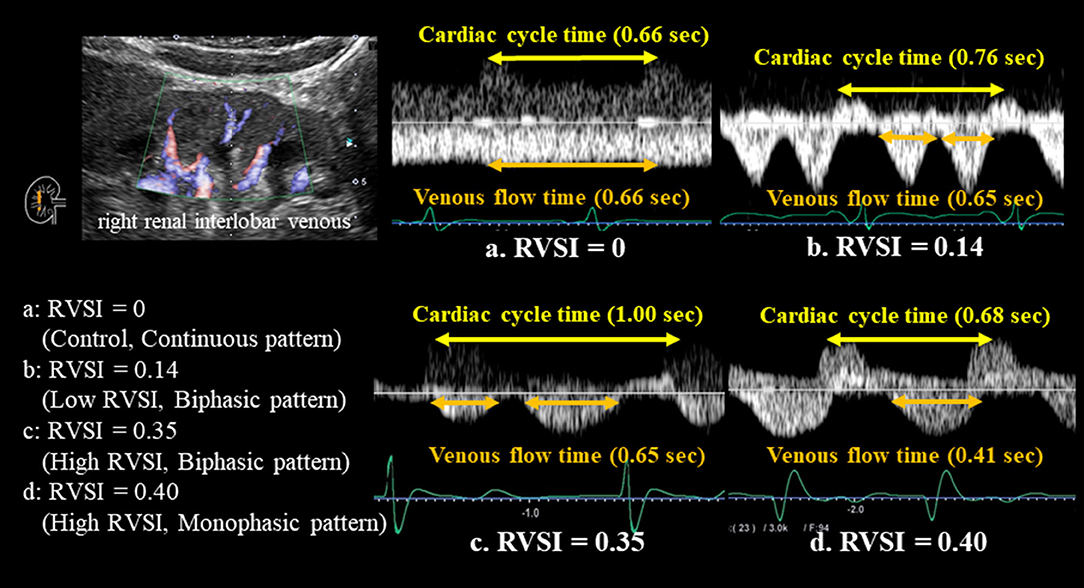
Figure 1. All renal Doppler ultrasonography studies were performed in the right kidney. Color Doppler images were used to record pulsed Doppler waveforms of the interlobar arteries and veins simultaneously. The upward Doppler signal indicated the intrarenal arterial flow, and the downward Doppler signal indicated the venous flow. We measured venous flow time and calculated RVSI as follows: (cardiac cycle time-venous flow time)/cardiac cycle time. RVSI of 0 was defined as the control. RVSI above 0 were divided based on the median value of RVSI (0.21): the low RVSI (0 < RVSI ≤ 0.21) and the high RVSI (RVSI > 0.21). RVSI increased with increasing severity of renal congestion. This figure shows representative IRVF patterns with RVSI in a patient with HF. IRVF patterns were broadly categorized into continuous (RVSI = 0, non-congestive) and discontinuous (RVSI > 0, nadir velocity = 0) flow patterns. We further classified the discontinuous IRVF patterns into two stages: biphasic (with venous peaks during systole and diastole), and monophasic (with venous peak during diastole). (a) RVSI = 0 (control) with continuous pattern; (b) low RVSI with biphasic pattern; (c) high RVSI with biphasic pattern; and (d) high RVSI with monophasic pattern. RVSI, renal venous stasis index; IRVF, intrarenal venous flow.
Echocardiography
Echocardiography was performed by experienced echocardiographers based on current recommendations (20, 21). The echocardiographic parameters included left ventricular ejection fraction (LVEF), left ventricular outflow tract velocity-time integral (LVOT VTI), left atrial volume, early transmitral flow velocity to mitral annular velocity ratio (mitral valve E/e'), right atrium area, right ventricular areas, right ventricular fractional area change (RV-FAC), inferior vena cava (IVC) diameter, severity of tricuspid regurgitation (TR), tricuspid regurgitation pressure gradient (TRPG), tricuspid annular plane systolic excursion (TAPSE), TAPSE/systolic pulmonary artery pressure ratio (TAPSE/sPAP ratio), and tissue Doppler-derived tricuspid lateral annular systolic velocity (tricuspid valve S') (21). The LVEF was calculated by Simpson's method. The RV-FAC, defined as (end diastolic area - end systolic area)/end diastolic area × 100, is a measure of right ventricular systolic function. The TAPSE/sPAP ratio is an indicator of right ventricle–to–pulmonary circulation coupling (22–27). All measurements were performed using ultrasound systems (ACUSON Sequoia, Siemens Medical Solutions USA, Inc., Mountain View, CA, USA).
Right Heart Catheterizations and Hemodynamic Measurements
Of the total of 388 patients, 245 underwent RHC based on remedial judgment of the attending physician. RHC was performed within 3 days of renal Doppler ultrasonography during hospitalization in the patients in a stable condition without changes in medications, including doses, similar to the setting for renal Doppler ultrasonography. All RHCs were performed under fluoroscopic guidance with the patients in the resting supine position breathing room air and at rest after more than 30 min of catheter placement. Cardiac output and mean right atrial pressure (mRAP) were measured using a 7F Swan-Ganz catheter (Edwards Lifesciences, Irvine, CA, USA). Cardiac output was calculated using the direct Fick method (28).
Measurement of Laboratory Data
We measured B-type natriuretic peptide (BNP) levels using a specific immunoradiometric assay (Shionoria BNP kit, Shionogi, Osaka, Japan). This assay was performed by experienced laboratory technicians in blind.
Statistical Analysis
Normally distributed data were presented as mean ± standard deviation, and non-normally distributed data were presented as median and interquartile range. Categorical variables were expressed as numbers and percentages, and the chi-square test was used for their comparisons. Among the three groups, parametric variables were compared using one-way analysis of variance, and non-parametric variables were compared using Kruskal-Wallis test. Kaplan-Meier analysis with log-rank test was used to evaluate the cardiac event rate. RVSI was assessed as a predictor of post-discharge cardiac events by the Cox proportional hazard analysis. In the univariate Cox proportional hazard analysis, to prepare for potential confounding, we considered the following clinical factors: age, sex and other confounding factors which differed statistically among the groups. Univariate factors with P < 0.05 were entered into the multivariate Cox proportional hazard analyses. A value of P < 0.05 was defined statistically significant for all comparisons. These analyses were performed using a statistical software package (SPSS ver. 27.0, IBM, Armonk, NY, USA).
Results
Table 1 shows the clinical and demographic characteristics of the study population. Of the 388 patients included in the study, the median age was 71 (63.0–79.8) years and 225 (58.0%) were male. There were some unclassified IRVF patterns in our study. The prevalence of AF, hypertension, CKD and anemia increased in proportion to RVSI. In contrast, age, sex, body mass index, blood pressure, heart rate, coronary artery disease and diabetes mellitus, did not differ among the groups. There was not significant correlation between RVSI and heart rate (R = 0.009, P = 0.852). Regarding laboratory data, levels of BNP, C-reactive protein and urine albumin-to-creatinine ratio became higher, and levels of eGFR and hemoglobin became lower with increasing RVSI. However, sodium and proteinuria did not differ among the groups. With regard to the parameters of echocardiography, there was a significant increase in left atrial volume, mitral valve E/e', right atrial area, IVC diameter, severity of TR and TRPG, and a significant decrease in TAPSE and TAPSE/sPAP ratio with increasing RVSI. In contrast, LVEF and LVOT VTI were similar among the groups. Cardiopulmonary hemodynamics evaluated by RHC worsened with increasing RVSI. There was a gradual increase in mRAP (Figure 2A), mean pulmonary artery pressure (mPAP) and mean pulmonary artery wedge pressure (mPAWP) with increasing RVSI, whereas, there was no significant change in cardiac index (CI). As regards medications, the use of diuretic increased in proportion to RVSI. In contrast, angiotensin converting enzyme inhibitor, angiotensin II receptor blocker, angiotensin receptor-neprilysin inhibitor, mineralocorticoid receptor antagonist and sodium glucose cotransporter 2 inhibitor did not differ among the groups. Mean RAP showed a significant stepwise increase along the RVSI groups (Figure 2A, control, low RVSI and high RVSI groups) and IRVF patterns (Figure 2B, continuous, biphasic and monophasic patterns). Both RVSI and IRVF patterns showed similar associations with elevated mRAP (Figure 2A; P < 0.001 and Figure 2B; P = 0.001). In addition, RVSI showed a significant stepwise increase along the IRVF patterns (Figure 2C; P < 0.001). RVSI also showed a significant stepwise increase along the severity of TR (Figure 2D; P < 0.001). TAPSE/sPAP ratio showed a significant stepwise decrease along the RVSI groups (Figure 2E; P < 0.001). Furthermore, there were significant correlations of RVSI with right atrial area (R = 0.327, P < 0.001), IVC (R = 0.327, P < 0.001), TR severity (R = 0.197, P < 0.001), TAPSE (R = −0.173, P = 0.002), TAPSE/sPAP ratio (R = −0.330, P < 0.001), mRAP (R = 0.253, P < 0.001), mPAP (R = 0.288, P < 0.001) and mPAWP (R = 0.279, P < 0.001), but not with LVEF (R = −0.063, P = 0.215), LVOT VTI (R = −0.031, P = 0.553) and CI (R = −0.019, P = 0.769). These results suggest that elevated RVSI indicates right-sided overload rather than left-sided overload.
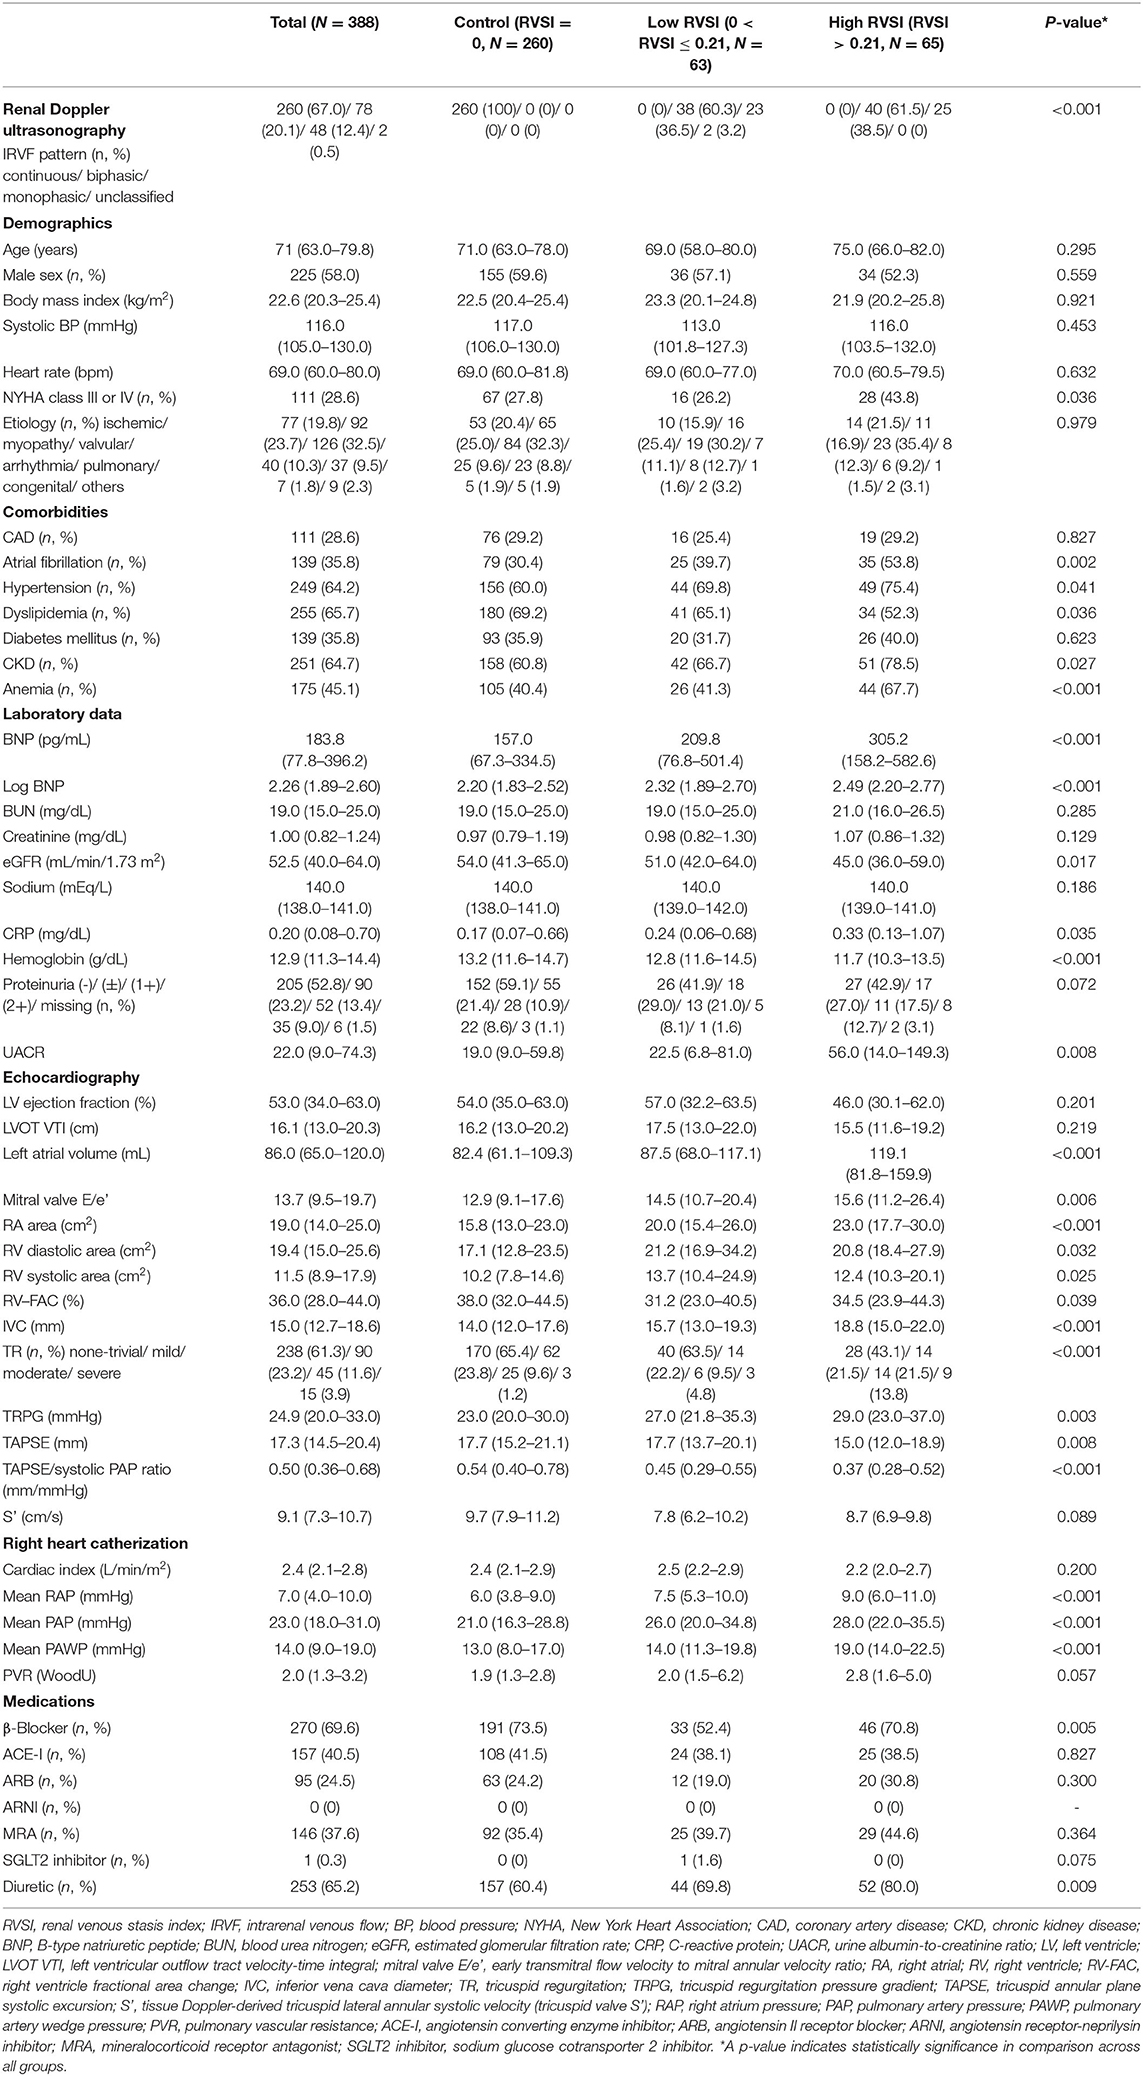
Table 1. Clinical and demographic characteristics of the study population.
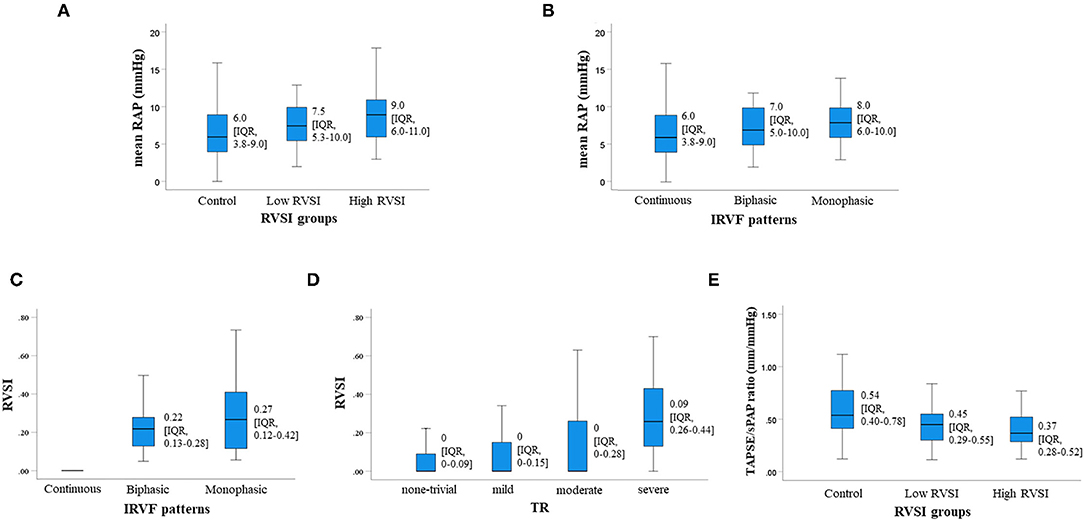
Figure 2. The severity of renal congestion can be assessed by measuring RVSI using renal Doppler ultrasonography. (A,C–E) show the relationship between RVSI and mRAP (A) IRVF patterns (C) severity of TR (D) and TAPSE/sPAP ratio (E). RVSI showed a significant stepwise increase along the IRVF patterns (C; P < 0.001) and severity of tricuspid regurgitation (D; P < 0.001). TAPSE/sPAP ratio showed a significant stepwise decrease along the RVSI groups (E; P < 0.001). In addition, both RVSI and IRVF patterns showed similar associations with elevated mRAP (A; P < 0.001 and B; P = 0.001). RVSI, renal venous stasis index; mRAP, mean right atrial pressure; IRVF, intrarenal venous flow; TR, tricuspid regurgitation; TAPSE/sPAP, tricuspid annular plane systolic excursion/systolic pulmonary artery pressure; IQR, interquartile range.
During the follow-up period (median 412 days; range 4–991 days), cardiac events occurred in 60 patients (16 cardiac deaths and 52 worsening HF). Sixteen cardiac deaths included 14 deaths from HF and 2 deaths from ventricular fibrillation. In the Kaplan–Meier analysis, the cumulative cardiac event rate significantly increased with increasing RVSI (Figure 3, log-rank, P = 0.001). In the univariate Cox proportional hazard analysis (Table 2), high RVSI was associated with high cardiac event rate (high RVSI group vs. control group, hazard ratio, 2.849; 95% confidence interval, 1.596–5.087, P < 0.001). In the multivariate Cox proportional hazard analyses, due to the limited number of cardiac events (60 events) and to avoid overfitting, we selected univariate factors with P < 0.05 (i.e., age, CKD, anemia, BNP and high RVSI). After adjusting for these confounding factors, high RVSI was an independent prognostic factor (Table 2; high RVSI group vs. control group: hazard ratio, 1.908; 95% confidence interval, 1.046–3.479, P = 0.035). In the subgroup analysis regarding LVEF, there was no significant interactions between prognostic impact of RVSI and LVEF (P = 0.759), and high RVSI was associated with high cardiac event rate both in the heart failure with reduced ejection fraction group and the heart failure with preserved ejection fraction group. In the Kaplan–Meier analysis stratified by IRVF patterns, the cumulative cardiac event rate significantly increased with worsening IRVF patterns (Figure 4, log-rank, P = 0.002). There were overlap and inversion between the groups with biphasic and monophasic IRVF patterns.
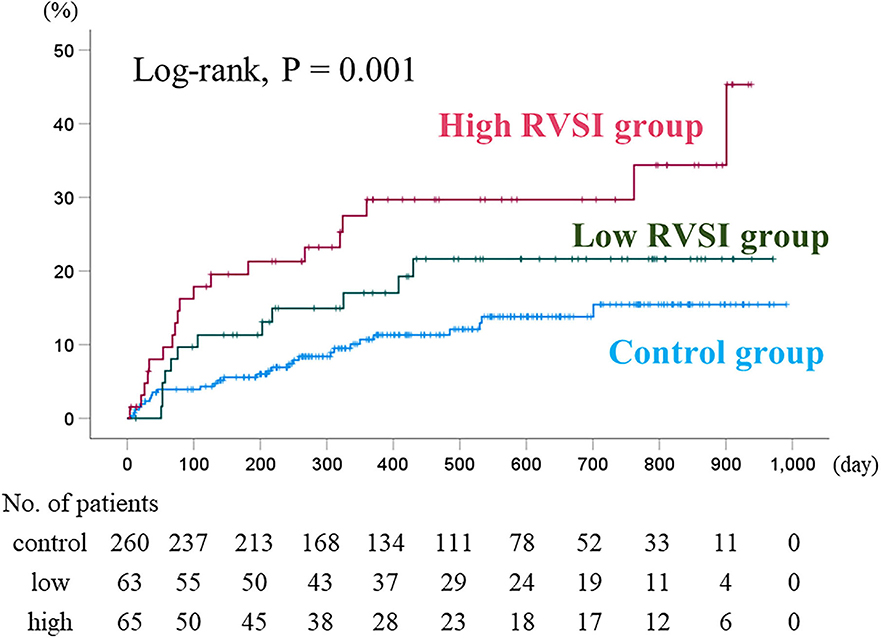
Figure 3. Kaplan–Meier analysis for cardiac event rates stratified by RVSI. The cumulative cardiac event rate significantly increased with increasing RVSI (log-rank, P = 0.001). RVSI, renal venous stasis index.
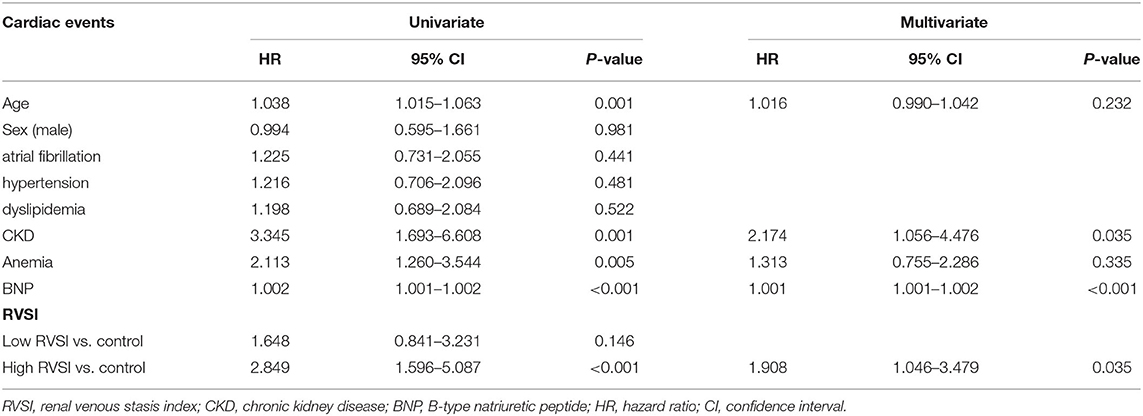
Table 2. Cox proportional hazard model for predicting cardiac events.
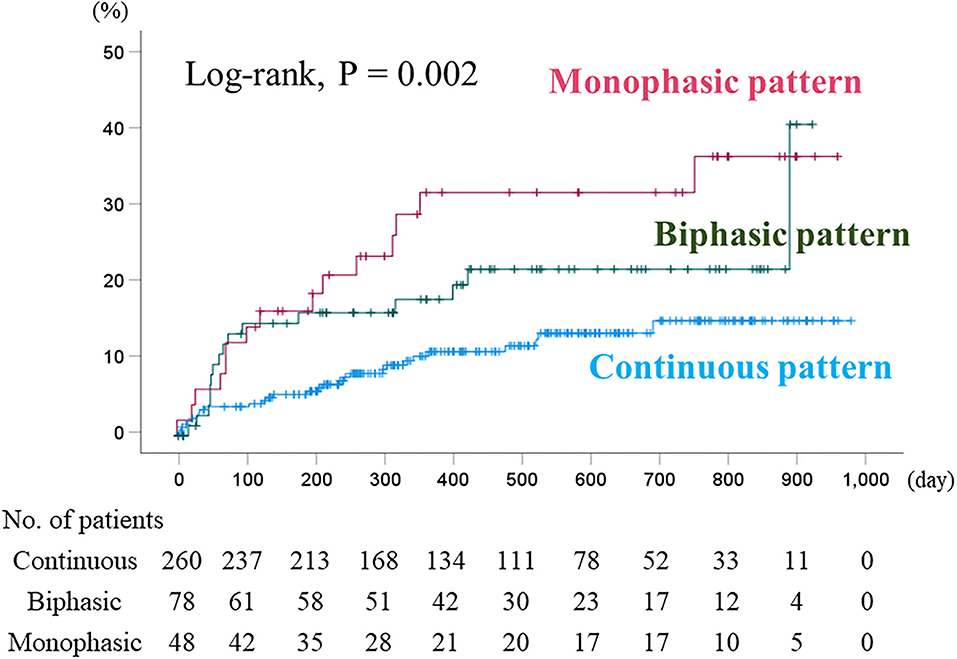
Figure 4. Kaplan–Meier analysis for cardiac event rate stratified by IRVF patterns. The cumulative cardiac event rate significantly increased with worsening IRVF patterns (log-rank, P = 0.002). Although it showed basically similar to those of RVSI classification, there were overlap and inversion between the groups with biphasic and monophasic IRVF patterns. IRVF, intrarenal venous flow.
Discussion
In this study, we investigated the relationship of RVSI assessed by renal Doppler ultrasonography with laboratory tests, echocardiography and RHC, as well as its prognostic impact in HF patients. According to a past study, PH patients with high RVSI experienced more adverse events such as worsening PH or all-cause mortality (10). However, the clinical significance of RVSI in HF patients has not been sufficiently examined.
Right ventricular function is the main determinant of symptomatology and outcome in patients with HF (23, 25, 26). Right ventricle adapts to increased afterload by increasing contractility to preserve the right ventricle–to–pulmonary circulation coupling. When this adaptation is unsustainable, the right ventricle increases preload (in other words, right ventricular end-diastolic volume) relying on Frank-Starling law (26). In normal subjects without right ventricular diastolic failure, the forward flow from the right atrium to the right ventricle is normal, because the right ventricular end-diastolic pressure remains low. However, in patients with right ventricular diastolic failure, the forward flow is impaired, because the right ventricle is stiff and right ventricular end-diastolic pressure is elevated. When the pressure in the vena cava (IVC and superior vena cava) becomes lower than that in the right ventricle, blood flow will be partially directed backward into the vena cava. This leads to elevation of RAP (29). Namely, RAP is a surrogate marker of both right ventricular diastolic function and right ventricular diastolic stiffness (30–33). Furthermore, these series of processes lead to reduction of venous return to the right ventricle, and result in loss of right ventricular stroke volume and right ventricular dysfunction. In the present study, there was a positive correlation between RVSI and mPAP (R = 0.253, P < 0.001). RVSI also showed a positive correlation with TR severity (R = 0.197, P < 0.001) and a negative correlation with TAPSE/sPAP ratio (R = −0.330, P < 0.001). With advancing right-sided heart failure, TR generally becomes more severe (34). TAPSE/sPAP ratio is a surrogate of the right ventricle–to–pulmonary circulation coupling and is affected by right ventricular diastolic stiffness (26). We consider that RVSI was mainly affected by RAP, and was also affected by right heart diastolic failure, backflow, forward flow impairment and etc. Concordant with our results, it has been reported that RAP, right ventricular dysfunction, severity of TR and TAPSE/sPAP ratio are associated with worse prognosis in HF patients (25–27, 29–32, 35–43). To the best of our knowledge, this study is the first to report that the RVSI, as a marker of right-sided overload, is associated with cardiac events in HF patients.
Cardiorenal syndrome commonly refers to the collective dysfunction of heart and kidney resulting in a cascade of feedback mechanism that damages both organs (44). Renal dysfunction is associated with adverse prognosis in HF patients (45). Given the aging population, patients with HF and CKD are likely to continue to increase due to longer cumulative exposure to common risk factors including hypertension, obesity, diabetes and vascular disorders (46). Thus, we have to understand the various mechanisms of this syndrome. Renal congestion due to elevation of RAP is one of the main conditions of cardiorenal syndrome. Renal congestion may increase interstitial pressure and reduce vessel compliance in the renal parenchymal regions due to direct compression (47–49). Intrarenal venous flow depends on interstitial pressure, intra-abdominal pressure and intravenous pressure, and shows superimposed biphasic forward velocities that peak during systole and diastole (48, 50, 51). Under physiological conditions, intrarenal veins exhibit continuous flow independent of renal function (continuous pattern). With increasing RAP, renal veins become less compliant, continuous flow becomes discontinuous flow and increasing prominence of the superimposed biphasic forward velocities (biphasic pattern). Further increases in RAP finally lead to a diastolic-only flow (monophasic pattern) (52, 53). The classification of IRVF patterns has a weakness; some patterns may be difficult to be classified. According to Table 1, there were no differences in distribution of IRVF patterns between the high and low RVSI groups. RVSI can complement the weaknesses by quantifying IRVF. We consider that quantifying RVSI can detect renal congestion more sensitively than IRVF patterns.
We considered both RVSI and IRVF pattern might be useful as markers of right sided heart failure and prognostic indicators. Regarding comparison of RVSI with IRVF patterns for predicting prognosis, our data suggest that the RVSI may be superior to IRVF patterns. Namely, although Kaplan–Meier analysis of IRVF patterns (Figure 4) showed basically similar to those of RVSI classification (Figure 3), there were overlap and inversion between the biphasic and monophasic IRVF patterns (Figure 4). Additionally, to compare the high and low RVSI groups with the same IRVF patterns about cardiac event rates, in patients with biphasic pattern, we could find that the cardiac event rate was significantly higher in the high RVSI group than in the low RVSI group in the Kaplan–Meier analysis (log-rank, p = 0.004, data not shown in the manuscript). Moreover, RVSI was reported to be more sensitive and specific predictor of the outcome than IRVF patterns in the previous study (20). Taken together, RVSI can predict outcome more sensitive than IRVF patterns, even in cases of same IRVF pattern.
Study Limitations
There are some limitations in the present study. First, the study may be somewhat underpowered because of a single center prospective cohort study with a relatively small number of patients and a short follow-up period. Second, the present study used only variables during hospitalization and did not take into consideration changes in medical parameters or treatments after discharge. The hemodynamics of HF patients changes dynamically. Thus, future studies need to assess alterations of RVSI in response to hemodynamic changes. Third, since the attending physicians made decisions to perform RHC, there might be a potential selection bias. Therefore, the present results need to be viewed as preliminary, and further studies with a larger number of patients are needed.
Conclusion
RVSI assessed by renal Doppler ultrasonography reflects right-sided overload and is associated with adverse prognosis in HF patients.
Data Availability Statement
The raw data supporting the conclusions of this article will be made available by the authors, without undue reservation.
Ethics Statement
The studies involving human participants were reviewed and approved by Ethics Committee of Fukushima Medical University. The patients/participants provided their written informed consent to participate in this study. Written informed consent was obtained from the individual(s) for the publication of any potentially identifiable images or data included in this article.
Author Contributions
HO, KW, and YSa: conceptualization, methodology, formal analysis, investigation, writing–original draft, and visualization. AY: conceptualization, methodology, formal analysis, investigation, resources, data curation, writing–original draft, visualization, supervision, project administration, and funding acquisition. YHor, SI, MM, and YY: methodology, investigation, writing–original draft, and visualization. YSu, YI, YHot, TM, TK, MO, and AK: conceptualization, methodology, formal analysis, investigation, and writing–review and editing. YT: conceptualization, methodology, formal analysis, investigation, writing–original draft, supervision, and project administration. All authors contributed to the article and approved the submitted version.
Funding
This study was supported in part by a grant-in-aid for Scientific Research (Nos. 20K07828 and MO20K16529) from the Japan Society for the Promotion of Science.
Conflict of Interest
The authors declare that the research was conducted in the absence of any commercial or financial relationships that could be construed as a potential conflict of interest.
Publisher's Note
All claims expressed in this article are solely those of the authors and do not necessarily represent those of their affiliated organizations, or those of the publisher, the editors and the reviewers. Any product that may be evaluated in this article, or claim that may be made by its manufacturer, is not guaranteed or endorsed by the publisher.
Supplementary Material
The Supplementary Material for this article can be found online at: https://www.frontiersin.org/articles/10.3389/fcvm.2022.772466/full#supplementary-material
References
1. Ho KK, Pinsky JL, Kannel WB, Levy D. The epidemiology of heart failure: the Framingham Study. J Am Coll Cardiol. (1993) 22:6A−13. doi: 10.1016/0735-1097(93)90455-A
2. Nakane E, Kato T, Tanaka N, Kuriyama T, Kimura K, Nishiwaki S, et al. Association of the induction of a self-care management system with 1-year outcomes in patients hospitalized for heart failure. J Cardiol. (2021) 77:48–56. doi: 10.1016/j.jjcc.2020.07.015
3. Girerd N, Seronde MF, Coiro S, Chouihed T, Bilbault P, Braun F, et al. Integrative assessment of congestion in heart failure throughout the patient journey. JACC Heart Fail. (2018) 6:273–85. doi: 10.1016/j.jchf.2017.09.023
4. Pellicori P, Kaur K, Clark AL. Fluid management in patients with chronic heart failure. Card Fail Rev. (2015) 1:90–5. doi: 10.15420/cfr.2015.1.2.90
5. Massari F, Scicchitano P, Iacoviello M, Passantino A, Guida P, Sanasi M, et al. Multiparametric approach to congestion for predicting long-term survival in heart failure. J Cardiol. (2020) 75:47–52. doi: 10.1016/j.jjcc.2019.05.017
6. Yoshihisa A, Watanabe K, Sato Y, Ishibashi S, Matsuda M, Yamadera Y, et al. Intrarenal doppler ultrasonography reflects hemodynamics and predicts prognosis in patients with heart failure. Sci Rep. (2020) 10:22257. doi: 10.1038/s41598-020-79351-6
7. Iida N, Seo Y, Sai S, Machino-Ohtsuka T, Yamamoto M, Ishizu T, et al. Clinical implications of intrarenal hemodynamic evaluation by doppler ultrasonography in heart failure. JACC Heart Fail. (2016) 4:674–82. doi: 10.1016/j.jchf.2016.03.016
8. Nijst P, Martens P, Dupont M, Tang WHW, Mullens W. Intrarenal flow alterations during transition from euvolemia to intravascular volume expansion in heart failure patients. JACC Heart Fail. (2017) 5:672–81. doi: 10.1016/j.jchf.2017.05.006
9. Puzzovivo A, Monitillo F, Guida P, Leone M, Rizzo C, Grande D, et al. Renal venous pattern: a new parameter for predicting prognosis in heart failure outpatients. J Cardiovasc Dev Dis. (2018) 5:52. doi: 10.3390/jcdd5040052
10. Husain-Syed F, Birk HW, Ronco C, Schormann T, Tello K, Richter MJ, et al. Doppler-derived renal venous stasis index in the prognosis of right heart failure. J Am Heart Assoc. (2019) 8:e013584. doi: 10.1161/JAHA.119.013584
11. Writing Committee M, Yancy CW, Jessup M, Bozkurt B, Butler J, Casey DE, et al. 2013 ACCF/AHA guideline for the management of heart failure: a report of the American college of cardiology foundation/American heart association task force on practice guidelines. Circulation. (2013) 128:e240–327. doi: 10.1161/CIR.0b013e31829e8776
12. Ponikowski P, Voors AA, Anker SD, Bueno H, Cleland JGF, Coats AJS, et al. 2016 ESC Guidelines for the diagnosis and treatment of acute and chronic heart failure: the task force for the diagnosis and treatment of acute and chronic heart failure of the European society of cardiology (ESC) developed with the special contribution of the heart failure association (HFA) of the ESC. Eur Heart J. (2016) 37:2129–200. doi: 10.1093/eurheartj/ehw128
13. Yoshihisa A, Sato Y, Watanabe S, Yokokawa T, Sato T, Suzuki S, et al. Decreased cardiac mortality with nicorandil in patients with ischemic heart failure. BMC Cardiovasc Disord. (2017) 17:141. doi: 10.1186/s12872-017-0577-3
14. American Diabetes A. Diagnosis and classification of diabetes mellitus. Diabetes Care. (2011) 34:S62–9. doi: 10.2337/dc11-S062
15. Stevens PE, Levin A, Kidney disease: improving global outcomes chronic kidney disease guideline development work group M. evaluation and management of chronic kidney disease: synopsis of the kidney disease: improving global outcomes 2012 clinical practice guideline. Ann Intern Med. (2013) 158:825–30. doi: 10.7326/0003-4819-158-11-201306040-00007
16. Miura S, Yoshihisa A, Takiguchi M, Shimizu T, Nakamura Y, Yamauchi H, et al. Association of hypocalcemia with mortality in hospitalized patients with heart failure and chronic kidney disease. J Card Fail. (2015) 21:621–7. doi: 10.1016/j.cardfail.2015.04.015
17. Sato Y, Yoshihisa A, Oikawa M, Nagai T, Yoshikawa T, Saito Y, et al. Prognostic impact of worsening renal function in hospitalized heart failure patients with preserved ejection fraction: a report from the JASPER registry. J Card Fail. (2019) 25:631–42. doi: 10.1016/j.cardfail.2019.04.009
18. Yancy CW, Jessup M, Bozkurt B, Butler J, Casey DE, Drazner MH, et al. 2013 ACCF/AHA guideline for the management of heart failure: a report of the American college of cardiology foundation/American heart association task force on practice guidelines. J Am Coll Cardiol. (2013) 62:e147–239. doi: 10.1016/j.jacc.2013.05.019
19. Yoshihisa A, Ichijo Y, Watanabe K, Sato Y, Kanno Y, Takiguchi M, et al. Prior history and incidence of cancer impacts on cardiac prognosis in hospitalized patients with heart failure. Circ J. (2019) 83:1709–17. doi: 10.1253/circj.CJ-19-0279
20. Kiely DG, Levin D, Hassoun P, Ivy DD, Jone PN, Bwika J, et al. EXPRESS: statement on imaging and pulmonary hypertension from the pulmonary vascular research institute (PVRI). Pulm Circ. (2019) 9:2045894019841990. doi: 10.1177/2045894019841990
21. Rudski LG, Lai WW, Afilalo J, Hua L, Handschumacher MD, Chandrasekaran K, et al. Guidelines for the echocardiographic assessment of the right heart in adults: a report from the American Society of Echocardiography endorsed by the European association of echocardiography, a registered branch of the European society of cardiology, and the canadian society of echocardiography. J Am Soc Echocardiogr. (2010) 23:685–713. doi: 10.1016/j.echo.2010.05.010
22. Guazzi M, Bandera F, Pelissero G, Castelvecchio S, Menicanti L, Ghio S, et al. Tricuspid annular plane systolic excursion and pulmonary arterial systolic pressure relationship in heart failure: an index of right ventricular contractile function and prognosis. Am J Physiol Heart Circ Physiol. (2013) 305:H1373–81. doi: 10.1152/ajpheart.00157.2013
23. Guazzi M, Naeije R. Pulmonary hypertension in heart failure: pathophysiology, pathobiology, and emerging clinical perspectives. J Am Coll Cardiol. (2017) 69:1718–34. doi: 10.1016/j.jacc.2017.01.051
24. Guazzi M, Naeije R. Right heart phenotype in heart failure with preserved ejection fraction. Circ Heart Fail. (2021) 14:e007840. doi: 10.1161/CIRCHEARTFAILURE.120.007840
25. Guazzi M. Use of TAPSE/PASP ratio in pulmonary arterial hypertension: an easy shortcut in a congested road. Int J Cardiol. (2018) 266:242–4. doi: 10.1016/j.ijcard.2018.04.053
26. Tello K, Wan J, Dalmer A, Vanderpool R, Ghofrani HA, Naeije R, et al. Validation of the tricuspid annular plane systolic excursion/systolic pulmonary artery pressure ratio for the assessment of right ventricular-arterial coupling in severe pulmonary hypertension. Circ Cardiovasc Imaging. (2019) 12:e009047. doi: 10.1161/CIRCIMAGING.119.009047
27. Guazzi M, Dixon D, Labate V, Beussink-Nelson L, Bandera F, Cuttica MJ, et al. RV Contractile function and its coupling to pulmonary circulation in heart failure with preserved ejection fraction: stratification of clinical phenotypes and outcomes. JACC Cardiovasc Imaging. (2017) 10:1211–21. doi: 10.1016/j.jcmg.2016.12.024
28. Galie N, Humbert M, Vachiery JL, Gibbs S, Lang I, Torbicki A, et al. 2015 ESC/ERS Guidelines for the diagnosis and treatment of pulmonary hypertension: the joint task force for the diagnosis and treatment of pulmonary hypertension of the European society of cardiology (ESC) and the European respiratory society (ERS): endorsed by: association for European paediatric and congenital cardiology (AEPC), international society for heart and lung transplantation (ISHLT). Eur Heart J. (2016) 37:67–119. doi: 10.1093/eurheartj/ehv317
29. Marcus JT, Westerhof BE, Groeneveldt JA, Bogaard HJ, de Man FS, Vonk Noordegraaf A. Vena cava backflow and right ventricular stiffness in pulmonary arterial hypertension. Eur Respir J. (2019) 54:1900625. doi: 10.1183/13993003.00625-2019
30. D'Alonzo GE, Barst RJ, Ayres SM, Bergofsky EH, Brundage BH, Detre KM, et al. Survival in patients with primary pulmonary hypertension. results from a national prospective registry. Ann Intern Med. (1991) 115:343–9. doi: 10.7326/0003-4819-115-5-343
31. Benza RL, Miller DP, Gomberg-Maitland M, Frantz RP, Foreman AJ, Coffey CS, et al. Predicting survival in pulmonary arterial hypertension: insights from the registry to evaluate early and long-term pulmonary arterial hypertension disease management (REVEAL). Circulation. (2010) 122:164–72. doi: 10.1161/CIRCULATIONAHA.109.898122
32. Weatherald J, Boucly A, Chemla D, Savale L, Peng M, Jevnikar M, et al. Prognostic value of follow-up hemodynamic variables after initial management in pulmonary arterial hypertension. Circulation. (2018) 137:693–704. doi: 10.1161/CIRCULATIONAHA.117.029254
33. Wessels JN, Mouratoglou SA, van Wezenbeek J, Handoko ML, Marcus JT, Meijboom LJ, et al. Right atrial function is associated with RV diastolic stiffness: RA-RV interaction in pulmonary arterial hypertension. Eur Respir J. (2021). doi: 10.1183/13993003.01454-2021
34. Prihadi EA, Delgado V, Leon MB, Enriquez-Sarano M, Topilsky Y, Bax JJ. Morphologic types of tricuspid regurgitation: characteristics and prognostic implications. JACC Cardiovasc Imaging. (2019) 12:491–9. doi: 10.1016/j.jcmg.2018.09.027
35. Benfari G, Antoine C, Miller WL, Thapa P, Topilsky Y, Rossi A, et al. Excess mortality associated with functional tricuspid regurgitation complicating heart failure with reduced ejection fraction. Circulation. (2019) 140:196–206. doi: 10.1161/CIRCULATIONAHA.118.038946
36. De la Espriella R, Santas E, Chorro FJ, Minana G, Soler M, Bodi V, et al. Functional tricuspid regurgitation and recurrent admissions in patients with acute heart failure. Int J Cardiol. (2019) 291:83–8. doi: 10.1016/j.ijcard.2019.03.051
37. Wang N, Fulcher J, Abeysuriya N, McGrady M, Wilcox I, Celermajer D, et al. Tricuspid regurgitation is associated with increased mortality independent of pulmonary pressures and right heart failure: a systematic review and meta-analysis. Eur Heart J. (2019) 40:476–84. doi: 10.1093/eurheartj/ehy641
38. Richter MJ, Zedler D, Berliner D, Douschan P, Gall H, Ghofrani HA, et al. Clinical relevance of right atrial functional response to treatment in pulmonary arterial hypertension. Front Cardiovasc Med. (2021) 8:775039. doi: 10.3389/fcvm.2021.775039
39. Guazzi M. The alarming association between right ventricular dysfunction and outcome: aetiology matters. Eur Heart J. (2020) 41:1283–5. doi: 10.1093/eurheartj/ehaa080
40. Dietz MF, Prihadi EA, van der Bijl P, Goedemans L, Mertens BJA, Gursoy E, et al. Prognostic implications of right ventricular remodeling and function in patients with significant secondary tricuspid regurgitation. Circulation. (2019) 140:836–45. doi: 10.1161/CIRCULATIONAHA.119.039630
41. Naksuk N, Tan N, Padmanabhan D, Kancharla K, Makkar N, Yogeswaran V, et al. Right ventricular dysfunction and long-term risk of sudden cardiac death in patients with and without severe left ventricular dysfunction. Circ Arrhythm Electrophysiol. (2018) 11:e006091. doi: 10.1161/CIRCEP.117.006091
42. Kawut SM, Barr RG, Lima JA, Praestgaard A, Johnson WC, Chahal H, et al. Right ventricular structure is associated with the risk of heart failure and cardiovascular death: the multi-ethnic study of atherosclerosis (MESA)–right ventricle study. Circulation. (2012) 126:1681–8. doi: 10.1161/CIRCULATIONAHA.112.095216
43. Nochioka K, Querejeta Roca G, Claggett B, Biering-Sorensen T, Matsushita K, Hung CL, et al. Right ventricular function, right ventricular-pulmonary artery coupling, and heart failure risk in 4 US communities: the atherosclerosis risk in communities (ARIC) study. JAMA Cardiol. (2018) 3:939–48. doi: 10.1001/jamacardio.2018.2454
44. Kumar U, Wettersten N, Garimella PS. Cardiorenal syndrome: pathophysiology. Cardiol Clin. (2019) 37:251–65. doi: 10.1016/j.ccl.2019.04.001
45. Smith GL, Lichtman JH, Bracken MB, Shlipak MG, Phillips CO, DiCapua P, et al. Renal impairment and outcomes in heart failure: systematic review and meta-analysis. J Am Coll Cardiol. (2006) 47:1987–96. doi: 10.1016/j.jacc.2005.11.084
46. Damman K, Tang WH, Testani JM, McMurray JJ. Terminology and definition of changes renal function in heart failure. Eur Heart J. (2014) 35:3413–6. doi: 10.1093/eurheartj/ehu320
47. Mullens W, Abrahams Z, Francis GS, Sokos G, Taylor DO, Starling RC, et al. Importance of venous congestion for worsening of renal function in advanced decompensated heart failure. J Am Coll Cardiol. (2009) 53:589–96. doi: 10.1016/j.jacc.2008.05.068
48. Burnett JC, Knox FG. Renal interstitial pressure and sodium excretion during renal vein constriction. Am J Physiol. (1980) 238:F279–82. doi: 10.1152/ajprenal.1980.238.4.F279
49. Damman K, van Deursen VM, Navis G, Voors AA, van Veldhuisen DJ, Hillege HL. Increased central venous pressure is associated with impaired renal function and mortality in a broad spectrum of patients with cardiovascular disease. J Am Coll Cardiol. (2009) 53:582–8. doi: 10.1016/j.jacc.2008.08.080
50. Winton FR. The influence of venous pressure on the isolated mammalian kidney. J Physiol. (1931) 72:49–61. doi: 10.1113/jphysiol.1931.sp002761
51. Winton FR. Arterial, venous, intrarenal, and extrarenal pressure effects on renal blood flow. Circ Res. (1964) 15:103–9.
52. Avasthi PS, Greene ER, Scholler C, Fowler CR. Noninvasive diagnosis of renal vein thrombosis by ultrasonic echo-Doppler flowmetry. Kidney Int. (1983) 23:882–7. doi: 10.1038/ki.1983.111
Keywords: heart failure, renal circulation, hemodynamics, kidney, prognosis
Citation: Ohara H, Yoshihisa A, Horikoshi Y, Ishibashi S, Matsuda M, Yamadera Y, Sugawara Y, Ichijo Y, Hotsuki Y, Watanabe K, Sato Y, Misaka T, Kaneshiro T, Oikawa M, Kobayashi A and Takeishi Y (2022) Renal Venous Stasis Index Reflects Renal Congestion and Predicts Adverse Outcomes in Patients With Heart Failure. Front. Cardiovasc. Med. 9:772466. doi: 10.3389/fcvm.2022.772466
Received: 08 September 2021; Accepted: 10 February 2022;
Published: 07 March 2022.
Edited by:
Christos Bourantas, University College London, United KingdomReviewed by:
Bertram Pitt, University of Michigan, United StatesManuel Richter, Universitätsklinikum Gießen, Germany
Copyright © 2022 Ohara, Yoshihisa, Horikoshi, Ishibashi, Matsuda, Yamadera, Sugawara, Ichijo, Hotsuki, Watanabe, Sato, Misaka, Kaneshiro, Oikawa, Kobayashi and Takeishi. This is an open-access article distributed under the terms of the Creative Commons Attribution License (CC BY). The use, distribution or reproduction in other forums is permitted, provided the original author(s) and the copyright owner(s) are credited and that the original publication in this journal is cited, in accordance with accepted academic practice. No use, distribution or reproduction is permitted which does not comply with these terms.
*Correspondence: Akiomi Yoshihisa, yoshihis@fmu.ac.jp