 Tianci Chai1,2,3†
 Xiaojie Yang
 Liangwan Chen
- 1Department of Cardiovascular Surgery, Fujian Medical University Union Hospital, Fuzhou, China
- 2Key Laboratory of Cardio-Thoracic Surgery (Fujian Medical University), Fujian Province University, Fuzhou, China
- 3Department of Anesthesiology, Xinyi People's Hospital, Xuzhou, China
- 4The Affiliated Longyan First Hospital of Fujian Medical University, Longyan, China
- 5Department of Thoracic Surgery, Fujian Medical University Union Hospital, Fuzhou, China
Objective: The aim of the study was to identify additional factors that contributed to coronary artery disease (CAD).
Methods: We conducted integrative analysis on publicly available data from genome-wide association studies and quantitative trait locus studies by employing Mendelian randomization methods to examine the associations of gene expression in liver cells and circulating protein levels with LDL-C and CAD.
Results: We found that the mRNA expression levels of CELSR2, PSRC1, SORT1, SYPL2, RHD, RHCE, ANGPTL3, ATXN7L2, DNAH11, FADS3, ST3GAL4, NYNRIN, CETP, EFCAB13, and SPTLC3 were significantly associated with LDL-C. The expression levels of SORT1, PSRC1, and CELSR2 in liver cells were significantly associated with CAD. Higher expression levels of SORT1, PSRC1, and CELSR2 in the liver were significantly associated with lower circulating LDL-C levels and CAD risk. PSRC1 variants were strongly associated with SORT1, PSRC1, and CELSR2 gene expression in liver cells. Higher circulating granulin and apolipoprotein B levels, which were strongly affected by PSRC1 variants, were significantly associated with higher LDL-C levels and CAD risk, with odds ratios of 1.15 (1.10–1.19) and 1.45 (1.21–1.74), respectively.
Conclusion: This study showed that regulatory SNPs in PSRC1 may affect CAD risk by altering CELSR2, PSRC1, and SORT1 gene expression in liver cells and circulating granulins and apolipoprotein B proteins.
Introduction
Coronary artery disease (CAD) is one of the most common cardiovascular diseases and is associated with high morbidity and mortality (1). The pathogenesis of CAD is not fully understood but is known to be a process in which lipoprotein accumulates in the arteries that supply blood to the heart. Dyslipidemia is thought to be a major factor in the development of CAD, and low-density lipoprotein cholesterol (LDL-C) has been shown to be one of the most important causal risk factors. The liver is a metabolically active tissue that is important in a number of common human diseases, including obesity, diabetes, and atherosclerosis. In terms of lipoprotein metabolism, the liver is the major site of LDL-C removal from the circulation. Altered liver expression of genes involved in lipid metabolism (2–4). Hepatic de novo lipogenesis influences hepatic cholesterol content as well as its effects on circulating lipid levels (5). However, the association between gene expression in liver cells and CAD has not been examined systematically.
Large-scale genome-wide association studies (GWAS) have robustly identified large numbers of risk-associated genetic variants implicated in LDL-C (6–8) and CAD (9, 10). However, the GWAS identified loci were located in complex genomic regions containing multiple genes (11). It is unclear which of these genes are functionally related to LDL-C and CAD functions. The colocalization of genetic associations for disease traits with those for intermediate molecular phenotypes, such as gene expression and metabolomics, provides powerful evidence to advance hypotheses regarding the genes and pathways through which these disease-associated variants mediate their effects (12). Quantitative trait loci (QTLs) studies have shown that genetic variants are strongly associated with liver gene expression traits (13). QTL studies for gene expression and circulating proteins can offer a route to a comprehensive molecular interpretation of GWAS findings. Therefore, integrative analysis of omics data has the potential to identify pathogenic genes for CAD.
Mendelian randomization (MR) is an analytical technique that assesses the correlation between genetic alternatives to intermediate biomarkers and subsequent diseases that are supposed to be caused by intermediate biomarkers based on the random distribution of genetic variation specific to biomarkers. The recently developed two-sample multi-instrumental MR methods based on GWAS summary data provide feasible ways to integrate omics data from independent GWAS, including QTL studies on genome-wide mRNA expression and circulating protein levels (eQTL and pQTL, respectively) (14–16). Two-sample MR methods are data integration methods that have been widely applied in the identification of intermediate molecules for disease traits and therefore are effective strategies to explicate the GWAS findings. We supposed that integration of data from large-scale GWAS and QTL studies by MR methods could identify genes associated with CAD in liver cells.
In view of the well-established causal role of LDL-C in CAD, biological molecules associated with LDL-C may be risk factors for CAD. In this study, we attempted to elucidate the biological basis of the genetic associations and identify potential risk factors for CAD. We applied several data integration methods to identify potential risk factors such as gene expression in liver cells and circulating proteins for CAD by using a combination of data from GWAS, eQTL and pQTL studies. Meanwhile, as LDL-C level was the most important risk factor for CAD, the associations between gene expression in liver cells and LDL-C were also examined. Finally, we obtained association evidence on circulating protein levels and LDL-C and CAD to identify additional factors that contributed to CAD.
Materials and Methods
Data Resources
This study used datasets from two LDL-C and one CAD GWAS, one eQTL study in the liver, and three pQTL studies on circulating protein levels. The two LDL-C datasets were obtained from the lipid GWAS conducted by the Global Lipids Genetics Consortium (GLGC). The first GWAS evaluated the associations between almost 2.6 million SNPs and lipid levels in 188,578 Europeans (8). The dataset containing summary results of the association between almost 2.6 million SNPs and LDL-C level was downloaded at http://csg.sph.umich.edu/abecasis/public/lipids2013/, and used in our analysis. The second LDL-C GWAS was a meta-analysis of exome-wide association studies that evaluated the association between almost 292,417 variants and LDL-C levels in 47,532 East Asians and more than 300,000 individuals primarily (84%) of European descent (http://csg.sph.umich.edu/abecasis/public/lipids2017EastAsian)(6).
We used the summary results from a large-scale CAD GWAS meta-analysis conducted by the CARDIoGRAMplusC4D consortium (10). This study enrolled ~185,000 individuals who were mainly (77%) of European ancestry. The dataset contained the summary statistics of associations between almost 9.5 million SNPs and CAD tested under the additive model in the initial GWAS (http://www.cardiogramplusc4d.org/data-downloads/).
The eQTL datasets contained the cis-eQTL summary level data on mRNA expression levels in liver cells from the GTEx project (17). The summary data of this eQTL study are available at https://cnsgenomics.com/software/smr/#eQTLsummarydata.
We acquired pQTL summary data from three studies that examined the associations between genome-wide SNPs and circulating protein levels in thousands of individuals. The first pQTL study tested genome-wide associations between 509,946 SNPs and circulating levels of 1,124 proteins in blood samples of 1,000 individuals from the KORA study (18). The summary data was available at http://metabolomics.helmholtz-muenchen.de/pgwas/index.php?task=download. The second pQTL study performed genome-wide testing of 10.6 million imputed autosomal variants against levels of 2,994 circulating proteins in 3,301 individuals of European descent from the INTERVAL study (19). The summary data was available at http://www.phpc.cam.ac.uk/ceu/proteins/. The third pQTL study analyzed 123 metabolites in up to 24,925 individuals (20). The 123 metabolic traits were quantified by nuclear magnetic resonance spectroscopy in blood samples. The summary data was available at http://www.computationalmedicine.fi/data#NMR_GWAS.
SMR Analysis
The summary data–based MR (SMR) approach is a kind of two-sample multi-instrumental MR method that provides feasible ways to integrate GWAS summary data with QTL data (16). SMR facilitates the goal of integrating of summary statistics from large-scale GWAS with transcriptome-wide association data. In addition, in such MR approaches, the exposure and outcome are not necessarily measured in the same samples, and the data are summary statistics rather than the raw data of the individuals (16). The instrumental variables (SNPs that were both tested in the independent QTL studies and GWAS) provided the summary data (e.g., the regression coefficient beta values and standard error) on the effects of SNPs on the levels of biomolecules and outcomes. By analyzing these summary data SMR estimates the causal effects of the biomolecules on the outcomes.
SMR software (version 0.712) is a command-line program that was downloaded from http://cnsgenomics.com/software/smr/. The parameters were left at the default setting in the analysis. The outcome data (i.e., SNP rs number, alleles, allele frequency, beta values, standard error, P-values) required for SMR analysis were collected from the LDL-C and CAD GWAS datasets and then organized into a.ma file with 8 columns specific for the SMR analysis by using the R program. The files containing eQTL summary data in binary format for the SMR analysis were available at http://cnsgenomics.com/software/smr/#DataResource (described above). We used genotype data of HapMap r23 CEU as a reference panel to calculate the linkage disequilibrium (LD) correlation matrix for SMR. The genome-wide significance threshold for the SMR analysis was 5.0 × 10⁻⁶. We also performed the heterogeneity in dependent instruments (HEIDI) test to test the “no horizontal pleiotropy” assumption. The HEIDI test was conducted to examine whether there is a single causal SNP affecting gene expression and the phenotype. Genes with PHEIDI ≥ 0.05 (without heterogeneity) were considered. Functional annotation enrichment analyses were performed for the identified genes by using the DAVID online tools. Protein-protein interaction analyses were performed in the STRING (https://string-db.org/) and LENS (severus.dbmi.pitt.edu/LENS/) databases.
MR Analysis on Proteins
To obtain further supporting evidence for proteins identified in pQTL analysis, we employed the inverse-variance weighted (IVW) MR (21), MR-Egger (22), MR pleiotropy residual sum and outlier (MR-PRESSO) (23) and the Causal Analysis Using Summary Effect estimates (CAUSE) (24) methods to test for potential causal relationships between circulating protein levels and LDL-C and CAD. The inverse-variance weighted method combines the ratio estimates from each IV in a meta-analysis model (21). If the associations with circulating protein levels were to lead to horizontal pleiotropy, the intercept from MR-Egger would be expected to differ from zero (22). In such cases, we interpreted the coefficient from MR-Egger as being the more valid causal estimate. Conversely, in the absence of statistical evidence for horizontal pleiotropy from the intercept on MR-Egger, we used IVW MR analysis as it retains greater power. The IVW MR and MR-Egger analyses were performed by using the MendelianRandomization R package (25). We also detected horizontal pleiotropy and outlier-corrected causal estimation by using MR-PRESSO tests (23). The outlier test in MR-PRESSO is the procedure to test for the MR assumption of no pleiotropy. The source code and documents for MR-PRESSO are available at https://github.com/rondolab/MR-PRESSO. The default parameters were used for the MR-PRESSO analysis.
Data used in these MR analyses were the pQTL data from the three studies and LDL-C (2013 GWAS) (8) and CAD (10) GWAS data that have been described above. The data required in the MR analysis (i.e., the SNP rs number, beta values, standard errors, and the P-values) were extracted from each of the LDL-C and CAD GWAS and pQTL datasets. Then we used the “merge” function of the R program to transform the data into a specific file (an ordinary document with 7 columns) for each protein-trait pair. In the pQTL summary data, SNPs with a P-value < 1.0 × 10⁻⁴ were selected as potential instrumental variables, except for the NMR_GWAS pQTL study (5.0 × 10⁻⁸). The selection criterion was set to 1.0 × 10⁻⁴ for the two pQTL studies because 5.0 × 10⁻⁸ would lead to too few instrumental variables. We clumped SNPs (LD r2 < 0.01 within 10,000 kb) based on data from Europeans from the 1,000 Genomes project using the “clump_data” function in the R package TwoSampleMR to select independent instrumental variables. The effect allele of each SNP in the LDL-C and CAD GWAS and pQTL studies was manually checked for consistency.
For proteins that passed the three MR tests, we applied the CAUSE method to account for horizontal pleiotropic effects by pathways other than those considered in the multivariable approach. CAUSE is a Mendelian randomization accounting for correlated and uncorrelated horizontal pleiotropic effects using genome-wide summary statistics (24). Data used in the CAUSE analysis were from pQTL studies and GWAS described above. We used 1,000,000 genetic variants to estimate the nuisance parameters. Other parameters were left as their defaults in the CAUSE analysis.
Results
Gene Expression in Liver Cells Associated With LDL-C and CAD
We carried out an SMR analysis to find gene expression in liver cells that was associated with CAD risk by integrating eQTL data from the GTEx project with large-scale GWAS data. The expression levels of a total of 21,032 genes were analyzed, and the expression of three genes (CELSR2, PSRC1, and SORT1) was significantly associated with CAD risk (P < 5.0 × 10⁻⁸) (Figure 1). In addition, the mRNA expression of another 13 genes was nominally associated with CAD risk (Table 1; Supplementary Table S1).
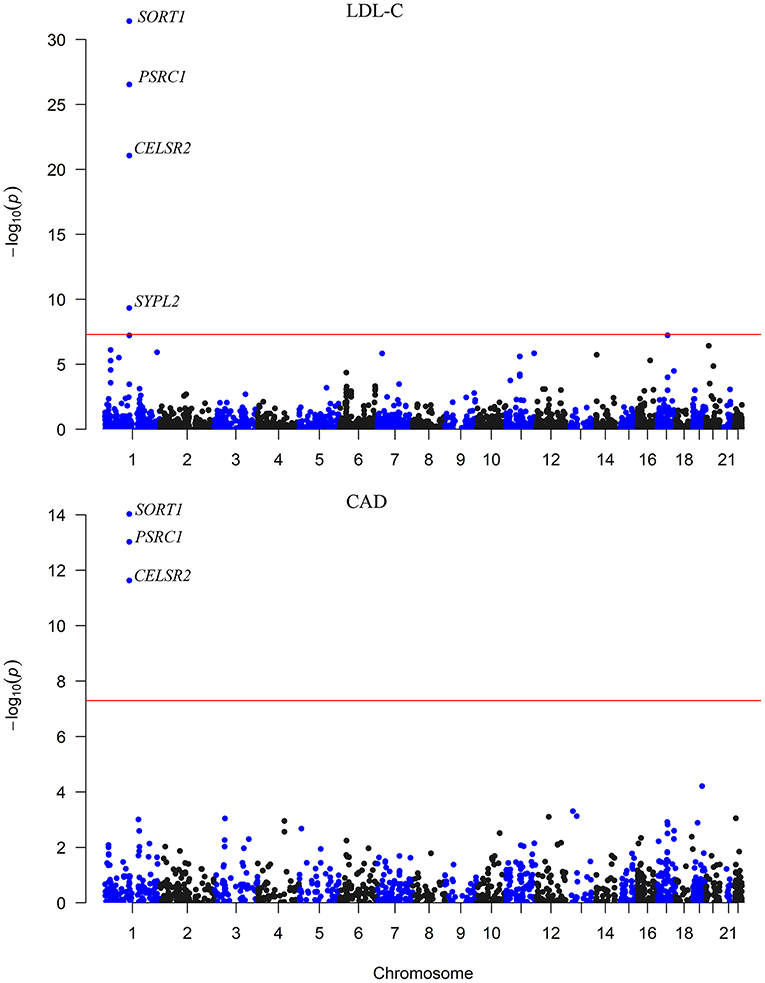
Figure 1. The association between mRNA expression levels and LDL-C and CAD in the liver. The x-axis represents the chromosome positions. The y axis shows the –log10P-values for the association between mRNA expression levels in liver cells and LDL-C and CAD. The associations of mRNA expression levels of SORT1, PSRC1, and CELSR2 in liver cells with both LDL-C and CAD passed the significance threshold of 5.0 × 10⁻⁸ (red line).
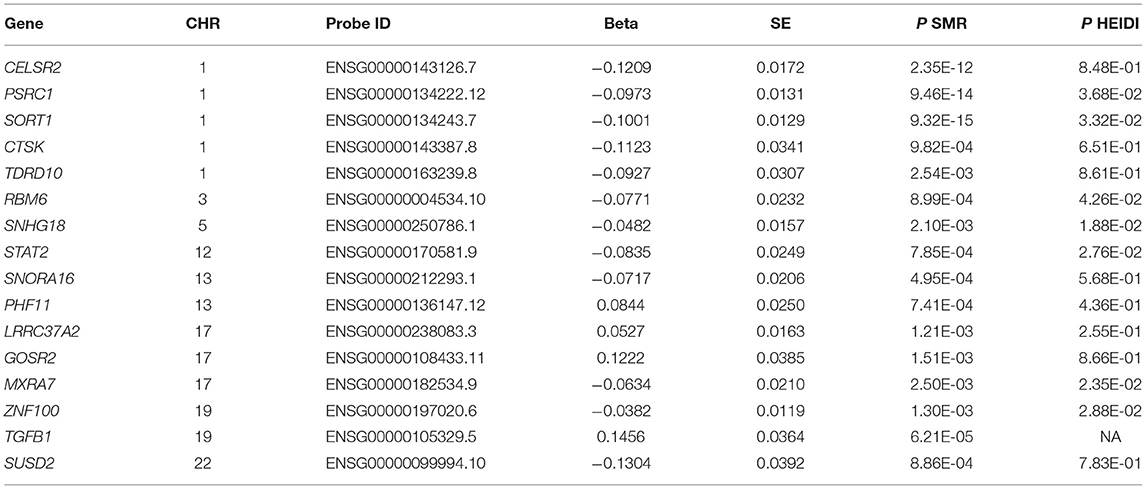
Table 1. Liver cell gene expressions associated with CAD.
The associations between the expression levels of the 21,032 genes in liver cells and circulating LDL-C levels were also examined. The expression levels of 15 genes (CELSR2, PSRC1, SORT1, SYPL2, RHD, RHCE, ANGPTL3, ATXN7L2, DNAH11, FADS3, ST3GAL4, NYNRIN, CETP, EFCAB13, and SPTLC3) were significantly associated with LDL-C (P < 5.0 × 10⁻⁶) (Table 2; Supplementary Table S2). Ten of them pass the HEIDI test. These genes were enriched in gene ontology (GO) biological process of cellular lipid metabolic process (P = 5.0 × 10⁻³).
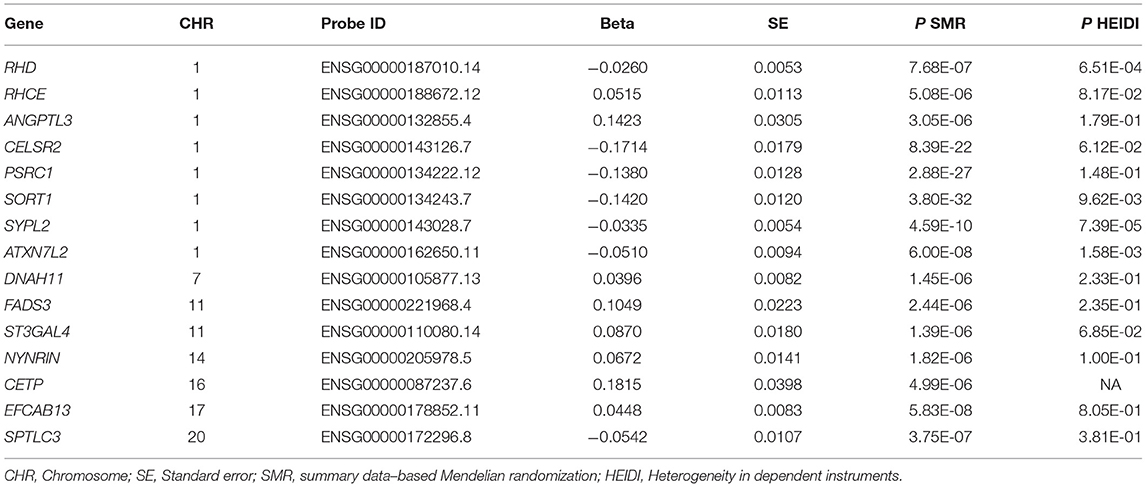
Table 2. Liver cell gene expressions associated with circulating LDL-C level.
Therefore, the associations of the mRNA expression levels of SORT1, PSRC1, and CELSR2 in the liver with both LDL-C and CAD passed the threshold of 5.0 × 10⁻⁸ (Figure 2). Higher expression levels of SORT1, PSRC1, and CELSR2 in liver cells were associated with lower LDL-C levels (beta = −0.142, −0.138, and −0.171, respectively) and CAD risk (beta = −0.10, −0.097, and −0.121, respectively).
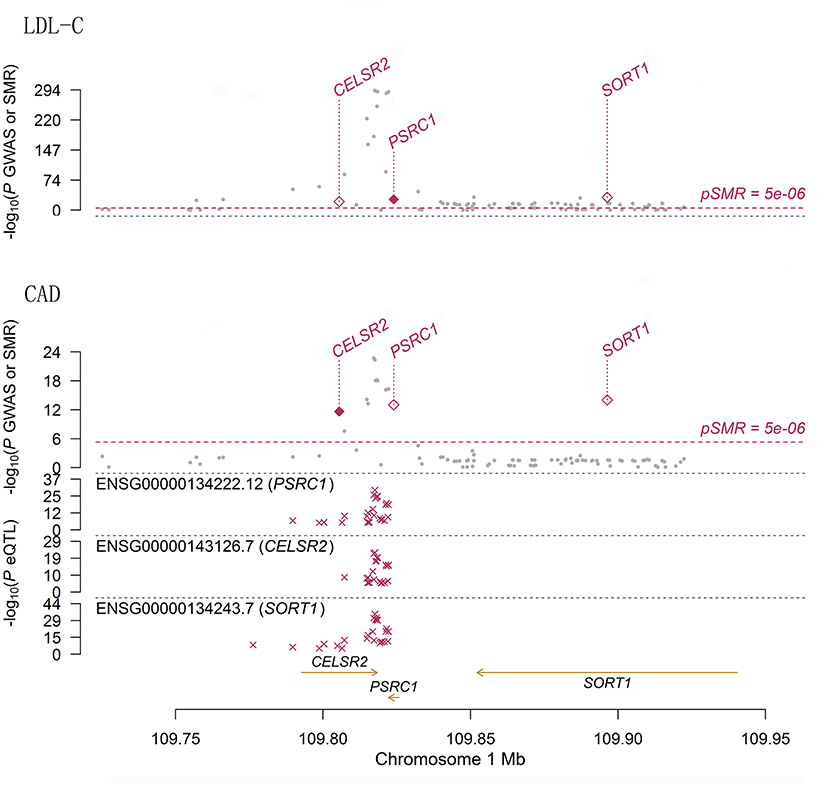
Figure 2. The association between mRNA expression levels of 1p13.3 genes and LDL-C and CAD in liver cells. The two panels present the results of the associations between mRNA expression levels of 1p13.3 genes and LDL-C and CAD in liver. Each panel consists of two parts. The x-axis represents the genomic position (GRCh37.p13). The lower part of each panel shows the results of eQTL. The y-axis represents –log10(P eQTL). In this part we can see that SNPs in 1p13.3 were strongly associated with the mRNA expression levels of SORT1, PSRC1, or CELSR2. The upper part of each panel shows the results of GWAS (gray dots) and SMR (red rhombus) analysis. The y-axis represents –log10(P GWAS or SMR). In this part we can see that SNPs in 1p13.3 were strongly associated with LDL-C and CAD. According to the SMR analysis, the mRNA expression levels of SORT1, PSRC1, and CELSR2 in liver cells were significantly associated with LDL-C and CAD.
pQTLs in the Identified Genes
We sought pQTLs in SORT1, PSRC1 and CELSR2 based on public data. In data from the KORA and INTERVAL pQTL studies, we found 116 pQTLs in PSRC1 (Supplementary Table S3). The pQTL rs599839 was significantly associated with LDL-C (P = 2.75 × 10−268) and CAD (P = 5.20 × 10⁻¹⁷). This SNP was strongly associated with SORT1 (P = 1.52 × 10−56), PSRC1 (P = 2.17 × 10−53) and CELSR2 (P = 4.73 × 10⁻¹²) gene expression in liver cells. In addition, this SNP was strongly associated with circulating levels of granulins in both pQTL studies (beta = −0.7453 and 0.8071, P = 3.32 × 10−51 and 1.00 × 10−200, respectively). Indeed, 21 SNPs in PSRC1 were found to be associated with circulating levels of granulin. Five SNPs in PSRC1 were strongly associated with circulating levels of apolipoprotein B.
Proteins Causally Associated With CAD
We tested whether the two proteins, i.e., granulins and apolipoprotein B, were genetically associated with CAD using several MR methods. The results were presented in Table 3. We first examined the associations between circulating levels of these proteins and LDL-C and found that the associations between circulating levels of granulin and apolipoprotein B and LDL-C were significant in every MR analysis using data from KORA and INTERVAL studies. In datasets available from the NMR_GWAS, we only found data for apolipoprotein B among the tested metabolites. By using these data, the association between circulating levels of apolipoprotein B and LDL-C was validated.
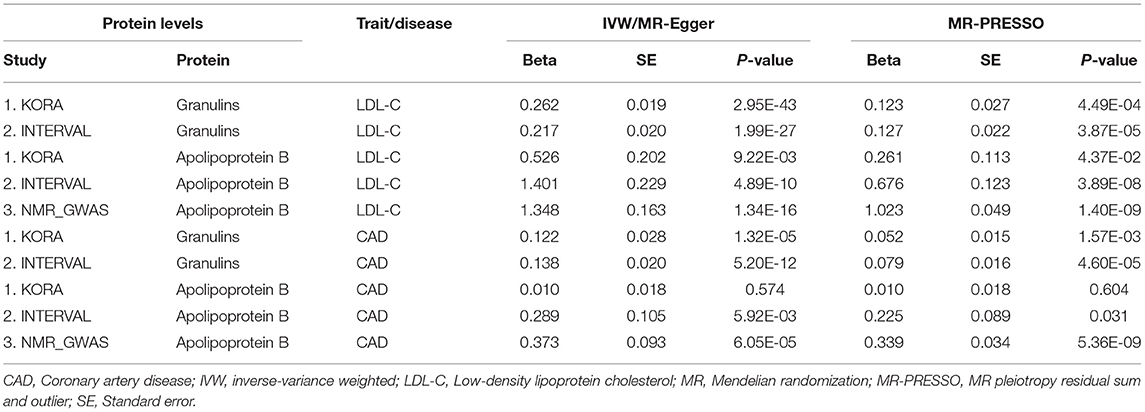
Table 3. The causation between plasma protein levels and LDL-C and CAD.
As expected, significant associations between granulins and apolipoprotein B levels and CAD were found (Table 3). These associations were validated in several MR analyses on data from two pQTL studies. The effect of protein granulin levels on CAD risk was relatively small, with an odds ratio (OR) of ~1.15 (95% confidence interval: 1.10–1.19). The effect of protein apolipoprotein B levels on CAD risk was larger than that of granulins, with an OR of ~1.45 (95% confidence interval: 1.21–1.74). LDL-C levels were causally associated with CAD. According to the STRING database, PSRC1, APOB and GRN were connected with each other according to the STRING database (Supplementary Figure S1). Therefore, granulins, apolipoprotein B, LDL-C and CAD were genetically correlated with each other.
Furthermore, we corrected for correlated and uncorrelated horizontal pleiotropy using the CAUSE method and still retained an indication for the causal effect of both apolipoprotein B and LDL-C (Supplementary Figure S2) and CAD (Figure 3). By using NMR_GWAS data, we found that the causal model was significantly better than the null and sharing models for both LDL-C (P = 3.0 × 10⁻⁶ and 7.8 × 10⁻³, respectively) and CAD (P = 5.3 × 10⁻⁶ and 2.6 × 10⁻⁴, respectively).
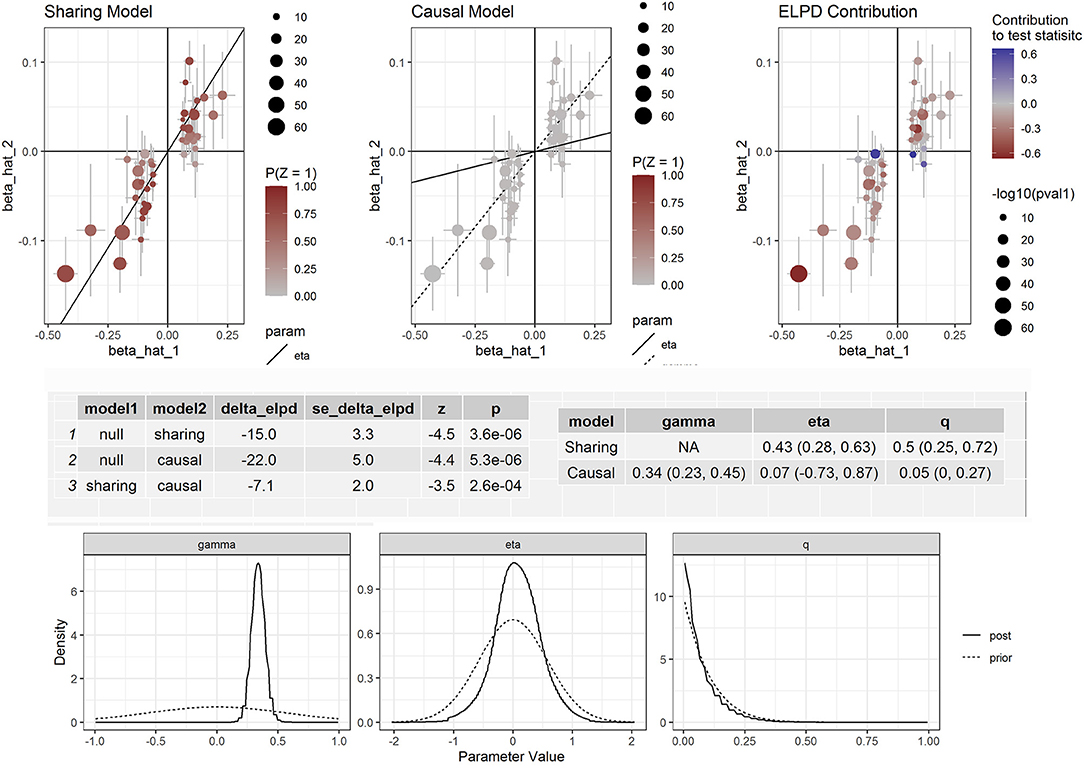
Figure 3. Effect-size estimates and variant-level contribution to CAUSE test statistics for circulating apolipoprotein B and CAD.
Discussion
In this study, we took advantage of MR approaches to determine potential causal factors (e.g., gene expression in liver cells and circulating protein levels) for CAD by integrating data from GWAS. We found genes that may play causal roles in LDL-C metabolism and CAD. We also found that circulating levels of granulins and apolipoprotein B were genetically associated with LDL-C and CAD. SNPs in PSRC1 that have regulatory potential may affect CAD risk by altering CELSR2, PSRC1, and SORT1 gene expression and circulating granulins and apolipoprotein B proteins.
To date, GWAS have successfully identified over 175 genetic loci for lipids. Some of these loci involved therapeutic targets such as HMGCR (statins), PCSK9 (antibodies), and NPC1L1 (ezetimibe). The causal effect of LDL-C on CAD has been well-established. Identification of factors related to LDL-C may help to understand the etiology of CAD and develop novel therapies. Elucidation of the causal factors underlying GWAS signals remains challenging due to the complexities of the genomic loci (e.g., LD) and the interactions. It is difficult to determine the most functionally relevant genes for LDL-C and CAD based only on genomic data. On the other hand, previous case-control studies have found gene expression implicated in dyslipidemia and CAD; however, these observational studies are subject to confounding and reverse causations. There was no liver gene expression profile study with large samples. MR is an analytical technique that assesses the correlation between genetic alternatives to phenotypes and outcomes based on the random distribution of genetic variation specific to biomarkers; and thus makes up for the shortcomings of traditional epidemiology studies (26, 27). By applying the two-sample MR approach, we identified the most relevant genes in the complex genomic loci for LDL-C and CAD. The findings of this study also indicated that the GWAS-identified loci contained causal factors for LDL-C and CAD, e.g., the expression of the genes in the loci.
The expression level of proline and serine rich coiled-coil 1 (PSRC1) in liver cells was associated with LDL-C and CAD. PSRC1 encodes a proline-rich protein, which is a target for regulation by the tumor suppressor protein p53. The genetic associations between PSRC1 variants and LDL-C and CAD have been well-established but the role of this gene in LDL-C and CAD has not been well-discussed. Our analysis suggested that SNPs in PSRC1 were strongly associated with gene expression, LDL-C and CAD, and furthermore, these SNPs were significantly associated with circulating levels of granulins and apolipoprotein B. Moreover, we demonstrated that circulating levels of these proteins were causally associated with LDL-C and CAD. Circulating progranulin is a dimer of high-density lipoprotein (HDL) (28). HDL/apolipoprotein A-I is known to bind to macrophage-derived progranulin and suppress its conversion into proinflammatory granulins (29). However, how PSRC1 interacts with GRN is unclear but we found that these genes were connected via other genes that were related to cardiovascular diseases or lipid metabolism (e.g., APP, APOA1, ARFGAP1, CALR, SAMD3, LRP2, AKT2, BGN, PIK3R2, HSPG2, YY1, TGM2) (Supplementary Figure S3). Based on multiple sources of evidence, the identified genes were suggested to be potential functional candidate genes. The interaction among these factors probably points to a pathway for LDL-C and CAD.
Our study found that apolipoprotein B was causally associated with LDL-C and CAD. It is known that one molecule of apolipoprotein B is required for the proper assembly and secretion of each very low density lipoprotein (30), which is converted into LDL-C after the hydrolysis of their triglyceride moiety (31). Indeed, apolipoprotein B is a proposed LDL-C-lowering target. Proprotein convertase subtilisin/kexin type 9 (PCSK9) regulates circulating LDL-C levels. Several studies have shown that PCSK9 regulates apolipoprotein B synthesis and secretion (32–34). In animals, a single dose of siRNA targeting PCSK9 resulted in a lowering of circulating PCSK9, apolipoprotein B, and LDL-C, without measurable effects on either high density lipoprotein cholesterol or triglycerides (35). In MR analyses in human samples we showed that there was a causal effect of circulating apolipoprotein B on CAD.
This study has some limitations. First, we did not carried out basic experiment to verify the functional effect of PSRC1 variants on gene expression and protein levels. Second, although we identified a set of causal genes, the connections between these genes were unclear. Finally, the identified “candidates” of the causal factors were inferred by statistical models. Additional studies, such as experimental studies and randomized intervention trials, are needed to strengthen the evidence. How lipid metabolism-related genes connect to each other and how they affect CAD risk need to be tested in future studies.
Conclusion
In summary, this study elucidated the biological basis of genetic linkage and promoted the identification of susceptibility genes. The findings suggested that regulatory genetic variants in PSRC1 may affect CAD risk through altering CELSR2, PSRC1, and SORT1 gene expression in liver cells and circulating granulins and apolipoprotein B proteins, and moreover, the gene expression and circulating protein levels were genetically associated with LDL-C and CAD and may be novel risk factors for CAD. This study also provided evidence for exploring the potential causal relationship between granulins and apolipoprotein B and LDL-C and CAD. The findings may provide clues for seeking new therapeutic targets for dyslipidemia and CAD. Further experiments are needed to confirm the relationship and elucidate the mechanism.
Data Availability Statement
The datasets presented in this study can be found in online repositories. The names of the repository/repositories and accession number(s) can be found in the article/Supplementary Material.
Author Contributions
TC and ZW conducted statistical analysis and drafted the article. XY contributed to reviewing the article. ZQ and LC edited and revised the article. All authors contributed to manuscript revision, read, and approved the submitted version.
Funding
This work was supported by the National Natural Science Foundation of China (U2005202), the Fujian Province Major Science and Technology Program (2018YZ001-1), the Natural Science Foundation of Fujian Province (2020J01998 and 2020J02056), and the Fujian Provincial Health Technology Project (2019-ZQN-50).
Conflict of Interest
The authors declare that the research was conducted in the absence of any commercial or financial relationships that could be construed as a potential conflict of interest.
Publisher's Note
All claims expressed in this article are solely those of the authors and do not necessarily represent those of their affiliated organizations, or those of the publisher, the editors and the reviewers. Any product that may be evaluated in this article, or claim that may be made by its manufacturer, is not guaranteed or endorsed by the publisher.
Supplementary Material
The Supplementary Material for this article can be found online at: https://www.frontiersin.org/articles/10.3389/fcvm.2022.763015/full#supplementary-material
References
1. GBD_2017_Causes_of_Death_Collaborators. Global, regional, and national age-sex-specific mortality for 282 causes of death in 195 countries and territories, 1980-2017: a systematic analysis for the Global Burden of Disease Study 2017. Lancet. (2018) 392:1736–88. doi: 10.1016/S0140-6736(18)32203-7
2. De Ita JR, Castilla-Cortázar I, Aguirre GA, Sánchez-Yago C, Santos-Ruiz MO, Guerra-Menéndez L, et al. Altered liver expression of genes involved in lipid and glucose metabolism in mice with partial IGF-1 deficiency: an experimental approach to metabolic syndrome. J Transl Med. (2015) 13:326. doi: 10.1186/s12967-015-0684-9
3. Rong S, Cortés VA, Rashid S, Anderson NN, McDonald JG, Liang G, et al. Expression of SREBP-1c requires SREBP-2-mediated generation of a sterol ligand for LXR in livers of mice. Elife. (2017) 6:e25015. doi: 10.7554/eLife.25015
4. Horton JD, Goldstein JL, Brown MS. SREBPs: activators of the complete program of cholesterol and fatty acid synthesis in the liver. J Clin Invest. (2002) 109:1125–31. doi: 10.1172/JCI0215593
5. Berger JM, Moon YA. Increased hepatic lipogenesis elevates liver cholesterol content. Mol Cells. (2021) 44:116–25. doi: 10.14348/molcells.2021.2147
6. Lu X, Peloso GM, Liu DJ, Wu Y, Zhang H, Zhou W, et al. Exome chip meta-analysis identifies novel loci and East Asian-specific coding variants that contribute to lipid levels and coronary artery disease. Nat Genet. (2017) 49:1722–30. doi: 10.1038/ng.3978
7. Teslovich TM, Musunuru K, Smith AV, Edmondson AC, Stylianou IM, Koseki M, et al. Biological, clinical and population relevance of 95 loci for blood lipids. Nature. (2010) 466:707–13. doi: 10.1038/nature09270
8. Willer CJ, Schmidt EM, Sengupta S, Peloso GM, Gustafsson S, Kanoni S, et al. Discovery and refinement of loci associated with lipid levels. Nat Genet. (2013) 45:1274–83. doi: 10.1038/ng.2797
9. Deloukas P, Kanoni S, Willenborg C, Farrall M, Assimes TL, Thompson JR, et al. Large-scale association analysis identifies new risk loci for coronary artery disease. Nat Genet. (2013) 45:25–33. doi: 10.1038/ng.2480
10. Nikpay M, Goel A, Won HH, Hall LM, Willenborg C, Kanoni S, et al. A comprehensive 1,000 genomes-based genome-wide association meta-analysis of coronary artery disease. Nat Genet. (2015) 47:1121–30. doi: 10.1038/ng.3396
11. Visscher PM, Brown MA, McCarthy MI, Yang J. Five years of GWAS discovery. Am J Hum Genet. (2012) 90:7–24. doi: 10.1016/j.ajhg.2011.11.029
12. Suhre K, McCarthy MI, Schwenk JM. Genetics meets proteomics: perspectives for large population-based studies. Nat Rev Genet. (2021) 22:19–37. doi: 10.1038/s41576-020-0268-2
13. Schadt EE, Molony C, Chudin E, Hao K, Yang X, Lum PY, et al. Mapping the genetic architecture of gene expression in human liver. PLoS Biol. (2008) 6:e107. doi: 10.1371/journal.pbio.0060107
14. Gusev A, Ko A, Shi H, Bhatia G, Chung W, Penninx BW, et al. Integrative approaches for large-scale transcriptome-wide association studies. Nat Genet. (2016) 48:245–52. doi: 10.1038/ng.3506
15. Gamazon ER, Wheeler HE, Shah KP, Mozaffari SV, Aquino-Michaels K, Carroll RJ, et al. A gene-based association method for mapping traits using reference transcriptome data. Nat Genet. (2015) 47:1091–8. doi: 10.1038/ng.3367
16. Zhu Z, Zhang F, Hu H, Bakshi A, Robinson MR, Powell JE, et al. Integration of summary data from GWAS and eQTL studies predicts complex trait gene targets. Nat Genet. (2016) 48:481–7. doi: 10.1038/ng.3538
17. Battle A, Brown CD, Engelhardt BE, Montgomery SB. Genetic effects on gene expression across human tissues. Nature. (2017) 550:204–13. doi: 10.1038/nature24277
18. Suhre K, Arnold M, Bhagwat AM, Cotton RJ, Engelke R, Raffler J, et al. Connecting genetic risk to disease end points through the human blood plasma proteome. Nat Commun. (2017) 8:14357. doi: 10.1038/ncomms14357
19. Sun BB, Maranville JC, Peters JE, Stacey D, Staley JR, Blackshaw J, et al. Genomic atlas of the human plasma proteome. Nature. (2018) 558:73–9. doi: 10.1038/s41586-018-0175-2
20. Kettunen J, Demirkan A, Wurtz P, Draisma HH, Haller T, Rawal R, et al. Genome-wide study for circulating metabolites identifies 62 loci and reveals novel systemic effects of LPA. Nat Commun. (2016) 7:11122. doi: 10.1038/ncomms11122
21. Burgess S, Butterworth A, Thompson SG. Mendelian randomization analysis with multiple genetic variants using summarized data. Genet Epidemiol. (2013) 37:658–65. doi: 10.1002/gepi.21758
22. Bowden J, Davey Smith G, Burgess S. Mendelian randomization with invalid instruments: effect estimation and bias detection through Egger regression. Int J Epidemiol. (2015) 44:512–25. doi: 10.1093/ije/dyv080
23. Verbanck M, Chen CY, Neale B, Do R. Detection of widespread horizontal pleiotropy in causal relationships inferred from Mendelian randomization between complex traits and diseases. Nat Genet. (2018) 50:693–8. doi: 10.1038/s41588-018-0099-7
24. Morrison J, Knoblauch N, Marcus JH, Stephens M, He X. Mendelian randomization accounting for correlated and uncorrelated pleiotropic effects using genome-wide summary statistics. Nat Genet. (2020) 52:740–7. doi: 10.1038/s41588-020-0631-4
25. Yavorska OO, Burgess S. MendelianRandomization: an R package for performing Mendelian randomization analyses using summarized data. Int J Epidemiol. (2017) 46:1734–9. doi: 10.1093/ije/dyx034
26. Davey Smith G, Hemani G. Mendelian randomization: genetic anchors for causal inference in epidemiological studies. Hum Mol Genet. (2014) 23:R89–98. doi: 10.1093/hmg/ddu328
27. Smith GD, Ebrahim S. 'Mendelian randomization': can genetic epidemiology contribute to understanding environmental determinants of disease? Int J Epidemiol. (2003) 32:1–22. doi: 10.1093/ije/dyg070
28. Nguyen AD, Nguyen TA, Cenik B, Yu G, Herz J, Walther TC, et al. Secreted progranulin is a homodimer and is not a component of high density lipoproteins (HDL). J Biol Chem. (2013) 288:8627–35. doi: 10.1074/jbc.M112.441949
29. Okura H, Yamashita S, Ohama T, Saga A, Yamamoto-Kakuta A, Hamada Y, et al. HDL/apolipoprotein A-I binds to macrophage-derived progranulin and suppresses its conversion into proinflammatory granulins. J Atheroscler Thromb. (2010) 17:568–77. doi: 10.5551/jat.3921
30. Elovson J, Chatterton JE, Bell GT, Schumaker VN, Reuben MA, Puppione DL, et al. Plasma very low density lipoproteins contain a single molecule of apolipoprotein B. J Lipid Res. (1988) 29:1461–73. doi: 10.1016/S0022-2275(20)38425-X
31. Kissebah AH, Alfarsi S, Adams PW. Integrated regulation of very low density lipoprotein triglyceride and apolipoprotein-B kinetics in man: normolipemic subjects, familial hypertriglyceridemia and familial combined hyperlipidemia. Metabolism. (1981) 30:856–68. doi: 10.1016/0026-0495(81)90064-0
32. Sun H, Samarghandi A, Zhang N, Yao Z, Xiong M, Teng BB. Proprotein convertase subtilisin/kexin type 9 interacts with apolipoprotein B and prevents its intracellular degradation, irrespective of the low-density lipoprotein receptor. Arterioscler Thromb Vasc Biol. (2012) 32:1585–95. doi: 10.1161/ATVBAHA.112.250043
33. Tavori H, Fan D, Blakemore JL, Yancey PG, Ding L, Linton MF, et al. Serum proprotein convertase subtilisin/kexin type 9 and cell surface low-density lipoprotein receptor: evidence for a reciprocal regulation. Circulation. (2013) 127:2403–13. doi: 10.1161/CIRCULATIONAHA.113.001592
34. Levy E, Ben Djoudi Ouadda A, Spahis S, Sane AT, Garofalo C, Grenier E, et al. PCSK9 plays a significant role in cholesterol homeostasis and lipid transport in intestinal epithelial cells. Atherosclerosis. (2013) 227:297–306. doi: 10.1016/j.atherosclerosis.2013.01.023
Keywords: low-density lipoprotein cholesterol, coronary artery disease, genome-wide association study, Mendelian randomization (MR), apolipoprotein B (apo B)
Citation: Chai T, Wang Z, Yang X, Qiu Z and Chen L (2022) PSRC1 May Affect Coronary Artery Disease Risk by Altering CELSR2, PSRC1, and SORT1 Gene Expression and Circulating Granulin and Apolipoprotein B Protein Levels. Front. Cardiovasc. Med. 9:763015. doi: 10.3389/fcvm.2022.763015
Received: 16 September 2021; Accepted: 27 January 2022;
Published: 18 February 2022.
Edited by:
Alexander E. Berezin, Zaporizhia State Medical University, UkraineReviewed by:
Daniel Petrovič, University of Ljubljana, SloveniaHuan Zhang, Soochow University, China
Copyright © 2022 Chai, Wang, Yang, Qiu and Chen. This is an open-access article distributed under the terms of the Creative Commons Attribution License (CC BY). The use, distribution or reproduction in other forums is permitted, provided the original author(s) and the copyright owner(s) are credited and that the original publication in this journal is cited, in accordance with accepted academic practice. No use, distribution or reproduction is permitted which does not comply with these terms.
*Correspondence: Liangwan Chen, Y2hlbmxpYW5nd2FuQGZqbXUuZWR1LmNu
†These authors have contributed equally to this work