 Jiandong Zhou1†
 Oscar Hou In Chou2,3†
 Ka Hei Gabriel Wong2
 Sharen Lee2
 Keith Sai Kit Leung4
 Tong Liu5
 Bernard Man Yung Cheung3
 Ian Chi Kei Wong6,7Gary Tse2,8*
 Qingpeng Zhang9*
- 1Nuffield Department of Medicine, University of Oxford, Oxford, United Kingdom
- 2Frailty Assessment Unit, Cardiovascular Analytics Group, Hong Kong, Hong Kong SAR, China
- 3Division of Clincal Pharmacology, Department of Medicine, School of Clinical Medicine, Li Ka Shing Faculty of Medicine, University of Hong Kong, Hong Kong, Hong Kong SAR, China
- 4Aston Medical School, Aston University, Birmingham, United Kingdom
- 5Tianjin Key Laboratory of Ionic-Molecular Function of Cardiovascular Disease, Department of Cardiology, Tianjin Institute of Cardiology, Second Hospital of Tianjin Medical University, Tianjin, China
- 6Department of Pharmacology and Pharmacy, The University of Hong Kong, Hong Kong, Hong Kong SAR, China
- 7Medicines Optimisation Research and Education, UCL School of Pharmacy, London, United Kingdom
- 8Kent and Medway Medical School, Canterbury, United Kingdom
- 9School of Data Science, City University of Hong Kong, Hong Kong, Hong Kong SAR, China
Background: The long-term prognosis of the cardio-metabolic and renal complications, in addition to mortality in patients with newly diagnosed pulmonary hypertension, are unclear. This study aims to develop a scalable predictive model in the form of an electronic frailty index (eFI) to predict different adverse outcomes.
Methods: This was a population-based cohort study of patients diagnosed with pulmonary hypertension between January 1st, 2000 and December 31st, 2017, in Hong Kong public hospitals. The primary outcomes were mortality, cardiovascular complications, renal diseases, and diabetes mellitus. The univariable and multivariable Cox regression analyses were applied to identify the significant risk factors, which were fed into the non-parametric random survival forest (RSF) model to develop an eFI.
Results: A total of 2,560 patients with a mean age of 63.4 years old (interquartile range: 38.0–79.0) were included. Over a follow-up, 1,347 died and 1,878, 437, and 684 patients developed cardiovascular complications, diabetes mellitus, and renal disease, respectively. The RSF-model-identified age, average readmission, anti-hypertensive drugs, cumulative length of stay, and total bilirubin were among the most important risk factors for predicting mortality. Pair-wise interactions of factors including diagnosis age, average readmission interval, and cumulative hospital stay were also crucial for the mortality prediction. Patients who developed all-cause mortality had higher values of the eFI compared to those who survived (P < 0.0001). An eFI ≥ 9.5 was associated with increased risks of mortality [hazard ratio (HR): 1.90; 95% confidence interval [CI]: 1.70–2.12; P < 0.0001]. The cumulative hazards were higher among patients who were 65 years old or above with eFI ≥ 9.5. Using the same cut-off point, the eFI predicted a long-term mortality over 10 years (HR: 1.71; 95% CI: 1.53–1.90; P < 0.0001). Compared to the multivariable Cox regression, the precision, recall, area under the curve (AUC), and C-index were significantly higher for RSF in the prediction of outcomes.
Conclusion: The RSF models identified the novel risk factors and interactions for the development of complications and mortality. The eFI constructed by RSF accurately predicts the complications and mortality of patients with pulmonary hypertension, especially among the elderly.
Introduction
Pulmonary hypertension (PHTN) was defined in the First World Symposium on Pulmonary Hypertension as having a mean pulmonary arterial pressure >25 mmHg at resting by right heart catheterization (1, 2). PHTN was traditionally classified as either primary or secondary PHTN (3). The epidemiology and prognosis of the PHTN vary with different causes, but generally, PHTN can progress to a severe stage and ultimately cause death if left untreated (4). Therefore, it is essential to evaluate the prognosis of patients with PHTN as early as possible. Nevertheless, the prognostic risk factors to predict the risks of complication development and mortality are unclear.
Currently, the PHTN mortality is predicted using the dynamic risk stratification strategy suggested in the European Society of Cardiology/European Respiratory Society pulmonary hypertension guidelines. The strategy utilizes the clinical features and laboratory results to predict the mortalities and stratify the risk of death according to the one-year mortality expectations (5, 6). However, the model requires extensive clinical investigations, such as echocardiography and cardiopulmonary exercise testing (7). Calculating the risks of death by simply using the demographics and the laboratory testing results allows the determination of the treatment objectives to be more readily accessible.
PHTN can result in serious complications involving the cardiovascular, renal, and metabolic systems (8). Conversely, patients with pre-existing comorbidities have a poorer prognosis (9, 10). For example, acute right heart failure is one of the most important causes of mortality among patients with PHTN (11). PHTN can also co-exist with chronic renal disease owing to altered fibroblast growth factor-23 signaling (12, 13). The presence of diabetes mellitus can induce pulmonary endothelial dysfunction, and patients with PHTN may also develop diabetes mellitus and metabolic syndrome as complications due to the chronic pro-inflammatory states (14, 15). The concurrence of the above conditions increases the complexity of the PHTN clinical profile.
Frailty is a geriatric syndrome that results in age-associated functional limitations across multiple systems. Older people with frailty are prone to poorer health outcomes such as falls and disability. This contributes to frequent hospitalization and premature death (16–19). The development of an electronic frailty index (eFI) through the random survival forest (RSF) model allows the analysis of the survival data using electronic health data (20). RSF can approximate complex survival functions while maintaining low prediction error (21). This study aims to construct a scalable eFI with improved predictability for complications and short-term mortality among patients with PHTN through the application of the RSF model.
Methods
Study Design and Population
The retrospective population-based cohort was designed to investigate long-term clinical prognostic risk factors that predict the survival of patients with newly diagnosed PHTN. This cohort included patients diagnosed with PHTN between January 1st, 2000 and December 31st, 2017 at centers managed by the Hong Kong Hospital Authority. The patients were identified from the Clinical Data Analysis and Reporting System (CDARS), a territory-wide database that centralizes patient information from individual local hospitals to establish comprehensive medical data. This system has previously been used by local teams to conduct population-based epidemiological studies (22, 23), including the development of eFIs (24, 25).
Demographics, comorbidities, hospitalization characteristics, drug prescriptions, and laboratory examinations at the baseline were extracted. Drug prescriptions following the diagnosis of PHTN were determined. The calculated mean daily prescribed drug dosage of medications was noted. The mean daily dose of each drug class is derived from multiplying the daily dose frequency by the drug dose then averaged by the cumulative duration. Details regarding the International Classification of Diseases, Nineth Edition (ICD-9) codes for identifying the comorbidities and PHTN drugs are provided (Supplementary Tables 1, 2).
Statistical Analysis
The study outcomes were the development of cardiovascular and renal complications, diabetes mellitus, and mortality after diagnosing PHTN. The mortality data were obtained from the Hong Kong Death Registry, a population-based official government registry with the registered death records of all Hong Kong citizens. Continuous variables were represented as median (95% confidence interval [CI] or interquartile range [IQR]), and categorical variables were presented count (%). Continuous variables were compared using the Mann-Whitney U test. The χ2 test with Yates' correction was utilized for 2 × 2 contingency data. The Pearson's χ2 test was applied for variables with over two categories of contingency data.
The univariable Cox model was used to uncover the significant prognostic risk factors associated with the outcomes via adjustments based on baseline characteristics. Significantly predictive factors are used as input of the multivariable Cox regression and the RSF analysis model for the complication prediction. Hazard ratios (HRs) with corresponding 95% CIs and P-values were reported. All significance tests were two tailed and considered significant if P < 0.05. Data analyses were performed using the RStudio software (Version: 1.1.456) and Python (Version: 3.6).
Development of a Tree-Based Mortality Prediction Model
The eFI was developed to use the primary electronic health record to predict the frailty status of the patients, based on the principle that it reflects the health deficit accumulation (26, 27). Our team has previously developed an eFI for heart failure (24). A survival analysis was utilized to estimate the probability of mortality after diagnosing PHTN. It identifies the most influential prognostic risk factors that efficiently predict mortality outcomes. The RSF model was used to conduct a supervised survival learning analysis with the electronic health data. We used 20% of the data as a test set for a model performance evaluation and comparisons while using the remaining 80% for a model training. The parameters that gave the highest value of the Concordance Index (C-index) on the test set were chosen as the final model. The RSF was employed to learn the distribution of survival times based on the observed preoperative symptom data.
Variable Importance Measure
The variable importance value of each factor was calculated to investigate the predictive strength. We leave out about 40% of instances whenever a bootstrap sample is down with replacement from the training data set. These left-out instances are referred to as out-of-bag (OOB) ones and the instances in the bootstrap sample as in bag ones. To calculate the variable importance value, we dropped each OOB instance down its in-bag competing risk tree and assigned a child node randomly whenever a split for the variable is encountered. The event-specific cumulative probability function from each such tree is calculated and averaged. The importance value is the prediction error for the original ensemble event-specific cumulative probability function (obtained when each OOB instance is dropped down its in-bag competing risks tree) subtracted from the prediction error for the new ensemble obtained using randomizing assignments of the variable (28, 29). The prediction errors are computed using squared loss. A higher importance value indicates higher predictive strength of the variable, whereas zero or negative values indicate non-predictive variables.
Minimal Depth Approach
Minimal depth (30) ranks the variables through the inspection of the forest construction process under the assumption that variables with high impact on the prediction are those that most frequently split nodes nearest to the root node, where they partition the largest samples. Within each split tree, minimal depth approaches numbers of node levels according to their relative distance to the root of the tree (with the root node at 0). In such a way, the minimal depth approach can identify important variables by averaging the depth of the first split for each variable over all trees within the final forest.
The minimal depth approach was used to capture the variable interactions. We calculate the importance measures of pairwise interactions among variables since the minimal depth measure is defined by averaging the tree depth of the variable of interest relative to the root node. To compute the interaction strength for prediction, this calculation is modified to measure the minimal depth of a variable xi with respect to the maximal subtree for variable xj.
In general, to select the most influential variables with a variable importance approach, we examine the calculated variable importance values. The minimal depth approach is a non-event-specific criterion, whereas the variable importance approach can be both event specific and non-event specific. In the following analysis, we used the mortality-specific and time-to-event-specific variable importance.
Performance Evaluation
The 5-fold cross validation approach is adopted to evaluate the prediction performance of the RSF model. The metrics of precision and recall are as follows:
and the area under the receiver operating characteristic curve (AUC) and the C index are used for performance evaluation. TN, TP, FP, and FN represent true positive, true negative, false positive, and false negative rates in the confusion matrix, respectively. Conventional non-parametric survival models primarily select the best analysis model that maximizes the C index (31). C index quantifies the degree to which the predicted outcomes in the pairwise orderings are consistent with the observed outcomes and can be regarded as a generalization of the AUC. That is, any survival analysis model that properly estimates the ordered but proportional event times can score high in terms of C index. C index can be used as a global assessment of the model's discrimination power: the ability to correctly provide a reliable ranking of the survival times based on the individual risk scores. In this study, we compare the RSF model with the traditional Cox analysis to predict the mortality and complications after diagnosis of PHTN.
Results
Basic Characteristics
The study cohort included 2,560 patients (37% men) with an age of 63.4 (IQR: 38.0–79.0) (Figure 1). The baseline characteristics of the PHTN patients are detailed in Tables 1, 2. Over the follow-up, 38% of patients died; those who died were older (median: 75.2, IQR: 60.0–83.0) than those who survived (median: 44.6, IQR: 1.0–65.0).
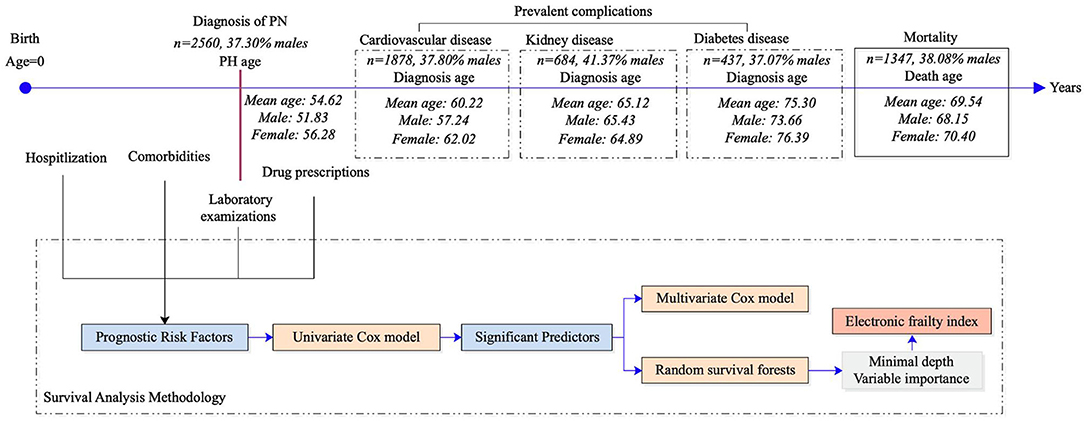
Figure 1. Illustration of the study procedures. PN, Pulmonary hypertension.
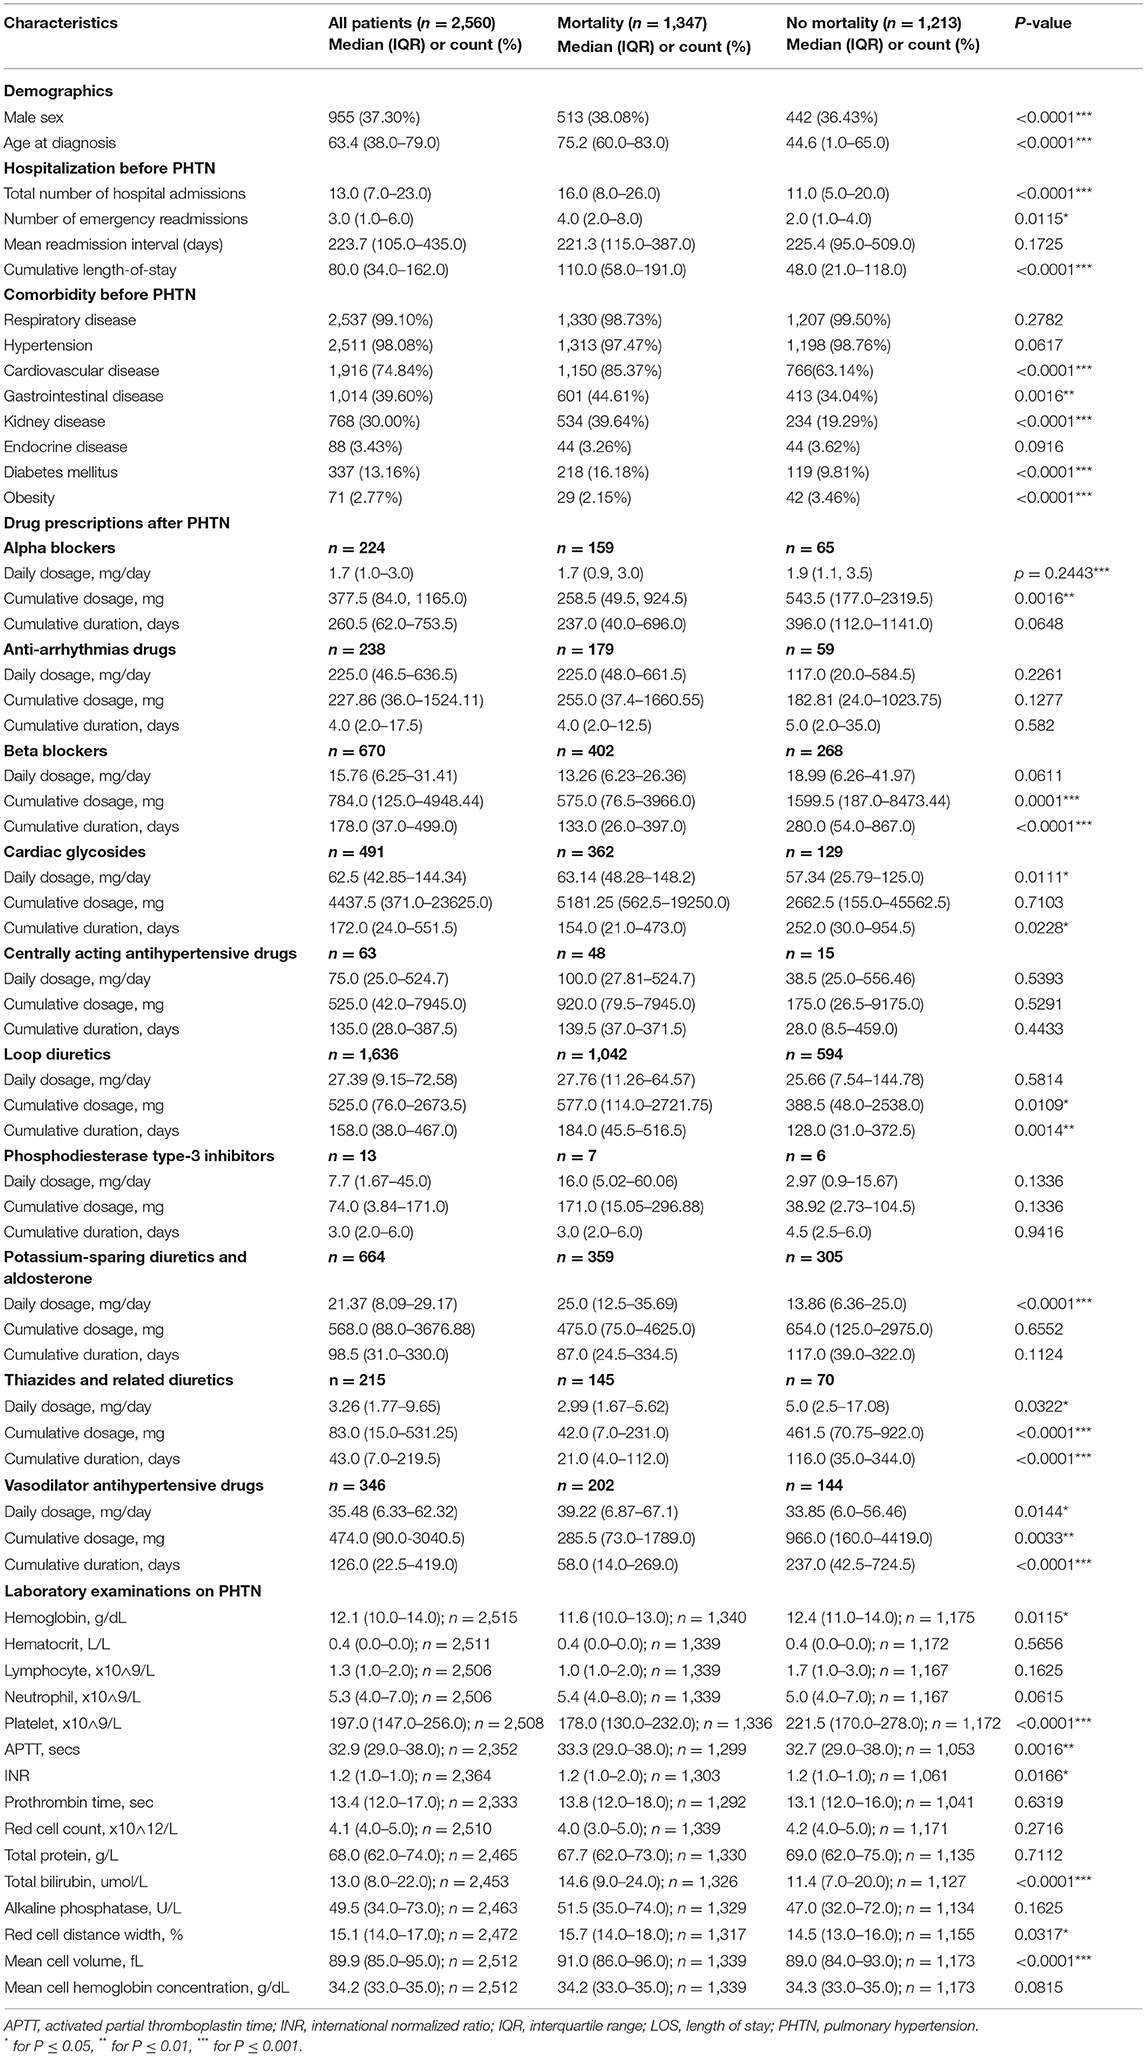
Table 1. The characteristics of patients with pulmonary hypertension stratified by mortality outcomes.
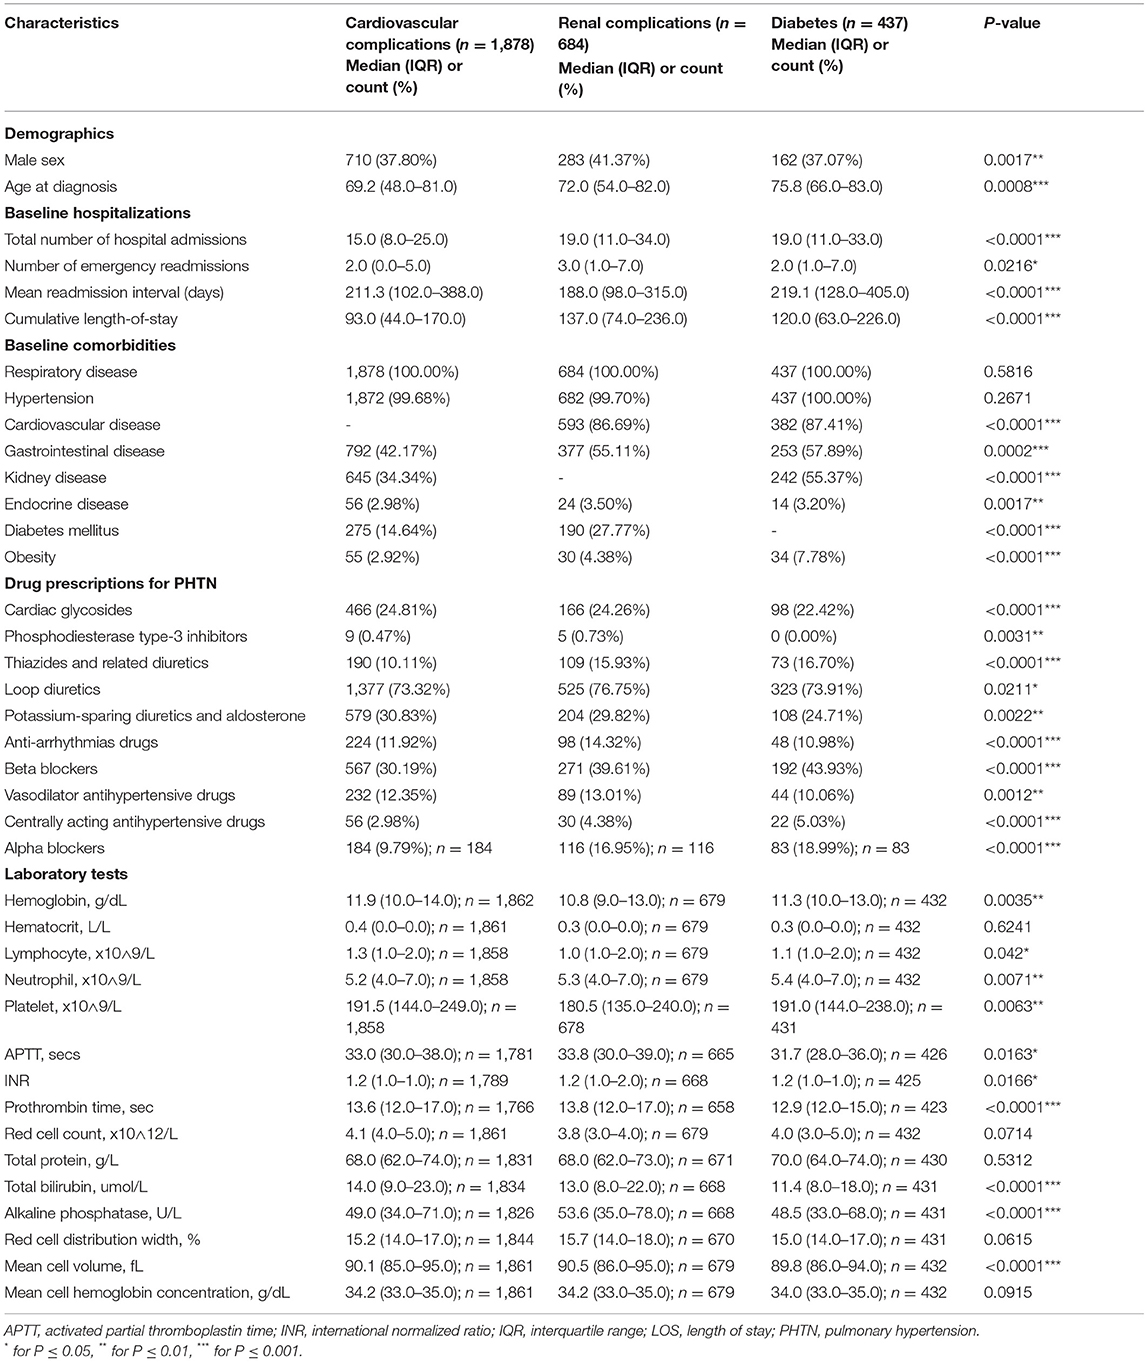
Table 2. The characteristics of patients who developed complications after the diagnosis of pulmonary hypertension.
The Risk of Adverse Outcomes With Cox Analysis
A univariable Cox regression analysis identified the predictors of mortality after the diagnosis of PHTN (Supplementary Table 3). Patients with past comorbidities, such as cardiovascular diseases (HR: 1.947, 95% CI: 0.8132–2.102), respiratory diseases (HR: 1.295, 95% CI: 0.646–2.595), endocrine disease (HR: 1.524, 95% CI: 1.127–2.059), and hypertension (HR: 1.362, 95% CI: 1.172–2.7618) were associated with higher mortality risks. The univariable Cox regression analysis also identified the predictors for the complications (Supplementary Table 4). The diagnosis age was an important predictor (all P < 0.0001). The multivariable Cox regression predictors of mortality were also identified (Supplementary Table 5A). The age of diagnosis (HR: 1.822; 95% CI: 1.815–1.829), cumulative hospital length of stay (LOS) (HR: 1.0007; 95% CI: 1.00040–1.0009), prior cardiovascular diseases (HR: 1.266; 95% CI: 1.064–1.507), kidney diseases (HR: 1.279; 95% CI: 1.125–1.454), diabetes mellitus (HR: 1.208; 95% CI: 1.032–1.415), and hypertension (HR: 1.549; 95% CI: 0.665–3.608) were predictive of mortality. The Kaplan-Meier survival curves demonstrated the mortality of the patients in Figure 2A.
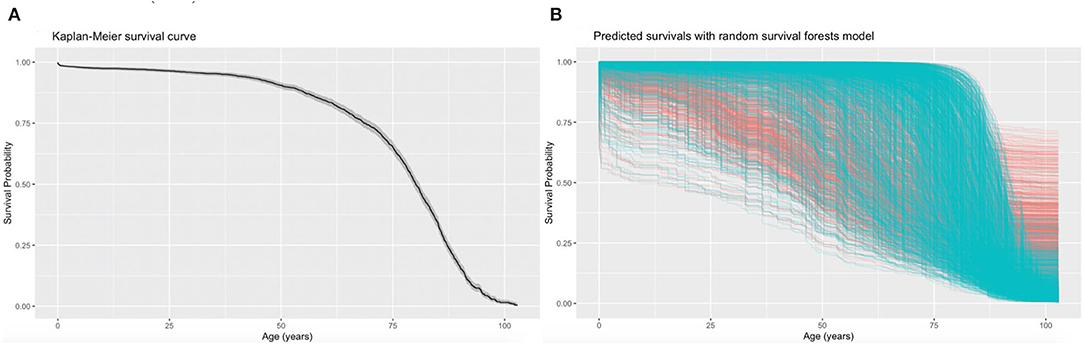
Figure 2. Kaplan-Meier curves for all-cause mortality and the predicted mortality. The Kaplan-Meier survival curves demonstrate the moralities of the patients with pulmonary hypertension (PHTN) (A) and the predicted mortalities using the random survival forest (RSF) prediction (B). Each line represents a single patient in the training data set, where censored patients are colored blue, and patients who have experienced the mortality event are colored in red. The median survival (black) with a 95% shaded confidence band (gray) are indicated.
Machine Learning Survival Analysis
The RSF model identified the influential prognostic risk factors by capturing the non-linearity and interactions. The predicted events for all-cause mortality with the RSF model are shown in Figure 2B. Most deaths occurred at age equal or above 75. The predictions for the time to event of the complications are shown in Figure 3. The RSF provided better discrimination performance in predicting the mortality risk, given its ability to capture the non-linearity and the interaction patterns (Supplementary Figures 4–7).
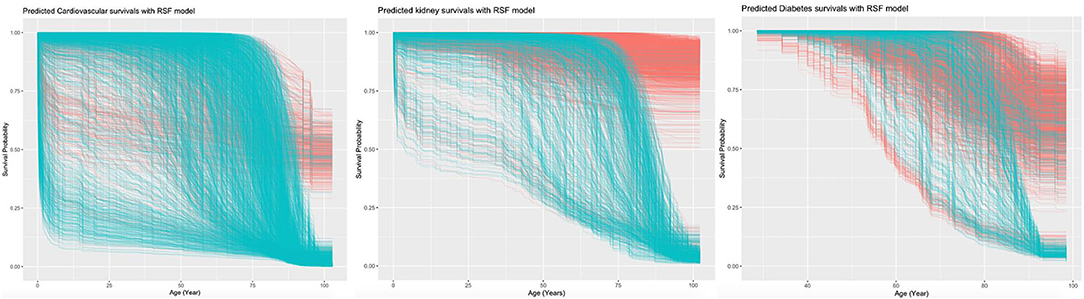
Figure 3. Predicted survivals of cardiovascular, kidney, and diabetes complications with RSF model.
Age was the most important for the mortality risk prediction, followed by average readmission, antihypertension drugs, cumulative LOS, and total bilirubin level (Supplementary Figure 8). The risk factors that predicted the three complications were also identified. Age was the most important predictor for cardiovascular complications, followed by lymphocyte count and mean readmission interval. Age also showed the highest prediction strength for kidney and diabetic complications.
Important interactions with the demographics included the interactions of PHTN age and sex with average readmission interval, cumulative hospital stay, and total bilirubin level (Supplementary Figure 4). The interactions of the variables with past comorbidities (Supplementary Figure 5), drug prescriptions (Supplementary Figure 6), and laboratory examinations (Supplementary Figure 7) were also derived. An interaction importance ranking pattern could be observed: interactions formed by a variable with the influential individual risk factors demonstrated high predictive strength.
Predictors of Adverse Events Risk With eFI
Correspondingly, an eFI was developed for predicting the all-cause mortality (Supplementary Table 5B). The calculated eFI for patients with/without mortality was significantly different (median: 9.0, IQR: 8.0–10.0 vs. median: 8.0, IQR: 6.0–9.0, P < 0.0001) (Table 3A, Supplementary Figure 9). The eFI was significantly associated with higher mortality risk (HR: 1.25, 95% CI: 1.22–1.29, P < 0.0001) (Table 3B). The marginal effects of eFI also demonstrated that higher eFI was associated with higher risks of mortality (Supplementary Figure 10).
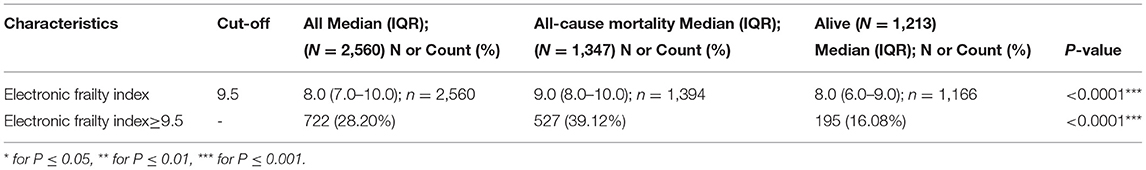
Table 3A. Descriptive statistics of electronic frailty index for all-cause mortality risk prediction.
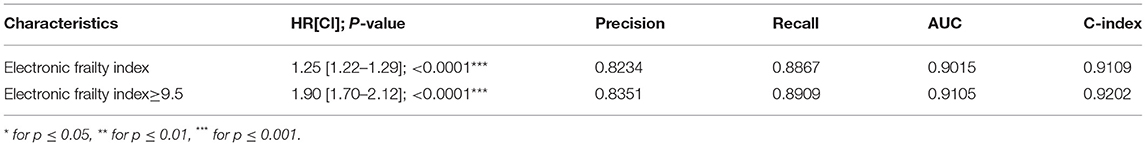
Table 3B. Prediction strength of electronic frailty index for all-cause mortality risk prediction.
The binarized eFI also predicted mortality risk based on the Youden cut-off of 9.5 (HR: 1.90, 95% CI: 1.70–2.12, P < 0.0001) (Table 3B). Patients with eFI > 9.5 had a higher cumulative hazard for all-cause mortality. The cumulative hazards were especially higher among patients who were 65 years old or above with eFI ≥ 9.5 (Figure 4). Within 2 years of follow-up, the eFI predicted the mortality (HR: 1.15, 95% CI: 1.02–1.28; P = 0.0169). The HR of the eFI increased with a longer duration of follow-up. Upon 10 years of follow-up, the eFI was associated with higher risks of mortality (HR: 1.71, 95% CI: 1.53–1.90; P < 0.0001); meanwhile, upon 20 years of follow-up, the HR was even higher (HR: 1.90; 95% CI: 1.70–2.12; P < 0.0001) (Table 3C).
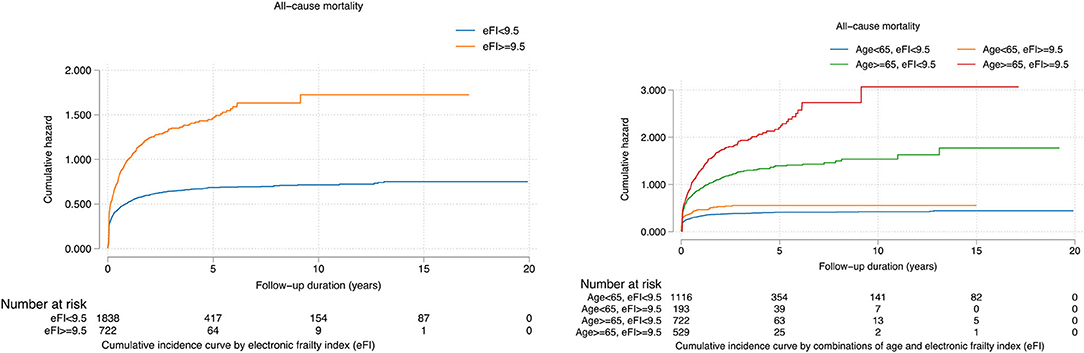
Figure 4. Cumulative incidence curves for all-cause mortality stratified by the constructed electronic frailty index and age.
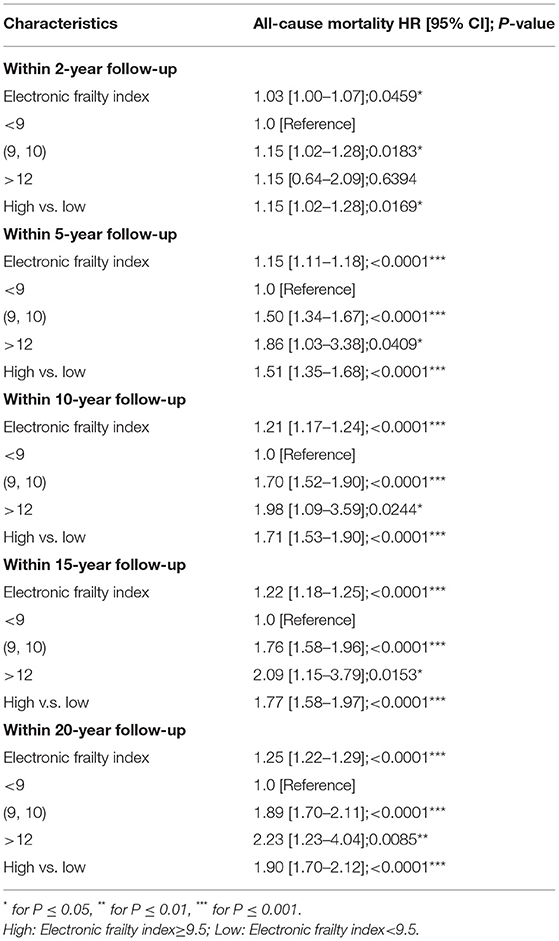
Table 3C. Prediction strength of the constructed electronic frailty index for mortality risks within 2-year follow-up, 5-year follow-up, 10-year follow-up, 15-year follow-up, and 20-year follow-up.
The RSF model showed a better performance in terms of precision (0.9263 vs. 0.8382), recall (0.9058 vs. 0.8992), AUC (0.9478 vs. 0.9051), and C index (0.9361 vs. 0.9240) compared to the Cox model in the 5-fold cross-validation. Similarly, compared to multivariate Cox regression, the precision, recall, AUC, and C index were significantly higher for RSF in predicting the cardiovascular, kidney, diabetic complications, and mortality (Table 4).
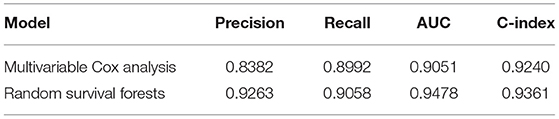
Table 4A. Performance comparisons between multivariable and random survival forest with five-fold cross validation.
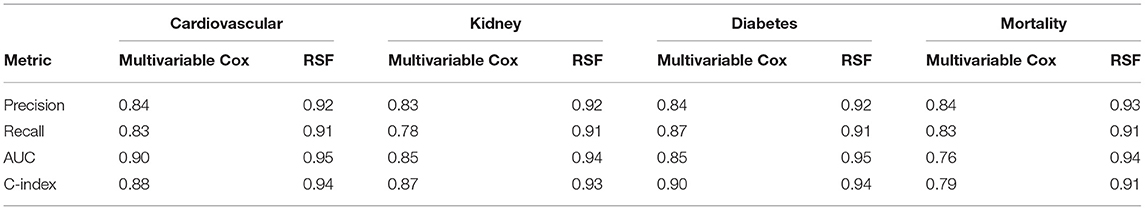
Table 4B. Performance comparisons between multivariable Cox and random survival forest with five-fold cross validation.
Discussion
The Principal Findings of the Study
The main findings of this study include (i) risk factors including admission interval, cumulative LOS, and total admissions times were predictive of the complications and mortality; (ii) the RSF-identified non-linear relationship between the predictors and outcome was predictive of mortality; (iii) the RSF model performed better in mortality and complication predictions than the Cox regression; (iv) the eFI predicted the risks of all-cause mortality accurately, especially among patients who were 65 years old or above.
Strength and Limitations of the Study
To the best of our knowledge, this is the first study using the eFI in predicting the PHTN outcomes. The usage of the cohort from a real-world clinical database to derive the RSF analysis was shown to have performed better than the multivariable logistic regression to predict the PHTN mortality and complications. This would allow better clinical management based on the eFI. However, there are certain limitations to this study. Firstly, given this is a local study conducted in Hong Kong, the PHTN results should be validated using the data from other databases in other countries. Secondly, medical history, such as smoking, asbestos, and family history, and clinical parameters such as partial pressure of oxygen (PaO2) and N-terminal pro-brain natriuretic peptide (NT-proBNP), which are associated with PHTN in other literature, were not included in this predictive model given the lack of the codes in CDARS (32). Thirdly, given the retrospective nature of this study, the results may be subjected to instabilities of the laboratory results, including the equipment modifications and blood samples artifacts, and changes in the clinical criteria for the diagnosis of the PHTN. Furthermore, clinical information suggested in the European PHTN guidelines, such as the clinical courses and syncope episodes, is also lacking. Furthermore, in our predictive model, the number of patients on centrally acting antihypertensive drugs and phosphodiesterase type-3 inhibitors was relatively small. Lastly, due to the lack of the relevant diagnostic codes, the PHTN cases were not classified according to the World Health Organization (WHO) PHTN classification (2). Nevertheless, frailty models with the lack of enlisted information are still strong predictors of mortality and mortality (33).
Comparing the Findings With the Other Studies
Our data presented different risk factors that contributed to the development of the PHTN complications. Older patients and male patients showed a higher mortality risk. Patients with a higher comorbidity burden, including cardiovascular, hypertension, and renal conditions, had a lower survival rate and were more likely to develop complications (34). The variable importance and minimal depth approach indicated that the age of PHTN diagnosis had the highest predictive strength. This is in accordance with the previous predictive model (REVEAL), indicating that old male patients would have a worse prognosis, even though PHTN is a predominantly female disorder. This is worrying given the average age of patients diagnosed is shifting toward an older population (35). In agreement with previous studies, the hospitalization characteristics and drugs are also associated with the survival outcome in a pattern (36, 37). Compared to other predictive models, our study does not involve the use of the hemodynamic data nor lung function and radiological test results (38). However, our study demonstrated a higher AUC compared to the previous studies (39, 40). Nevertheless, the PHTN diagnosis in our study was not classified according to the WHO classification owing to the lack of the CDARS code.
Our results demonstrated that eFI significantly predicts the risks of complications and mortality among elderlies. Compare to the traditional Cox models, prediction models based on RSF have improved prediction performance across diseases such as heart failure (41), Brugada syndrome (42), congenital (43, 44) and acquired (45) long QT syndromes, diabetes mellitus (46, 47), metabolic diseases (48), stroke (49), and cancer (50). It improved the risk prediction in the context of PHTN for disease onset (51) and pressure prediction based on echocardiographic parameters (52). However, few studies have examined the long-term prognosis of patients with PHTN. In our study, the RSF model had a higher predictive accuracy with 5-fold cross-validation than the Cox model since it does not have a strong assumption about individual proportional hazard functions. Furthermore, the model can capture the interactions, reducing the prediction variances and bias (20, 53). The interactions formed by a variable with the influential individual risk factors demonstrated a high predictive strength.
The Implications for the Clinicians and Future Research Directions
The eFI derived from the significant variables allows predicting the risks of mortality and complications of the patients with PHTN, especially among elderlies. Clinicians can make use of the electronic medical records to estimate the outcome of the patients with PHTN without using any hemodynamic and radiological investigation modalities. The eFI can be further translated into a risk diagnosis tool to be deployed in the computer for real-time clinical applications.
Conclusion
The RSF model identified the influential prognostic risk factors and their interaction from the clinical accessible data. The usage of this RSF-derived eFI would allow stratifying the risks of complication and mortality and optimizing the PHTN management among elderlies.
Data Availability Statement
The original contributions presented in the study are included in the article/Supplementary Material, further inquiries can be directed to the corresponding author/s.
Ethics Statement
The studies involving human participants were reviewed and approved by NTEC-CUHK, Hong Kong. The Ethics Committee waived the requirement of written informed consent for participation.
Author Contributions
OC, JZ, and SL: data analysis, data interpretation, statistical analysis, manuscript drafting, and critical revision of manuscript. KW, KL, IW, TL, and BC: project planning, data acquisition, data interpretation, and critical revision of manuscript. QZ and GT: study conception, study supervision, project planning, data interpretation, statistical analysis, manuscript drafting, and critical revision of manuscript. All authors contributed to the article and approved the submitted version.
Funding
QZ acknowledges the National Key Research and Development Program of China, Ministry of Science and Technology of China: 2019YFE0198600; National Natural Science Foundation of China (NSFC): 71972164 and 72042018; Health and Medical Research Fund of the Food and Health Bureau of Hong Kong: 16171991; Innovation and Technology Fund of Innovation and Technology Commission of Hong Kong: MHP/081/19.
Conflict of Interest
The authors declare that the research was conducted in the absence of any commercial or financial relationships that could be construed as a potential conflict of interest.
Publisher's Note
All claims expressed in this article are solely those of the authors and do not necessarily represent those of their affiliated organizations, or those of the publisher, the editors and the reviewers. Any product that may be evaluated in this article, or claim that may be made by its manufacturer, is not guaranteed or endorsed by the publisher.
Supplementary Material
The Supplementary Material for this article can be found online at: https://www.frontiersin.org/articles/10.3389/fcvm.2022.735906/full#supplementary-material
References
1. Hatano S, Strasser T, World Health Organization. Primary Pulmonary Hypertension: Report on a WHO Meeting, Geneva. Hatano S, Strasser T, editors. Geneva: World Health Organization (1975).
2. Simonneau G, Montani D, Celermajer DS, Denton CP, Gatzoulis MA, Krowka M, et al. Haemodynamic definitions and updated clinical classification of pulmonary hypertension. Eur Respir J. (2019) 53:1801913. doi: 10.1183/13993003.01913-2018
3. Simonneau G, Galiè N, Rubin LJ, Langleben D, Seeger W, Domenighetti G, et al. Clinical classification of pulmonary hypertension. J Am Coll Cardiol. (2004) 43(12 Suppl):S5–12. doi: 10.1016/j.jacc.2004.02.037
4. Corciova FC, Arsenescu-Georgescu C. Prognostic factors in pulmonary hypertension. Maedica. (2012) 7:30–7. Available online at: https://www.maedica.ro/articles/2012/1/2012_Vol7(10)_No1_pg30-37.pdf
5. Galie N, Humbert M, Vachiery JL, Gibbs S, Lang I, Torbicki A, et al. 2015 ESC/ERS guidelines for the diagnosis and treatment of pulmonary hypertension: the joint task force for the diagnosis and treatment of pulmonary hypertension of the european society of cardiology (ESC) and the european respiratory society (ERS): endorsed by: association for european paediatric and congenital cardiology (AEPC), international society for heart and lung transplantation (ISHLT). Eur Heart J. (2016) 37:67–119. doi: 10.1093/eurheartj/ehv317
6. Galie N, Humbert M, Vachiery JL, Gibbs S, Lang I, Torbicki A, et al. 2015 ESC/ERS guidelines for the diagnosis and treatment of pulmonary hypertension: the joint task force for the diagnosis and treatment of pulmonary hypertension of the european society of cardiology (ESC) and the european respiratory society (ERS): endorsed by: association for european paediatric and congenital cardiology (AEPC), international society for heart and lung transplantation (ISHLT). Eur Respir J. (2015) 46:903–75. doi: 10.1183/13993003.01032-2015
7. Hoeper MM, Kramer T, Pan Z, Eichstaedt CA, Spiesshoefer J, Benjamin N, et al. Mortality in pulmonary arterial hypertension: prediction by the 2015 European pulmonary hypertension guidelines risk stratification model. Eur Respir J. (2017) 50:1700740. doi: 10.1183/13993003.00740-2017
8. Mak SM, Strickland N, Gopalan D. Complications of pulmonary hypertension: a pictorial review. Br J Radiol. (2017) 90:20160745. doi: 10.1259/bjr.20160745
9. Lang IM, Palazzini M. The burden of comorbidities in pulmonary arterial hypertension. Eur Heart J Suppl. (2019) 21(Suppl. K):K21–8. doi: 10.1093/eurheartj/suz205
10. Parvathy U, Rajan R, Faybushevich A, Zhanna K. Pulmonary dysfunction: a predictor of postoperative outcome in severe mitral stenosis. Ann Clin Cardiol. (2020) 2:60–9. doi: 10.4103/ACCJ.ACCJ_11_19
11. Sztrymf B, Souza R, Bertoletti L, Jais X, Sitbon O, Price LC, et al. Prognostic factors of acute heart failure in patients with pulmonary arterial hypertension. Eur Respir J. (2010) 35:1286–93. doi: 10.1183/09031936.00070209
12. Haase M, Kellum JA, Ronco C. Subclinical AKI–an emerging syndrome with important consequences. Nat Rev Nephrol. (2012) 8:735–9. doi: 10.1038/nrneph.2012.197
13. Bitker L, Sens F, Payet C, Turquier S, Duclos A, Cottin V, et al. Presence of kidney disease as an outcome predictor in patients with pulmonary arterial hypertension. Am J Nephrol. (2018) 47:134–43. doi: 10.1159/000487198
14. Rosenkranz S, Howard LS, Gomberg-Maitland M, Hoeper MM. Systemic Consequences of pulmonary hypertension and right-sided heart failure. Circulation. (2020) 141:678–93. doi: 10.1161/CIRCULATIONAHA.116.022362
15. Grinnan D, Farr G, Fox A, Sweeney L. The role of hyperglycemia and insulin resistance in the development and progression of pulmonary arterial hypertension. J Diabetes Res. (2016) 2016:2481659. doi: 10.1155/2016/2481659
16. Xue QL. The frailty syndrome: definition and natural history. Clin Geriatr Med. (2011) 27:1–15. doi: 10.1016/j.cger.2010.08.009
17. Zhang Y, Yuan M, Gong M, Li G, Liu T, Tse G. Associations between prefrailty or frailty components and clinical outcomes in heart failure: a follow-up meta-analysis. J Am Med Dir Assoc. (2019) 20:509–10. doi: 10.1016/j.jamda.2018.10.029
18. Zhang Y, Yuan M, Gong M, Tse G, Li G, Liu T. Frailty and clinical outcomes in heart failure: a systematic review and meta-analysis. J Am Med Dir Assoc. (2018). 19:1003–8.e1. doi: 10.1016/j.jamda.2018.06.009
19. Tse G, Gong M, Nunez J, Sanchis J, Li G, Ali-Hasan-Al-Saegh S, et al. Frailty and mortality outcomes after percutaneous coronary intervention: a systematic review and meta-analysis. J Am Med Dir Assoc. (2017) 18:1097.e1–10. doi: 10.1016/j.jamda.2017.09.002
20. Ishwaran H, Kogalur UB, Blackstone EH, Lauer MS. Random survival forests. Ann Appl Stat. (2008) 2:841–60. doi: 10.1214/08-AOAS169
21. Ishwaran H, Kogalur UB. Consistency of random survival forests. Stat Probab Lett. (2010) 80:1056–64. doi: 10.1016/j.spl.2010.02.020
22. Chou OHI, Zhou J, Lee TTL, Kot T, Lee S, Wai AKC, et al. Comparisons of the risk of myopericarditis between COVID-19 patients and individuals receiving COVID-19 vaccines: a population-based study. Clin Res Cardiol. (2022). doi: 10.1007/s00392-022-02007-0. [Epub ahead of print].
23. Zhou J, Zhang G, Chang C, Chou OHI, Lee S, Leung KSK, et al. Metformin versus sulphonylureas for new onset atrial fibrillation and stroke in type 2 diabetes mellitus: a population-based study. Acta Diabetol. (2022) 59:697–709. doi: 10.1007/s00592-021-01841-4
24. Ju C, Zhou J, Lee S, Tan MS, Liu T, Bazoukis G, et al. Derivation of an electronic frailty index for predicting short-term mortality in heart failure: a machine learning approach. ESC Heart Fail. (2021) 8:2837–45. doi: 10.1002/ehf2.13358
25. Chen Y, Zhou J, Lee S, Liu T, Hothi SS, Wong ICK, et al. Development of an electronic frailty index for predicting mortality in patients undergoing transcatheter aortic valve replacement using machine learning. medRxiv. (2020). doi: 10.1101/2020.12.23.20248770
26. Mitnitski AB, Mogilner AJ, Rockwood K. Accumulation of deficits as a proxy measure of aging. Sci. World J. (2001) 1:323–36. doi: 10.1100/tsw.2001.58
27. Clegg A, Bates C, Young J, Ryan R, Nichols L, Ann Teale E, et al. Development and validation of an electronic frailty index using routine primary care electronic health record data. Age Ageing. (2016) 45:353–60. doi: 10.1093/ageing/afw039
29. Ishwaran H. Variable importance in binary regression trees and forests. Electron J Stat. (2007) 1:519–37. doi: 10.1214/07-EJS039
30. Ishwaran H, Kogalur UB, Gorodeski EZ, Minn AJ, Lauer MS. High-dimensional variable selection for survival data. J Am Stat Assoc. (2010) 105:205–17. doi: 10.1198/jasa.2009.tm08622
31. Koziol JA, Jia Z. The concordance index C and the mann–whitney parameter Pr(X>Y) with randomly censored data. Biom J. (2009) 51 467–74. doi: 10.1002/bimj.200800228
32. Chen Y, Liu C, Lu W, Li M, Hadadi C, Wang EW, et al. Clinical characteristics and risk factors of pulmonary hypertension associated with chronic respiratory diseases: a retrospective study. J Thorac Dis. (2016) 8:350–8. doi: 10.21037/jtd.2016.02.58
33. Kojima G, Iliffe S, Walters K. Frailty index as a predictor of mortality: a systematic review and meta-analysis. Age Ageing. (2018) 47:193–200. doi: 10.1093/ageing/afx162
34. Hjalmarsson C, Radegran G, Kylhammar D, Rundqvist B, Multing J, Nisell MD, et al. Impact of age and comorbidity on risk stratification in idiopathic pulmonary arterial hypertension. Eur Respir J. (2018) 51:1702310. doi: 10.1183/13993003.02310-2017
35. Hoeper MM, Simon RGJ. The changing landscape of pulmonary arterial hypertension and implications for patient care. Eur Respir Rev. (2014) 23:450–7. doi: 10.1183/09059180.00007814
36. Burger CD, Long PK, Shah MR, McGoon MD, Miller DP, Romero AJ, et al. Characterization of first-time hospitalizations in patients with newly diagnosed pulmonary arterial hypertension in the REVEAL registry. Chest. (2014) 146:1263–73. doi: 10.1378/chest.14-0193
37. Campo A, Mathai SC, Le Pavec J, Zaiman AL, Hummers LK, Boyce D, et al. Outcomes of hospitalisation for right heart failure in pulmonary arterial hypertension. Eur Respir J. (2011) 38:359–67. doi: 10.1183/09031936.00148310
38. Benza RL, Gomberg-Maitland M, Elliott CG, Farber HW, Foreman AJ, Frost AE, et al. Predicting survival in patients with pulmonary arterial hypertension: the REVEAL risk score calculator 20 and comparison With ESC/ERS-based risk assessment strategies. Chest. (2019) 156:323–37. doi: 10.1016/j.chest.2019.02.004
39. Benza RL, Miller DP, Gomberg-Maitland M, Frantz RP, Foreman AJ, Coffey CS, et al. Predicting survival in pulmonary arterial hypertension: insights from the registry to evaluate early and long-term pulmonary arterial hypertension disease management (REVEAL). Circulation. (2010) 22:164–72. doi: 10.1161/CIRCULATIONAHA.109.898122
40. Wernhart S, Hedderich J. Prediction of pulmonary hypertension in older adults based on vital capacity and systolic pulmonary artery pressure. JRSM Cardiovasc Dis. (2020). doi: 10.1177/2048004020973834
41. Hsich E, Gorodeski EZ, Blackstone EH, Ishwaran H, Lauer MS. Identifying important risk factors for survival in patient with systolic heart failure using random survival forests. Circ Cardiovasc Qual Outcomes. (2011) 4:39–45. doi: 10.1161/CIRCOUTCOMES.110.939371
42. Lee S, Zhou J, Li KHC, Leung KSK, Lakhani I, Liu T, et al. Territory-wide cohort study of Brugada syndrome in Hong Kong: predictors of long-term outcomes using random survival forests and non-negative matrix factorisation. Open Heart. (2021) 8:e001505. doi: 10.1136/openhrt-2020-001505
43. Lee S, Zhou J, Jeevaratnam K, Wong WT, Wong ICK, Mak C, et al. Paediatric/young versus adult patients with long QT syndrome. Open Heart. (2021) 8:e001671. doi: 10.1136/openhrt-2021-001671
44. Tse G, Lee S, Zhou J, Liu T, Wong ICK, Mak C, et al. Territory-wide chinese cohort of long QT syndrome: random survival forest and cox analyses. Front Cardiovasc Med. (2021) 8:608592. doi: 10.3389/fcvm.2021.608592
45. Chen C, Zhou J, Yu H, Zhang Q, Gao L, Yin X, et al. Identification of important risk factors for all-cause mortality of acquired long QT syndrome patients using random survival forests and non-negative matrix factorization. Heart Rhythm. (2021) 18:426–33. doi: 10.1016/j.hrthm.2020.10.022
46. Lee S, Zhou J, Guo CL, Wong WT, Liu T, Wong ICK, et al. Predictive scores for identifying patients with type 2 diabetes mellitus at risk of acute myocardial infarction and sudden cardiac death. Endocrinol Diabetes Metab. (2021) 4:e00240. doi: 10.1002/edm2.240
47. Lee S, Zhou J, Leung KSK, Wu WKK, Wong WT, Liu T, et al. Development of a predictive risk model for all-cause mortality in patients with diabetes in Hong Kong. BMJ Open Diabetes Res Care. (2021) 9:e001950. doi: 10.1136/bmjdrc-2020-001950
48. Cure-Cure CAC, Gu P, Tian Y, Patel X, Wu T, Sviglin CO, et al. Predictors of all cause mortality and their gender differences in a hispanic population from barranquilla-colombia using machine learning with random survival forests. Circulation. (2018) 138(Suppl_1):A16252. doi: 10.1161/circ.138.suppl_1.16252
49. Ntaios G, Sagris D, Kallipolitis A, Karagkiozi E, Korompoki E, Manios E, et al. Machine-learning-derived model for the stratification of cardiovascular risk in patients with ischemic stroke. J Stroke Cerebrovasc Dis. (2021) 30:106018. doi: 10.1016/j.jstrokecerebrovasdis.2021.106018
50. Jung SY, Papp JC, Sobel EM Yu H, Zhang Z-F. Breast cancer risk and insulin resistance: post genome-wide gene–environment interaction study using a random survival forest. Cancer Res. (2019) 79:2784–94. doi: 10.1158/0008-5472.CAN-18-3688
51. Bauer Y, de Bernard S, Hickey P, Ballard K, Cruz J, Cornelisse P, et al. Identifying early pulmonary arterial hypertension biomarkers in systemic sclerosis: machine learning on proteomics from the DETECT cohort. Eur Respir J. (2021) 57:2002591. doi: 10.1183/13993003.02591-2020
52. Leha A, Hellenkamp K, Unsold B, Mushemi-Blake S, Shah AM, Hasenfuss G, et al. A machine learning approach for the prediction of pulmonary hypertension. PLoS ONE. (2019) 14:e0224453. doi: 10.1371/journal.pone.0224453
Keywords: pulmonary hypertension, electronic frailty index, random survival forest (RSF), diabetes mellitus, cardiovascular disease, renal complications
Citation: Zhou J, Chou OHI, Wong KHG, Lee S, Leung KSK, Liu T, Cheung BMY, Wong ICK, Tse G and Zhang Q (2022) Development of an Electronic Frailty Index for Predicting Mortality and Complications Analysis in Pulmonary Hypertension Using Random Survival Forest Model. Front. Cardiovasc. Med. 9:735906. doi: 10.3389/fcvm.2022.735906
Received: 03 July 2021; Accepted: 20 April 2022;
Published: 08 July 2022.
Edited by:
Shane Nanayakkara, Alfred Hospital, AustraliaReviewed by:
Roberto Carlos Castrejón Pérez, Instituto Nacional de Geriatría, MexicoPaul Leeson, University of Oxford, United Kingdom
Copyright © 2022 Zhou, Chou, Wong, Lee, Leung, Liu, Cheung, Wong, Tse and Zhang. This is an open-access article distributed under the terms of the Creative Commons Attribution License (CC BY). The use, distribution or reproduction in other forums is permitted, provided the original author(s) and the copyright owner(s) are credited and that the original publication in this journal is cited, in accordance with accepted academic practice. No use, distribution or reproduction is permitted which does not comply with these terms.
*Correspondence: Qingpeng Zhang, cWluZ3BlbmcuemhhbmdAY2l0eXUuZWR1Lmhr; Gary Tse, Z2FyeS50c2VAa21tcy5hYy51aw==; Z2FyeXRzZUB0bXUuZWR1LmNu
†These authors share first authorship