 Bi-Liu Wei
 Rui-Xing Yin
 Chun-Xiao Liu
 Guo-Xiong Deng
 Yao-Zong Guan
 Peng-Fei Zheng
94% of researchers rate our articles as excellent or good
Learn more about the work of our research integrity team to safeguard the quality of each article we publish.
Find out more
ORIGINAL RESEARCH article
Front. Cardiovasc. Med. , 14 October 2021
Sec. Cardiovascular Genetics and Systems Medicine
Volume 8 - 2021 | https://doi.org/10.3389/fcvm.2021.720884
This article is part of the Research Topic Epigenetic Regulation in Cardiovascular Diseases View all 16 articles
Background: The association between the CYP17A1 and ATP2B1 SNPs and essential hypertension (referred to as hypertension) is far from being consistent. In addition to the heterogeneity of hypertension resulting in inconsistent results, gene–gene and gene–environment interactions may play a major role in the pathogenesis of hypertension rather than a single gene or environmental factor.
Methods: A case–control study consisting of 1,652 individuals (hypertension, 816; control, 836) was conducted in Maonan ethnic minority of China. Genotyping of the four SNPs was performed by the next-generation sequencing technology.
Results: The frequencies of minor alleles and genotypes of four SNPs were different between the two groups (p < 0.001). According to genetic dominance model analysis, three (rs1004467, rs11191548, and rs17249754) SNPs and two haplotypes (CYP17A1 rs1004467G-rs11191548C and ATP2B1 rs1401982G-rs17249754A) were negatively correlated, whereas rs1401982 SNP and the other two haplotypes (CYP17A1 rs1004467A-rs11191548T and ATP2B1 rs1401982A-rs17249754G) were positively associated with hypertension risk (p ≤ 0.002 for all). Two best significant two-locus models were screened out by GMDR software involving SNP–environment (rs11191548 and BMI ≥ 24 kg/m2) and haplotype–environment (CYP17A1 rs1004467G-rs11191548C and BMI ≥ 24 kg/m2) interactions (p ≤ 0.01). The subjects carrying some genotypes increased the hypertension risk.
Conclusions: Our outcomes implied that the rs1004467, rs11191548, and rs17249754 SNPs and CYP17A1 rs1004467G-rs11191548C and ATP2B1 rs1401982G-rs17249754A haplotypes have protective effects, whereas the rs1401982 SNP and CYP17A1 rs1004467A-rs11191548T and ATP2B1 rs1401982A-rs17249754G haplotypes showed adverse effect on the prevalence of hypertension. Several SNP–environment interactions were also detected.
Essential hypertension (referred to as hypertension) is a regular multifactorial disease affecting about one-fourth of adults worldwide (1). Conversely, most of its potential mechanisms are still unknown. It is well-known that environmental factors, including excessive salt intake, tobacco use, physical inactivity, alcohol abuse, overweight, and obesity, increase blood pressure (BP) levels (2), but about half of population BP changes are determined by genetic factors (3, 4).
Genome-wide association studies (GWASs) can screen and analyze hypertension risk genes (5). For instance, two large GWASs (Global BPgen and CHARGE) have identified 14 risk loci that reached genome-wide significant closely related to BP in 2009, including ATPase, Ca2+ transporting, plasma membrane 1 gene (ATP2B1) and cytochrome P450, family 17, subfamily A, and polypeptide 1 gene (CYP17A1) (6, 7). The results about single-nucleotide polymorphism (SNP) of ATP2B1 and CYP17A1 were tested and verified soon afterwards in different ethnic groups (8–12). In particular, the reproductions about ATP2B1 and CYP17A1 were also conducted in Chinese Han population according to the GWASs (4, 13). However, the evidence that showed the relationship of ATP2B1 and CYP17A1 with the hypertension risk from Maonan being one of China's ethnic minorities was still rare.
The CYP17A1 encodes the P450c17 protein, a member of the cytochrome P450 superfamily of enzymes speeding up plenty of chemical synthesis processes involving steroids, cholesterin, and other blood fats (14). Recently, some articles have reported that the CYP17A1 is related to hypertension, and one reason for how this gene leads to hypertension may be that genetic factors can influence the distribution of fat in body, and then lipid metabolism disorders can cause BP elevating (15–19). Several hypertension susceptibility genes are also associated with lipid profile and fat distribution (17–19). For instance, Zhang et al. reported that two SNPs (rs11191548 and rs1004467) in the CYP17A1 locus were correlated with hypercholesterolemia in Han Chinese (19). In addition, in 2012, a Japanese research also found that the CYP17A1 rs1004467 SNP was associated with the reduction of two types of fat, including visceral and subcutaneous (17). However, Liu et al. had a different opinion regarding the relationship between the CYP17A1 polymorphism and body mass index (BMI) (4).
ATP2B1 is attributed to the family of P-type primary ion transport ATPases (10). The associations of two SNPs (rs1401982, a common intronic variant, and rs17249754, a common intergenic variant with the strongest association of the SNPs) in the ATP2B1 region with both BP and risk of hypertension susceptibility were previously found by GWASs (6, 7, 11) and replicated in the Japanese (8, 9), Korean (10), East Asian (12), and Chinese populations (13). Wang et al. reported that two loci (rs17249754 and rs1401982) were negatively associated with hypertension in a Chinese population (13). However, a Korean genome epidemiology study showed that ATP2B1 rs17249754 polymorphism may be increased the incident hypertension, when sodium was excessively consumed (20). Tabara et al. also demonstrated that the rs1401982 minor allele may be at higher risk of hypertension in the Japanese (8). The underlying mechanism of ATP2B1 affecting BP may be that the ATP2B1 encodes plasma membrane calcium ATPase with an important function in intracellular calcium homeostasis (21, 22). Therefore, some studies have suggested that ATP2B1 polymorphism may change arterial stiffness by affecting vascular reactivity (13, 23).
The above studies have shown significant association between the CYP17A1–ATP2B1 SNPs and hypertension, but others also showed no association between them. The contradictory results may be related to the following factors (14): (1) ignoring the influence of environment–environment, environment–gene, and gene–gene interactions on BP parameters; (2) some variants found in GWASs may not be functional and have little effect on BP phenotype; (3) variation found in GWASs may have linkage disequilibrium (LD) with some functional variants rather than their own role; (4) the frequency of a high-risk genotype is not alike in different races. For example, in the International 1000 Genomes database (https://www.ncbi.nlm.nih.gov/variation/tools/1000genomes/), the frequency of rs1004467GG genotype in the Chinese Han population was 0.364, which was slightly higher than the genotype frequency of 0.322 in the Japanese population, but both were significantly higher than that (0.104) in the European population. These differences may be caused by evolutionary divergence, or it may be the result of negative selection of rs1004467 risk alleles in European populations. Therefore, we should continue (1) to evaluate the differences in genotypes and allele frequencies in other populations of different ancestry; (2) to screen larger cohorts with clinical BP abnormalities; and (3) to evaluate gene–gene (G × G) and gene–environment (G × E) interactions on BP and hypertension, which are very meaningful and necessary (14).
Maonan is one of the mountain ethnic groups with a small population in China (24). Its living environment, dietary structure, lifestyle, and genetic background are different from the local Han population (25–28). Our previous popular survey found that the prevalence of hypertension in this ethnic group was higher than that in the local Han population (49 vs. 31%, p < 0.001) (24). However, up to now, the reason for these differences in BP levels between the two ethnic groups and their risk factors has not been understood. Therefore, the purpose of this research was to test the association of ATP2B1 (rs1401982 and rs17249754) and CYP17A1 (rs1004467 and rs11191548) SNPs, and their haplotypes, G × G and G × E interactions, with hypertension in the Maonan population.
There were five steps for screening four SNPs of CYP17A1 and ATP2B1: (1) SNPs belonging to tagging SNPs were detected by Haploview (Broad Institute or MIT and Harvard, Cambridge, MA, USA, version 4.2). (2) CYP17A1 (rs1004467 and rs11191548) and ATP2B1 (rs1401982 and rs17249754) SNPs were then chosen by SHEsis Main (http://analysis.bio-x.cn/myAnalysis.php). (3) The minor allele frequency (MAF) of the SNPs was more than 1%. (4) SNPs may be associated with hypertension according to the previous investigations. (5) SNP-related information was acquired from NCBI dbSNP Build 132 (http://www.ncbi.nlm.nih.gov/SNP/).
A total of 1,652 Maonan subjects were randomly extracted from previously stratified random samples to conduct a cross-sectional study of hypertensive molecular epidemiology (29). The participants were aged 18–90 years with an average age of 56.6 ± 13.1 years in controls and 56.7 ± 12.3 years in hypertensives. The detailed description of the selection criteria for Maonan participants can be found in two previous studies (24, 30). Besides, all participants were also demonstrated to be Maonan ethnic group by Y chromosome and mitochondrial diversity studies (31). Subjects had complete data on BP and other laboratory parameters and no various related illnesses such as cardiovascular disease, secondary hypertension, and nephropathy. Calculating sample quantity was performed using quanto software (32). All participants had signed informed consent. All the research programs of this project have been approved by the Ethics Committee of the First Affiliated Hospital of Guangxi Medical University (No: Lunshen-2014-KY-Guoji-001; Mar. 7, 2014) (31).
International standardization methods were used for the epidemiological survey (24, 33). Trained health professionals collected data such as demographics, medical history, and lifestyle elements by standardized questionnaires. Alcohol and cigarette usage was designated into either one of two groups (yes or no) (34). BMI (kg/m2) was calculated as weight/(height2). Sitting BP was determined three times after taking a rest at least 5 min using a manual sphygmomanometer, and the average of three readings was used for BP analysis (24).
Serum cholesterol (TC), triglyceride (TG), high-density lipoprotein cholesterol (HDL-C), and low-density lipoprotein cholesterol (LDL-C) were tested by commercially available enzyme assays (31), and all the tests were carried out by an automatic analyzer in the Clinical Science Experiment Center of the First Affiliated Hospital, Guangxi Medical University (31, 35).
The genome DNA was isolated from venous blood white cells with phenol-chloroform (36). All DNA samples were saved at −80°C for the next analysis. Genotyping of the four SNPs was achieved by next-generation sequencing techniques [Sangon Biotech (Shanghai) Co; Ltd] (31). The sense and antisense primers used in this study are shown in Supplementary Table 1.
Hypertension was defined as an average systolic blood pressure (SBP) ≥ 140 mmHg and/or diastolic blood pressure (DBP) ≥ 90 mmHg, or using drugs for treating high BP (37). Hyperlipidemia was diagnosed as an average TC > 5.17 mmol/L, and/or TG > 1.70 mmol/L (31, 38). Age subgroup was divided into two groups: <60 and ≥60 years (34, 35). A BMI <24, 24–28, and > 28 kg/m2 was defined as normal weight, overweight, and obesity, respectively (36).
Statistical analyses of the data were realized by the SPSS 22.0 (31), which was the statistical software (SPSS Inc., Chicago, IL, USA). Differences in quantitative data of normal distribution, non-normally distributed data, and qualitative data between hypertension and control participants were analyzed by t-test, Wilcoxon–Mann–Whitney test, and chi-square test, respectively. The analyses of Hardy–Weinberg equilibrium (HWE), genotype and allele frequencies, pairwise LD, and haplotype frequencies were mainly performed by the SHEsis online genetics software (http://analysis.bio-x.cn/myAnalysis.php) (31, 39). Logistic regression analyses employed not only the association between SNPs and hypertension, but also the interactions of G × G and G × E on the risk of hypertension after adjustment of sex, age, cigarette smoking, drinking, BMI, and hyperlipidemia (35, 36). A p-value < 0.05 was considered statistically significant. The best G × G and G × E interaction combination was screened by Generalized multifactor dimensionality reduction (GMDR) (31, 40–42). Then, the best model with the maximation of cross-validation consistency was chosen (36, 43). Finally, the prediction accuracy of the recognition model was statistically tested by a sign test (providing empirical p-values) (31). G × G and G × E interactions of the best model were presented by hierarchical interaction graphs and interaction dendrograms of MDR (43). Besides, traditional statistical approaches were applied to test the outcomes from MDR analyses, and p <0.016 was considered statistically significant after Bonferroni correction (0.05/3) (36, 43).
The demographic parameters of 1,652 subjects are shown in Table 1. Compared with the control group, hypertensive patients had higher BMI, SBP, DBP, blood glucose, TC, TG, and LDL-C, but lower HDL-C (p < 0.001). However, there was no difference in age, sex ratio, smoking, and drinking between the control and case groups (p > 0.05 for all).
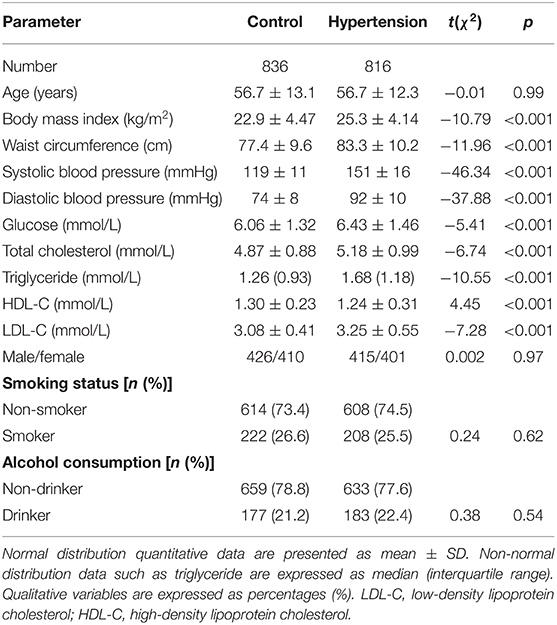
Table 1. General characteristics of the study subjects.
As shown in Table 2, the minor allele and genotype distribution of the rs1004467, rs11191548, rs1401982, and rs17249754 SNPs was different between the patient and control groups (p < 0.001). Figure 1 shows the genotype and allele frequencies of each SNP in control and hypertension groups. The genotype distribution was consistent with the HWE (p > 0.05 for all). Simultaneously, the rs1401982 SNP enhanced the risk of hypertension, whereas the rs1004467, rs11191548, and rs17249754 SNPs decreased the susceptibility of hypertension in the dominant model (p ≤ 0.002 for all).
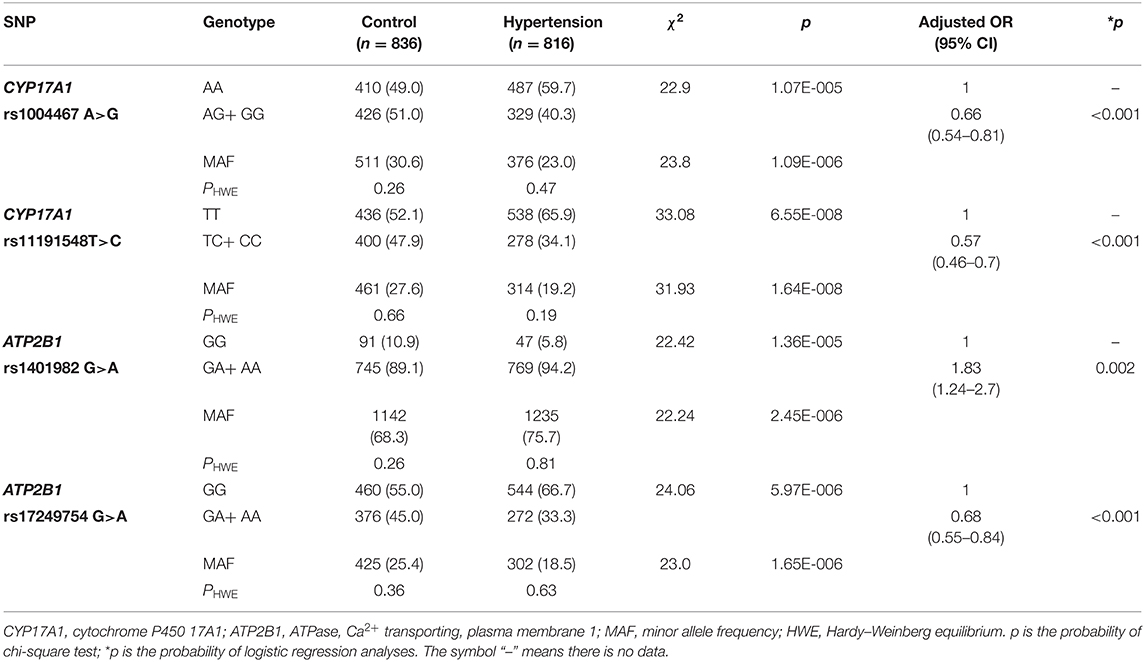
Table 2. Correlation between the CYP17A1–ATP2B1 polymorphisms and hypertension.
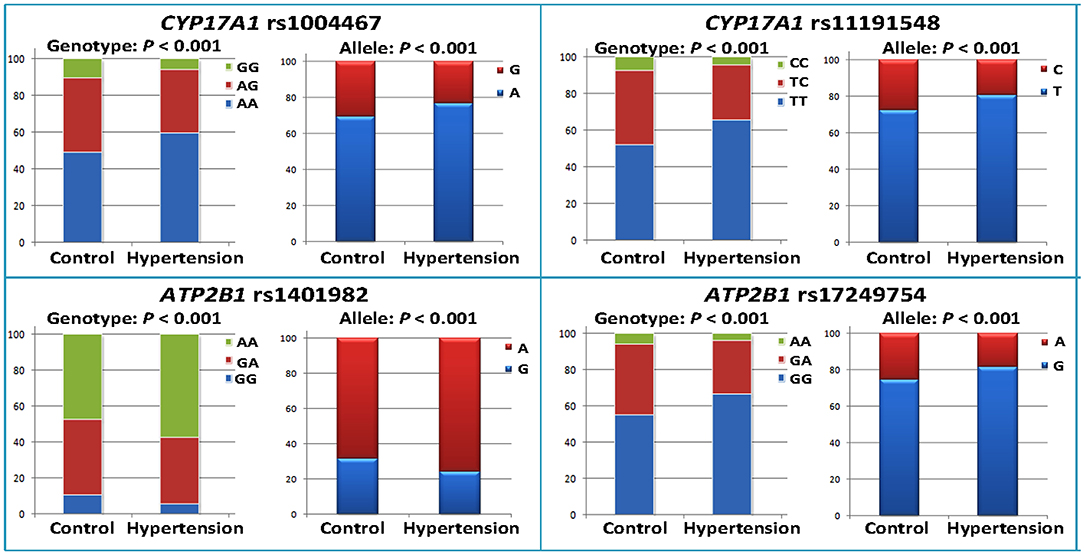
Figure 1. Genotype and allele frequencies of the four CYP17A1–ATP2B1 SNPs in the control and hypertension groups.
LD analysis showed that the four SNPs did not have statistical independence in the control or case group. However, the LD between the rs1004467 and rs11191548 (D' = 0.950) or between the rs1401982 and rs17249754 SNPs (D' = 0.951) was strong in both control and hypertension groups (Supplementary Figure 1; Supplementary Table 2). As shown in Table 3, the most common haplotypes were CYP17A1 rs1004467A-rs11191548T and ATP2B1 rs1401982A-rs17249754G (≥ 67% of the samples). The frequencies of CYP17A1 rs1004467A-rs11191548T, CYP17A1 rs1004467G-rs11191548C, ATP2B1 rs1401982A-rs17249754G, and ATP2B1 rs1401982G-rs17249754A haplotypes were significantly different between the control and case groups. Meanwhile, the haplotypes of CYP17A1 rs1004467A-rs11191548T, CYP17A1 rs1004467G-rs11191548C, and ATP2B1 rs1401982G-rs17249754A had a protective effect for hypertension, whereas the haplotype of ATP2B1 rs1401982A-rs17249754G revealed an increased susceptibility of disease (p < 0.001).
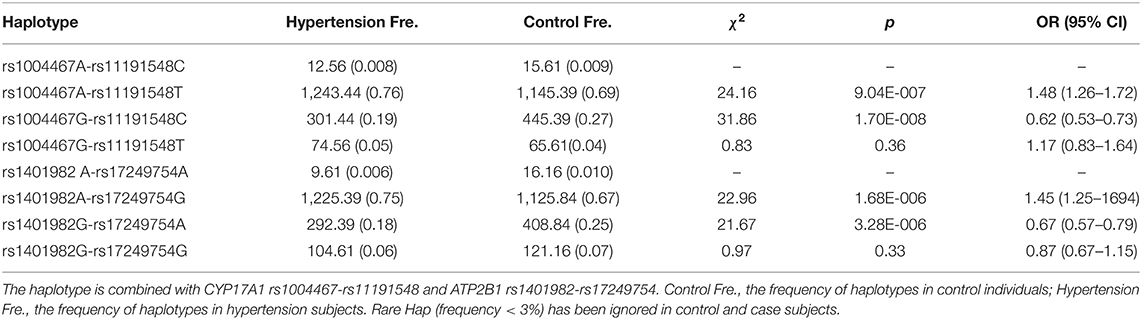
Table 3. Association between the haplotypes and hypertension risk.
The GMDR model was utilized to analyze the interaction of G × G and G × E among SNPs, haplotypes, BMI, age, gender, alcohol, and/or cigarette usage on the risk of hypertension. Table 4 summarizes the results of G × G and G × E interactions of the two and three loci models derived from GMDR analysis. A significant two-locus model revealed a potential SNP–environment interaction between the rs11191548 SNP and BMI ≥ 24 kg/m2 (p = 0.01), with a cross-validation consistency (7/10) and a testing accuracy of 62.7%. Another significant two-locus model (CYP17A1 rs1004467G-rs11191548C and BMI ≥ 24 kg/m2, p = 0.0004) indicated a potential haplotype–environment interaction, with a cross-validation consistency (9/10) and a testing accuracy of 63.5%.
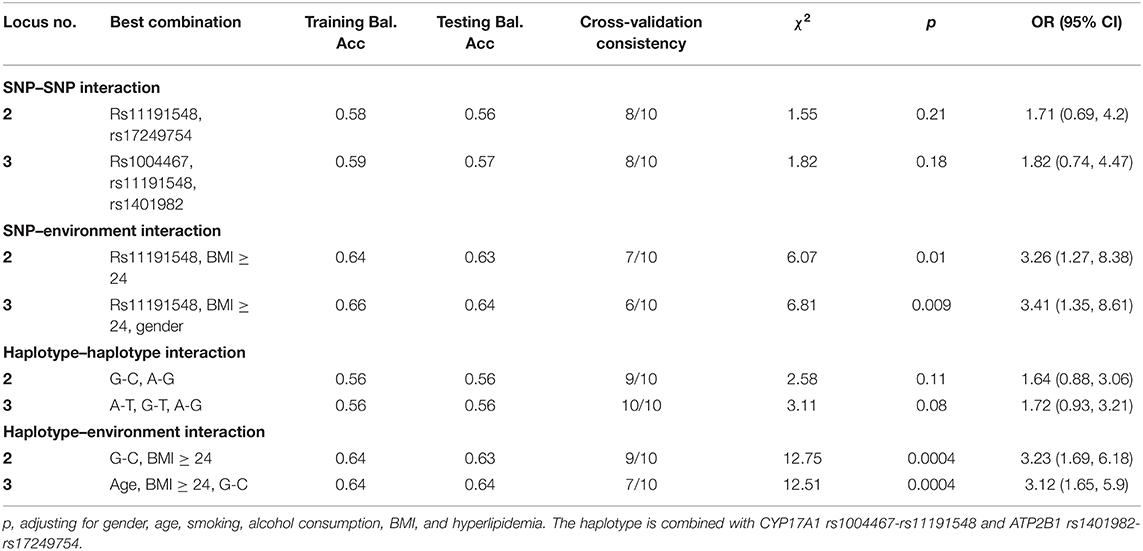
Table 4. GMDR analysis of SNPs, haplotypes, and environments showed different interactions.
Entropy-based interaction dendrograms obtained from MDR analysis are shown in Figure 2, which exhibited the strongest antagonistic effect of the SNP–SNP interaction (rs1401982 and rs17249754), SNP–environment interaction (rs11191548 and BMI ≥ 24 kg/m2), haplotype–haplotype interaction (CYP17A1 rs1004467A-rs11191548T and CYP17A1 rs1004467G-rs11191548C), and haplotype–environment interaction (CYP17A1 rs1004467G-rs11191548C and age), respectively. In order to obtain the OR and 95% CI for the joint effects, we implemented an interaction study by logistic regression analyses (Table 5). When the SNP–environment interaction was analyzed, we found that the individuals with rs11191548 TC/CC genotypes and BMI ≥ 24 kg/m2 raised the risk of hypertension (adjusted OR = 1.45, 95% CI = 1.08–1.94, p = 0.014) compared to the individuals with rs11191548 TT and BMI ≥ 24 kg/m2.
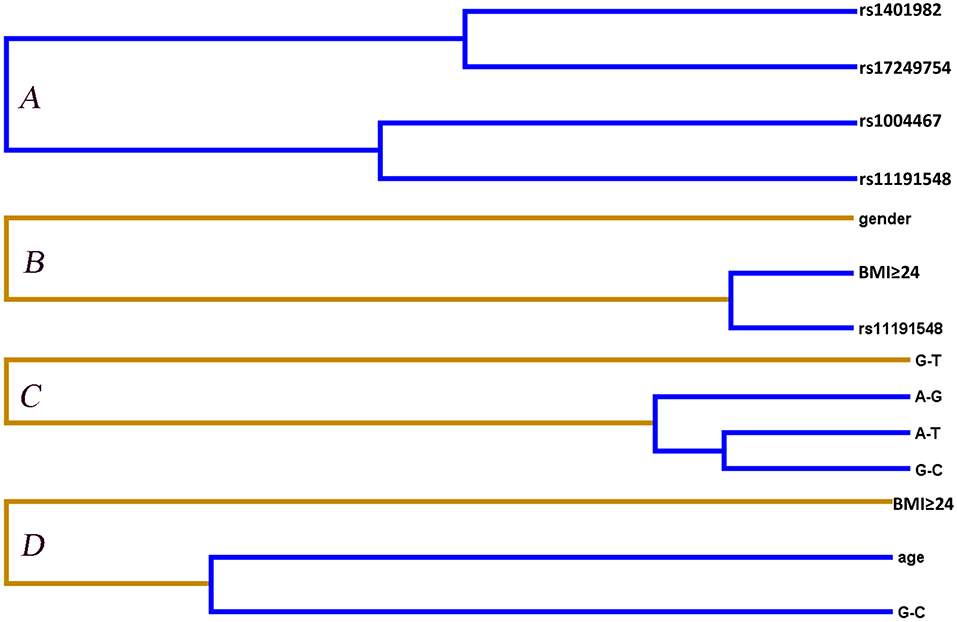
Figure 2. Different types of interaction dendrogram for gene–gene (A,C) and gene–environment (B,D) on the hypertension risk. Orange color (synergy); blue color (strong antagonism interaction). The elements with stronger interaction are closer at the leaves of the tree.
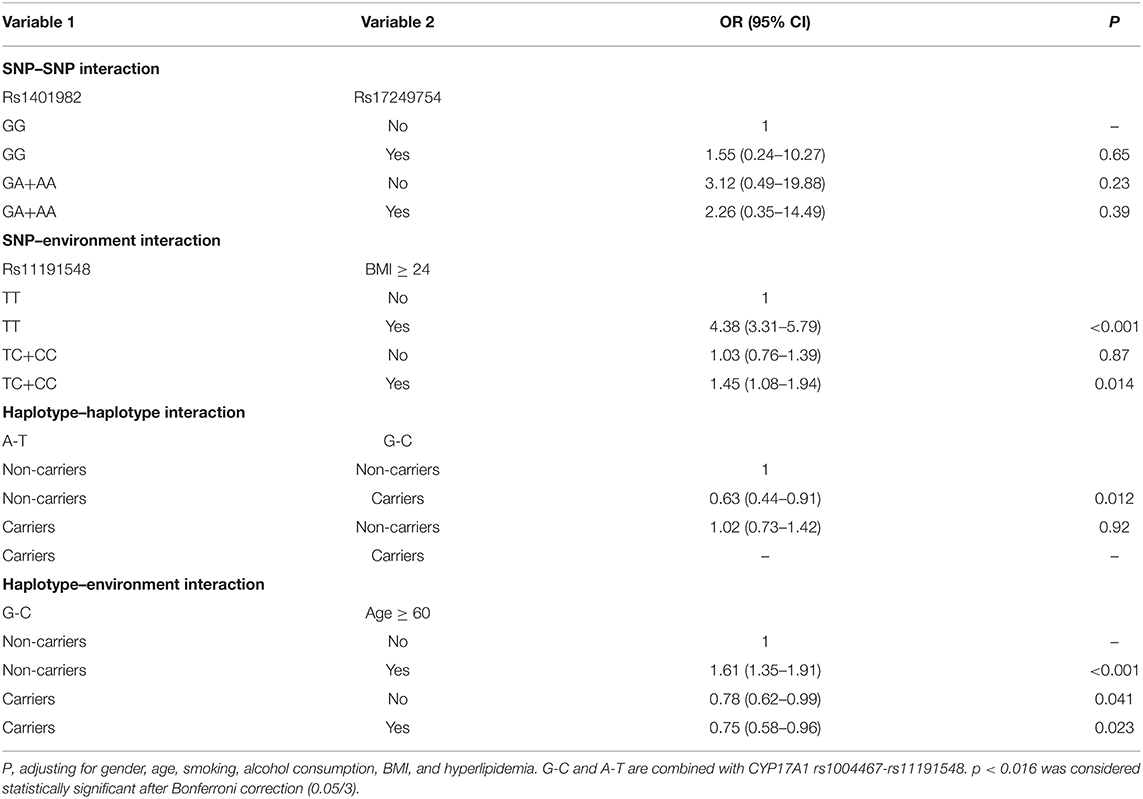
Table 5. Various types of interactions were analyzed by logistic regression analysis.
In this cross-sectional study of hypertensive molecular epidemiology, the association of the ATP2B1 and CYP17A1 SNPs, and their haplotypes, G × G and G × E interactions, with hypertension in the Maonan population was observed for the first time. The main findings are as follows: (1) The genotype and allele frequencies of the CYP17A1 rs1004467, CYP17A1 rs11191548, ATP2B1 rs1401982, and ATP2B1 rs17249754 SNPs were significantly different between the control and hypertension groups. (2) The ATP2B1 rs1401982 SNP enhanced the risk of hypertension, whereas the CYP17A1 rs1004467, CYP17A1 rs11191548, and ATP2B1 rs17249754 SNPs decreased the prevalence of hypertension in the dominant models. (3) The frequencies of CYP17A1 rs1004467A-rs11191548T, CYP17A1 rs1004467G-rs11191548C, ATP2B1 rs1401982A-rs17249754G, and ATP2B1 rs1401982G-rs17249754A haplotypes were significantly different between the control and case groups. (4) The CYP17A1 rs1004467A-rs11191548T, CYP17A1 rs1004467G-rs11191548C, and ATP2B1 rs1401982G-rs17249754A haplotypes had a protective effect for hypertension, whereas the ATP2B1 rs1401982A-rs17249754G haplotype increased the risk of hypertension. (5) Several interactions including rs11191548-BMI ≥ 24 kg/m2 (SNP–environment) and rs1004467G-rs11191548C-BMI ≥ 24 kg/m2 (haplotype–environment) on the risk of hypertension were also observed. (6) The individuals with rs11191548 TC/CC genotypes and BMI ≥ 24 kg/m2 raised the risk of hypertension.
In the past 10 years, according to the results of GWAS scans, both ATP2B1 and CYP17A1 have correlation with BP and/or hypertension (6, 7). However, the genetic association between the ATP2B1 or CYP17A1 and hypertension was conflicting. The most important reasons for the discrepant outcomes may be that hypertension is a complicated illness that is influenced by various environmental elements, small effect polygenes, and their interactions (44). The genotype and allele frequencies of the CYP17A1–ATP2B1 SNPs are different in distinct races, ethnic groups, or populations according to the International 1,000 Genomes database (https://www.ncbi.nlm.nih.gov/variation/tools/1000genomes/). The CYP17A1 rs1004467G allele frequency in Chinese Dai in Xishuangbanna, China (CDX), Han Chinese in Beijing, China (CHB), and Southern Han Chinese (CHS) was 28.49, 36.41, and 35.71%, respectively. The CYP17A1 rs11191548C allele frequency in CDX, CHB, and CHS was 25.27, 29.61, and 28.10%, respectively. The ATP2B1 rs1401982G allele frequency in CDX, CHB, and CHS was 27.96, 34.95, and 39.05%, respectively. The ATP2B1 rs17249754A allele frequency in CDX, CHB, and CHS was 18.82, 32.04, and 36.67%, respectively. In the present study, we found that the MAF of these SNPs was lower than other Chinese, especially in the hypertension group, but it was higher in our study populations than in Europeans or Africans. These results might also be a reasonable explanation for the distinct prevalence of hypertension between Chinese and Europeans or Africans.
Maonan people not only like to eat beef, pork, and animal viscera, all of which are rich in saturated fatty acid, but also like sour marinated meat, snails, and sour pickles that contain a lot of salt (36). High-fat diet is an important element leading to obesity, dyslipidemia (45), atherosclerosis, and hypertension (46, 47). In particular, high-salt diet has a significant impact on hypertension (2, 4, 15). Therefore, the eating habits of Maonan residents may explain the differences in BMI, BP, TC, and TG values between the control and case groups.
There was no statistical significance in alcohol and cigarette consumption rates between control and hypertension groups in our research. The effects of drinking and smoking on hypertension have been reported by previous articles. The extent to which alcohol is associated with hypertension may be partly related to the amount of alcohol consumed (48–51). Low levels of alcohol use mean no different from or slightly lower BP (48–51), and high levels of alcohol consumption are a strong predictor of the high BP risk (48, 52). Smokers usually have higher BP than non-smokers (53, 54). However, the effects of alcohol and tobacco on the risk of hypertension in many studies were still inconsistent (48–51). We assume that these discrepancies could be due to numerous factors, including sample size, misclassification bias according to participants' self-reported questionnaires, ethnicities, age groups, and gender, warranting that further research should take into account the factors above (48–51, 55, 56). To address the possibility that many genetic variants associated with hypertension found by the GWASs might be the result of different environmental as well as direct genetic effects (57), our study used some examples, including eating habits and alcohol and cigarette consumption.
In the current study, minor allele and genotype frequencies of all four SNPs had a difference in control and case groups (p < 0.001). These results showed that CYP17A1 and ATP2B1 SNPs were correlated with hypertension and genetic factors might play a part in susceptibility to hypertension. Furthermore, according to genetic dominance model analysis, three SNPs (rs1004467, rs11191548, and rs17249754) and two haplotypes (CYP17A1 rs1004467G-rs11191548C and ATP2B1 rs1401982G-rs17249754A) were negatively correlated with hypertension risk, while the rs1401982 SNP and the other two haplotypes (CYP17A1 rs1004467A-rs11191548T and ATP2B1 rs1401982A-rs17249754G) were positively associated with hypertension risk (p ≤ 0.002). Meanwhile, GMDR analysis showed no statistical difference between the interaction of CYP17A1 and ATP2B1 on hypertension. However, two best significant two-locus models were screened out involving SNP–environment (rs11191548 and BMI ≥ 24 kg/m2) and haplotype–environment (CYP17A1 rs1004467G-rs11191548C and BMI ≥ 24 kg/m2) interactions (p ≤ 0.01). The participants with the rs11191548 TT genotype and BMI ≥ 24 kg/m2 had higher risk of hypertension than the individuals with the rs11191548 TC/CC genotypes and BMI ≥ 24 kg/m2. G × E interaction on the development of hypertension was also observed in this cross-sectional study.
The prevalence of hypertension is increasing year by year, so new and more effective measures are urgently needed to prevent and treat hypertension. However, this depends on the discovery of mechanism of BP regulation. Although lifestyle intervention can successfully reduce BP in some patients, there are still a number of patients with hypertension who need new drugs to decrease BP. GWASs have confirmed that the ATP2B1 encoding plasma membrane Ca2+ ATPase 1 (PMCA1) is strongly associated with BP and hypertension. Several studies have confirmed that PMCA1 plays a physiological role in regulating BP and resistance artery function. PMCA1 may be a potential target for the treatment of essential hypertension (58). At present, the specific mechanism of hypertension has not been fully clarified, and further studies are needed to explore this. This study may provide new information and ideas for the scientists in this field.
There are several potential limitations in our study. First, the number of controls and patients with hypertension was relatively small. Larger samples are necessary to confirm our findings in this study. Second, the general characteristics of the two study populations were different. The potential effects of these factors on BP and hypertension could not be completely eliminated even if the statistical analyses were adjusted. Third, a small number of patients with hypertension received some secondary prevention drugs. Some of these drugs may have a certain effect on BP and hypertension. Fourth, it is worth noting that the four SNPs tested in this study may have LD with some functional variants rather than their own role on BP and hypertension. Fifth, diet and physical activity have a significant impact on BP and hypertension. The statistical analysis of this study failed to adjust the effects of dietary nutrients and physical activity intensity on BP and hypertension. This is also the deficiency of this article. Finally, statistical significance is not entirely consistent with biological significance.
Our outcomes implied that the rs1004467, rs11191548, and rs17249754 SNPs and CYP17A1 rs1004467G-rs11191548C and ATP2B1 rs1401982G-rs17249754A haplotypes revealed protective effects on hypertension, whereas the rs1401982 SNP and CYP17A1 rs1004467A-rs11191548T and ATP2B1 rs1401982A-rs17249754G haplotypes showed adverse effect on the prevalence of hypertension. The rs11191548-BMI ≥ 24 kg/m2 interaction on hypertension was also observed.
The data presented in the study are deposited in the Supplementary Material.
The studies involving human participants were reviewed and approved by the Ethics Committee of the First Affiliated Hospital of Guangxi Medical University (No. Lunshen-2014 KY-Guoji-001, Mar. 7, 2014). The patients/participants provided their written informed consent to participate in this study.
B-LW conceived the research, took part in design, performed genotyping and statistical analysis, and drafted the manuscripts. R-XY conceived the research, took part in the design, conducted the epidemiological investigation, collected the samples, and helped to draft the manuscript. C-XL collaborated to the genotyping. G-XD, Y-ZG, and P-FZ conducted the epidemiological investigation and helped to collect the samples. All authors contributed to the article and approved the submitted version.
This work was supported by the National Natural Science Foundation of China (No. 81460169). There was no role of the funding body in the design of the study and collection, analysis, and interpretation of data and in writing the manuscript.
The authors declare that the research was conducted in the absence of any commercial or financial relationships that could be construed as a potential conflict of interest.
All claims expressed in this article are solely those of the authors and do not necessarily represent those of their affiliated organizations, or those of the publisher, the editors and the reviewers. Any product that may be evaluated in this article, or claim that may be made by its manufacturer, is not guaranteed or endorsed by the publisher.
The Supplementary Material for this article can be found online at: https://www.frontiersin.org/articles/10.3389/fcvm.2021.720884/full#supplementary-material
1. Wu Y, Huxley R, Li L, Anna V, Xie G, Yao C, et al. Prevalence, awareness, treatment, and control of hypertension in China: data from the China national nutrition and health survey 2002. Circulation. (2008) 118:2679–86. doi: 10.1161/CIRCULATIONAHA.108.788166
2. Whelton PK, He J, Appel LJ, Cutler JA, Havas S, Kotchen TA, et al. Primary prevention of hypertension: clinical and public health advisory from the national high blood pressure education program. JAMA. (2002) 288:1882–8. doi: 10.1001/jama.288.15.1882
3. Garcia EA, Newhouse S, Caulfield MJ, Munroe PB. Genes and hypertension. Curr Pharm Des. (2003) 9:1679–89. doi: 10.2174/1381612033454513
4. Liu C, Li H, Qi Q, Lu L, Gan W, Loos RJ, et al. Common variants in or near FGF5, CYP17A1 and MTHFR genes are associated with blood pressure and hypertension in Chinese Hans. J Hypertens. (2011) 29:70–5. doi: 10.1097/HJH.0b013e32833f60ab
5. Manolio TA. Genomewide association studies and assessment of the risk of disease. N Engl J Med. (2010) 363:166–76. doi: 10.1056/NEJMra0905980
6. Levy D, Ehret GB, Rice K, Verwoert GC, Launer LJ, Dehghan A, et al. Genome-wide association study of blood pressure and hypertension. Nat Genet. (2009) 41:677–87. doi: 10.1038/ng.384
7. Newton-Cheh C, Johnson T, Gateva V, Tobin MD, Bochud M, Coin L, et al. Genome-wide association study identifies eight loci associated with blood pressure. Nat Genet. (2009) 41:666–76. doi: 10.1038/ng.361
8. Tabara Y, Kohara K, Kita Y, Hirawa N, Katsuya T, Ohkubo T, et al. Common variants in the ATP2B1 gene are associated with susceptibility to hypertension: the Japanese millennium genome project. Hypertension. (2010) 56:973–80. doi: 10.1161/HYPERTENSIONAHA.110.153429
9. Takeuchi F, Isono M, Katsuya T, Yamamoto K, Yokota M, Sugiyama T, et al. Blood pressure and hypertension are associated with 7 loci in the Japanese population. Circulation. (2010) 121:2302–9. doi: 10.1161/CIRCULATIONAHA.109.904664
10. Hong KW, Jin HS, Lim JE, Kim S, Go MJ, Oh B. Recapitulation of two genomewide association studies on blood pressure and essential hypertension in the Korean population. J Hum Genet. (2010) 55:336–41. doi: 10.1038/jhg.2010.31
11. Kato N, Takeuchi F, Tabara Y, Kelly TN, Go MJ, Sim X, et al. Meta-analysis of genome-wide association studies identifies common variants associated with blood pressure variation in east Asians. Nat Genet. (2011) 43:531–8. doi: 10.1038/ng.834
12. Cho YS, Go MJ, Kim YJ, Heo JY, Oh JH, Ban HJ, et al. A large-scale genome-wide association study of Asian populations uncovers genetic factors influencing eight quantitative traits. Nat Genet. (2009) 41:527–34. doi: 10.1038/ng.357
13. Wang Y, Zhang Y, Li Y, Zhou X, Wang X, Gao P, et al. Common variants in the ATP2B1 gene are associated with hypertension and arterial stiffness in Chinese population. Mol Biol Rep. (2013) 40:1867–73. doi: 10.1007/s11033-012-2242-3
14. Dai CF, Xie X, Ma YT, Yang YN, Li XM, Fu ZY, et al. The relationship between the polymorphisms of the CYP17A1 gene and hypertension: a meta-analysis. J Renin Angiotensin Aldosterone Syst. (2015) 16:1314–20. doi: 10.1177/1470320315585683
15. Lin Y, Lai X, Chen B, Xu Y, Huang B, Chen Z, et al. Genetic variations in CYP17A1, CACNB2 and PLEKHA7 are associated with blood pressure and/or hypertension in She ethnic minority of China. Atherosclerosis. (2011) 219:709–14. doi: 10.1016/j.atherosclerosis.2011.09.006
16. Auchus RJ. The genetics, pathophysiology, and management of human deficiencies of P450c17. Endocrinol Metab Clin North Am. (2001) 30:101–19, vii. doi: 10.1016/S0889-8529(08)70021-5
17. Hotta K, Kitamoto A, Kitamoto T, Mizusawa S, Teranishi H, Matsuo T, et al. Genetic variations in the CYP17A1 and NT5C2 genes are associated with a reduction in visceral and subcutaneous fat areas in Japanese women. J Hum Genet. (2012) 57:46–51. doi: 10.1038/jhg.2011.127
18. Mitri J, Hamdy O. Diabetes medications and body weight. Expert Opin Drug Saf. (2009) 8:573–84. doi: 10.1517/14740330903081725
19. Zhang N, Chen H, Jia J, Ye X, Ding H, Zhan Y. The CYP17A1 gene polymorphisms are associated with hypercholesterolemia in Han Chinese. J Gene Med. (2019) 21:e3102. doi: 10.1002/jgm.3102
20. Lee S, Kim SH, Shin C. Interaction according to urinary sodium excretion level on the association between ATP2B1 rs17249754 and incident hypertension: the Korean genome epidemiology study. Clin Exp Hypertens. (2016) 38:352–8. doi: 10.3109/10641963.2015.1116544
21. Olson S, Wang MG, Carafoli E, Strehler EE, McBride OW. Localization of two genes encoding plasma membrane Ca2(+)-transporting ATPases to human chromosomes 1q25-32 and 12q21-23. Genomics. (1991) 9:629–41. doi: 10.1016/0888-7543(91)90356-J
22. Kobayashi Y, Hirawa N, Tabara Y, Muraoka H, Fujita M, Miyazaki N, et al. Mice lacking hypertension candidate gene ATP2B1 in vascular smooth muscle cells show significant blood pressure elevation. Hypertension. (2012) 59:854–60. doi: 10.1161/HYPERTENSIONAHA.110.165068
23. LeBoeuf A, Mac-Way F, Utescu MS, De Serres SA, Douville P, Desmeules S, et al. Impact of dialysate calcium concentration on the progression of aortic stiffness in patients on haemodialysis. Nephrol Dial Transpl. (2011) 26:3695–701. doi: 10.1093/ndt/gfr138
24. Zheng PF, Yin RX, Wei BL, Liu CX, Deng GX, Guan YZ. Associations of PRKN-PACRG SNPs and G × G and G × E interactions with the risk of hyperlipidaemia. Sci Rep. (2020) 10:13010. doi: 10.1038/s41598-020-68826-1
25. Ogata S, Shi L, Matsushita M, Yu L, Huang XQ, Shi L, et al. Polymorphisms of human leucocyte antigen genes in Maonan people in China. Tissue Antig. (2007) 69:154–60. doi: 10.1111/j.1399-0039.2006.00698.x
26. Deng Q, Xu L, Gong J, Zhou L, Li S, Deng X, et al. Genetic relationships among four minorities in Guangxi revealed by analysis of 15 STRs. J Genet Genom. (2007) 34:1072–9. doi: 10.1016/S1673-8527(07)60122-2
27. Meng JH, Yao J, Xing JX, Xuan JF, Wang BJ, Ding M. Investigation of control region sequences of mtDNA in a Chinese Maonan population. Mitochondrial DNA A DNA Mapp Seq Anal. (2017) 28:350–4. doi: 10.3109/19401736.2015.1122776
28. Li XM, Ouyang Y, Yang YC, Lin R, Xu HB, Xie ZY, et al. Distribution of food-borne parasitic diseases and dietary habits in human population in Guangxi. Zhongguo Ji Sheng Chong Xue Yu Ji Sheng Chong Bing Za Zhi. (2009) 27:151–5.
29. Guo T, Yin RX, Lin WX, Wang W, Huang F, Pan SL. Association of the variants and haplotypes in the DOCK7, PCSK9 and GALNT2 genes and the risk of hyperlipidaemia. J Cell Mol Med. (2016) 20:243–65. doi: 10.1111/jcmm.12713
30. Liu CX, Yin RX, Shi ZH, Deng GX, Zheng PF, Wei BL, et al. EHBP1 SNPs, their haplotypes, and gene-environment interactive effects on serum lipid levels. ACS Omega. (2020) 5:7158–69. doi: 10.1021/acsomega.9b03522
31. Wei BL, Yin RX, Liu CX, Deng GX, Guan YZ, Zheng PF. The MC4R SNPs, their haplotypes and gene-environment interactions on the risk of obesity. Mol Med. (2020) 26:77. doi: 10.1186/s10020-020-00202-1
32. Wang ZP, Li HQ. Sample size requirements for association studies on gene-gene interaction in case-control study. Zhonghua Liu Xing Bing Xue Za Zhi. (2004) 25:623–6. doi: 10.3760/j.issn:0254-6450.2004.07.020
33. Zhang QH, Yin RX, Gao H, Huang F, Wu JZ, Pan SL, et al. Association of the SPTLC3 rs364585 polymorphism and serum lipid profiles in two Chinese ethnic groups. Lipids Health Dis. (2017) 16:1. doi: 10.1186/s12944-016-0392-3
34. Li WJ, Yin RX, Cao XL, Chen WX, Huang F, Wu JZ. DOCK7-ANGPTL3 SNPs and their haplotypes with serum lipid levels and the risk of coronary artery disease and ischemic stroke. Lipids Health Dis. (2018) 17:30. doi: 10.1186/s12944-018-0677-9
35. Aung LH, Yin RX, Wu DF, Wang W, Liu CW, Pan SL. Association of the variants in the BUD13-ZNF259 genes and the risk of hyperlipidaemia. J Cell Mol Med. (2014) 18:1417–28. doi: 10.1111/jcmm.12291
36. Miao L, Yin RX, Pan SL, Yang S, Yang DZ, Lin WX. BCL3-PVRL2-TOMM40 SNPs, gene-gene and gene-environment interactions on dyslipidemia. Sci Rep. (2018) 8:6189. doi: 10.1038/s41598-018-24432-w
37. Chalmers J, MacMahon S, Mancia G, Whitworth J, Beilin L, Hansson L, et al. 1999 world health organization-international society of hypertension guidelines for the management of hypertension. Guidelines sub-committee of the world health organization. Clin Exp Hypertens. (1999) 21:1009–60. doi: 10.3109/10641969909061028
38. Wu DF, Yin RX, Cao XL, Huang F, Wu JZ, Chen WX. MADD-FOLH1 polymorphisms and their haplotypes with serum lipid levels and the risk of coronary heart disease and ischemic stroke in a Chinese Han population. Nutrients. (2016) 8:208. doi: 10.3390/nu8040208
39. Shi YY, He L. SHEsis, a powerful software platform for analyses of linkage disequilibrium, haplotype construction, and genetic association at polymorphism loci. Cell Res. (2005) 15:97–8. doi: 10.1038/sj.cr.7290272
40. Lou XY. UGMDR: a unified conceptual framework for detection of multifactor interactions underlying complex traits. Heredity. (2015) 114:255–61. doi: 10.1038/hdy.2014.94
41. Lou XY, Chen GB, Yan L, Ma JZ, Zhu J, Elston RC, et al. A generalized combinatorial approach for detecting gene-by-gene and gene-by-environment interactions with application to nicotine dependence. Am J Hum Genet. (2007) 80:1125–37. doi: 10.1086/518312
42. Xu HM, Xu LF, Hou TT, Luo LF, Chen GB, Sun XW, et al. GMDR: versatile software for detecting gene-gene and gene-environ- ment interactions underlying complex traits. Curr Genom. (2016) 17:396–402. doi: 10.2174/1389202917666160513102612
43. Lin Z, Su Y, Zhang C, Xing M, Ding W, Liao L, et al. The interaction of BDNF and NTRK2 gene increases the susceptibility of paranoid schizophrenia. PLoS ONE. (2013) 8:e74264. doi: 10.1371/journal.pone.0074264
44. Binder A. A review of the genetics of essential hypertension. Curr Opin Cardiol. (2007) 22:176–84. doi: 10.1097/HCO.0b013e3280d357f9
45. Lottenberg AM, Afonso Mda S, Lavrador MS, Machado RM, Nakandakare ER. The role of dietary fatty acids in the pathology of metabolic syndrome. J Nutr Biochem. (2012) 23:1027–40. doi: 10.1016/j.jnutbio.2012.03.004
46. Teixeira AA, Lira FS, Pimentel GD, Oliveira de Souza C, Batatinha H, Biondo LA, et al. Aerobic exercise modulates the free fatty acids and inflammatory response during obesity and cancer cachexia. Crit Rev Eukaryot Gene Expr. (2016) 26:187–98. doi: 10.1615/CritRevEukaryotGeneExpr.2016016490
47. Ruixing Y, Jinzhen W, Yaoheng H, Jing T, Hai W, Muyan L, et al. Associations of diet and lifestyle with hyperlipidemia for middle-aged and elderly persons among the Guangxi Bai Ku Yao and Han populations. J Am Diet Assoc. (2008) 108:970–6. doi: 10.1016/j.jada.2008.03.010 (accessed Sep 25, 2021).
48. Campbell NR, Ashley MJ, Carruthers SG, Lacourcière Y, McKay DW. Lifestyle modifications to prevent and control hypertension. 3. Recommendations on alcohol consumption. Canadian Hypertension Society, Canadian Coalition for High Blood Pressure Prevention and Control, Laboratory Centre for Disease Control at Health Canada, Heart and Stroke Foundation of Canada. CMAJ. (1999) 160(Suppl. 9):S13–20.
49. Reed D, McGee D, Yano K. Biological and social correlates of blood pressure among Japanese men in Hawaii. Hypertension. (1982) 4:406–14. doi: 10.1161/01.HYP.4.3.406
50. Bulpitt CJ, Shipley MJ, Semmence A. The contribution of a moderate intake of alcohol to the presence of hypertension. J Hypertens. (1987) 5:85–91. doi: 10.1097/00004872-198702000-00012
51. MacMahon SW, Blacket RB, Macdonald GJ, Hall W. Obesity, alcohol consumption and blood pressure in Australian men and women. The national heart foundation of Australia risk factor prevalence study. J Hypertens. (1984) 2:85–91. doi: 10.1097/00004872-198402000-00015
52. Stamler J, Caggiula AW, Grandits GA. Relation of body mass and alcohol, nutrient, fiber, and caffeine intakes to blood pressure in the special intervention and usual care groups in the multiple risk factor intervention trial. Am J Clin Nutr. (1997) 65(Suppl. 1):338s−65s. doi: 10.1093/ajcn/65.1.338S
53. Bae J, Yi YH, Kim YJ, Lee JG, Tak YJ, Lee SH, et al. Time to first cigarette and the risk of hypertension: a nationwide representative study in Korea. Am J Hypertens. (2019) 32:202–8. doi: 10.1093/ajh/hpy170
54. Hering D, Kucharska W, Kara T, Somers VK, Narkiewicz K. Smoking is associated with chronic sympathetic activation in hypertension. Blood Press. (2010) 19:152–5. doi: 10.3109/08037051.2010.484150
55. Kim SH, Lee JS. The association of smoking and hypertension according to cotinine-verified smoking status in 25,150 Korean adults. Clin Exp Hypertens. (2019) 41:401–8. doi: 10.1080/10641963.2018.1489548
56. Kim BJ, Seo DC, Kim BS, Kang JH. Relationship between cotinine-verified smoking status and incidence of hypertension in 74,743 Korean adults. Circ J. (2018) 82:1659–65. doi: 10.1253/circj.CJ-17-1188
57. Gage SH, Smith GD, Ware JJ, Flint J, Munafo MR. Correction: G = E: What GWAS can tell us about the environment. PLoS Genet. (2016) 12:e1006065. doi: 10.1371/journal.pgen.1006065
Keywords: CYP17A1, ATP2B1, single nucleotide polymorphisms, interactions, hypertension
Citation: Wei B-L, Yin R-X, Liu C-X, Deng G-X, Guan Y-Z and Zheng P-F (2021) CYP17A1–ATP2B1 SNPs and Gene–Gene and Gene–Environment Interactions on Essential Hypertension. Front. Cardiovasc. Med. 8:720884. doi: 10.3389/fcvm.2021.720884
Received: 05 June 2021; Accepted: 09 September 2021;
Published: 14 October 2021.
Edited by:
Christoph D. Rau, University of North Carolina at Chapel Hill, United StatesReviewed by:
Umamaheswaran Gurusamy, University of California, San Francisco, United StatesCopyright © 2021 Wei, Yin, Liu, Deng, Guan and Zheng. This is an open-access article distributed under the terms of the Creative Commons Attribution License (CC BY). The use, distribution or reproduction in other forums is permitted, provided the original author(s) and the copyright owner(s) are credited and that the original publication in this journal is cited, in accordance with accepted academic practice. No use, distribution or reproduction is permitted which does not comply with these terms.
*Correspondence: Rui-Xing Yin, eWlucnVpeGluZ0AxNjMuY29t; orcid.org/0000-0001-7883-4310
Disclaimer: All claims expressed in this article are solely those of the authors and do not necessarily represent those of their affiliated organizations, or those of the publisher, the editors and the reviewers. Any product that may be evaluated in this article or claim that may be made by its manufacturer is not guaranteed or endorsed by the publisher.
Research integrity at Frontiers
Learn more about the work of our research integrity team to safeguard the quality of each article we publish.