 Benedikt Franke1†
 Jan Brüning1†Pavlo Yevtushenko1
 Henryk Dreger2,3Anna Brand2,3Benjamin Juri3Axel Unbehaun2,4Jörg Kempfert4
 Simon Sündermann3,4Alexander Lembcke5Natalia Solowjowa4
 Sebastian Kelle6Volkmar Falk4Titus Kuehne1,2,7
 Leonid Goubergrits1,8
 Marie Schafstedde1,2,7,9*
- 1Institute of Computer-assisted Cardiovascular Medicine, Charité – Universitätsmedizin Berlin, Berlin, Germany
- 2DZHK (German Centre for Cardiovascular Research), Partner Site Berlin, Berlin, Germany
- 3Department of Cardiology and Angiology, Charité – Universitätsmedizin Berlin, Berlin, Germany
- 4Department of Cardiothoracic and Vascular Surgery, German Heart Center Berlin, Berlin, Germany
- 5Department of Radiology, Charité – Universitätsmedizin Berlin, Berlin, Germany
- 6Department of Cardiology, German Heart Center Berlin, Berlin, Germany
- 7Department of Congenital Heart Disease, German Heart Center Berlin, Berlin, Germany
- 8Einstein Center Digital Future, Berlin, Germany
- 9Berlin Institute of Health (BIH), Charité – Universitätsmedizin Berlin, Berlin, Germany
Background: In patients with aortic stenosis, computed tomography (CT) provides important information about cardiovascular anatomy for treatment planning but is limited in determining relevant hemodynamic parameters such as the transvalvular pressure gradient (TPG).
Purpose: In the present study, we aimed to validate a reduced-order model method for assessing TPG in aortic stenosis using CT data.
Methods: TPGCT was calculated using a reduced-order model requiring the patient-specific peak-systolic aortic flow rate (Q) and the aortic valve area (AVA). AVA was determined by segmentation of the aortic valve leaflets, whereas Q was quantified based on volumetric assessment of the left ventricle. For validation, invasively measured TPGcatheter was calculated from pressure measurements in the left ventricle and the ascending aorta. Altogether, 84 data sets of patients with aortic stenosis were used to compare TPGCT against TPGcatheter.
Results: TPGcatheter and TPGCT were 50.6 ± 28.0 and 48.0 ± 26 mmHg, respectively (p = 0.56). A Bland–Altman analysis revealed good agreement between both methods with a mean difference in TPG of 2.6 mmHg and a standard deviation of 19.3 mmHg. Both methods showed good correlation with r = 0.72 (p < 0.001).
Conclusions: The presented CT-based method allows assessment of TPG in patients with aortic stenosis, extending the current capabilities of cardiac CT for diagnosis and treatment planning.
Introduction
Aortic valve stenosis (AS) is the most common heart valve disease requiring surgery or intervention (1). In the aging population, the incidence of AS is increasing, reaching a prevalence of 12% in the population over 75 years of age (2). Patients with mild-to-moderate stenosis often remain symptom-free for a long period of time. However, mortality increases rapidly with the onset of symptoms (3). According to current guidelines, grading of AS severity is primarily based on the maximum flow velocity across the aortic valve, which is used for calculation of the transvalvular pressure gradient (TPG) and the aortic valve area (AVA) (4, 5).
CT became indispensable for planning of surgical or transcatheter aortic valve implantation (TAVI). This includes the assessment of anatomic structures, like the aortic annulus, the coronary ostia, and diameters and curvatures of all vessels from the catheter's entry side to the aortic valve. Moreover, CT contributes to the evaluation of AS severity by measurement of AVA (6, 7) as well as aortic valve calcium scoring in low-flow low-gradient AS (5, 8, 9). However, measurements of functional hemodynamic parameters, for example, TPG, that allow assessment of AS severity are not yet possible. Such functional measurements, which are currently only possible using echocardiography or cardiac catheterization, would improve the diagnostic value of CT in terms of a unified diagnostic tool.
The objective of this study is to introduce a method for TPG assessment using patient-specific aortic flow rates (Q) and AVA, both measured from cardiac CT images only. To validate this CT-based method, calculated TPG will be compared with catheter-based measurements.
Methods
For this study, retrospective data of patients with AS treated with TAVI in two different centers between February 2019 and October 2020 were used. The following inclusion criteria were defined: aortic stenosis patients who were treated using TAVI; temporally resolved CT images were acquired for TAVI planning; and blood pressures in the left ventricle and the ascending aorta were invasively measured using catheterization during the TAVI procedure but before implantation of the device. No additional exclusion criteria were defined.
The study was registered at ClinicalTrials.gov (NCT04600739) and was approved by the institutional review board (IRB) (EA2/174/19). Individual informed consent was waived by the IRB due to the retrospective nature of this study.
CT Image Acquisition
CT data sets of the entire heart were acquired as part of TAVI planning to assist in the choice of size and type of prosthesis. The median time between CT imaging and TAVI procedure was 12 (1–148) days. Following intravenous contrast material injection, an electrocardiogram-synchronized scan was performed using either a dual-source multislice spiral CT scanner (Somatom Definition Flash, Siemens Healthcare, Erlangen, Germany) or a wide area-detector volume CT scanner (Aquilion One Vision, Canon Medical Systems, or Revolution CT, GE Healthcare, Chicago, IL, USA). All scanning was performed at a tube voltage of 100 kV and an individually adapted tube current using the scanner exposure control software. For each subject, a multiphase data set was reconstructed that allows exact identification of the systolic phase with the widest aortic valve opening. All images were reconstructed with a standard soft-tissue convolution kernel and with the use of a dedicated noise-reduction software. Spatial and temporal resolution of the CT images varied. The spatial resolution used for segmentation was (0.39 – 0.648 mm) × (0.39 – 0.648 mm) in-plane resolution and (0.5–1 mm) slice thickness. The temporal resolution ranged from 70 to 140 ms.
Measurement of Invasive Pressure Gradients
Based on the decision of the Heart Team, catheterization was performed under local (remifentanil) or general anesthesia (propofol and remifentanil). Blood pressure waveforms were measured in the ascending aorta as well as in the left ventricle using a 6-F pigtail catheter (Cordis, Dublin, Ireland). Measurements in the ascending aorta were always performed before measurements in the left ventricle. For each measurement, at least three consecutive cardiac cycles were acquired. The peak-systolic pressure in the left ventricle and the ascending aorta was calculated as the average of all peak values. TPGcatheter was then calculated as the difference between the average peak-systolic pressure in the left ventricle and the ascending aorta.
Non-invasive Measurements of Pressure Gradients Using Doppler Ultrasound
In addition to the invasive measurement of TPGcatheter, non-invasive measurements using Doppler ultrasound and the Bernoulli equation (TPGecho = 4v2, where v is the maximum velocity) were acquired from clinical information systems. These measurements were performed as part of the preoperative diagnostic assessment within the same inpatient stay, but not simultaneously to either the catheterization or the CT image acquisition.
Model for CT-Based Estimation of Pressure Gradients
A reduced-order model based on dynamic CT data was used for non-invasive assessment of TPG. For application of the model, the patient-specific volume flow rate (Q) passing through the stenosed aortic valve and the maximum AVA were measured using dynamic CT data (see Figure 1). First, the left ventricular volume was segmented for every time frame of the CT data using an approach described earlier (10, 11). Briefly, using an automated segmentation procedure, a predefined parametric model containing, among others, the left ventricle, the aortic bulbus, the ascending aorta, and the three aortic leaflets was adapted to the Hounsfield values of the patient-specific CT data for each time frame. Thus, the three-dimensional geometries of these anatomical structures were available. The peak-systolic volume flow rate was then calculated by calculating the left ventricular volume change between the respective time frames and dividing the difference by the temporal resolution of the CT images. In the presence of a mitral insufficiency (MI), Q was reduced by 10, 30, or 50%, for mild, moderate, and severe MI, respectively. Grading of MI severity was assessed from retrospective Doppler ultrasound reports. The regurgitation fraction used to adjust the aortic flow rate for MI corresponds to the lower thresholds defined for multimodal assessment of MI (12, 13).
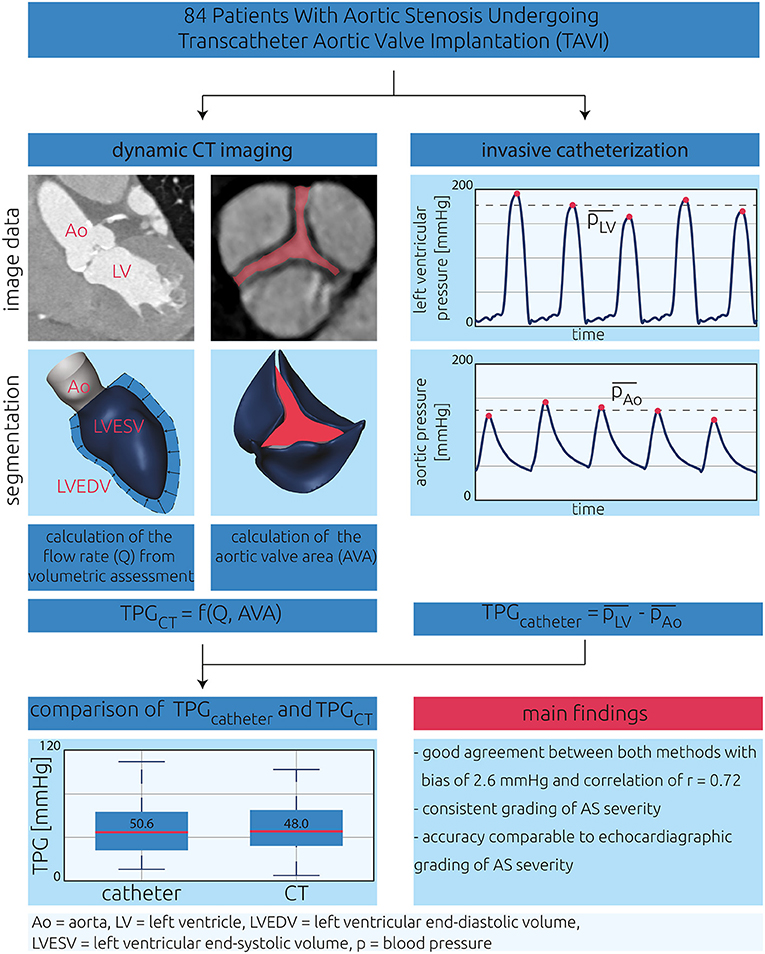
Figure 1. Central illustration describing the present study's design. The aim of this study was to validate a CT-based model for estimation of transvalvular pressure gradients (TPGCT). CT images and pressure waveforms of 84 patients with aortic stenosis were investigated in this retrospective study. TPGCT was calculated using a reduced-order model requiring the aortic flow rate (Q) and the aortic valve area (AVA) as input. AVA was calculated by segmentation of the aortic valve leaflets, and Q was calculated from volumetric assessment of the left ventricle. For validation, invasively measured TPGcatheter was calculated from pressure measurements in the left ventricle as well as the ascending aorta.
The model used in the automatic segmentation procedure assumes an almost point-symmetric aortic valve, where all three leaflets are similar in size and shape. To mitigate this rather strong assumption, the aortic valve segmentation was manually adjusted to better represent the patient-specific valve. Here, a plane parallel to the aortic annulus was specified. Then, the contours of each leaflet were adjusted by manual interaction to fit on the Hounsfield contours visible in the CT images for multiple slices downstream the aortic annulus until the last leaflet tip was not visible anymore. This procedure was only performed for the peak-systolic phase where the maximum AVA was observed. AVA was calculated by identifying the minimal projected area enclosed by the three aortic valve leaflets.
With the use of both parameters, the non-invasive TPGCT was calculated as
Here, TPGCT is in mmHg, Q in l/s, and AVA in cm2.
For this study, the model's coefficients were adjusted compared with an initial feasibility study (11) as the segmentation procedure was optimized to better capture the asymmetry of native aortic valves. For the adjustment, computational fluid dynamic simulations were performed for 58 patients, following the description of Franke et al. (11). Thus, the numerical setup will only be described in a succinct manner.
The patient-specific anatomy of the left ventricle, ascending aorta, and aortic leaflets was smoothed; and the left ventricle was cut perpendicular to the left ventricular outflow tract's (LVOT's) centerline, ~20–30 mm below the aortic valve annulus. With the use of STAR-CCM+ (v. 15.02, Siemens PLM Software Inc., Plano, TX, USA), polyhedral volume meshes with a base size of 0.5–0.8 mm and a boundary layer consisting of five prism cell layers were generated. Each prism cell layer's thickness was 20% larger than that of the previous one. The overall thickness of this boundary layer was one-third of the base size. Near the aortic valve leaflets, a refinement region was specified, where the base size was reduced by half. At the LVOT, the peak-systolic volume flow rate Q was specified as boundary condition. At the end of the ascending aorta, a constant pressure outlet boundary condition was specified. Walls were assumed to be rigid, and a no-slip boundary condition was applied. Blood was modeled as non-Newtonian fluid with a constant density of 1,050 kg/m3. The fluid's dynamic viscosity was modeled using the Carreau–Yasuda model described by Karimi et al. (14). A realizable k-epsilon two-equation turbulence model was used. Simulations were considered converge if the calculated TPG was stable and convergence criteria for mass and momentum were below a threshold of 10−3. TPG was calculated as the difference in surface-averaged static pressure upstream and downstream the stenosed aortic valve. The three model coefficients, i.e., the constant coefficient as well the exponents for AVA and Q in Equation (1), were then calculated using the curve fitting toolbox and the non-linear least-square option provided by MATLAB (v. 2019b, MathWorks Inc., Natick, MA, USA).
Only data sets that were not used for validation (e.g., data of patients for whom a CT scan but no invasive pressure measurements were available) were included in this adjustment cohort.
Statistical, Error, and Operator-Bias Analysis
Distributions of evaluated parameters were visualized using boxplots. Agreement between TPGcatheter and the TPGCT was visualized using the Bland–Altman plots. Differences between heart rates during TAVI and CT as well as between TPGcatheter and TPGCT were tested for significance. Here, the differences were tested for normal distribution using the Shapiro–Wilk test. In case of normal distribution, a paired-samples t-test was used. Otherwise, differences were tested using a Wilcoxon signed-rank test. The same metrics were also calculated for the agreement between TPGcatheter and TPGecho.
To investigate possible systematic error sources, the model's prediction error (TPGcatheter – TPGCT) was compared for the following confounding variables: HR difference between catheterization and CT, degree of MI, temporal resolution of the dynamic CT, and patient's sex. Here, a paired-sample t-test was used for normally distributed parameters, whereas a Mann–Whitney U-test was used otherwise. Additionally, some AS patients included in this study were identified as low-flow low-gradient cases. The prediction error of patients with low-flow low-gradient stenosis was then compared with the prediction error of those without. Here, a two-sample t-test was used.
For quantification of the intra- and interobserver variabilities, 10 cases were chosen from the validation cohort. For intraobserver variability, analysis segmentations of the aortic valve geometries were repeated by the main operator 6 months after the initial segmentations. In addition, segmentations were performed by another user for analysis of interobserver variability. Based on these segmentations, AVA was then calculated and compared with each other. For both analyses, intraclass correlation coefficients (ICCs) were calculated according to the convention by McGraw and Wong [ICC (1) (15)]. Only the operator bias on AVA was investigated, as the volume flow rate quantification was based upon the automatic segmentation of the left ventricle.
A significance level of p = 0.05 was used for all hypothesis tests.
Results
Following the inclusion criteria, data of 84 (43 female) patients were used for validation of TPGCT. Patient characteristics at baseline are presented in Table 1. This information includes demographic, catheter-, CT-, and echocardiographic-based parameters. The average and standard deviation of AVA calculated from the segmented aortic valves was 0.75 ± 0.25 cm2, with individual values ranging from 0.31 to 1.77 cm2. The peak-systolic flow rate (Q) passing through the stenosed aortic valve featured an average and standard deviation of 296 ± 106 ml/s, with individual values ranging from 98 to 584 ml/s. TPGCT, which was calculated using Q and AVA, resulted in an average and standard deviation of 48.0 ± 25.9 mmHg.
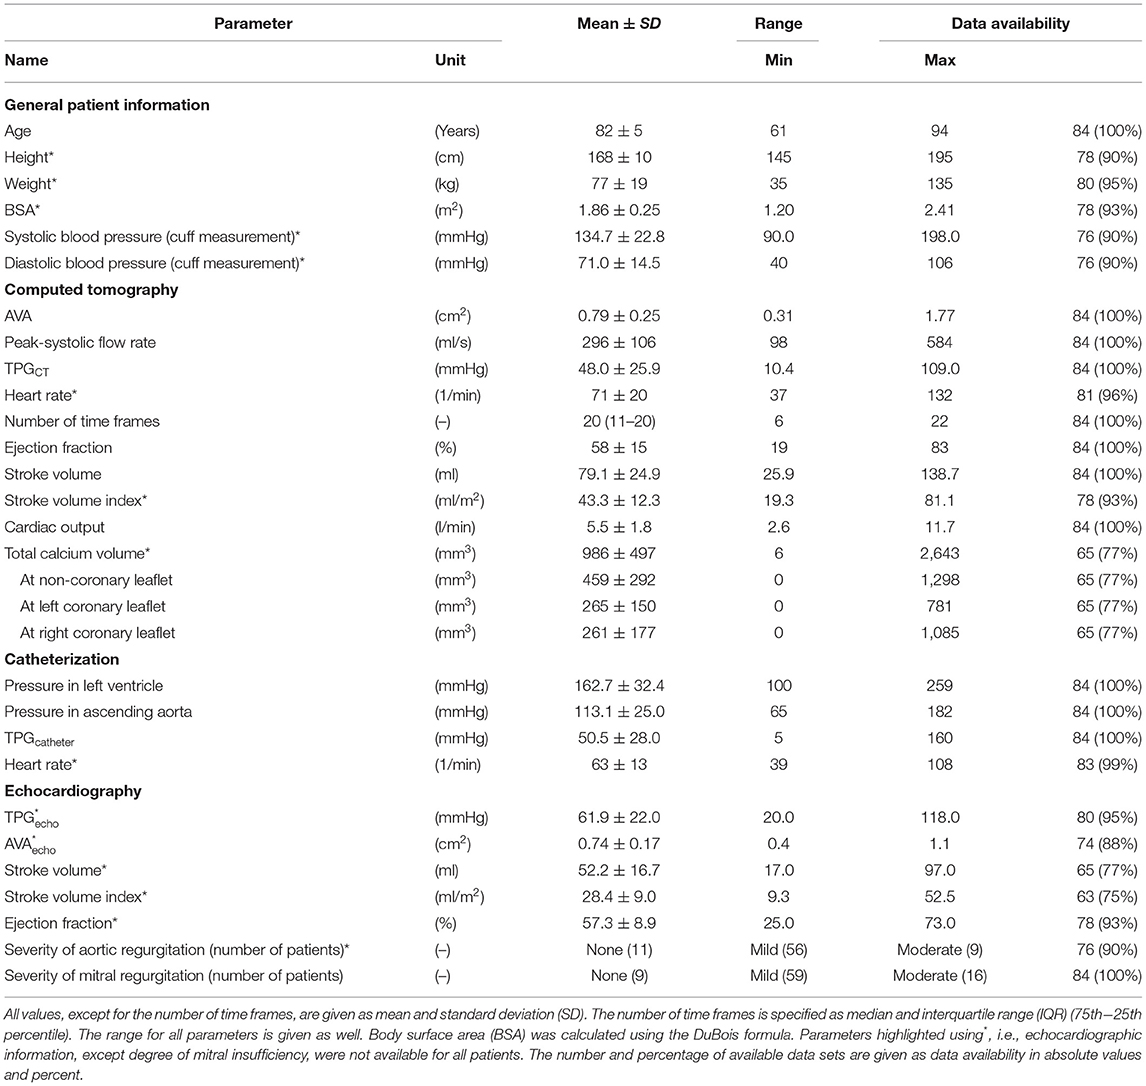
Table 1. Overview of relevant parameters of the present study.
The average and standard deviation of the systolic, static pressure measured in the left ventricle and the ascending aorta was 162.7 ± 32.4 and 113.1 ± 25.0 mmHg, respectively, resulting in a TPGcatheter of 50.6 ± 27.4 mmHg. For TPGecho, the average and standard deviation was 61.9 ± 22.0 mmHg.
According to a Wilcoxon signed-rank test, the heart rate during catheterization was significantly lower than that during CT acquisition: 62.5 ± 13.2 vs. 70.7 ± 20.1 bpm, p < 0.001 (see Figure 2A). All individual parameters are provided as Supplementary Material.
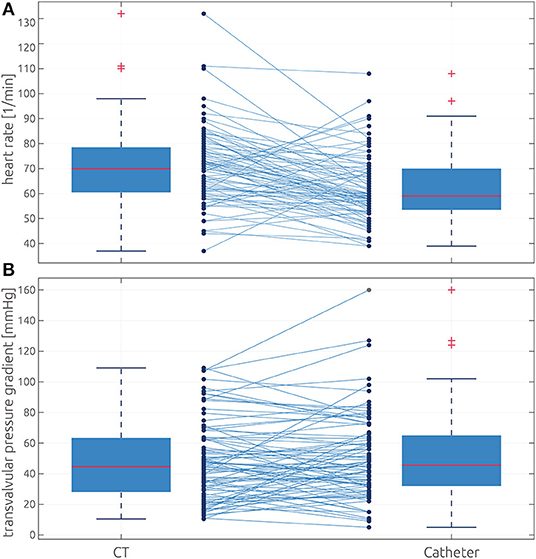
Figure 2. Comparison of heart rate and transvalvular pressure gradient distributions between both methods. (A) Box plots showing the measured heart rate during CT (left) and catheterization (right). (B) Box plots showing the distributions of TPGCT (left) and the TPGcatheter (right). The box defines the range from the 25th to 75th percentile, whereas the whiskers indicate the inner 99% assuming normal distribution. Values outside this range are marked as outliers using red crosses. All individual values and their correspondence between both methods are shown as connected dots.
CT-Based Prediction of the Transvalvular Pressure Gradient
A Bland–Altman plot comparing TPGCT against TPGcatheter is shown in Figure 3. The bias between both methods, which is defined by the average of the differences of both methods and the standard deviation of those differences, was 2.6 ± 19.3 mmHg, which resulted in relatively wide limits of agreement, defined as mean ± 1.96 times the standard deviation of −35.2 to 37.9 mmHg. The means of both methods did not differ significantly, according to a Wilcoxon signed-rank test (p = 0.56), and a good correlation between the non-invasive estimation of TPG and the catheter-based measurements was observed (r = 0.72, p < 0.001, see Figure 4). Both pressure gradient distributions and all individual values of both methods are shown in Figure 2B. In contrast, the correlation between TPGcatheter and TPGecho was r = 0.80, and the average and standard deviation of the differences between those two methods was −11.5 ± 16.4 mmHg, resulting in limits of agreement of −43.6 to 20.6 mmHg. TPGecho systematically overpredicted TPGcatheter (p < 0.001, paired-samples t-test).
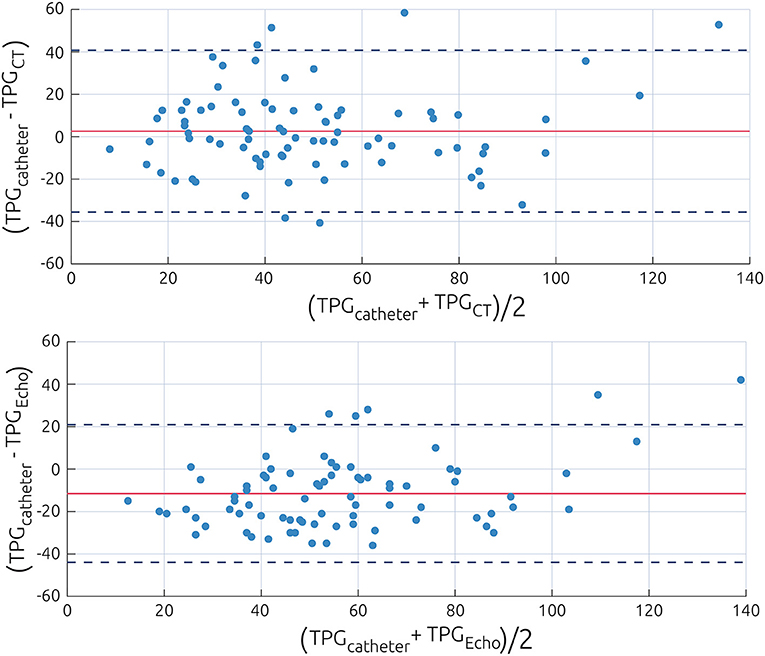
Figure 3. Bland–Altman plot visualizing the differences between the catheter-based measurements of the pressure gradient and the non-invasive estimations using the power law model (Top) or Doppler echocardiography (Bottom). Data are presented as difference of both methods against the average of both methods. The value of the average prediction error is indicated by a solid line, whereas the dashed lines indicate the average prediction error ±1.96 times the standard deviation of this error.
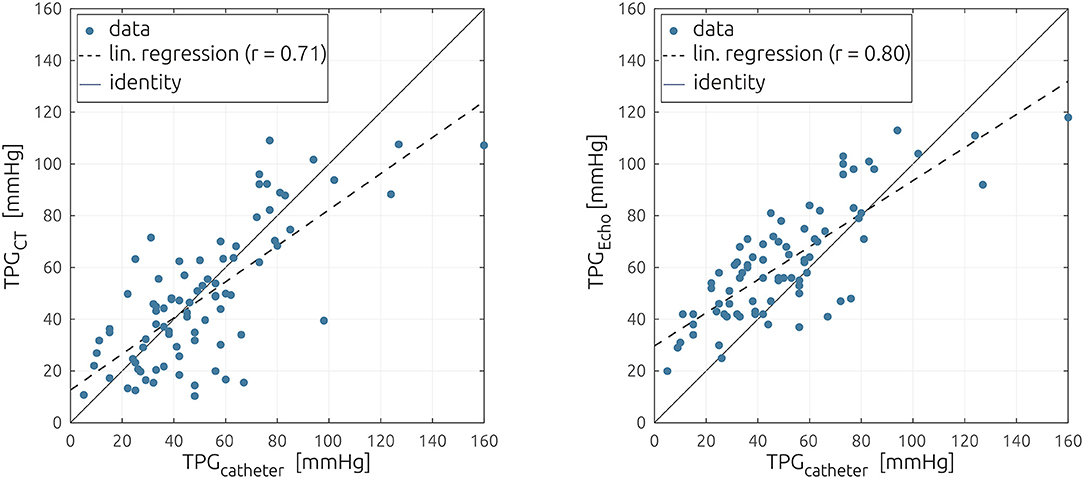
Figure 4. Scatter plot comparing the catheter-based measurements of the pressure gradient against the non-invasive estimation using the reduced-order model (Left) and echocardiography (Right). The linear regression is shown as a dashed line.
Discriminating patients by their sex revealed only minor differences in the predictive capabilities of the model. For women, the average and standard deviation of the differences between both methods was 5.2 ± 18.8 mmHg whereas −0.1 ± 19.5 mmHg for men (p = 0.14). Significant differences between women and men were found for AVA (0.71 vs. 0.87 cm2, p < 0.001) and volume flow rate (271 vs. 321 ml/s, p = 0.03), with both parameters being larger in men than in women. While TPGcatheter (55.4 vs. 45.7 mmHg) and TPGCT (50.2 vs. 45.8 mmHg) were larger in female patients than in male patients, these differences were not significant (p = 0.11 and 0.47, respectively).
Additional to the effect of the patients' sex, the influence of three possible sources of error on the accuracy of the model was investigated. No relevant bias in the model's accuracy was found between patients who featured an absolute heart rate difference between CT and catheterization of 10 bpm or more and those patients with similar heart rates during both procedures: 3.2 ± 21.0 vs. −1.1 ± 17.3 mmHg, p = 0.35. In contrast, the temporal resolution of the dynamic CT images has a strong effect on the model's prediction error. The average and standard deviation of the prediction error was 21.3 ± 20.9 mmHg for cases where a heartbeat was resolved with 10 phases or less, whereas it was −3.4 ± 16.2 mmHg when a higher temporal resolution was available (p < 0.001). The model's prediction error was also larger in patients with moderate MI compared with patients with no or only mild MI: 12.1 ± 18.1 vs. 0.17 ± 20.2 mmHg, p = 0.03. The respective distributions of the model's prediction error are shown in Figure 5. Finally, the prediction error for patients who have been identified as low-flow low-gradient cases (n = 11) during clinical routine was compared with that of all other patients (n = 63). On average, in low-flow low-gradient cases, TPGCT was larger than TPGcatheter (−8.6 ± 15.0 mmHg), whereas predicted TPGCT was smaller than the catheter-based measurements for all other patients (4.3 ± 19.6 mmHg). However, this difference was not significant according to a two-sample t-test (p = 0.25).
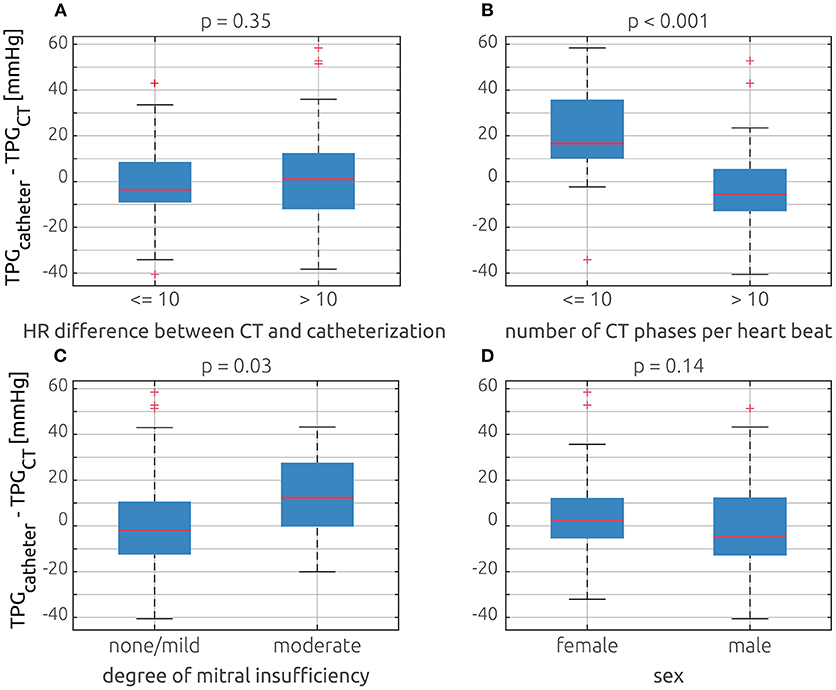
Figure 5. Comparison of the model's prediction error (TPGcatheter – TPGCT) based on four different possible error sources using box plots: (A) comparison of patients who have absolute heart rate difference between catheterization and CT equal or below 10 bpm and patients whose difference exceeded that threshold. (B) Comparison of cases, where the dynamic CT had 10 or less phases per heartbeat and those with more phases. (C) Comparison of patients who had no or a mild mitral insufficiency and those with moderate insufficiency. (D) Comparison between female and male patients.
To quantify consistency in grading of AS severity, a maximum TPG threshold of 64 mmHg was used, corresponding to the maximum velocity of 4 m/s and the corresponding mean threshold of 40 mmHg defined in clinical guidelines. In 77 of 84 patients (91.7%), both methods consistently predicted a TPG of either below or above 64 mmHg. In four patients (4.8%), TPGcatheter was above this threshold, while TPGCT was smaller than 64 mmHg. Finally, in two patients (2.3%), TPGCT was above 64 mmHg, whereas TPGcatheter was below this threshold.
ICCs calculated for the intra- and interobserver analyses were 0.99 and 0.88, indicating an excellent intraobserver reliability and a good agreement between different observers.
Discussion
Our results show that CT-based estimation of TPG performs well compared with invasive cardiac catheterization. The proposed method is easy to apply and complements the current diagnostic capabilities of cardiac CT imaging by providing additional functional hemodynamic information.
CT-Based Analysis of Cardiac Anatomy and Function
Recent advancements in cardiac CT have led to significant improvement in image quality while exposure to radiation simultaneously decreased (16, 17). As a result, CT became an essential tool for treatment planning in AS. In clinical routine, CT is mainly used for the evaluation of anatomical structures of the aorta, the valve annulus, coronary arteries, and the LV outflow tract. However, the valve's geometry can also be visualized using CT, allowing direct measurement of AVA (7, 18). The additional possibility of grading the severity of AS using TPG would further enhance the value of CT by transforming it to a unified diagnostic tool for the evaluation of structural heart disease, combining comprehensive assessment of anatomic and hemodynamic information. The presented method is straightforward and allows assessing TPG from ventricular volumes and the anatomy of the aortic valve. While complete automation of the segmentation of the patient-specific left ventricle and the aortic valve is possible (10), manual correction was still necessary due to the aortic valve's asymmetry. However, this correction could also be automated in the future, so that a fully automated approach might be feasible.
The ability to determine hemodynamic parameters would complement various other CT-based functional measurements that have been established in recent years for cardiovascular applications. Well-known examples are measurement of myocardial perfusion (19, 20) or calculation of fractional flow reserve in patients with coronary artery disease (21–23).
Grading of Aortic Stenosis Severity
According to clinical guidelines, grading of AS severity is required for treatment planning (4, 5). This grading is currently based on either AVA or TPG. Except for planimetric assessment of AVA, models are used to calculate these parameters from either the velocity information obtained using Doppler echocardiography (e.g., Bernoulli equation for TPG; continuity equation for AVA) or the pressure obtained during heart catheterization (e.g., Gorlin equation for AVA). However, those models require additional measurements, for example, cross-sectional areas of the LVOT and the aorta for application of the continuity equation or the cardiac output and systolic ejection period for application of the Gorlin equation, increasing their uncertainty. For both echocardiography- and catheter-based classifications, inconsistent gradings of AS severity are reported in ~30% of patients (24, 25).
Due to its ubiquitous availability and non-invasiveness, echocardiography is the standard for diagnosis of patients with AS (12), even though it is known to systematically overpredict TPG compared with catheterization (26). This overestimation results from neglect of blood flow velocities distal to the aortic valve by the Bernoulli equation. Furthermore, the method is susceptible to interobserver variability (27). However, in a well-controlled environment, where echocardiographic and catheter-based assessments of AS severity are performed simultaneously, good correlations (r > 0.9), low standard errors of estimate (SEEs <15 mmHg), and good agreement for graduation of AS severity between both methods were reported (28–31). In contrast, performing the non-invasive assessment 1 week before catheterization led to slightly weaker correlations (r ≈ 0.8) and increased errors (SEE ≈ 25 mmHg) (30–32).
In our study, we also found a slight overestimation of echocardiography based TPGecho. However, TPGecho correlated well with TPGcatheter. While the Bland–Altman analysis revealed relatively large limits of agreement, those were similar to previous studies comparing echocardiography and catheterization. Thus, good agreement with respect to the expected accuracy, except for the systematic overestimation, was found. In terms of the agreement between TPGCT and TPGcatheter, our results were also similar to the findings reported in studies comparing invasive catheterization and echocardiography as well as the echocardiographic measurements acquired for this study's cohort. With a consistent grading of severity in 92% of all cases, the presented approach performed exceptionally well in this regard.
In this study, direct measurements of TPG using cardiac catheterization, clinically considered as gold standard, was considered as ground truth against which the reduced-order model was validated. However, even this technique is associated with errors. Using two independent measurements in the LV and the aorta rather than simultaneous pressure measurements may affect the quantification of TPG. Furthermore, the position of the catheter in the ascending aorta, as well as the additional decrease of the aortic valve's cross section due to the catheter, especially in patients with already low AVA, may affect accuracy (33).
Error Analysis
Analysis of different probable sources for bias revealed that the model's prediction of TPG worked equally well for male and female patients. While a heart rate difference between CT and catheterization of 10 bpm or more resulted in significantly larger prediction error, this effect was rather small. The presence of a moderate MI as well as a limited temporal resolution of CT images of 10 or less phases resulted in differences in the model's prediction error of more than 10 mmHg on average. As the volume flow rate Q is derived from left ventricle segmentations, the limited temporal resolution resulted in an inaccurate assessment of the left ventricle volume change and thus of the volume flow rate. Therefore, the peak-systolic flow rate was underestimated, which led to an underestimation of TPGCT.
Similarly, TPGCT was smaller than TPGcatheter for patients with moderate MI, suggesting that the compensation of the aortic flow was too rigorous, resulting in an underestimation of Q and thus of TPGCT. If the model is only applied to the 55 patients with a temporal CT resolution of more than 10 phases per heartbeat and no or only a mild MI, the correlation between methods increases to r = 0.81, and SEE decreases to 15.3 mmHg. Out of the seven outliers shown in the Bland–Altman plot (Figure 3), five had a moderate regurgitation, or a limited temporal resolution, or both. Therefore, more thoroughly constraining the inclusion criteria for future investigations using the presented approach might be warranted.
Limitations
There are several important limitations to this study. Due to the retrospective study design, data acquisition was not performed simultaneously but with a median delay of 12 (1–148) days, which certainly decreases the agreement between all methods compared. In contrast to CT and transthoracic echocardiographic (TTE) examinations, catheterization was performed under sedation, which further affects hemodynamics and therefore accuracy of TPG assessment. Additionally, the proposed CT-based TPG assessment still requires minor manual interaction, which might represent a potential additional error source.
As the study only includes TAVI patients, we cannot exclude a certain selection bias due to the type of intervention. However, due to the retrospective study design, this limitation could not be mitigated, as TAVI patients were the only AS patients for whom pressure gradients were routinely measured using catheterization. Also, the decision between TAVI and surgical valve replacement is based on risk scores rather than the severity of the AS; thus, neither the AVA nor the peak-systolic volume flow rate is relevant for this decision. The stenosis relevant parameter (e.g., AVA and TPG) distributions are similar between patients undergoing TAVI or surgical valve replacement (34). Nonetheless, the validity of this assumption as well as the applicability of this approach in patients with low gradients should be evaluated in a future prospective trial.
Outlook
The presented reduced-order model might be extended by a functionality to also predict TPG during physical exercise in the future. The change of cardiovascular functional parameters (e.g., cardiac output or peak-systolic flow rate) due to physical exercise can be predicted if these parameters were known at rest (35). In our own preliminary work comparing cardiac catheterization and pharmaceutical exercise testing using dobutamine, the increase in TPG during physical stress was successfully predicted (36). As changes in AVA during physical stress are rather small, this approach might be applicable to our approach, allowing non-invasive assessment of TPG at different levels of exercise. The findings of this study, especially regarding the level of agreement between both methods and possible error sources, are vital for the design of a prospective validation study. Here, an a priori power analysis for sample size estimation, simultaneous acquisition, or at least acquisition in close succession of CTA and catheter-based pressure gradients seems warranted.
Conclusion
The presented approach allows estimation of TPG in patients with AS from dynamic cardiac CT images only. This additional hemodynamic assessment might complement the current diagnostic capabilities of cardiac CT and hence the preoperative treatment planning of patients with AS.
Data Availability Statement
The original contributions presented in the study are included in the article/Supplementary Material, further inquiries can be directed to the corresponding author/s.
Ethics Statement
The studies involving human participants were reviewed and approved by Ethikkommission der Charité—Universitätsmedizin Berlin. Written informed consent for participation was not required for this study in accordance with the national legislation and the institutional requirements.
Author Contributions
LG, TK, and MS: conceptualization. HD, AB, AL, NS, and BJ: data curation. BF, JB, and LG: formal analysis and methodology. TK and MS: funding acquisition and supervision. MS, HD, AB, AL, and BJ: investigation. JB and MS: validation. BF and JB: visualization. BF, JB, and MS: writing—original draft. All authors writing—review and editing. All authors contributed to the article and approved the submitted version.
Funding
MS was participant in the BIH-Charité Junior Digital Clinician Scientist Program funded by the Charité—Universitätsmedizin Berlin and the Berlin Institute of Health.
Conflict of Interest
The authors declare that the research was conducted in the absence of any commercial or financial relationships that could be construed as a potential conflict of interest.
Publisher's Note
All claims expressed in this article are solely those of the authors and do not necessarily represent those of their affiliated organizations, or those of the publisher, the editors and the reviewers. Any product that may be evaluated in this article, or claim that may be made by its manufacturer, is not guaranteed or endorsed by the publisher.
Acknowledgments
The authors wish to thank Irina Waechter-Stehle and Jrgen Weese from Philips GmbH Innovative Technologies for providing the model, which was used for semi-automatic segmentation of the left ventricle and the aortic valve.
Supplementary Material
The Supplementary Material for this article can be found online at: https://www.frontiersin.org/articles/10.3389/fcvm.2021.706628/full#supplementary-material
References
1. Nishimura RA, Otto CM, Bonow RO, Carabello BA, Erwin JP III, Guyton RA, et al. 2014 AHA/ACC guideline for the management of patients with valvular heart disease: executive summary: a report of the American College of Cardiology/American Heart Association Task Force on Practice Guidelines. J Am Coll Cardiol. (2014) 63:2438–88. doi: 10.1161/CIR.0000000000000029
2. Nkomo VT, Gardin JM, Skelton TN, Gottdiener JS, Scott CG, Enriquez-Sarano M. Burden of valvular heart diseases: a population-based study. Lancet. (2006) 368:1005–11. doi: 10.1016/S0140-6736(06)69208-8
3. Lindman BR, Clavel MA, Mathieu P, Iung B, Lancellotti P, Otto CM, et al. Calcific aortic stenosis. Nat Rev Dis Primers. (2016) 2:16006. doi: 10.1038/nrdp.2016.6
4. Otto CM, Nishimura RA, Bonow RO, Carabello BA, Erwin JP III, Gentile F, et al. 2020 ACC/AHA guideline for the management of patients with valvular heart disease: executive summary: a report of the American College of Cardiology/American Heart Association Joint Committee on Clinical Practice Guidelines. Circulation. (2021) 143:e35–71. doi: 10.1161/CIR.0000000000000932
5. Baumgartner H, Falk V, Bax JJ, De Bonis M, Hamm C, Holm PJ, et al. 2017 ESC/EACTS guidelines for the management of valvular heart disease. Rev Esp Cardiol. (2018) 71:110. doi: 10.1016/j.rec.2017.12.013
6. Hoeijmakers M, Silva Soto DA, Waechter-Stehle I, Kasztelnik M, Weese J, Hose DR, et al. Estimation of valvular resistance of segmented aortic valves using computational fluid dynamics. J Biomech. (2019) 94:49–58. doi: 10.1016/j.jbiomech.2019.07.010
7. Mittal TK, Reichmuth L, Bhattacharyya S, Jain M, Baltabaeva A, Rahman Haley S, et al. Inconsistency in aortic stenosis severity between CT and echocardiography: prevalence and insights into mechanistic differences using computational fluid dynamics. Open Heart. (2019) 6:e001044. doi: 10.1136/openhrt-2019-001044
8. Pawade T, Clavel MA, Tribouilloy C, Dreyfus J, Mathieu T, Tastet L, et al. Computed tomography aortic valve calcium scoring in patients with aortic stenosis. Circ Cardiovasc Imaging. (2018) 11:e007146. doi: 10.1161/CIRCIMAGING.117.007146
9. Clavel MA, Magne J, Pibarot P. Low-gradient aortic stenosis. Eur Heart J. (2016) 37:2645–57. doi: 10.1093/eurheartj/ehw096
10. Weese J, Lungu A, Peters J, Weber FM, Waechter-Stehle I, Hose DR. CFD- and Bernoulli-based pressure drop estimates: a comparison using patient anatomies from heart and aortic valve segmentation of CT images. Med Phys. (2017) 44:2281–92. doi: 10.1002/mp.12203
11. Franke B, Weese J, Waechter-Stehle I, Bruning J, Kuehne T, Goubergrits L. Towards improving the accuracy of aortic transvalvular pressure gradients: rethinking Bernoulli. Med Biol Eng Comput. (2020) 58:1667–79. doi: 10.1007/s11517-020-02186-w
12. Zoghbi WA, Enriquez-Sarano M, Foster E, Grayburn PA, Kraft CD, Levine RA, et al. American society of, recommendations for evaluation of the severity of native valvular regurgitation with two-dimensional and Doppler echocardiography. J Am Soc Echocardiogr. (2003) 16:777–802. doi: 10.1016/S0894-7317(03)00335-3
13. Chew PG, Bounford K, Plein S, Schlosshan D, Greenwood JP. Multimodality imaging for the quantitative assessment of mitral regurgitation. Quant Imaging Med Surg. (2018) 8:342–59. doi: 10.21037/qims.2018.04.01
14. Karimi S, Dabagh M, Vasava P, Dadvar M, Dabir B, Jalali P. Effect of rheological models on the hemodynamics within human aorta: CFD study on CT image-based geometry. J Non-Newton Fluid. (2014) 207:42–52. doi: 10.1016/j.jnnfm.2014.03.007
15. McGraw KO, Wong SP. Forming inferences about some intraclass correlation coefficients. Psychol Methods. (1996) 1:30–46. doi: 10.1037/1082-989X.1.1.30
16. Kolossvary M, Kellermayer M, Merkely B, Maurovich-Horvat P. Cardiac computed tomography radiomics: a comprehensive review on radiomic techniques. J Thorac Imaging. (2018) 33:26–34. doi: 10.1097/RTI.0000000000000268
17. Ginat DT, Gupta R. Advances in computed tomography imaging technology. Annu Rev Biomed Eng. (2014) 16:431–53. doi: 10.1146/annurev-bioeng-121813-113601
18. Pouleur AC, le Polain de Waroux JB, Pasquet A, Vanoverschelde JL, Gerber BL. Aortic valve area assessment: multidetector CT compared with cine MR imaging and transthoracic and transesophageal echocardiography. Radiology. (2007) 244:745–54. doi: 10.1148/radiol.2443061127
19. Taron J, Foldyna B, Eslami P, Hoffmann U, Nikolaou K, Bamberg F. Cardiac computed tomography - more than coronary arteries? A clinical update. Rofo. (2019) 191:817–26. doi: 10.1055/a-0924-5883
20. Nakahara T, Toyama T, Jinzaki M, Seki R, Saito Y, Higuchi T, et al. Quantitative analysis of iodine image of dual-energy computed tomography at rest: comparison with 99mTc-tetrofosmin stress-rest single-photon emission computed tomography myocardial perfusion imaging as the reference standard. J Thorac Imaging. (2018) 33:97–104. doi: 10.1097/RTI.0000000000000284
21. Coenen A, Rossi A, Lubbers MM, Kurata A, Kono AK, Chelu RG, et al. Integrating CT myocardial perfusion and CT-FFR in the work-up of coronary artery disease. JACC Cardiovasc Imaging. (2017) 10:760–70. doi: 10.1016/j.jcmg.2016.09.028
22. Taylor CA, Fonte TA, Min JK. Computational fluid dynamics applied to cardiac computed tomography for noninvasive quantification of fractional flow reserve: scientific basis. J Am Coll Cardiol. (2013) 61:2233–41. doi: 10.1016/j.jacc.2012.11.083
23. Driessen RS, Danad I, Stuijfzand WJ, Raijmakers PG, Schumacher SP, van Diemen PA, et al. Comparison of coronary computed tomography angiography, fractional flow reserve, and perfusion imaging for ischemia diagnosis. J Am Coll Cardiol. (2019) 73:161–73. doi: 10.1016/j.jacc.2018.10.056
24. Minners J, Allgeier M, Gohlke-Baerwolf C, Kienzle RP, Neumann FJ, Jander N. Inconsistencies of echocardiographic criteria for the grading of aortic valve stenosis. Eur Heart J. (2008) 29:1043–8. doi: 10.1093/eurheartj/ehm543
25. Minners J, Allgeier M, Gohlke-Baerwolf C, Kienzle RP, Neumann FJ, Jander N. Inconsistent grading of aortic valve stenosis by current guidelines: haemodynamic studies in patients with apparently normal left ventricular function. Heart. (2010) 96:1463–8. doi: 10.1136/hrt.2009.181982
26. Baumgartner H, Stefenelli T, Niederberger J, Schima H, Maurer G. “Overestimation” of catheter gradients by Doppler ultrasound in patients with aortic stenosis: a predictable manifestation of pressure recovery. J Am Coll Cardiol. (1999) 33:1655–61. doi: 10.1016/S0735-1097(99)00066-2
27. Wong S, Spina R, Toemoe S, Dhital K. Is cardiac magnetic resonance imaging as accurate as echocardiography in the assessment of aortic valve stenosis? Interact Cardiovasc Thorac Surg. (2016) 22:480–6. doi: 10.1093/icvts/ivv362
28. Jaffe WM, Roche AH, Coverdale HA, McAlister HF, Ormiston JA, Greene ER. Clinical evaluation versus Doppler echocardiography in the quantitative assessment of valvular heart disease. Circulation. (1988) 78:267–75. doi: 10.1161/01.CIR.78.2.267
29. Zoghbi WA, Farmer KL, Soto JG, Nelson JG, Quinones MA. Accurate noninvasive quantification of stenotic aortic valve area by Doppler echocardiography. Circulation. (1986) 73:452–9. doi: 10.1161/01.CIR.73.3.452
30. Currie PJ, Seward JB, Reeder GS, Vlietstra RE, Bresnahan DR, Bresnahan JF, et al. Continuous-wave Doppler echocardiographic assessment of severity of calcific aortic stenosis: a simultaneous Doppler-catheter correlative study in 100 adult patients. Circulation. (1985) 71:1162–9. doi: 10.1161/01.CIR.71.6.1162
31. Currie PJ, Hagler DJ, Seward JB, Reeder GS, Fyfe DA, Bove AA, et al. Instantaneous pressure gradient: a simultaneous Doppler and dual catheter correlative study. J Am Coll Cardiol. (1986) 7:800–6. doi: 10.1016/S0735-1097(86)80339-4
32. Parameswaran AC, Reisner D, Amanullah A. Discrepancy between gradients derived by cardiac catheterization and by Doppler echocardiography in aortic stenosis: how often does pressure recovery play a role? Echocardiography. (2009) 26:1000–5; quiz: 999. doi: 10.1111/j.1540-8175.2009.00909.x
33. McWilliams RG, Robertson I, Smye SW, Wijesinghe L, Kessel D. Sources of error in intra-arterial pressure measurements across a stenosis. Eur J Vasc Endovasc Surg. (1998) 15:535–40. doi: 10.1016/S1078-5884(98)80116-0
34. Makkar RR, Thourani VH, Mack MJ, Kodali SK, Kapadia S, Webb JG, et al. Five-year outcomes of transcatheter or surgical aortic-valve replacement. New Engl J Med. (2020) 382:799–809. doi: 10.1056/NEJMoa1910555
35. Runte K, Brosien K, Salcher-Konrad M, Schubert C, Goubergrits L, Kelle S, et al. Hemodynamic changes during physiological and pharmacological stress testing in healthy subjects, aortic stenosis and aortic coarctation patients-a systematic review and meta-analysis. Front Cardiovasc Med. (2019) 6:43. doi: 10.3389/fcvm.2019.00043
Keywords: cardiac computed tomography, aortic stenosis, transvalvular pressure gradient, image-based modeling, reduced order model
Citation: Franke B, Brüning J, Yevtushenko P, Dreger H, Brand A, Juri B, Unbehaun A, Kempfert J, Sündermann S, Lembcke A, Solowjowa N, Kelle S, Falk V, Kuehne T, Goubergrits L and Schafstedde M (2021) Computed Tomography-Based Assessment of Transvalvular Pressure Gradient in Aortic Stenosis. Front. Cardiovasc. Med. 8:706628. doi: 10.3389/fcvm.2021.706628
Received: 07 May 2021; Accepted: 09 July 2021;
Published: 08 September 2021.
Edited by:
Grigorios Korosoglou, GRN Klinik Weinheim, GermanyReviewed by:
Sorin Giusca, GRN Klinik Weinheim, GermanyChristin Tesche, Medical University of South Carolina, United States
Copyright © 2021 Franke, Brüning, Yevtushenko, Dreger, Brand, Juri, Unbehaun, Kempfert, Sündermann, Lembcke, Solowjowa, Kelle, Falk, Kuehne, Goubergrits and Schafstedde. This is an open-access article distributed under the terms of the Creative Commons Attribution License (CC BY). The use, distribution or reproduction in other forums is permitted, provided the original author(s) and the copyright owner(s) are credited and that the original publication in this journal is cited, in accordance with accepted academic practice. No use, distribution or reproduction is permitted which does not comply with these terms.
*Correspondence: Marie Schafstedde, c2NoYWZzdGVkZGVAZGh6Yi5kZQ==
†These authors have contributed equally to this work and share first authorship