 Peter Loof Møller1
 Palle D. Rohde2
 Simon Winther3
 Peter Breining1,4Louise Nissen3
 Anders Nykjaer1,4Morten Bøttcher3
 Mette Nyegaard1,5*†
 Mads Kjolby1,4,6,7†
- 1Department of Biomedicine, Aarhus University, Aarhus, Denmark
- 2Department of Chemistry and Bioscience, Aalborg University, Aalborg, Denmark
- 3Department of Cardiology, Gødstrup Hospital, NIDO, Herning, Denmark
- 4PROMEMO and DANDRITE, Aarhus University, Aarhus, Denmark
- 5Department of Health Science and Technology, Aalborg University, Aalborg, Denmark
- 6Department of Clinical Pharmacology, Aarhus University Hospital, Aarhus, Denmark
- 7Steno Diabetes Center Aarhus, Aarhus University Hospital, Aarhus, Denmark
Genetic variants in the genomic region containing SORT1 (encoding the protein sortilin) are strongly associated with cholesterol levels and the risk of coronary artery disease (CAD). Circulating sortilin has therefore been proposed as a potential biomarker for cardiovascular disease. Multiple studies have reported association between plasma sortilin levels and cardiovascular outcomes. However, the findings are not consistent across studies, and most studies have small sample sizes. The aim of this study was to evaluate sortilin as a biomarker for CAD in a well-characterized cohort with symptoms suggestive of CAD. In total, we enrolled 1,173 patients with suspected stable CAD referred to coronary computed tomography angiography. Sortilin was measured in plasma using two different technologies for quantifying circulating sortilin: a custom-made enzyme-linked immunosorbent assay (ELISA) and OLINK Cardiovascular Panel II. We found a relative poor correlation between the two methods (correlation coefficient = 0.21). In addition, genotyping and whole-genome sequencing were performed on all patients. By whole-genome regression analysis of sortilin levels measured with ELISA and OLINK, two independent cis protein quantitative trait loci (pQTL) on chromosome 1p13.3 were identified, with one of them being a well-established risk locus for CAD. Incorporating rare genetic variants from whole-genome sequence data did not identify any additional pQTLs for plasma sortilin. None of the traditional CAD risk factors, such as sex, age, smoking, and statin use, were associated with plasma sortilin levels. Furthermore, there was no association between circulating sortilin levels and coronary artery calcium score (CACS) or disease severity. Sortilin did not improve discrimination of obstructive CAD, when added to a clinical pretest probability (PTP) model for CAD. Overall, our results indicate that studies using different methodologies for measuring circulating sortilin should be compared with caution. In conclusion, the well-known SORT1 risk locus for CAD is linked to lower sortilin levels in circulation, measured with ELISA; however, the effect sizes are too small for sortilin to be a useful biomarker for CAD in a clinical setting of low- to intermediate-risk chest-pain patients.
Introduction
Coronary artery disease (CAD) is a common complex disease with a strong genetic contribution. A large number of genome-wide association studies (GWASs) have been conducted to identify risk loci and genes involved in the development of early onset myocardial infarction (1, 2), various aspects of atherosclerosis (3–6), and low-density lipoprotein (LDL) cholesterol levels (7–10). Since 2007, several new candidate genes affecting LDL cholesterol have been identified by GWAS, including the SORT1 locus (7).
The SORT1 locus on chromosome 1p13.3 is broad and comprises the genes CELSR2-PSRC1-MYBPHL-SORT1. The majority of LDL cholesterol–associated single-nucleotide polymorphisms (SNPs) are located in the intergenic region between PSRC1 and CELSR2, and downstream of SORT1 and MYBPHL (11). In addition, SNPs in the same genomic region have been found to convey changes in transcript levels of SORT1, CELSR2, and PSRC1 (12). Fine-mapping studies have found that genetic variants in the major (risk) haplotype block containing rs599834, rs646776, rs629301, and rs12740374 are associated with lower SORT1, CELSR2, and PSRC1 transcript levels in the human liver (12, 13). Thus, it is difficult to exactly pinpoint which gene(s) is(are) responsible for the risk of developing CAD, although it is believed that the CAD risk variant at 1p13.3 alters the levels of sortilin in the liver (12).
Apart from being strongly associated with plasma LDL cholesterol levels, the SORT1 locus is also associated with CAD (3, 5, 6, 8, 14–17) and a wide range of different vascular subphenotypes including early-onset myocardial infarction (1, 2), coronary stenosis (5, 8), coronary artery calcification (6), abdominal aorta aneurysm (4), and aortic valve calcification (18). These associations are likely an effect of increased LDL cholesterol. Sortilin binds ApoB to facilitate hepatic export of very low-density lipoprotein in mouse models (19). Sortilin also augments PCSK9 secretion and increases the development of atherosclerosis (12, 19–21). Animal and cell studies demonstrate that sortilin also has a cholesterol-independent effect on atherosclerosis, where sortilin is involved in inflammation and calcification of the vessel wall (22, 23).
In addition to the liver, sortilin is also expressed in tissues that are involved in atherosclerosis development, including smooth muscle cells and macrophages (19, 22, 23). Notably, it is released from smooth muscle cells as a full-length receptor in extracellular vesicles (23), but also liberated from thrombocytes in a soluble form comprising the entire extracellular domain upon activation and degranulation (24). The biological functions of the vesicular and soluble receptor isoforms remain unknown.
Regardless of the source of varying levels of circulating sortilin, it has been proposed as a potential biomarker for cardiovascular diseases. Several studies have found association between plasma sortilin and various cardiovascular phenotypes, such as statin efficacy (25), PCSK9 levels (21, 25), CAD (24, 26), major adverse cardiovascular event risk (27), aortic calcification (27), and peripheral artery disease (28), but not with LDL cholesterol (29).
In this study, we measured plasma sortilin using two different methods in a cohort of low- to intermediate-risk patients (n = 1,173) with symptoms suggestive of CAD. All patients were referred to coronary computed tomography angiography (CTA) and are thus well-characterized with respect to coronary calcium score and clinical variables. Sortilin was measured using OLINK Cardiovascular Panel II (CVD II) and a high-sensitivity sortilin enzyme-linked immunosorbent assay (ELISA) developed in-house. The aim of this study was to evaluate sortilin as a biomarker for CAD in a well-characterized cohort by (1) identifying genetic variants associated with variation in plasma sortilin level, (2) analyzing the effect of common clinical risk factors for CAD on sortilin levels, (3) investigating the association of sortilin with coronary calcium score and CAD severity, and (4) testing if circulating sortilin could improve risk stratification of patients with symptoms of CAD.
Materials and Methods
Cohort Description
The study design of the Dan-NICAD 1 trial has been described previously (30, 31). In short, Dan-NICAD 1 is a prospective, multicenter, cross-sectional study including patients with low to intermediate pretest probability (PTP) of CAD, no previous history of CAD, and referred to coronary CTA because of symptoms suggestive of CAD, as evaluated by a cardiologist. Patients with signs of obstructive CAD by coronary CTA were referred to invasive coronary angiography (ICA) with fractional flow reserve (FFR) measurements to verify suspected obstructions. Obstructive CAD was defined as an FFR of <0.80 or as high-grade stenosis (>90% diameter stenosis) by visual assessment. Major exclusion criteria were age younger than 40 years and eGFR <40 mL/min.
Blood samples from all participants were drawn in connection with the coronary CTA. EDTA and heparin plasma were isolated and stored at −80°C. Of the full Dan-NICAD 1 trial comprising 1,675 patients, heparin plasma was available for 1,173 patients for ELISA. The OLINK CVD II panel was analyzed on the full cohort. To ensure head-to-head comparison of the two sortilin datasets, we included only the 1,173 consecutive patients, which had sortilin information from both methods. The study protocol was approved by the regional research ethical committee, and written consent was obtained.
Coronary CTA and Invasive Angiography
All scans were performed on a 320-slice volume CT scanner (Aquilion One; Toshiba Medical Systems, Japan) in accordance with usual clinical guidelines. Imaging analysis included an Agatston coronary artery calcium score (CACS) and visual evaluation of luminal diameter stenosis estimation in each coronary segment. CAD severity at CTA was classified by diameter stenosis reduction in all segments with a reference vessel diameter >2 mm as no CAD: 0%; mild CAD: 1 to <30%; moderate CAD: >30 to <50%; and severe CAD: ≥50% diameter stenosis reduction.
Approximately 4 weeks after the coronary CTA, ICA was performed in patients with a suspected severe CAD at coronary CTA. ICA with FFR was performed in all segments with a 30–90% diameter stenosis at the ICA. Two-dimensional quantitative coronary analysis (QCA) was performed in an independent core laboratory (ClinFact, Leiden, the Netherlands). Hemodynamically obstructive CAD was defined as high-grade stenosis by visual assessment (>90% diameter stenosis) or by an ICA-FFR ≤0.80 in a vessel of ≥2.0-mm diameter. If ICA-FFR was indicated but not technically possible, QCA-based stenosis assessment was used with a cutoff of ≥50% diameter reduction. All other patients, including patients without severe CAD at coronary CTA, were classified as having no hemodynamically obstructive CAD.
Protein Measurements
Levels of circulating sortilin were quantified using the OLINK platform and a high-sensitivity ELISA assay developed in-house. Plasma was collected at two different geographical locations (collection sites) in Denmark over a period of 2 years (30).
OLINK
EDTA plasma samples in 96-well matrix tubes were shipped to OLINK proteomics AB (Uppsala, Sweden) on dry ice for analysis using the proximity extension assay (PEA) technology. Levels of 92 proteins from the CVD II panel were measured, among them sortilin. Samples were replated and randomly distributed across assay plates at the OLINK analysis facility to allow for control of technical batch effects. The final assay read-out was Normalized Protein eXpression (NPX) values, which is an arbitrary unit on a log2 scale where high values correspond to higher protein levels. Using an internal extension control and an interpolate control, data quality was controlled and normalized. All assay validation data are available on the manufacturer's website (www.olink.com).
High-Sensitivity Custom-Made ELISA
Heparin plasma was thawed and measured using a custom-made ELISA against human soluble sortilin. In short, 96-well plate Nunc Maxisorp was coated with anti–human soluble sortilin [custom made against EC domain as described by Petersen et al. (32)] 1 μg per well in 55 mM NaHCO3 pH 9.8. The wells were subsequently blocked with 5% bovine serum albumin (BSA) (Sigma A7888) in phosphate-buffered saline (PBS) (pH 7.4). Washing was done in PBS-T (pH 7.4). Sample, internal control, and standard were incubated overnight at 4°C. Standard curve was made from 0.625 to 160 ng/mL of purified human soluble sortilin (21). The in-house generated detection antibody (MABN1792, Sigma) was diluted in PBS-T with 1% BSA to 1 μg/mL. One hundred microliters of the solution was added to each well and allowed to incubate at 37°C for 1 h. Finally, plates were incubated with peroxidase-conjugated goat anti–mouse immunoglobulin G (Dako) for 30 min at room temperature and rinsed five times before addition of o-phenylenediamine dihydrochloride (Dako) mixed with hydrogen peroxide. The reaction was stopped using 0.5 M sulfuric acid, and absorbance was subsequently measured at 490 nm.
To investigate if the anticoagulant used (heparin vs. EDTA) affected the measurable sortilin level, a subset of 44 Dan-NICAD individuals was randomly selected. In a paired design, sortilin was measured again in both EDTA and heparin plasma samples using the same approach as described above.
Normalization of Protein Levels
For EDTA plasma, variation linked to collection site (Supplementary Figure 1A) and OLINK analysis plate (Supplementary Figure 1B) was observed. For heparin plasma, variation linked to analysis plate (custom-made ELISA) was observed (Supplementary Figure 2). To account for the observed batch effects, the raw data were adjusted using linear regression. In this process, the sortilin measurements were first normalized using rank inverse (to obtain normality) and then adjusted for covariates [sex, age, age2, collection box ID, average protein level for OLINK CVD panels II and III (only for OLINK), and ELISA plate ID (only for ELISA)] using linear regression, and finally the adjusted values were once again normalized using rank inverse to address deviations from normality (Supplementary Figure 3).
Genetic Data
Genotyping
Genomic DNA was isolated from frozen whole blood collected in 4 mL EDTA tubes. Genotyping was performed at deCODE Genetics using the Illumina Global Screening Array (Illumina, Inc., San Diego, CA). Quality control was performed in PLINK 1.9 (33) according to Marees et al. (34), accounting for individual and SNP missingness (–geno 0.02, –mind 0.02), sex discrepancy (–check-sex), minor allele frequency (–maf 0.05), and deviation from Hardy–Weinberg equilibrium (–hwe 1 × 10⁻⁶), resulting in 310,531 autosomal genetic variants. To account for cryptic relatedness, first- and second-degree relatives were identified based on identity by descent () computed by PLINK 1.9 (one sample was removed). Multidimensional scaling by PLINK was applied to identify ancestral outliers (26 samples removed).
Imputation
Imputation was performed using the Michigan Imputation Server (35) based on 310,531 genotyped variants (reference panel HRC: r1.1.2016 GRCh37). SNPs with minor allele frequency below 0.05, missing genotype rate larger than 5%, deviation from Hardy–Weinberg equilibrium (P < 1 × 10⁻⁶), and imputation quality below 0.9 were removed, resulting in a total of 4,658,994 autosomal genetic variants, with positions annotated to genome build GRCh37.
Whole-Genome Sequencing
Whole-genome sequencing was performed using paired end sequencing with an average depth of 30 on the Illumina NovaSeq 6000 sequencing platform at deCODE genetics. Reads were processed in the quality control pipeline described by Jónsson et al. (36). A total of 52,783,013 autosomal variants were detected in the whole-genome sequencing data.
Variance Explained by Common Genetic Variants
The proportion of variation in circulating sortilin that can be explained by common genetic variants, , was estimated with genomic restrict maximum likelihood as implemented in the qgg package (37). First, the additive genomic relationship matrix was constructed as , where W is the centered and scaled genotype matrix, and m is the number of genotypes (m = 4,658,994) (38). Next, variance components from the linear mixed model were estimated: y = Xb + Zg + e, where y is a vector of phenotypes (i.e., either sortilin level by OLINK or ELISA), X and Z are design matrices linking the predicted fixed effects () and the estimated random effects () to the phenotype, and e is the remaining unexplained residuals. The included fixed effects were the same set of covariates as used in the genetic association analysis. The estimate of was determined as , where and are the estimated variance components of the random effects; , , where I is an identity matrix (assuming uncorrelated residuals) (37, 39).
Protein Quantitative Trait Loci Analysis
To investigate if specific loci in the genome were associated with circulating sortilin levels, a protein quantitative trait loci (pQTL) analysis was performed, testing the association of 4,658,994 autosomal genetic variants with circulating sortilin levels using PLINK 2.0 (33). Prior to the analysis, genetic principal components were computed in PLINK using a set of high-quality autosomal genotyped variants (m = 310,531), to investigate if there remained any population stratification in the reduced set of individuals. Expectedly, as the Danish population is remarkably homogeneous (40), and we have removed ancestral outliers, we found no significant association between genetic principal components and sortilin levels; therefore, these were not included in pQTL analysis.
To test if additional pQTLs could be discovered by analyzing all variants identified from whole-genome sequencing, per-chromosome VCF files were converted to PLINK binary format followed by association analysis using PLINK 2.0 (33). In total 52,783,013 autosomal variants were analyzed for association with sortilin level, with a genome-wide significance threshold of P < 5 × 10⁻⁸. In addition to the single point analysis, a burden test of rare variants was conducted using the MUMMY pipeline (41), which builds on SMMAT, which performs a burden test, SKAT, SKAT-O, and a hybrid test combining burden testing and SKAT (42). In short, a GRM was calculated using GCTA (43), VCF files were converted to GDS files, and a list of all variant sites was created and filtered to include only variants with an allele frequency <0.05. Subsequently, two different strategies were applied. The first approach kept only severe variants (Ensembl most severe consequence stronger than missense) and grouped them by gene. The second approach included only coding variants weighted by CADD score.
Association of Patient Characteristics With Sortilin Levels
To establish the effect of a wide range of patient characteristics on circulating plasma sortilin level, a multiple linear regression on sortilin levels was performed, including patient characteristics, cardiac symptoms, risk factors, biochemistry measurements, and results from coronary CTA (Table 1).
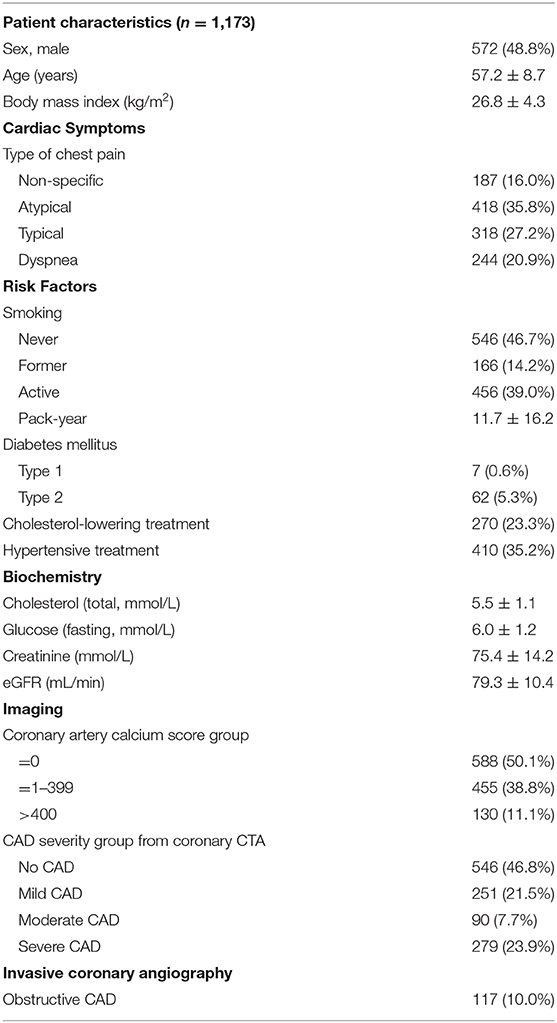
Table 1. Cohort description (n = 1,173).
Effect of Sortilin on Risk Stratification
PTP for CAD was calculated as previously described (44, 45) based on clinical risk factors including sex, age, angina symptoms, and number of risk factors (i.e., family history of early CAD, smoking, dyslipidemia, hypertension, and/or diabetes).
The prediction accuracy for CAD severity groupings and obstructive CAD was determined using PTP as baseline, which then was compared to models that included circulating plasma sortilin levels quantified by either OLINK or ELISA. The accuracy of prediction was assessed using fivefold cross-validation, in which the entire data first were divided in five folds. For CAD severity groups, we used a linear model for approximation, and for obstructive CAD, a logistic regression was applied. For both disease end points, the general model was y=Xb+e, where the response variable was either CAD severity group or the binary disease outcome, X was the design matrix, and b was the vector of parameter estimates (i.e., coefficients of intercept, PTP, and sortilin by OLINK or ELISA), and e was the remaining residual. For each combination of four folds, the parameters were estimated (t) and used to predict the outcome of the individuals (v) in the fold not used in the training of the model parameter, . The prediction accuracy of CAD severity group was determined using Pearson correlation coefficient between predicted value and observed CAD severity groups, and the accuracy of discriminating CAD cases was determined by the area under the receiver operating characteristic curve (AUC) as implemented in the qgg package (37).
Results
Patient Cohort
The cohort comprised 1,173 individuals in the age range 40 to 80 years, all referred to a CT scan for investigation for CAD, primarily due to chest pain. Of the 1,173 patients, 117 patients (10%) were diagnosed with obstructive CAD at ICA, with an equal distribution of disease cases across age classes (Supplementary Figure 4A). Overall, 6% of females and 15% of males in the cohort were diagnosed with obstructive CAD (Supplementary Figure 4B). Those diagnosed with obstructive CAD were on average older than those not diagnosed with CAD (Supplementary Figure 4C). The baseline characteristics of the cohort can be found in Table 1.
Circulating Sortilin Levels
In a high-sensitivity ELISA assay, the mean sortilin plasma level was 30.99 ng/mL [95% confidence interval (CI) = 30.21–31.76 ng/mL] prior to adjustment and normalization. As OLINK only provides relative protein levels, the actual sortilin plasma levels between assays cannot be readily compared. However, when comparing the actual levels quantified by ELISA with the relative levels by OLINK, a rather poor correlation coefficient of ρ = 0.21 (P ≪ 0.001) was observed (Figure 1A). To explore if the anticoagulant used could explain part of the difference between the assays, we performed ELISA on paired heparin and EDTA plasma samples from 44 randomly selected Dan-NICAD individuals. While we find variation in the absolute level of sortilin between heparin and EDTA plasma for single individuals, we find on average no systematic difference between EDTA and heparin plasma. The correlation coefficient was ρ = 0.75, and slope = 0.97, indicating no systematic difference (Figure 1B).
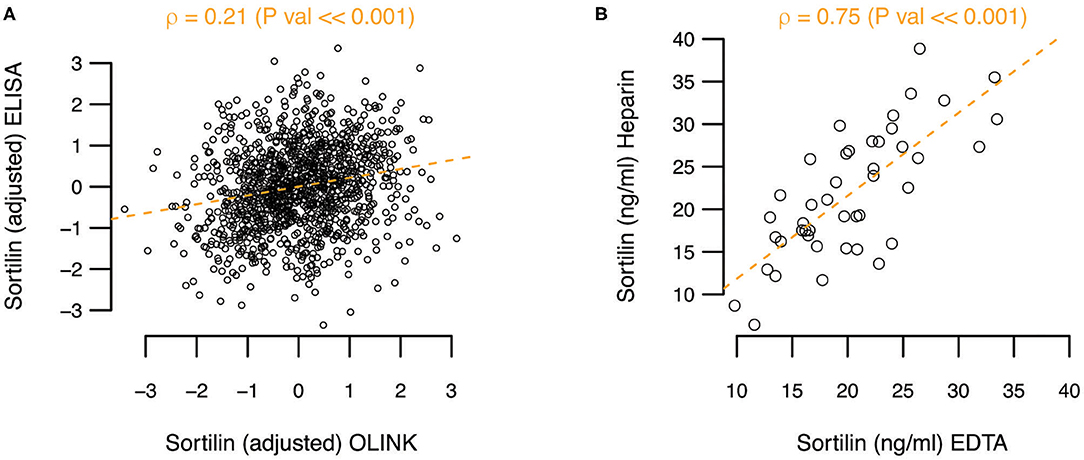
Figure 1. (A) Adjusted sortilin level from ELISA as function of adjusted sortilin level from OLINK. Pearson correlation coefficient (ρ) with significance level is noted above the plot. (B) Comparison of sortilin level measured with ELISA on paired heparin and EDTA plasma samples.
Genetic Analysis of Circulating Sortilin
To investigate how much of the variation observed in sortilin was explained by genetic variation, the SNP heritability () was estimated. None of the observed variation could be attributed to genetic variation as the estimates for sortilin measured with OLINK and ELISA were = 1.4 × 10⁻⁹ (SE = 0.23) and = 9.4 × 10⁻¹⁰ (SE = 0.23), respectively.
Whole-genome regressions were performed to identify genetic variants associated with variation in sortilin levels. One pQTL for circulating sortilin measured with OLINK was identified on chromosome 1p13.3 with index SNP rs11590351 (P = 2.1 × 10⁻¹¹) (Figure 2), and another pQTL using the ELISA data was identified also on chromosome 1p13.3 with the index SNP rs602633 (P = 2.1 × 10⁻¹¹) (Figure 2). Interestingly, the two pQTLs are located on either side of SORT1 and is not within the same LD block (Figure 3). The OLINK pQTL is positioned upstream of SORT1, with the minor allele (C, MAF = 0.25) being associated with decreased sortilin, whereas the ELISA pQTL is located downstream of SORT1 where the minor allele (T, MAF = 0.25) is associated with increased sortilin (Figures 2, 3). The index variant for ELISA, rs602633, is also the index variant for CAD, with the major allele, G, being the risk variant (16).
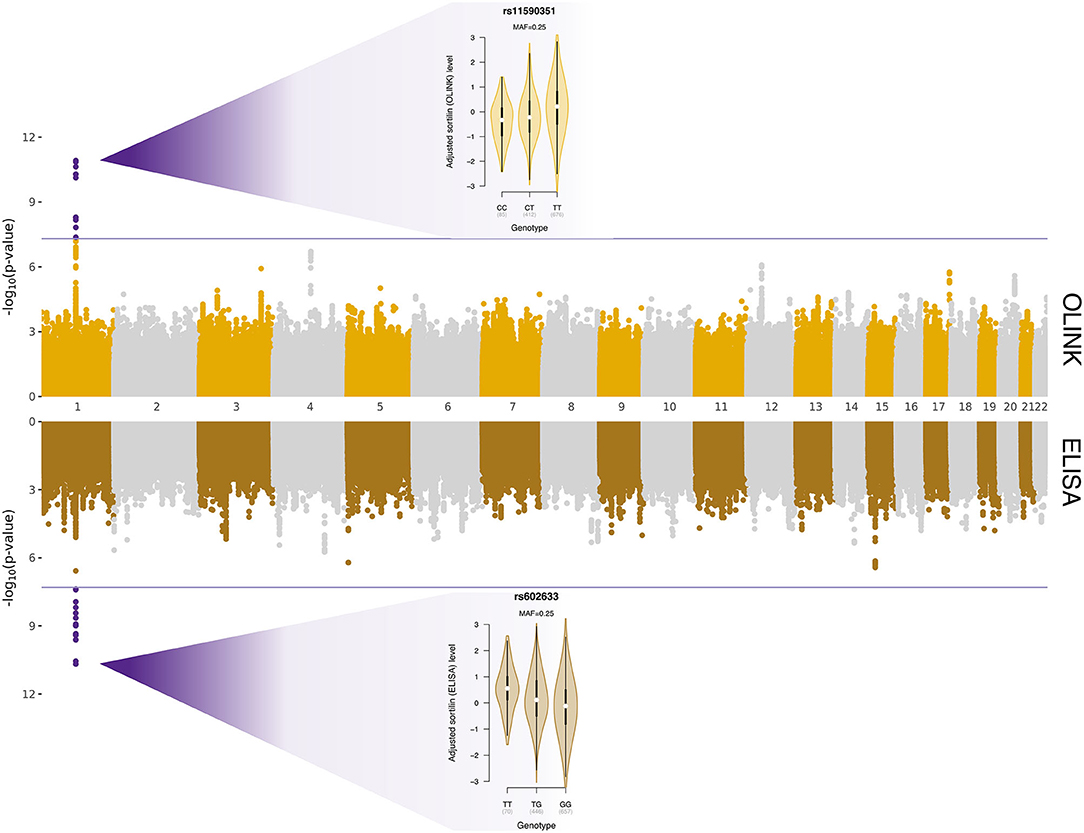
Figure 2. Protein quantitative trait loci for variation in sortilin level quantified with OLINK (top panel) and ELISA (bottom panel). The x-axis is chromosomal position, and the y-axes show the negative logarithm base-10 to the P-values from regression of circulating sortilin level on 4,658,994 autosomal genetic variants. The horizontal lines indicate the genome-wide significant threshold of 5 × 10⁻⁸, and points highlighted in purple are genetic variants surpassing this threshold. The two violin plots show the association between adjusted sortilin level and genotypes for the two identified cis-pQTLs.
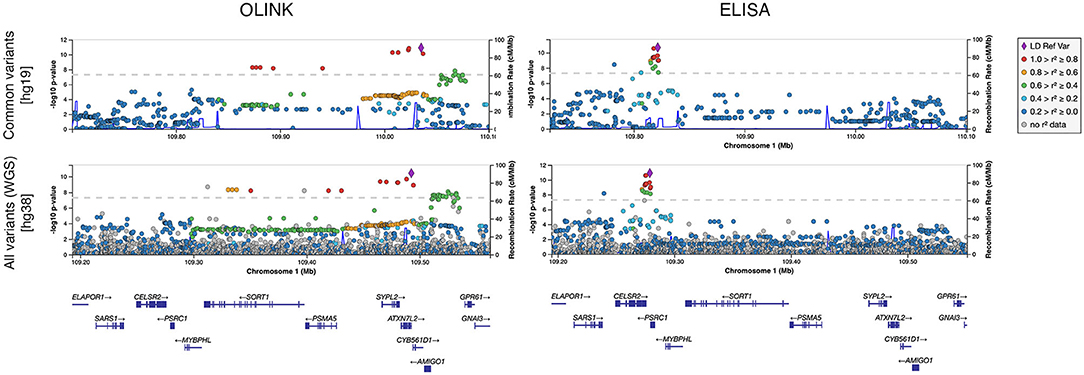
Figure 3. Regional plot of pQTLs identified for sortilin measured with OLINK and ELISA for common variants (MAF >0.05) and for all segregating variants identified by whole-genome sequencing (WGS).
Rare variant analysis identified 23,833 variants with more severe consequences than missense across 7,003 genes (median of two variants per gene) (Supplementary Figure 5). Limiting the analysis to coding variants weighted by CADD score identified 1,052,840 variants across 17,913 genes (median of 48 variants per gene). Neither of the two rare variants analyses found any significant associations between variants and circulating sortilin levels (Supplementary Figure 6). Analysis of all WGS variants individually did not provide any additional information on the molecular genetic basis of variation in circulating sortilin (Figure 3).
Effect of Patient Characteristics on Sortilin Levels
A multiple linear regression, testing for the effect of a number of patient characteristics, showed no significant effect of any of the tested variables (Figure 4). Importantly, no correlation was seen between sortilin levels and CACS (CACS group) or disease severity (CAD severity group) for either of the methods.
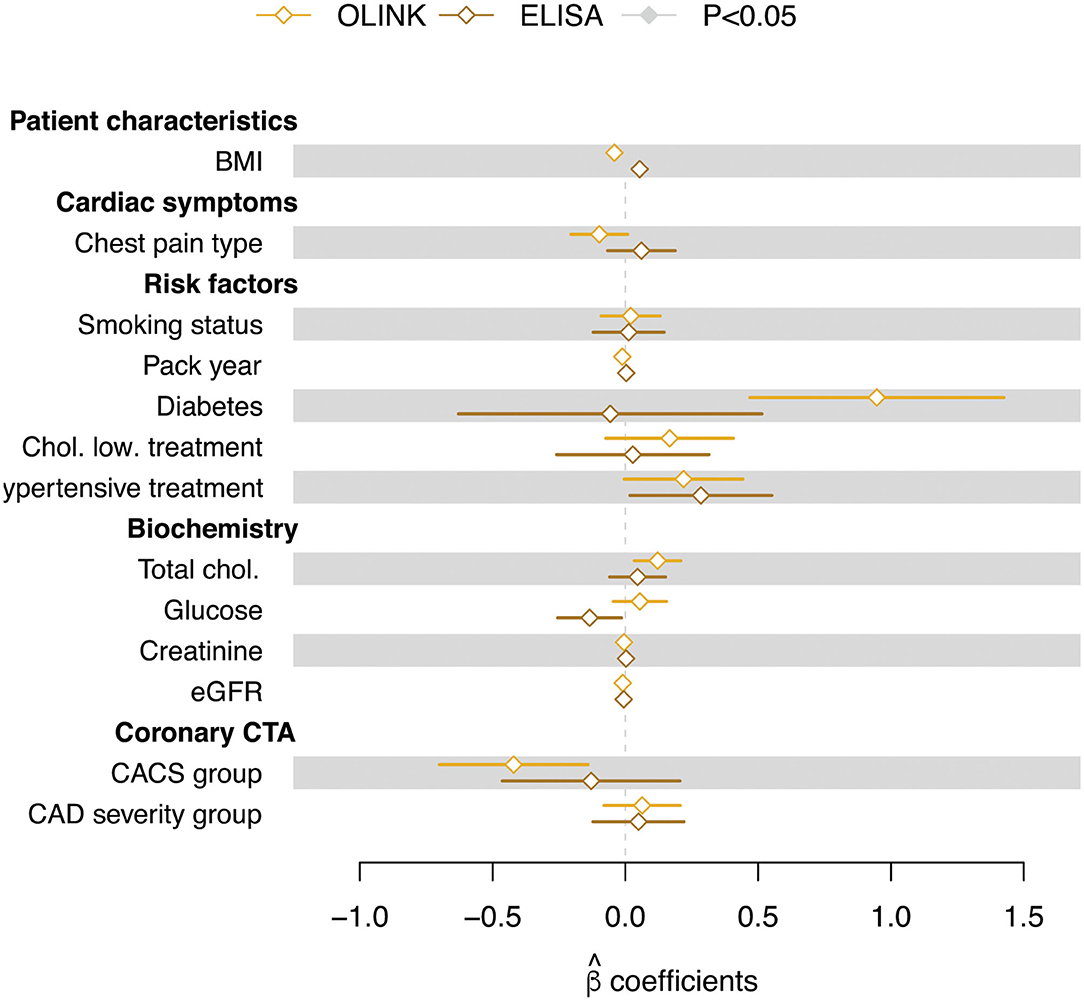
Figure 4. Regression coefficients (β estimates) from multiple linear regression of circulating sortilin (adjusted values) measured with OLINK and ELISA technologies. Error bars indicate the standard error on the estimate. Filled symbols indicate that the β estimates are significantly different from zero.
Sortilin and Risk Stratification
To test if sortilin could provide an improvement in risk stratification of patients in addition to the traditional risk factors, we calculated the PTP for obstructive CAD with and without sortilin. The PTP calculated from traditional risk factors had, as expected, modest predictive power in stratifying patients in the four groups of increasing CAD severity (Pearson correlation ρ = 0.39, Figure 5). Including plasma sortilin levels from either OLINK or ELISA did not improve the predictive accuracy (Figure 5). The PTP had a mean accuracy for discriminating obstructive CAD evaluated with AUC of 0.72 (95% CI = 0.66–76) (Figure 6), which was marginally lower when including circulating sortilin (Figure 6).
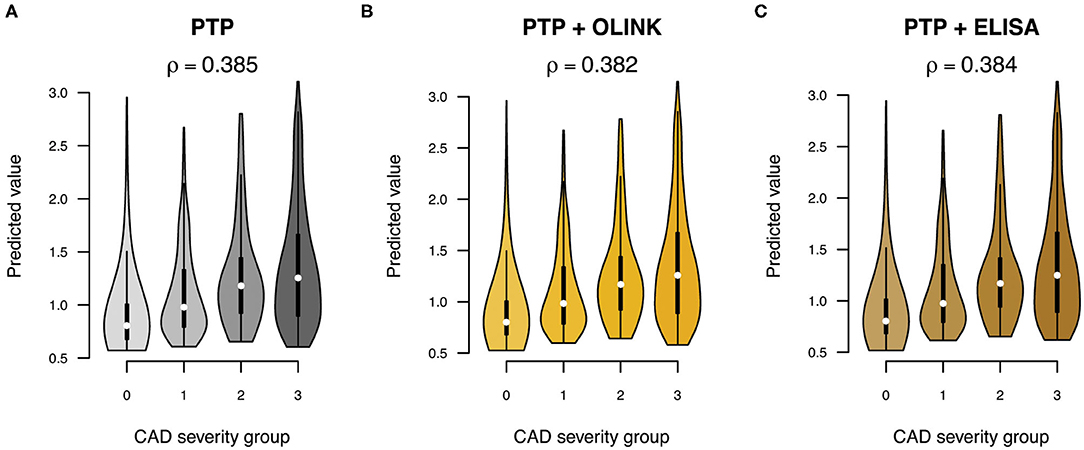
Figure 5. Prediction of CAD severity (0: no CAD, 1: mild CAD, 2: moderate CAD, 3: severe CAD) using (A) pretest probability (PTP) without and with sortilin measurements by (B) OLINK and (C) ELISA. The overall correlation (ρ) between predicted value and CAD severity group across the five validation sets is indicated above each plot.
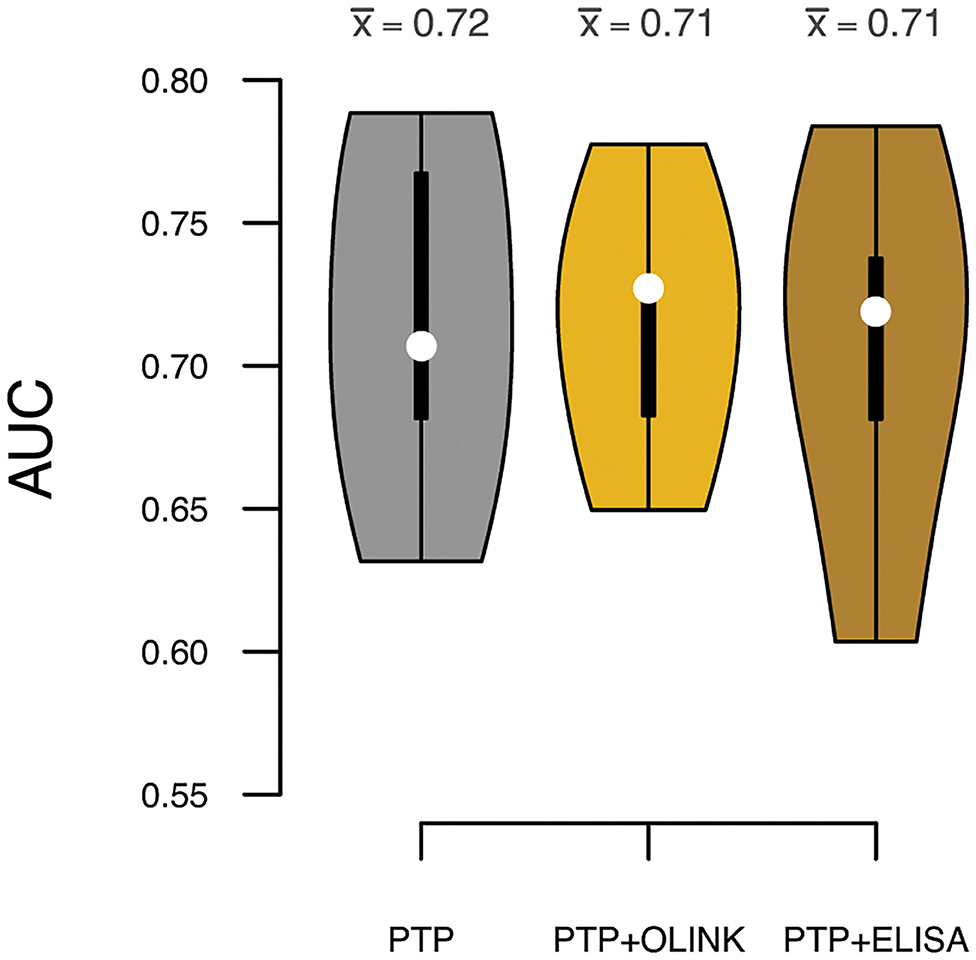
Figure 6. Prediction accuracies measured by area under the receiver operating characteristic curve (AUC) for discrimination of obstructive CAD. White dots indicate median AUC across the five validation sets, and the mean AUC () for each model is indicated above each violin. Predictions were based on the pretest probability (PTP) with and without sortilin measurements by OLINK and ELISA.
In summary, we have found two independent cis-pQTLs for soluble sortilin, where the pQTL downstream of SORT1 is colocalized with the CAD risk locus. However, we found no correlation between sortilin and CAD severity or coronary artery calcification, and no improvement in risk stratification for CAD, when adding sortilin on top of clinical risk factors, in patients suspected of CAD.
Discussion
In this study, we investigated in a large well-described low- to intermediate-risk chest-pain cohort whether variation in plasma levels of soluble sortilin was under genetic influence and explored the added value of including soluble sortilin in risk stratification of patients with suspected CAD.
We identified two independent cis-pQTLs on chromosome 1p13.3 for circulating plasma sortilin measured with ELISA and OLINK (Figures 2, 3). For the pQTL downstream of SORT1, the lead SNP was rs602633; we found that the major G allele was associated with lower sortilin in plasma, which is in line with the well-known directional effect observed in the human liver (12), where the major G allele is associated with lower SORT1 transcript levels. As the major G allele of rs602633 in large GWASs is strongly associated with higher LDL cholesterol (16, 46), one would expect lower sortilin levels in the plasma in individuals with CAD.
The few published studies investigating sortilin levels in smaller CAD study populations find either a positive or negative correlation (24, 26). In a cross-sectional study with 31 CAD patients and 116 healthy controls, Oh et al. (26) found higher levels of plasma sortilin in patients with CAD. In contrast, a study by Ogawa et al. (24) with 91 CAD patients and 189 healthy controls found lower plasma sortilin in CAD patients. Both studies used ELISA to detect sortilin. In the Dan-NICAD cohort, we were not able to detect any significant association between circulating sortilin and CAD.
We found a relatively low correlation between sortilin levels measured using two different methods applied. The reason for this can be assay or sample dependent. To our knowledge, there have not been any published studies comparing measurement of sortilin in ELISA (gold standard) and OLINK or other discovery platforms head-to-head. Differences between ELISA of specific analytes and various omics platforms, such as SOMAscan, Luminex xMAP, Myriad RBM, and OLINK, have been widely observed (47). Raffield et al. compared 20 different proteins measured using the Luminex xMAP and the SOMAscan platform and found that the correlations range from −0.13 to 0.97 between proteins, and nearly half had a correlation coefficient of <0.5. Furthermore, Raffield et al. compared pQTL analyses on the same cohort (SPIROMICS and COPDGene) measuring the same proteins but with different methods (Myriad RBM or OLINK and SOMAscan) (47) and found this affected the ability to detect cis-pQTLs. Additionally, there was very low correlation between proteins measured with the various methods in 20–40% of cases. It is clear that many of the high-throughput discovery methods such as OLINK, Myriad RBM, and SOMAscan need further validation by more conventional methods with true quantification, such as ELISA. In the OLINK assay, heparin plasma was used, whereas in the high-sensitivity ELISA assay, EDTA plasma was used. Thrombocytes contain sortilin (24), and neither heparin nor EDTA completely inhibited degranulation of thrombocytes (48). The degranulation is most pronounced in serum (24). Therefore, the anticoagulant may have affected the levels of sortilin in plasma. We did, however, not find on average any systematic difference between EDTA and heparin plasma when measuring paired EDTA and heparin samples with ELISA (Figure 1B).
Although both assays measure plasma sortilin, the detection is by different means. OLINK relies on the PEA technology, which uses a matched pair of monoclonal antibodies, each tagged with a unique DNA sequence. When the two antibodies bind sortilin, the DNA tags get into proximity and can hybridize, and a quantitative polymerase chain reaction can be performed. The output of OLINK is therefore relative NPX values on a log2 scale. In contrast, the ELISA method relies on coating of plates with polyclonal antibody, recognizing several isoforms in sortilin. Detection is with a monoclonal antibody and a secondary horseradish peroxidase–coupled antibody. Each plate includes a standard curve with samples of known sortilin concentration, allowing for absolute quantification of sortilin levels. As both techniques are based on antibody detection, one can speculate that posttranslational modifications of sortilin, such as glycosylation or carbamoylation, may have an impact on the detection efficacy, as this can mask epitopes, and may impact the assays differently. To determine if posttranslational modifications are responsible for the low correlation between the two assays, it will require further analyses including Western blotting and mass spectometry, which is beyond the scope of this study.
The variation found in sortilin levels in human plasma was not explained by traditional risk factors for CAD. Furthermore, the GWAS of plasma sortilin levels identified two independent cis-pQTLs (one for each of the platform used) at 1p13.3, where SORT1 resides. The rare variant analyses did not detect any additional pQTLs. The source of sortilin in plasma may be a result of shedding from various tissues as sortilin is ubiquitously expressed (19, 22, 49–51). Sortilin may also be present in plasma as extracellular vesicles secreted by smooth muscle cells (23) or can be released from degranulated thrombocytes (24). The main source of variation is currently unknown, and the genetic contribution is low.
The lead pQTL SNPs for OLINK and ELISA sortilin were located upstream and downstream of SORT1, respectively. As the two loci were genetically uncoupled, this could indicate the existence of at least two regulatory sequences upstream and downstream of the SORT1 gene. Two large pQTL studies on OLINK proteins have been published (52, 53). One study investigated 1,992 individuals on OLINK CVD II panel (includes sortilin) on EDTA plasma. Recently, a second large pQTL study was published comprising 1,328 individuals on the CVD II panel on serum samples. Bretherick et al. (53), were able to detect a cis-pQTL for sortilin in plasma at rs7528419, which is in strong LD with our lead SNP. Gilly et al. (52), however, were not able to detect any pQTL for serum sortilin. It is well-known that sortilin (among other proteins) can be released from degranulating thrombocytes, especially in serum (24). This is likely why a pQTL is not detected by Gilly et al. (52). Further evidence for the cis-pQTL downstream of SORT1 for plasma sortilin, i.e., rs646776 and rs12740374, was found in other studies based on Luminex platform (54) and SOMAscan (55). None of the studies validated the findings using more than one platform.
As elevated total cholesterol and diabetes often are highly correlated, it was not surprising that we observed a tendency of non-zero regression estimates for both total cholesterol level and diabetes status. That diabetes status and elevated cholesterol showed a tendency of being associated with increased sortilin level in plasma is in agreement with sortilin being involved in glucose homeostasis (56, 57) and that diabetes subjects have previously been shown to have elevated sortilin levels (28). However, this positive correlation was not identified with ELISA. Diabetes does involve random glycosylation of proteins, and it is possible that this influences the detection efficacy in the above assays. Although obesity is a major risk factor of CAD, and sortilin is highly expressed in adipocytes (58), plasma sortilin levels weakly and negatively correlate (OLINK) with body mass index in our current study. No correlation was detected in ELISA. Additionally, even though plasma sortilin and liver sortilin seem to be regulated in the same direction by the major allele, this is not true for fat tissue (12). As there are many possible sources of sortilin in plasma, it does seem that fat is not a major source of sortilin.
The ability to accurately stratify patients with symptoms of CAD is challenging, and most stratification models rely on classical risk factors, such as age, sex, and symptoms (59), and degree of artery calcification (45). With the recent developments in omic's technologies, much effort has been put into combining traditional risk factors with omic's derived risk scores, which has so far shown some increased accuracy in discriminating healthy from affected patients (60–62). We used the PTP with and without sortilin measurements to investigate whether adding sortilin improved the accuracy of risk stratification. We did not find any improvement in risk prediction by including sortilin combined with the traditional risk factors (Figures 5, 6). This is in line with Bom et al. (63), who in a cohort of 203 patients with suspected CAD utilized machine learning to identify two protein signatures predicting high-risk plaques and absence of CAD, respectively. Neither protein signature included sortilin.
In conclusion, we have identified two cis-pQTLs for plasma sortilin at 1p13.3, where one of the pQTLs is a strong risk variant for CAD, with the risk allele for CAD driving lower levels of soluble sortilin in plasma, which is the same direction as the SORT1 transcript in the human liver. We find no association of plasma sortilin with CAD severity or coronary artery calcification, and sortilin did not improve existing risk classification in a clinical setting. Overall, in a well-characterized cohort of patients, sortilin was not a useful biomarker for CAD.
Data Availability Statement
The summary statistics for the pQTL analyses are available through GWAS catalog. The genotypes and WGS presented in this article are not readily available because of the sensitive nature of this data. Requests to access the datasets should be directed to Mette Nyegaard, bnllZ2FhcmRAYmlvbWVkLmF1LmRr.
Ethics Statement
The studies involving human participants were reviewed and approved by The Danish Data Protection Agency (Case no. 1-16-02-345-14) and The Central Denmark Region Committee on Health Research Ethics (Case no. 1-10-72-190-14). All patients providing informed written consent. The study was registered at ClinicalTrials.gov (Identifier: NCT02264717). The patients/participants provided their written informed consent to participate in this study.
Author Contributions
MK and MN conceptualized the study. MB, SW, and LN were responsible for the patient recruitment, phenotyping, and image analysis of patients. MN and PLM were responsible for building the biobank containing biological material from the Dan-NICAD 1 trial. MK and AN performed the ELISA analysis. MN, PLM and PDR analyzed the OLINK data. PDR processed, imputed, and performed the pQTL analysis on variants from genotyping. PLM processed and performed pQTL analysis on variants from whole genome sequencing. PLM and PDR carried out the statistical analysis. MN, MK, PDR and PLM drafted the first version of the manuscript. All authors read, provided comments and approved the final manuscript.
Funding
This work was supported by the Lundbeck Foundation Grant No R287-2018-735 (PDR) and R90-2011-7723 and R248-2017-431 (PB, AN, and MK), the Danish National Research Foundation Grant No DNRF133 (PB, AN, and MK), Karen Elise Jensen foundation (MB), and Danish Diabetes Academy, Novo Nordisk Foundation (MK).
Conflict of Interest
MK and AN has a patent (EP 3 666 281 A1) regarding using fragments of sortilin for treatment of insulin resistance.
The remaining authors declare that the research was conducted in the absence of any commercial or financial relationships that could be construed as a potential conflict of interest.
Acknowledgments
We thank Benedicte Vestergaard and Anne Kerstine Glintborg Jensen for excellent technical assistance. DNA from Dan-NICAD samples were extracted, genotyped and whole genome sequenced at deCODE genetics.
Supplementary Material
The Supplementary Material for this article can be found online at: https://www.frontiersin.org/articles/10.3389/fcvm.2021.652584/full#supplementary-material
References
1. Kathiresan S, Voight BF, Purcell S, Musunuru K, Ardissino D, Mannucci PM, et al. Genome-wide association of early-onset myocardial infarction with single nucleotide polymorphisms and copy number variants. Nat Genet. (2009) 41:334–41. doi: 10.1038/ng.327
2. Wang AZ, Li L, Zhang B, Shen GQ, Wang QK. Association of SNP rs17465637 on chromosome 1q41 and rs599839 on 1p13.3 with cyocardial infarction in an American caucasian population. Ann Hum Genet. (2011) 75:475–82. doi: 10.1111/j.1469-1809.2011.00646.x
3. Arvind P, Nair J, Jambunathan S, Kakkar VV, Shanker J. CELSR2-PSRC1-SORT1 gene expression and association with coronary artery disease and plasma lipid levels in an Asian Indian cohort. J Cardiol. (2014) 64:339–46. doi: 10.1016/j.jjcc.2014.02.012
4. Jones GT, Bown MJ, Gretarsdottir S, Romaine SPR, Helgadottir A, Yu G, et al. A sequence variant associated with sortilin-1 (SORT1) on 1p13.3 is independently associated with abdominal aortic aneurysm. Hum Mol Genet. (2013) 22:2941–7. doi: 10.1093/hmg/ddt141
5. Muendlein A, Geller-Rhomberg S, Saely CH, Winder T, Sonderegger G, Rein P, et al. Significant impact of chromosomal locus 1p13.3 on serum LDL cholesterol and on angiographically characterized coronary atherosclerosis. Atherosclerosis. (2009) 206:494–9. doi: 10.1016/j.atherosclerosis.2009.02.040
6. Odonnell CJ, Kavousi M, Smith AV, Kardia SLR, Feitosa MF, Hwang SJ, et al. Genome-wide association study for coronary artery calcification with follow-up in myocardial infarction. Circulation. (2011) 124:2855–64. doi: 10.1161/CIRCULATIONAHA.110.974899
7. Teslovich TM, Musunuru K, Smith AV, Edmondson AC, Stylianou IM, Koseki M, et al. Biological, clinical and population relevance of 95 loci for blood lipids. Nature. (2010) 466:707–13. doi: 10.1038/nature09270
8. Samani NJ, Erdmann J, Hall AS, Hengstenberg C, Mangino M, Mayer B, et al. Genomewide association analysis of coronary artery disease. N Engl J Med. (2007) 357:443–53. doi: 10.1056/NEJMoa072366
9. Kathiresan S, Melander O, Guiducci C, Surti A, Burtt NP, Rieder MJ, et al. Six new loci associated with blood low-density lipoprotein cholesterol, high-density lipoprotein cholesterol or triglycerides in humans. Nat Genet. (2008) 40:189–97. doi: 10.1038/ng.75
10. Shungin D, Deng WQ, Varga TV., Luan J, Mihailov E, Metspalu A, et al. Ranking and characterization of established BMI and lipid associated loci as candidates for gene-environment interactions. PLoS Genet. (2017) 13:e1006812. doi: 10.1371/journal.pgen.1006812
11. Kjolby M, Nielsen MS, Petersen CM. Sortilin, encoded by the cardiovascular risk gene SORT1, and its suggested functions in cardiovascular disease. Curr Atheroscler Rep. (2015) 17:496. doi: 10.1007/s11883-015-0496-7
12. Musunuru K, Strong A, Frank-Kamenetsky M, Lee NE, Ahfeldt T, Sachs KV, et al. From noncoding variant to phenotype via SORT1 at the 1p13 cholesterol locus. Nature. (2010) 466:714–9. doi: 10.1038/nature09266
13. Schadt EE, Molony C, Chudin E, Hao K, Yang X, Lum PY, et al. Mapping the genetic architecture of gene expression in human liver. PLoS Biol. (2008) 6:1020–32. doi: 10.1371/journal.pbio.0060107
14. Wallace C, Newhouse SJ, Braund P, Zhang F, Tobin M, Falchi M, et al. Genome-wide association study identifies genes for biomarkers of cardiovascular disease: serum urate and dyslipidemia. Am J Hum Genet. (2008) 82:139–49. doi: 10.1016/j.ajhg.2007.11.001
15. Lee JY, Lee BS, Shin DJ, Woo Park K, Shin YA, Joong Kim K, et al. A genome-wide association study of a coronary artery disease risk variant. J Hum Genet. (2013) 58:120–6. doi: 10.1038/jhg.2012.124
16. Van Der Harst P, Verweij N. Identification of 64 novel genetic loci provides an expanded view on the genetic architecture of coronary artery disease. Circ Res. (2018) 122:433–43. doi: 10.1161/CIRCRESAHA.117.312086
17. Erdmann J, Kessler T, Munoz Venegas L, Schunkert H. A decade of genome-wide association studies for coronary artery disease: the challenges ahead. Cardiovasc Res. (2018) 114:1241–57. doi: 10.1093/cvr/cvy084
18. Smith JG, Luk K, Schulz CA, Engert JC, Do R, Hindy G, et al. Association of low-density lipoprotein cholesterol-related genetic variants with aortic valve calcium and incident aortic stenosis. JAMA. (2014) 312:1764–71. doi: 10.1001/jama.2014.13959
19. Kjolby M, Andersen OM, Breiderhoff T, Fjorback AW, Pedersen KM, Madsen P, et al. Sort1, encoded by the cardiovascular risk locus 1p13.3, is a regulator of hepatic lipoprotein export. Cell Metab. (2010) 12:213–23. doi: 10.1016/j.cmet.2010.08.006
20. Strong A, Ding Q, Edmondson AC, Millar JS, Sachs KV, Li X, et al. Hepatic sortilin regulates both apolipoprotein B secretion and LDL catabolism. J Clin Invest. (2012) 122:2807–16. doi: 10.1172/JCI63563
21. Gustafsen C, Kjolby M, Nyegaard M, Mattheisen M, Lundhede J, Buttenschøn H, et al. The hypercholesterolemia-risk gene SORT1 facilitates PCSK9 secretion. Cell Metab. (2014) 19:310–8. doi: 10.1016/j.cmet.2013.12.006
22. Mortensen MB, Kjolby M, Gunnersen S, Larsen JV, Palmfeldt J, Falk E, et al. Targeting sortilin in immune cells reduces proinflammatory cytokines and atherosclerosis. J Clin Invest. (2014) 124:5317–22. doi: 10.1172/JCI76002
23. Goettsch C, Hutcheson JD, Aikawa M, Iwata H, Pham T, Nykjaer A, et al. Sortilin mediates vascular calcification via its recruitment into extracellular vesicles. J Clin Invest. (2016) 126:1323–36. doi: 10.1172/JCI80851
24. Ogawa K, Ueno T, Iwasaki T, Kujiraoka T, Ishihara M, Kunimoto S, et al. Soluble sortilin is released by activated platelets and its circulating levels are associated with cardiovascular risk factors. Atherosclerosis. (2016) 249:110–5. doi: 10.1016/j.atherosclerosis.2016.03.041
25. Hu D, Yang Y, Peng D quan. Increased sortilin and its independent effect on circulating proprotein convertase subtilisin/kexin type 9 (PCSK9) in statin-naive patients with coronary artery disease. Int J Cardiol. (2017) 227:61–5. doi: 10.1016/j.ijcard.2016.11.064
26. Oh TJ, Ahn CH, Kim BR, Kim KM, Moon JH, Lim S, et al. Circulating sortilin level as a potential biomarker for coronary atherosclerosis and diabetes mellitus. Cardiovasc Diabetol. (2017) 16:92. doi: 10.1186/s12933-017-0568-9
27. Goettsch C, Iwata H, Hutcheson JD, O'Donnell CJ, Chapurlat R, Cook NR, et al. Serum sortilin associates with aortic calcification and cardiovascular risk in men. Arterioscler Thromb Vasc Biol. (2017) 37:1005–11. doi: 10.1161/ATVBAHA.116.308932
28. Biscetti F, Bonadia N, Santini F, Angelini F, Nardella E, Pitocco D, et al. Sortilin levels are associated with peripheral arterial disease in type 2 diabetic subjects. Cardiovasc Diabetol. (2019) 18:5. doi: 10.1186/s12933-019-0805-5
29. Nozue T, Hattori H, Ogawa K, Kujiraoka T, Iwasaki T, Michishita I. Effects of statin therapy on plasma proprotein convertase subtilisin/kexin type 9 and sortilin levels in statin-naive patients with coronary artery disease. J Atheroscler Thromb. (2016) 23:848–56. doi: 10.5551/jat.33407
30. Nissen L, Winther S, Isaksen C, Ejlersen JA, Brix L, Urbonaviciene G, et al. Danish study of non-invasive testing in coronary artery disease (Dan-NICAD): study protocol for a randomised controlled trial. Trials. (2016) 17:262. doi: 10.1186/s13063-016-1388-z
31. Nissen L, Winther S, Westra J, Ejlersen JA, Isaksen C, Rossi A, et al. Diagnosing coronary artery disease after a positive coronary computed tomography angiography: the Dan-NICAD open label, parallel, head to head, randomized controlled diagnostic accuracy trial of cardiovascular magnetic resonance and myocardial perfusions. Eur Heart J Cardiovasc Imaging. (2018) 19:369–77. doi: 10.1093/ehjci/jex342
32. Petersen CM, Nielsen MS, Jacobsen C, Tauris J, Jacobsen L, Gliemann J, et al. Propeptide cleavage conditions sortilin/neurotensin receptor-3 for ligand binding. EMBO J. (1999) 18:595–604. doi: 10.1093/emboj/18.3.595
33. Chang CC, Chow CC, Tellier LC, Vattikuti S, Purcell SM, Lee JJ. Second-generation PLINK: rising to the challenge of larger and richer datasets. Gigascience. (2015) 4:7. doi: 10.1186/s13742-015-0047-8
34. Marees AT, de Kluiver H, Stringer S, Vorspan F, Curis E, Marie-Claire C, et al. A tutorial on conducting genome-wide association studies: quality control and statistical analysis. Int J Methods Psychiatr Res. (2018) 27:e1608. doi: 10.1002/mpr.1608
35. Das S, Forer L, Schönherr S, Sidore C, Locke AE, Kwong A, et al. Next-generation genotype imputation service and methods. Nat Genet. (2016) 48:1284–7. doi: 10.1038/ng.3656
36. Jónsson H, Sulem P, Kehr B, Kristmundsdottir S, Zink F, Hjartarson E, et al. Data descriptor: Whole genome characterization of sequence diversity of 15,220 Icelanders. Sci Data. (2017) 4:170115. doi: 10.1038/sdata.2017.115
37. Rohde PD, Fourie Sørensen I, Sørensen P. qgg: an R package for large-scale quantitative genetic analyses. Bioinformatics. (2020) 36:2614–5. doi: 10.1093/bioinformatics/btz955
38. VanRaden PM. Efficient methods to compute genomic predictions. J Dairy Sci. (2008) 91:4414–23. doi: 10.3168/jds.2007-0980
39. de los Campos G, Vazquez AI, Fernando R, Klimentidis YC, Sorensen D. Prediction of complex human traits using the genomic best linear unbiased predictor. PLoS Genet. (2013) 9:e1003608. doi: 10.1371/journal.pgen.1003608
40. Athanasiadis G, Cheng JY, Vilhjálmsson BJ, Jørgensen FG, Als TD, Le Hellard S, et al. Nationwide genomic study in Denmark reveals remarkable population homogeneity. Genetics. (2016) 204:711–22. doi: 10.1534/genetics.116.189241
41. Gilly A, Suveges D, Kuchenbaecker K, Pollard M, Southam L, Hatzikotoulas K, et al. Cohort-wide deep whole genome sequencing and the allelic architecture of complex traits. Nat Commun. (2018) 9:4674. doi: 10.1038/s41467-018-07070-8
42. Chen H, Huffman JE, Brody JA, Wang C, Lee S, Li Z, et al. Efficient variant set mixed model association tests for continuous and binary traits in large-scale whole-genome sequencing studies. Am J Hum Genet. (2019) 104:260–74. doi: 10.1101/395046
43. Yang J, Lee SH, Goddard ME, Visscher PM. GCTA: A tool for genome-wide complex trait analysis. Am J Hum Genet. (2011) 88:76–82. doi: 10.1016/j.ajhg.2010.11.011
44. Schmidt SE, Winther S. cadptp: Statistical module for calculating Clinical likelihood of coronary artery disease. Int J Cardiovasc Imaging. (2019) 35:2019–2028. doi: 10.1007/s10554-019-01662-1
45. Winther S, Schmidt SE, Mayrhofer T, Bøtker HE, Hoffmann U, Douglas PS, et al. Incorporating coronary calcification into pre-test assessment of the likelihood of coronary artery disease. J Am Coll Cardiol. (2020) 76:2421–32. doi: 10.1016/j.jacc.2020.09.585
46. Willer CJ, Schmidt EM, Sengupta S, Peloso GM, Gustafsson S, Kanoni S, et al. Discovery and refinement of loci associated with lipid levels. Nat Genet. (2013) 45:1274–85. doi: 10.1038/ng.2797
47. Raffield LM, Dang H, Pratte KA, Jacobson S, Gillenwater LA, Ampleford E, et al. Comparison of proteomic assessment methods in multiple cohort studies. Proteomics. (2020) 20:e1900278. doi: 10.1002/pmic.201900278
48. Mussbacher M, Schrottmaier WC, Salzmann M, Brostjan C, Schmid JA, Starlinger P, et al. Optimized plasma preparation is essential to monitor platelet-stored molecules in humans. PLoS ONE. (2017) 12:e018892. doi: 10.1371/journal.pone.0188921
49. Hermey G, Sjøgaard SS, Petersen CM, Nykjær A, Gliemann J. Tumour necrosis factor α-converting enzyme mediates ectodomain shedding of Vps10p-domain receptor family members. Biochem J. (2006) 395:285–93. doi: 10.1042/BJ20051364
50. Petersen CM, Nielsent MS, Nykjaer A, Jacobsen L, Tommerup N, Rasmussen HH, et al. Molecular identification of a novel candidate sorting receptor purified from human brain by receptor-associated protein affinity chromatography. J Biol Chem. (1997) 272:3599–605. doi: 10.1074/jbc.272.6.3599
51. Vaegter CB, Jansen P, Fjorback AW, Glerup S, Skeldal S, Kjolby M, et al. Sortilin associates with Trk receptors to enhance anterograde transport and neurotrophin signaling. Nat Neurosci. (2011) 14:54–63. doi: 10.1038/nn.2689
52. Gilly A, Park YC, Png G, Barysenka A, Fischer I, Bjørnland T, et al. Whole-genome sequencing analysis of the cardiometabolic proteome. Nat Commun. (2020) 11:6336. doi: 10.1038/s41467-020-20079-2
53. Bretherick AD, Canela-Xandri O, Joshi PK, Clark DW, Rawlik K, Boutin TS, et al. Linking protein to phenotype with Mendelian Randomization detects 38 proteins with causal roles in human diseases and traits. PLoS Genet. (2020) 16:e1008785. doi: 10.1371/journal.pgen.1008785
54. Deming Y, Xia J, Cai Y, Lord J, Del-Aguila JL, Fernandez MV, et al. Genetic studies of plasma analytes identify novel potential biomarkers for several complex traits. Sci Rep. (2016) 6:18092. doi: 10.1038/srep18092
55. Sun BB, Maranville JC, Peters JE, Stacey D, Staley JR, Blackshaw J, et al. Genomic atlas of the human plasma proteome. Nature. (2018) 558:73–9. doi: 10.1038/s41586-018-0175-2
56. Kaddai V, Jager J, Gonzalez T, Najem-Lendom R, Bonnafous S, Tran A, et al. Involvement of TNF-α in abnormal adipocyte and muscle sortilin expression in obese mice and humans. Diabetologia. (2009) 52:932–40. doi: 10.1007/s00125-009-1273-3
57. Blondeau N, Béraud-Dufour S, Lebrun P, Hivelin C, Coppola T. Sortilin in glucose homeostasis: from accessory protein to key player? Front Pharmacol. (2019) 9:1561. doi: 10.3389/fphar.2018.01561
58. Morris NJ, Ross SA, Lane WS, Moestrup SK, Petersen CM, Keller SR, et al. Sortilin is the major 110-kDa protein in GLUT4 vesicles from adipocytes. J Biol Chem. (1998) 273:3582–7. doi: 10.1074/jbc.273.6.3582
59. Winther S, Nissen L, Westra J, Schmidt SE, Bouteldja N, Knudsen LL, et al. Pre-test probability prediction in patients with a low to intermediate probability of coronary artery disease: a prospective study with a fractional flow reserve endpoint. Eur Heart J Cardiovasc Imaging. (2019) 20:1208–18. doi: 10.1093/ehjci/jez058
60. Riveros-Mckay Aguilera F, Weale M, Moore R, Selzam S, Krapohl E, Sivley RM, et al. An integrated polygenic and clinical risk tool enhances coronary artery disease prediction. (2020). doi: 10.1101/2020.06.01.20119297
61. Gu F, Chen TH, Pfeiffer RM, Fargnoli MC, Calista D, Ghiorzo P, et al. Combining common genetic variants and non-genetic risk factors to predict risk of cutaneous melanoma. Hum Mol Genet. (2018) 27:4145–56. doi: 10.1093/hmg/ddy282
62. Meisner A, Kundu P, Zhang YD, Lan L V, Kim S, Ghandwani D, et al. Combined utility of 25 disease and risk factor polygenic risk scores for stratifying risk of all-cause mortality. Am J Hum Genet. (2020) 107:418–31. doi: 10.1016/j.ajhg.2020.07.002
Keywords: Dan-NICAD, OLINK, protein biomarkers, cardiovascular disease, pQTL, SORT1, sortilin
Citation: Møller PL, Rohde PD, Winther S, Breining P, Nissen L, Nykjaer A, Bøttcher M, Nyegaard M and Kjolby M (2021) Sortilin as a Biomarker for Cardiovascular Disease Revisited. Front. Cardiovasc. Med. 8:652584. doi: 10.3389/fcvm.2021.652584
Received: 12 January 2021; Accepted: 22 February 2021;
Published: 16 April 2021.
Edited by:
Mete Civelek, University of Virginia, United StatesReviewed by:
Ozan Dikilitas, Mayo Clinic, United StatesCassandra Spracklen, University of Massachusetts Amherst, United States
Copyright © 2021 Møller, Rohde, Winther, Breining, Nissen, Nykjaer, Bøttcher, Nyegaard and Kjolby. This is an open-access article distributed under the terms of the Creative Commons Attribution License (CC BY). The use, distribution or reproduction in other forums is permitted, provided the original author(s) and the copyright owner(s) are credited and that the original publication in this journal is cited, in accordance with accepted academic practice. No use, distribution or reproduction is permitted which does not comply with these terms.
*Correspondence: Mette Nyegaard, TnllZ2FhcmRAYmlvbWVkLmF1LmRr
†These authors have contributed equally to this work