- 1Department of Outpatient, The First Affiliated Hospital of Jinan University, Guangzhou, China
- 2Department of Internal Medicine, Guangdong Women and Children Hospital, Guangzhou, China
- 3Department of Plastic Surgery, The First Affiliated Hospital of Jinan University, Guangzhou, China
Background: Triglyceride-glucose (TyG) index is a recently proposed surrogate indicator of insulin resistance. Previous studies evaluating the association between TyG index and hypertension risk in general adult population showed inconsistent results. We performed a meta-analysis to systematically evaluate this association.
Methods: Observational studies, which evaluated the independent association between TyG index and hypertension in the general adult population, were identified by systematic search of PubMed, Embase, Web of Science, Wanfang data, and Chinese National Knowledge Infrastructure databases. A random-effect model, which incorporated the potential intra-study heterogeneity, was used for the meta-analysis.
Results: Eight observational studies including 200,044 participants were included. Results showed that compared with those with the lowest category of TyG index, subjects with the highest category of TyG index were associated with higher odds of hypertension [adjusted risk ratio (RR): 1.53, 95% confidence interval (CI): 1.26–1.85, I2 = 54%, P < 0.001]. Sensitivity analysis by excluding one dataset at a time showed consistent result (adjusted RR: 1.44–1.62, P all < 0.001). Results of univariate meta-regression analysis showed that differences in sample size, mean age, male proportion, mean body mass index, and study quality score among the included studies did not have significant influence on the association between TyG index and hypertension (P values all > 0.10), suggesting that differences in these characteristics may not be the major source of heterogeneity. Subgroup analyses showed that study characteristics such as study design, participant ethnicity, age, or sex of the participants did not significantly affect the association (P for subgroup difference all >0.05).
Conclusions: Higher TyG index may be associated with higher odds of hypertension in general adult population. Large-scale prospective cohort studies are needed to validate these findings, and further studies are needed to elucidate the potential pathophysiological mechanisms underlying the association between TyG index and hypertension.
Introduction
Currently, hypertension remains an important cause of morbidity and mortality of global population (1), particularly for people from the developing countries (2). Early identification of population at higher risk for the development of hypertension is critical to reduce the incidence of the disease and its cardiovascular complications (3). Previous studies showed that insulin resistance may be involved in the pathogenesis of hypertension via mediating low-degree systematic inflammation (4, 5). Conventionally, hyperinsulinemic–euglycemic clamp test is considered as the “gold standard” method for the evaluation of insulin sensitivity (6). However, application of hyperinsulinemic–euglycemic clamp test in real world clinical practice is limited since this method is time consuming and expensive (7). Recently, triglyceride-glucose (TyG) index, a fasting blood glucose and triglyceride synthesis parameter, has been proposed as a reliable indicator of insulin resistance (8). The TyG index is a non-insulin-based index that is inexpensive and could be easily obtained based on a single sample, which has been suggested as a reliable surrogate biochemical marker of insulin resistance (9). Accumulating evidence showed that higher TyG index is independently associated with and increased risk of type 2 diabetes mellitus in general population (10). However, previous studies evaluating the association between TyG and hypertension risk in community-derived adult population showed inconsistent results (11–18). Therefore, in this study, we aimed to evaluate the association between TyG index and hypertension in general adult population via a meta-analysis of observational studies. Moreover, potential influences of characteristics of the participants on the association were also analyzed.
Methods
The meta-analysis was performed in accordance with the MOOSE (Meta-analysis of Observational Studies in Epidemiology) (19) and Cochrane's Handbook (20) guidelines.
Literature Search
Studies were identified via systematic search of electronic databases of PubMed, Embase, Web of Science, Wanfang data, and Chinese National Knowledge Infrastructure (CNKI) databases via the following terms: (1) “TyG index” OR “triglyceride-glucose index” OR “triglyceride and glucose index”; and (2) “hypertension” OR “blood pressure” OR “hypertensive.” The search was limited to human studies published in English or Chinese. The reference lists of related original and review articles were also analyzed using a manual approach. The final literature search was performed on March 10, 2021.
Study Selection
The inclusion criteria for the studies were: (1) observational studies published as full-length articles; (2) included general adult population; (3) evaluated the association between TyG index and hypertension; and (4) reported the relative risk for this association after adjustment of potential confounding factors. TyG index was calculated as ln [TG (mg/dl) × FPG (mg/dl)/2] (21). Diagnosis of hypertension was in accordance with the criteria applied in the included studies, which was generally defined as systolic BP ≥ 140 mmHg, diastolic BP ≥ 90 mmHg, or on treatment of antihypertensive medications. Reviews, editorials, preclinical studies, and studies irrelevant to the aim of current meta-analysis were excluded. Besides, studies including participants <18 years old, focusing on patients with confirmed diagnosis of certain diseases rather than general population, without measuring of TyG index, or that reported data based on univariate analyses rather than multivariate analyses were excluded from the meta-analysis.
Data Extracting and Quality Evaluation
Literature search, data extraction, and quality assessment of the included studies were performed by two authors (YW and WY) independently according to the predefined inclusion criteria. Discrepancies were resolved by consensus. The extracted data included: (1) name of first author, publication year, and country where the study was performed; (2) study design characteristics; (3) participant characteristics, including health status, sample size, age, sex, and body mass index (BMI); (4) patterns for Lp (a) analysis and cutoff values; (5) follow-up durations for cohort studies; (6) definitions of hypertension and methods for outcome validation; and (7) confounding factors adjusted in the multivariate analyses. The quality of each study was evaluated using the Newcastle-Ottawa Scale (22), which ranges from 1 to 9 stars and judges each study regarding three aspects: selection of the study groups; the comparability of the groups; and the ascertainment of the outcome of interest.
Statistical Analyses
We used risk ratios (RRs) and their corresponding 95% confidence intervals (CIs) as the general measure for the association between TyG index and hypertension in general adult population. For all of the included studies, TyG index was analyzed as categorized variables. Accordingly, RRs of hypertension in adults with the highest TyG index level compared with those with the lowest TyG index level were extracted. Data of RRs and their corresponding stand errors (SEs) were calculated from 95% CIs or P values, and were logarithmically transformed to stabilize variance and normalize the distribution (20). The Cochrane's Q test and estimation of I2 statistic were used to evaluate the heterogeneity among the included cohort studies (23). A significant heterogeneity was considered if I2 > 50%. We used a random-effect model to synthesize the OR data because this model is considered as a more generalized method, which incorporates the potential heterogeneity among the included studies (20). Sensitivity analyses, by omitting one individual study at a time, were performed to test the robustness of the results (24). A univariate meta-regression analysis was performed to evaluate the potential influences of study characteristics including sample size, mean age, male proportion, mean BMI, and study quality score on the association between TyG index and odds of hypertension (20). Besides, predefined subgroup analyses were performed to evaluate the influences of study characteristics on the outcome, including study design, ethnicity, age, and sex of the participants. Briefly, median of continuous value was chosen as cut-off value, and studies were grouped according to the study design (cohort or cross-sectional studies), ethnicity of the participants (Chinese or non-Chinese), mean age (< or ≥50 years), and sex of the subjects (male or female). Subsequent comparisons for the outcome within subgroups were performed with Chi-square test. The potential publication bias was assessed by visual inspection of the symmetry of the funnel plots, as well as the Egger's regression asymmetry test (25) and Begg's test (20). A P < 0.05 was considered as statistically significant. We used the RevMan (Version 5.1; Cochrane Collaboration, Oxford, UK) and STATA software for the meta-analysis and statistics.
Results
Literature Search
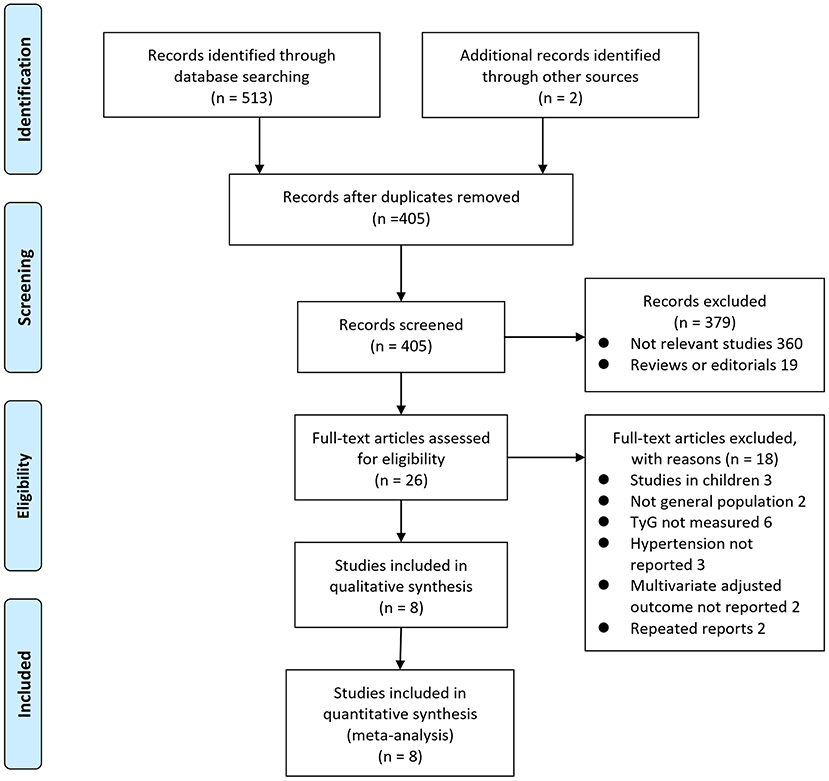
The process of database search is summarized in Figure 1. Briefly, 405 articles were found via initial literature search of the databases after excluding of the duplications. Among them, 379 were excluded through screening of the titles and abstracts mainly because they were not relevant to the purpose of the meta-analysis. Subsequently, 26 potential relevant records underwent full-text review. Of these, 10 were further excluded for the reasons listed in Figure 1. Finally, eight observational studies were obtained for the meta-analysis (11–18).
Study Characteristics and Quality Evaluation
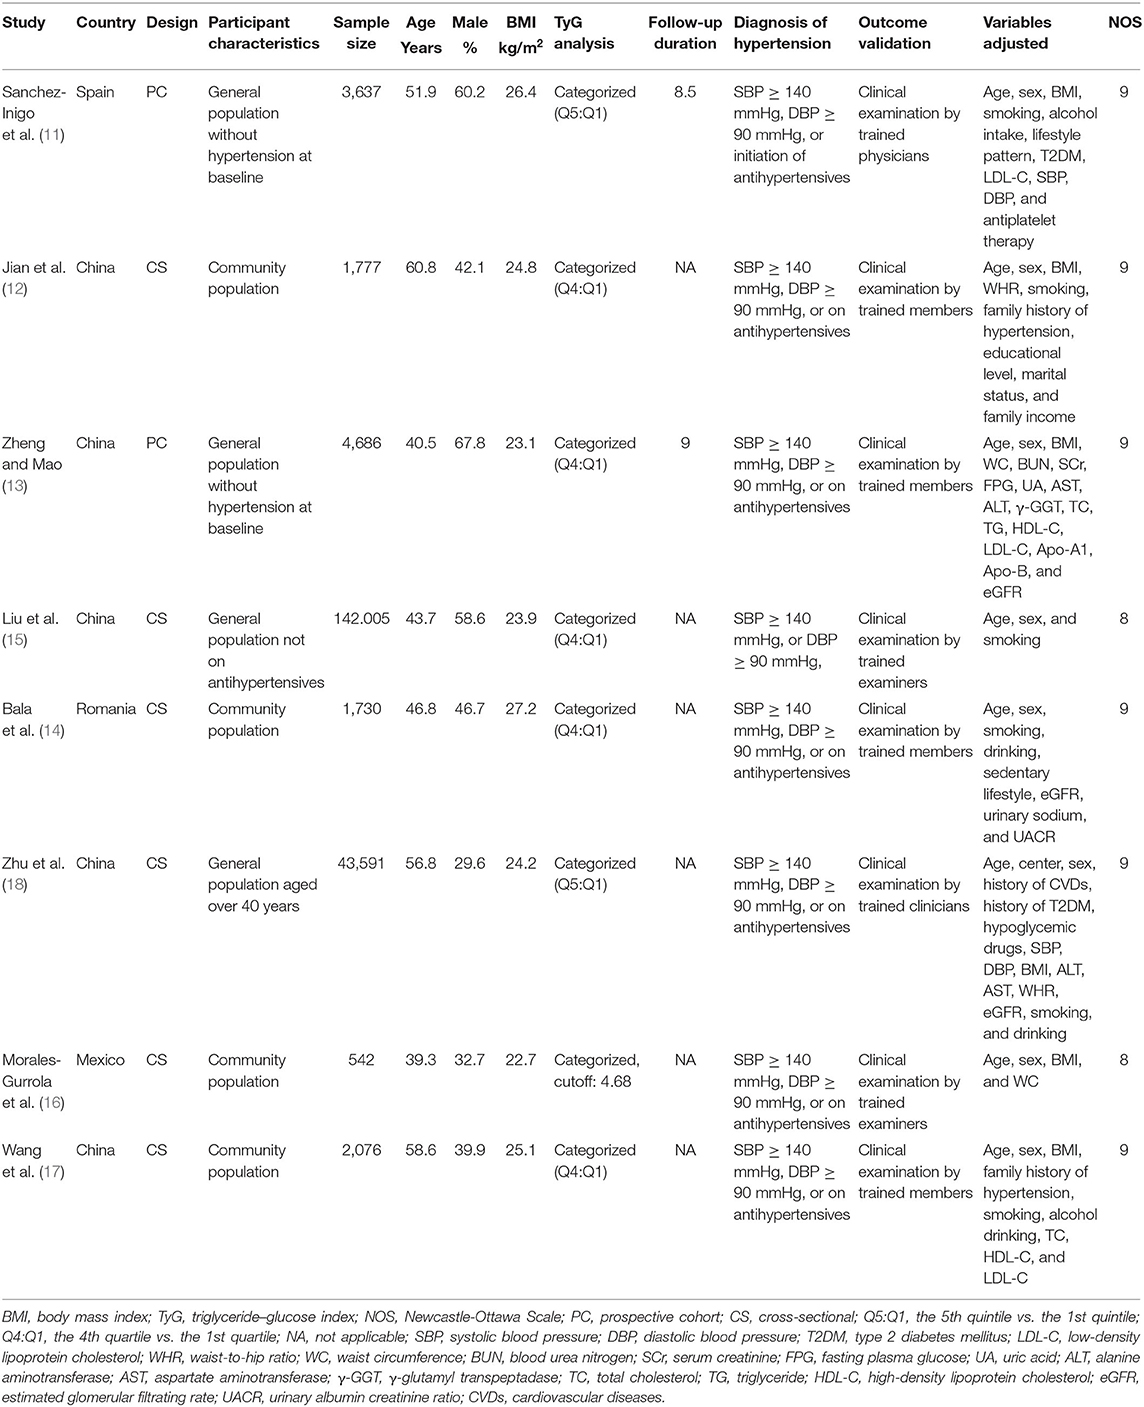
The characteristics of the included studies are summarized in Table 1. Overall, eight with 200,044 adult participants from community population were included. The studies were performed in Spain (11), Romania (14), Mexico (16), and China (12, 13, 15, 17, 18). Regarding study design, two of them were prospective cohort studies (11, 13), and the remaining six were cross-sectional studies (12, 14–18). The sample size of the included studies varied between 542 and 142,005. The mean ages of the participants among each study ranged from 39 to 61 years, and the mean BMI varied from 22.7 to 27.2 kg/m2. For the analysis of the association between TyG index and odds of hypertension, comparisons were performed between participants with highest and lowest quintiles in two studies (11, 18), between those with highest and lowest quartile in five studies (12–15, 17), and according to a cutoff value of 4.68 in one study (16). Validation of hypertension outcome was performed by clinical examination by trained research members. Age, sex, BMI, smoking status, and other potential confounding factors were generally adjusted to a varying degree when the association between TyG index and hypertension was reported. The NOS scores of the included studies ranged from eight to nine, indicating generally good study quality.
Association Between TyG Index and Hypertension
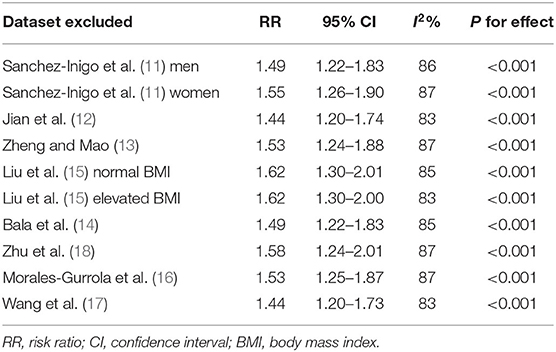
Eight studies (11–18) evaluated the odds of hypertension in community derived adult population with highest vs. lowest TyG index. Pooled results with a random-effect model showed that participants with the highest TyG index had higher odds hypertension (adjusted RR: 1.53, 95% CI: 1.26–1.85, I2 = 54%, P < 0.001; Figure 2) compared with those with the lowest TyG index. Sensitivity analyses by omitting one study at a time showed similar results (RR: 1.44–1.62, P all < 0.001; Table 2). Results of univariate meta-regression analysis are shown in Table 3, which showed that differences in sample size, mean age, male proportion, mean body mass index, and study quality score among the included studies did not have significant influence on the association between TyG index and hypertension (P values all > 0.10). These results suggested that differences in these characteristics may not be the major source of heterogeneity. Moreover, subgroup analyses showed consistent association in prospective studies (RR: 1.60, 95% CI: 1.30–1.97, P < 0.001) and cross-sectional studies (RR: 1.51, 95% CI: 1.20–1.91, P < 0.001; Figure 3A), in Chinese (RR: 1.46, 95% CI: 1.15–1.86, P = 0.002) and non-Chinese (RR: 1.70, 95% CI: 1.43–2.03, P = 0.001; Figure 3B) population, in participants with mean age <50 years (RR: 1.30, 95% CI: 1.04–1.62, P = 0.02) and ≥50 years (RR: 1.79, 95% CI: 1.29–2.48, P < 0.001; Figure 4A), and in men (RR: 1.24, 95% CI: 1.00–1.55, P = 0.05) and women (RR: 1.30, 95% CI: 1.10–1.54, P = 0.002; Figure 4B).
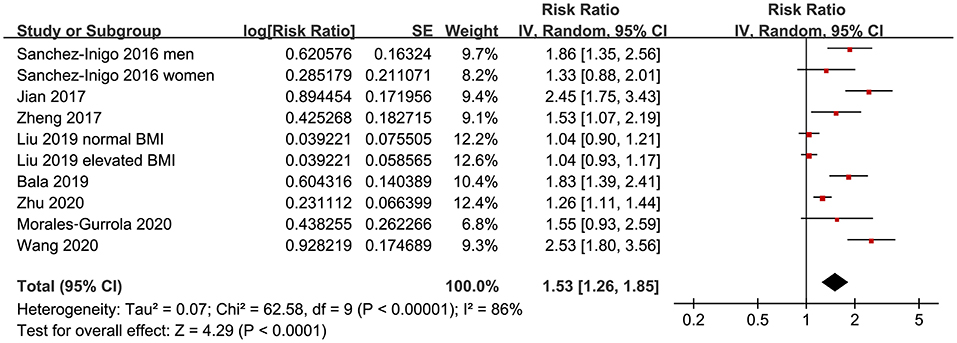
Figure 2. Forest plots for the meta-analysis of the association between triglyceride-glucose (TyG) index and hypertension in community-derived adult population.
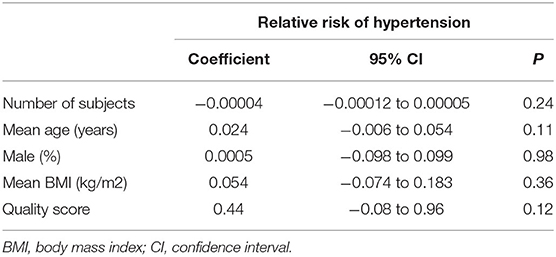
Table 3. Impact of study characteristics on the association between TyG index and odds of hypertension: univariate meta-regression analysis.
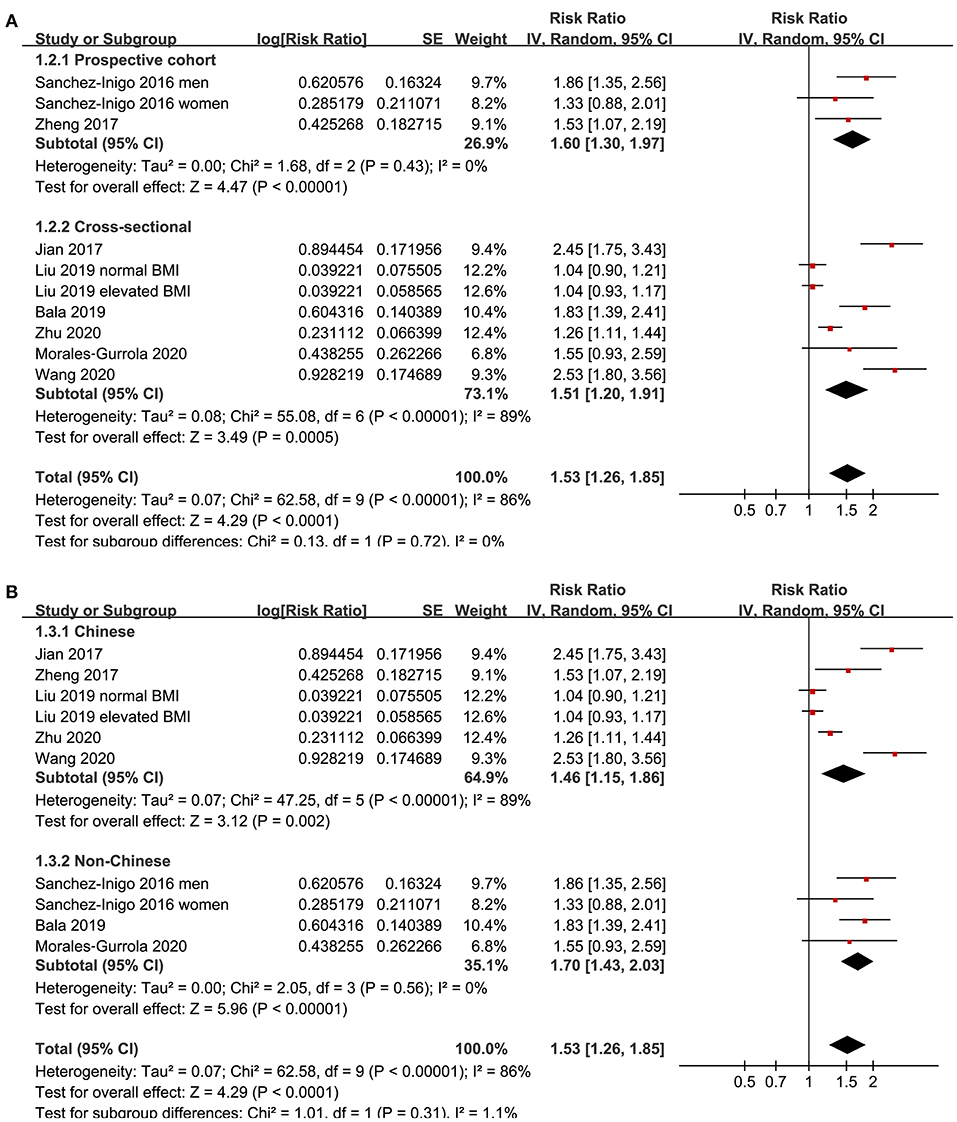
Figure 3. Subgroup analyses for the association between TyG index and hypertension in community-derived adult population; (A) subgroup analysis according to the study design; and (B) subgroup analysis according to the ethnicity of the population.
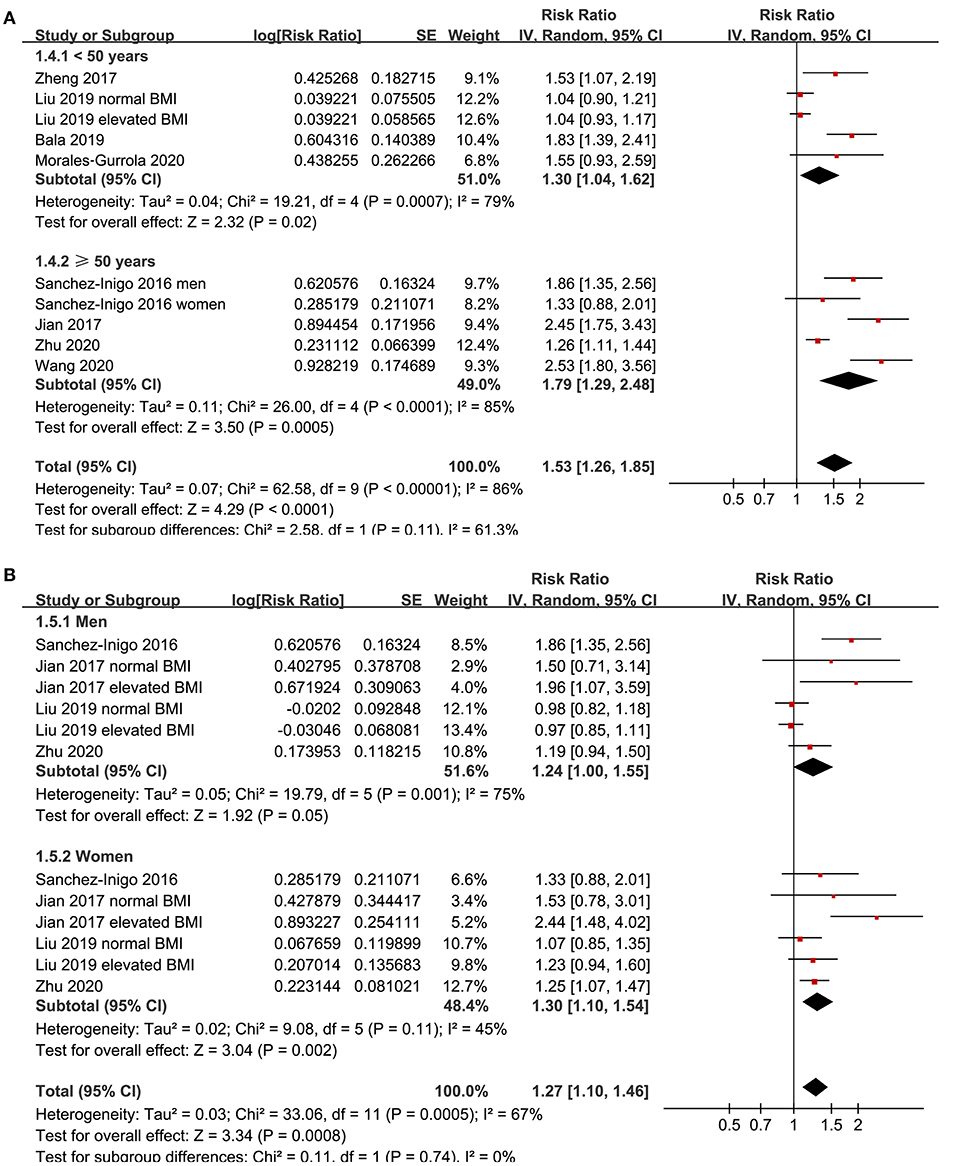
Figure 4. Subgroup analyses for the association between TyG index and hypertension in community-derived adult population; (A) subgroup analysis according to the mean age of the population; and (B) subgroup analysis according to the gender of the participants.
Publication Bias
The funnel plots regarding the association between serum TyG index and hypertension are shown in Figure 5. The funnel plots were symmetry on visual inspection, suggesting low risk of publication bias. Egger's regression test and Begg's test also showed consistent results (P = 0.28 and 0.19, respectively).
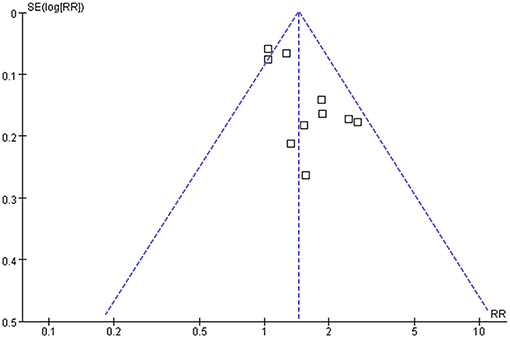
Figure 5. Funnel plots for the publication bias underlying the meta-analysis of the association between TyG index and hypertension in community-derived adult population.
Discussion
In this meta-analysis of observational studies, we found that compared with those with the lowest category of TyG index, adults with the highest category of TyG index were independently associated with higher odds of hypertension. Besides, consistent results were obtained in subgroup analyses according to the study design, ethnicity, age, and sex of the participants. Taken together, these findings suggested that higher TyG index may be associated with higher odds of hypertension in general adult population. Although these findings should be validated in large-scale prospective cohort studies, results of our study suggest that TyG index, an easily obtained indicator of insulin resistance, could be applied as a predictor of hypertension risk in general adult population. Moreover, the potential pathophysiological mechanisms underlying the association between TyG index and hypertension deserve further investigation.
To the best of our knowledge, our study is the first meta-analysis which evaluated the association between TyG index and hypertension in community-derived general population. The strengths of our meta-analysis include the following: First, only studies with multivariate analysis were included, which therefore could provide an independent association between TyG index and hypertension. In addition, sensitivity analysis was performed to evaluate the stability of the results, which confirmed that the association between TyG index and hypertension was not primarily driven by either of the included studies. Finally, multiple predefined subgroup analyses were applied to evaluate the robustness of the findings, which showed that the association between TyG index and hypertension was not affected by the differences in study design, ethnicity, age, or gender of the participants. Our findings may reflect the pathogenetic association between insulin resistance and hypertension. Previous studies showed that insulin resistance is characterized of low-degree systematic inflammation, which may cause endothelial dysfunction, one of the initial pathogenic processes underlying arterial hypertension (26, 27). Besides, insulin resistance may also affect renal sodium metabolism (28), increase the activity of the sympathetic nerve system (29), and modulation the secretion of vasoactive substances (30), all of which have been implicated in the pathogenesis of hypertension.
An important clinical implication of our study is that TyG index may be applied as an indicator to reflect the risk of hypertension in general adult population (31). Compared with the hyperinsulinemic–euglycemic clamp test, TyG index could be easily obtained because measuring triglyceride and glucose is inexpensive and routine. The TyG index had high sensitivity (96.5%) and specificity (85.0%) for detection of insulin resistance as compared with the hyperinsulinemic–euglycemic clamp test, as evidenced by a previous study in Mexico (32). Besides, TyG index showed better performance than homeostatic model assessment for measuring insulin resistance (33). Large-scale studies evaluating the temporal relationship between baseline TyG index and subsequent risk of hypertension in general population are needed to validate the findings of the meta-analysis.
Some limitations should be noticed when the results of the meta-analysis are interpreted. First, the datasets available for the meta-analysis were limited, and the results for the subgroup analyses should be interpreted with caution due to the small number of datasets and participants included. Second, although only studies with multivariate analyses were included, we could not exclude the possibility of unadjusted residual factors that may confound the association between TyG index and hypertension, such as dietary factor of the included populations and the concurrent medications used. Moreover, significant heterogeneity was observed among the included studies. However, results of univariate meta-regression analysis showed that differences in sample size, mean age, male proportion, mean BMI, and study quality score among the included studies did not have significant influence on the association between TyG index and hypertension (P values all > 0.10), suggesting that differences in these characteristics may not be the major source of heterogeneity. Besides, our predefined subgroup analyses also did not support that the varying results of the included studies could be explained by differences in study design, patient ethnicity, age, or sex. Currently, we are unable to determine the possible reasons of inconsistent results among the included studies. However, difference in some other related factors (comorbidities, concurrent medications, dietary factors, or cut-off values for TyG index) may be responsible for the inconsistent results among the studies on the association between triglyceride-glucose index and hypertension. Large-scale prospective cohort studies are warranted to validate our findings and determine the potential influences of patient characteristics on the association between TyG index and hypertension risk. Besides, combining the results of studies with cross-sectional and cohort design could also contribute to the heterogeneity, although the results of subgroup analysis according to the study design showed no statistical significance. In addition, it remains unknown whether the association between TyG index and hypertension is linear because we only included categorized data. In fact, to the best of our knowledge, only one study showed that TyG index as a continuous variable remained to be associated with hypertension in elderly individuals from China (18). Moreover, although both Egger's regression test and Begg's test suggested low risk of publication bias, these results should be interpreted with caution since only 10 datasets were included in the meta-analysis. Finally, a causative association between higher TyG index and hypertension could not be derived from this study because it is a meta-analysis of observational studies.
In conclusion, current evidence from observational studies suggests that higher TyG index may be associated with higher odds of hypertension in general adult population. Large-scale prospective cohort studies are needed to validate these findings, and further studies are needed to elucidate the potential pathophysiological mechanisms underlying the association between TyG index and hypertension.
Data Availability Statement
The original contributions presented in the study are included in the article/supplementary material, further inquiries can be directed to the corresponding authors.
Author Contributions
YW and XJ designed the study. YW and WY performed the literature search, data extraction, quality evaluation, and wrote the manuscript. All authors performed the statistical analyses, reviewed and revised the manuscript, and approved the manuscript for submission.
Conflict of Interest
The authors declare that the research was conducted in the absence of any commercial or financial relationships that could be construed as a potential conflict of interest.
References
1. Reboussin DM, Allen NB, Griswold ME, Guallar E, Hong Y, Lackland DT, et al. Systematic review for the 2017 ACC/AHA/AAPA/ABC/ACPM/AGS/APhA/ASH/ASPC/NMA/PCNA guideline for the prevention, detection, evaluation, and management of high blood pressure in adults: a report of the american college of cardiology/American Heart Association task force on clinical practice guidelines. J Am Coll Cardiol. (2018) 71:2176–98. doi: 10.1016/j.jacc.2017.11.004
2. Ma S, Yang L, Zhao M, Magnussen CG, Xi B. Trends in hypertension prevalence, awareness, treatment and control rates among Chinese adults, 1991-2015. J Hypertens. (2020) 39:740–8. doi: 10.1097/HJH.0000000000002698
3. Gartlehner G, Vander Schaaf EB, Orr C, Kennedy SM, Clark R, Viswanathan M. Screening for hypertension in children and adolescents: updated evidence report and systematic review for the US preventive services task force. JAMA. (2020) 324:1884–95. doi: 10.1001/jama.2020.11119
4. Da Silva AA, Do Carmo JM, Li X, Wang Z, Mouton AJ, Hall JE. Role of hyperinsulinemia and insulin resistance in hypertension: metabolic syndrome revisited. Can J Cardiol. (2020) 36:671–82. doi: 10.1016/j.cjca.2020.02.066
5. Mancusi C, Izzo R, Di Gioia G, Losi MA, Barbato E, Morisco C. Insulin resistance the hinge between hypertension and type 2 diabetes. High Blood Press Cardiovasc Prev. (2020) 27:515–26. doi: 10.1007/s40292-020-00408-8
6. Bloomgarden ZT. Measures of insulin sensitivity. Clin Lab Med. (2006) 26:611–33. doi: 10.1016/j.cll.2006.06.007
7. Cersosimo E, Solis-Herrera C, Trautmann ME, Malloy J, Triplitt CL. Assessment of pancreatic beta-cell function: review of methods and clinical applications. Curr Diabetes Rev. (2014) 10:2–42. doi: 10.2174/1573399810666140214093600
8. Khan SH, Sobia F, Niazi NK, Manzoor SM, Fazal N, Ahmad F. Metabolic clustering of risk factors: evaluation of Triglyceride-glucose index. (TyG index) for evaluation of insulin resistance. Diabetol Metab Syndr. (2018) 10:74. doi: 10.1186/s13098-018-0376-8
9. Sanchez-Garcia A, Rodriguez-Gutierrez R, Mancillas-Adame L, Gonzalez-Nava V, Diaz Gonzalez-Colmenero A, Solis RC, et al. Diagnostic accuracy of the triglyceride and glucose index for insulin resistance: a systematic review. Int J Endocrinol. (2020) 2020:4678526. doi: 10.1155/2020/4678526
10. Da Silva A, Caldas APS, Rocha D, Bressan J. Triglyceride-glucose index predicts independently type 2 diabetes mellitus risk: A systematic review and meta-analysis of cohort studies. Prim Care Diabetes. (2020) 14:584–93. doi: 10.1016/j.pcd.2020.09.001
11. Sanchez-Inigo L, Navarro-Gonzalez D, Pastrana-Delgado J, Fernandez-Montero A, Martinez JA. Association of triglycerides and new lipid markers with the incidence of hypertension in a Spanish cohort. J Hypertens. (2016) 34:1257–65. doi: 10.1097/HJH.0000000000000941
12. Jian S, Su-Mei N, Xue C, Jie Z, Xue-Sen W. Association and interaction between triglyceride-glucose index and obesity on risk of hypertension in middle-aged and elderly adults. Clin Exp Hypertens. (2017) 39:732–9. doi: 10.1080/10641963.2017.1324477
13. Zheng R, Mao Y. Triglyceride and glucose. (TyG) index as a predictor of incident hypertension: a 9-year longitudinal population-based study. Lipids Health Dis. (2017) 16:175. doi: 10.1186/s12944-017-0562-y
14. Bala C, Gheorghe-Fronea O, Pop D, Pop C, Caloian B, Comsa H, et al. The association between six surrogate insulin resistance indexes and hypertension: a population-based study. Metab Syndr Relat Disord. (2019) 17:328–33. doi: 10.1089/met.2018.0122
15. Liu XZ, Fan J, Pan SJ. METS-IR, a novel simple insulin resistance indexes, is associated with hypertension in normal-weight Chinese adults. J Clin Hypertens. (2019) 21:1075–81. doi: 10.1111/jch.13591
16. Morales-Gurrola G, Simental-Mendia LE, Castellanos-Juarez FX, Salas-Pacheco JM, Guerrero-Romero F. The triglycerides and glucose index is associated with cardiovascular risk factors in metabolically obese normal-weight subjects. J Endocrinol Invest. (2020) 43:995–1000. doi: 10.1007/s40618-020-01184-x
17. Wang K, He G, Zhang Y, Yin J, Yan Y. Association of triglyceride-glucose index and its interaction with obesity on hypertension risk in Chinese: a population-based study. J Hum Hypertens. (2020) 35:232–9. doi: 10.1038/s41371-020-0326-4
18. Zhu B, Wang J, Chen K, Yan W, Wang A, Wang W, et al. A high triglyceride glucose index is more closely associated with hypertension than lipid or glycemic parameters in elderly individuals: a cross-sectional survey from the reaction study. Cardiovasc Diabetol. (2020) 19:112. doi: 10.1186/s12933-020-01077-6
19. Stroup DF, Berlin JA, Morton SC, Olkin I, Williamson GD, Rennie D, et al. Meta-analysis of observational studies in epidemiology: a proposal for reporting. Meta-analysis Of Observational Studies in Epidemiology. (MOOSE) group. JAMA. (2000) 283:2008–12. doi: 10.1001/jama.283.15.2008
20. Higgins J, Green S. Cochrane Handbook for Systematic Reviews of Interventions Version 5.1.0. The Cochrane Collaboration (2011). Available online at: www.cochranehandbook.org.
21. Simental-Mendia LE, Rodriguez-Moran M, Guerrero-Romero F. The product of fasting glucose and triglycerides as surrogate for identifying insulin resistance in apparently healthy subjects. Metab Syndr Relat Disord. (2008) 6:299–304. doi: 10.1089/met.2008.0034
22. Wells GA, Shea B, O'connell D, Peterson J, Welch V, Losos M, et al. The Newcastle-Ottawa Scale. (NOS) for Assessing the Quality of Non-Randomised Studies in Meta-Analyses. (2010). Available online at: http://www.ohri.ca/programs/clinical_epidemiology/oxford.asp.
23. Higgins JP, Thompson SG. Quantifying heterogeneity in a meta-analysis. Stat Med. (2002) 21:1539–58. doi: 10.1002/sim.1186
24. Patsopoulos NA, Evangelou E, Ioannidis JP. Sensitivity of between-study heterogeneity in meta-analysis: proposed metrics and empirical evaluation. Int J Epidemiol. (2008) 37:1148–57. doi: 10.1093/ije/dyn065
25. Egger M, Davey Smith G, Schneider M, Minder C. Bias in meta-analysis detected by a simple, graphical test. BMJ. (1997) 315:629–34. doi: 10.1136/bmj.315.7109.629
26. Hall JE, Do Carmo JM, Da Silva AA, Wang Z, Hall ME. Obesity-induced hypertension: interaction of neurohumoral and renal mechanisms. Circ Res. (2015) 116:991–1006. doi: 10.1161/CIRCRESAHA.116.305697
27. Rao A, Pandya V, Whaley-Connell A. Obesity and insulin resistance in resistant hypertension: implications for the kidney. Adv Chronic Kidney Dis. (2015) 22:211–7. doi: 10.1053/j.ackd.2014.12.004
28. Horita S, Seki G, Yamada H, Suzuki M, Koike K, Fujita T. Insulin resistance, obesity, hypertension, and renal sodium transport. Int J Hypertens. (2011) 2011:391762. doi: 10.4061/2011/391762
29. Landsberg L. Pathophysiology of obesity-related hypertension: role of insulin and the sympathetic nervous system. J Cardiovasc Pharmacol. (1994) 23(Suppl 1):S1–8. doi: 10.1097/00005344-199423001-00002
30. Wheatcroft SB, Williams IL, Shah AM, Kearney MT. Pathophysiological implications of insulin resistance on vascular endothelial function. Diabet Med. (2003) 20:255–68. doi: 10.1046/j.1464-5491.2003.00869.x
31. Brito ADM, Hermsdorff HHM, Filgueiras MS, Suhett LG, Vieira-Ribeiro SA, Franceschini S, et al. Predictive capacity of triglyceride-glucose. (TyG) index for insulin resistance and cardiometabolic risk in children and adolescents: a systematic review. Crit Rev Food Sci Nutr. (2020). doi: 10.1080/10408398.2020.1788501. [Epub ahead of print].
32. Guerrero-Romero F, Simental-Mendia LE, Gonzalez-Ortiz M, Martinez-Abundis E, Ramos-Zavala MG, Hernandez-Gonzalez SO, et al. The product of triglycerides and glucose, a simple measure of insulin sensitivity. Comparison with the euglycemic-hyperinsulinemic clamp. J Clin Endocrinol Metab. (2010) 95:3347–51. doi: 10.1210/jc.2010-0288
Keywords: triglyceride-glucose index, hypertension, insulin resistance, observational studies, meta-analysis
Citation: Wang Y, Yang W and Jiang X (2021) Association Between Triglyceride-Glucose Index and Hypertension: A Meta-Analysis. Front. Cardiovasc. Med. 8:644035. doi: 10.3389/fcvm.2021.644035
Received: 19 December 2020; Accepted: 22 April 2021;
Published: 31 May 2021.
Edited by:
Giuseppe Maiolino, University Hospital of Padua, ItalyCopyright © 2021 Wang, Yang and Jiang. This is an open-access article distributed under the terms of the Creative Commons Attribution License (CC BY). The use, distribution or reproduction in other forums is permitted, provided the original author(s) and the copyright owner(s) are credited and that the original publication in this journal is cited, in accordance with accepted academic practice. No use, distribution or reproduction is permitted which does not comply with these terms.
*Correspondence: Xiao Jiang, amlhbmd4aWFvX2puMjJAc29odS5jb20=
†These authors have contributed equally to this work
 Yi Wang1†
 Xiao Jiang