 Yan Cang
95% of researchers rate our articles as excellent or good
Learn more about the work of our research integrity team to safeguard the quality of each article we publish.
Find out more
CLINICAL TRIAL article
Front. Cardiovasc. Med. , 24 May 2021
Sec. Cardiovascular Epidemiology and Prevention
Volume 8 - 2021 | https://doi.org/10.3389/fcvm.2021.641513
This article is part of the Research Topic Non-Invasive Measures of Cardiovascular Function and Health: Special considerations for assessing lifestyle behaviours View all 15 articles
Background: Previous studies have demonstrated an association between hyperuricemia and cardiovascular disease (CVD). The Framingham study confirmed that patients with high atherosclerotic risks (HARs) had worse prognoses. However, after adjusting for confounding factors, the association between serum uric acid (SUA) and all-cause mortality and cardiovascular mortality remains unclear, especially for HAR patients.
Objective: The aim of this study was to reveal the relationship of SUA with all-cause and cardiovascular mortality in HAR patients.
Methods: This multicenter cohort study enrolled 3,047 participants, and the follow-up was 68.85 ± 11.37 months. Factors related to cardiovascular and all-cause mortality were tested by multivariate Cox regression analysis. Restricted cubic splines (RCSs) with knots were used to explore the shape of the dose–response relationship with SUA and the hazard ratio (HR) of all-cause and CVD mortality. SUA transformed by RCS was added to the Cox regression model as an independent variable, and all-cause and CVD mortality scores were calculated. Survival receiver operating characteristic curves were produced using a regression model predicting the score.
Results: SUA demonstrated a “U-shaped” relationship with all-cause and cardiovascular mortality. SUA predicted all-cause and CVD mortality, with cutoff values of values of >370.5 μmol/L for males and >327.65 μmol/L for females and <180.5 μmol/L for males and <165.7 μmol/L for females, respectively. The survival ROC curve indicated that SUA is able to predict all-cause and CVD mortality, with areas under the curve of 0.702 and 0.711, respectively. The HRs of all-cause mortality (male and female) with hyperuricemia and hypouricemia were 2.08 and 2.01 and 2.04 and 1.98, respectively, and the HRs of CVD mortality (male and female) were 2.09 and 1.79, and 2.02 and 1.89, respectively.
Conclusion: Abnormal SUA levels were significant and independent risk factors for all-cause and CVD mortality. Hyperuricemia and hypouricemia increased mortality in both males and females. Routine SUA evaluation and intensive management are needed for HAR patients.
Clinical Trial Registration: www.ClinicalTrials.gov, identifier: NCT03616769.
Previous studies in humans have demonstrated an association between hyperuricemia, arterial stiffness, and endothelial dysfunction (1), and the serum uric acid (SUA) level has been suggested to be an important modulator of the inflammatory process (2). Several studies have reported that SUA serves as a marker of an underlying pathophysiological process (3, 4), and some evidence shows that elevated SUA concentrations are associated with a higher risk of hypertension and cardiovascular disease (CVD) (5–7). However, the relationship between SUA level and CVD mortality remains controversial because established cardiovascular risk factors are complex and may be considered a confounding factor (8). Although previous studies have indicated that hyperuricemia plays a role in atherogenesis in the development of CVD (9–11), there is little research available on the relationship between hypouricemia and hypouricemia with all-cause and CVD mortality.
In addition, the Framingham Heart Study found that patients with high atherosclerotic risk (HAR) have worse CVD prognosis (12–14). However, the synergistic effect of SUA combined with HAR on prognosis is still unclear. Although a few multicenter cohort studies have also focused on abnormal SUA levels combined with HAR, most studies were from Western countries and lack Asian data, especially in Chinese patients. Therefore, the aim of this research was to explore relationships among SUA levels, all-cause mortality, and cardiovascular mortality in HAR patients.
The ASSURE study (ClinicalTrials.gov identifier NCT03616769) is a multicenter prospective cohort study. The first cross-sectional survey was conducted in 2011. Eligible participants were followed up from November 2011 to June 2018 (mean follow-up was 68.71 ± 11.35 months). During the follow-up period, 76 subjects had missing data, and 97 were not compliant. Thus, the study sample comprised 3,047 eligible participants (1,625 male and 1,422 female participants) older than or equal to 35 years (mean age 60.2 ± 10.4 years). A total of hospitalized subjects were consecutively enrolled from the Cardiology Department of Beijing University Affiliated and of Shanghai Tongji University–affiliated hospitals. All subjects were under treatment for CVD. The inclusion criterion was HAR. The exclusion criteria were severe congestive heart failure and severe renal failure. Severe congestive heart failure was defined as greater than or equal to cardiac functional classification 3 formulated by the New York Heart Association (NYHA). Severe renal failure was defined as an estimated glomerular filtration rate (eGFR) <30 mL/min per 1.73 m2 (Figure 1). All participants provided written informed consent for this study, which was approved by the Ethics Committee of Tongji University.

Figure 1. Study flowchart.
Hospitalized myocardial infarction (MI) was classified as definite or probable based on chest pain symptoms, cardiac enzyme levels, electrocardiographic (ECG) findings, or angioplasty. Coronary heart disease (CHD) was determined to be present if there was (1) ECG evidence of a prior MI, (2) prior coronary artery bypass surgery or angioplasty, (3) coronary angiography showing CHD, (4) symptoms of angina and ECG revealing myocardial ischemia performance or laboratory tests showing increased cardiac enzymes and excluding other types of disease, or (5) a self-reported history of a physician-diagnosed heart attack. Coronary artery disease (CAD) death was classified as “definite” based on chest pain symptoms, hospital records, and medical history.
Cardiovascular events are composed of cardiac events, including non-fatal MI, unstable angina, and coronary revascularization procedures, during the follow-up period. The exclusion criteria were stable angina (>6 months), revascularization procedure for CAD (>6 months), and MI (>6 months).
In this study, cardiovascular death was the only cardiac event death considered. Medical records and death certificates for all patients who had an event were obtained and validated by a cardiologist. Death was confirmed from hospital records or by contact with participants and their families. All materials were reviewed independently by five senior physicians of the cohort study to confirm the cause of death.
Hyperuricemia refers to consuming a normal-purpurin diet, with two determinations on different days: SUA ≥420 μmol/L or 7 mg/dL (male), ≥ 357 μmol/L or 6 mg/dL (female) (15). Hypouricemia refers to consuming a normal-purpurin diet, with two determinations on different days: SUA ≤178 μmol/L or ≤3 mg/dL (male) and SUA ≤149 μmol/L or ≤2.5 mg/dL (female) (16, 17).
The Framingham risk score (FRS) was calculated based on coronary risk factors, including age, sex, total cholesterol (TC), low-density lipoprotein cholesterol (LDL-C), hypertension, and smoking status, according to the National Cholesterol Education Program Adult Treatment Panel III algorithm (18). The calculated total scores were used to estimate the 10-year CHD risk in participants without previous CVD and when an FRS > 20% or between 10 and 20% was considered HAR (18).
The diagnostic criteria for hypertension were as follows: patients taking antihypertensive medication or systolic blood pressure (SBP) ≥140 mm Hg or diastolic blood pressure ≥90 mm Hg (1 mm Hg = 133 kPa) or both. The criterion for hypertension was a single hypertensive disease.
Similarly, the criterion for dyslipidemia was a single dyslipidemic disease. The definition of dyslipidemia is abnormalities in serum levels of lipids, including overproduction or deficiency. Abnormal serum lipid profiles include high TC, high triglycerides (TGs), low HDL-C, and elevated LDL-C.
Qualified ultrasonographers measured ankle and brachial SBPs and Doppler ultrasound (Nicolet Vascular, Elite 100R, USA) was used to measure SBP in the bilateral brachial, tibial, and dorsal pedal arteries. The ankle–brachial index (ABI) has been shown to be a powerful independent marker of cardiovascular risk, with predictive ability similar to that of the Framingham criteria (19, 20).
A questionnaire was designed to collect from all participants information about general characteristics, diagnosis, medical history and related factors, medical treatment, and biochemical examination.
Factors were assessed for all subjects, including daily habits, medical histories, and blood samples. These blood samples were used to measure TC, TGs, HDL-C, LDL-C, serum creatinine (Cr), SUA, glucose, and fasting plasma glucose. Blood samples were drawn from an antecubital vein into a Vacutainer using a 19-gauge needle, and serum concentrations were assessed with commercially available kits. The GFR was calculated as GFR (mL/min per 1.73 m2) = 186 × creatinine−1.154 × age−0.203 and GFR (mL/min per 1.73 m2) = 142 × creatinine−1.154 × age−0.203 for males and females, respectively. Glucose was measured using a Hitachi 717 analyzer (Roche) with enzymatic reagents from Roche. The presence of symptomatic peripheral arterial disease (PAD) was evaluated by the Rose questionnaire (21). A previous MI or ischemic stroke was documented by hospital records. Physical examination data included body mass index (BMI), blood pressure, and ABI. Severe congestive heart failure was defined as greater than or equal to cardiac functional classification 3 formulated by the NYHA. Severe renal failure was defined as an eGFR <30 mL/min per 1.73 m2.
For follow-up, participants were contacted by physicians of the cohort study at annual intervals. Outcomes were obtained based on the annual phone interviews, 6-year follow-up examinations, hospital records, and death records. The primary clinical event endpoints of this study were estimated all-cause mortality and cardiovascular mortality. The secondary endpoints were CHD and CHD risk equivalent, including PAD, stroke, diabetes mellitus (DM), and CVD. Follow-up time was the number of years from the baseline (first) visit. For subjects who had more than one event, all clinical events were considered in the analysis.
All analyses were performed using the R statistical package (version 3.6.2) [http://www.r-project.org (22)]. Continuous variables are expressed as the mean ± SD and categorical variables as percentages. Continuous and categorical variable difference comparisons were made by independent-samples ANOVA (analysis of variance) and the χ2 test, as appropriate. The Kruskal–Wallis test was used to evaluate non-normally distributed continuous variables. A P < 0.05 was considered statistically significant. Due to a skewed distribution, TC, TG, HDL-C, LDL-C, Cr, and SUA were logarithm-transformed (log) for analyses. Crude death from all-cause and CVD was assessed by SUA stratification. Cumulative event rates were estimated with Kaplan-Meier survival curves, and probability values were calculated with the log-rank test. Cox proportional hazard analyses were performed to test the association of SUA and death from all causes or CVD. A Cox regression model was adjusted for potential confounders, including age, sex, duration of hypertension, smoking status, dyslipidemia history, chronic renal insufficiency history, DM history, percutaneous coronary angioplasty (PTCA) history, coronary artery bypass grafting (CABG) history, PAD history, MI history, ischemic stroke history, hypertension, ABI, FRS, eGFR, diuretics, center, and year of screening examination. Potential confounding variables with P < 0.10 were adjusted for multivariate analysis. Restricted cubic splines (RCSs) with knots were used to further explore the shape of the dose–response relationship between SUA level and the hazard ratio (HR) of all-cause mortality and CVD mortality. Knots were at the 5th, 50th, 90th, and quartile of the SUA distribution. Missing values were handled by K-means clustering imputation. All P-values were 2-tailed, and a value < 0.05 was considered significant. The optimized prognostic cutoff value of SUA was analyzed with X-Tile Software (version 3.6.1, https://medicine.yale.edu/lab/rimm/research/software). SUA transformed by RCS was added to the Cox regression mode as an independent variable, and all-cause CVD mortality scores were calculated. A survival receiver operating characteristic (ROC) curve was used to determine the predictive effect of SUA level and its variability on all-cause mortality and CVD mortality. The ROC curve and area under the curve (AUC) were implemented with a regression model predicting the score.
A total of 3,220 eligible participants with available baseline data were enrolled. Among the participants, 76 individuals had missing follow-up data because of changing the telephone number or family address during follow-up; 97 subjects were not compliant (Figure 1). Therefore, the study sample actually comprised 3,047 participants. Based on careful calculation, the missing participants did not significantly affect the results. Our research showed hyperuricemia and hypouricemia prevalences of 18.1 and 16.7%, respectively, and the average SUA for the entire cohort was 322.65 ± 33.12 μmol/L (standard deviation). According to SUA level, values were subdivided into 0–242.0, 242.0–312.0, 312.0–386.75, and more than 386.75 μmol/L subgroups. As shown in Table 1, among all variables examined, abnormal SUA was associated with hypertension, a higher proportion of male subjects, older age, a higher level of Cr, diuretic use, and chronic renal insufficiency. Regarding subjects with HAR, there was no significant difference for ischemic stroke, MI history, CABG history, PTCA history, DM, dyslipidemia, and smoking. Of note, significant differences were observed for female participants with FRS risk stratification. However, FRS risk stratification by subgroup was not significant in male participants. In contrast with the reference group, the participants were more likely to be treated with ACEI.
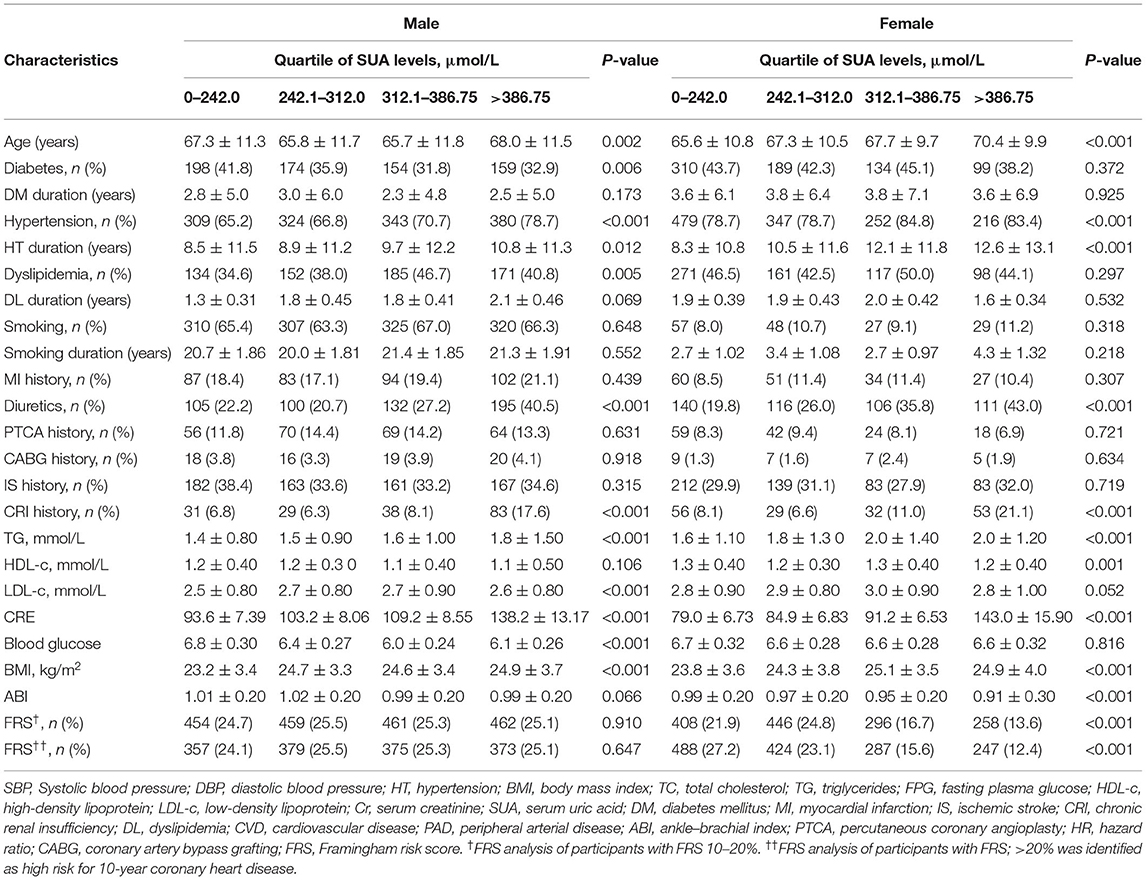
Table 1. Comparison of subjects' baseline characteristics of sex categories according to serum uric acid level.
After multivariable adjustment, Cox regression models revealed that compared with the SUA (242.0–312.0) subgroup, all-cause mortality was 24.5, 19.1, 22.9, and 35.9% in the SUA (0–242.0), SUA (312.0–386.75), and SUA >386.75 μmol/L subgroups, respectively (Table 2); CVD mortality rates were 12.2, 10.8, 13.4 and 18.3%, respectively. HRs of all-cause mortality and cardiovascular mortality were 2.05 (95% CI = 1.35–2.90), 1.85 (95% CI = 1.54–2.76), and 2.11 (95% CI = 1.59–3.07) and 1.95 (95% CI = 1.29–2.90), 1.70 (95% CI = 1.05–2.81), and 2.42(95% CI = 1.61–3.12), respectively, for the above subgroups.
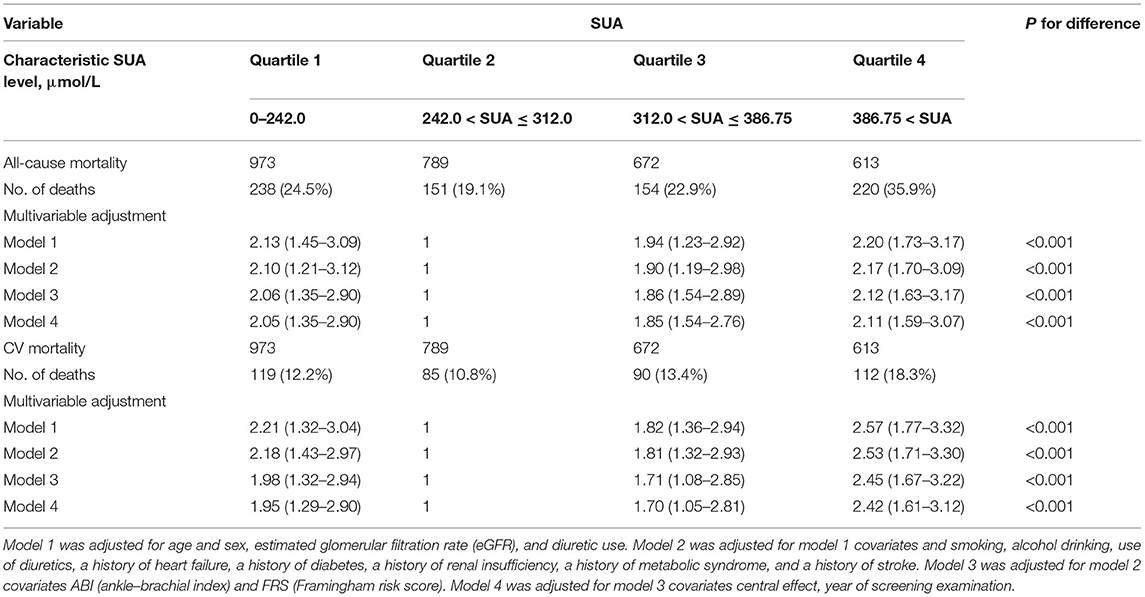
Table 2. Adjusted hazard ratio for all-cause mortality and cardiovascular disease (CVD) mortality by Cox regression models according to serum uric acid level.
Figures 2A,B illustrate the relationship among the SUA quartile categories of all-cause mortality and CVD mortality, respectively. Kaplan–Meier curves of survival showed the highest all-cause mortality and cardiovascular mortality for the SUA >386.75 μmol/L subgroup, followed by the SUA 0–242.0 and 312.0–386.75 μmol/L subgroups. The SUA 242.0–312.0 μmol/L subgroup had the least mortality. As depicted in Figure 3, after multivariable adjustment, cubic spline models showed a U-shaped association between SUA level with all-cause mortality (A, B) and CVD-cause mortality (C, D) among males and females, respectively.
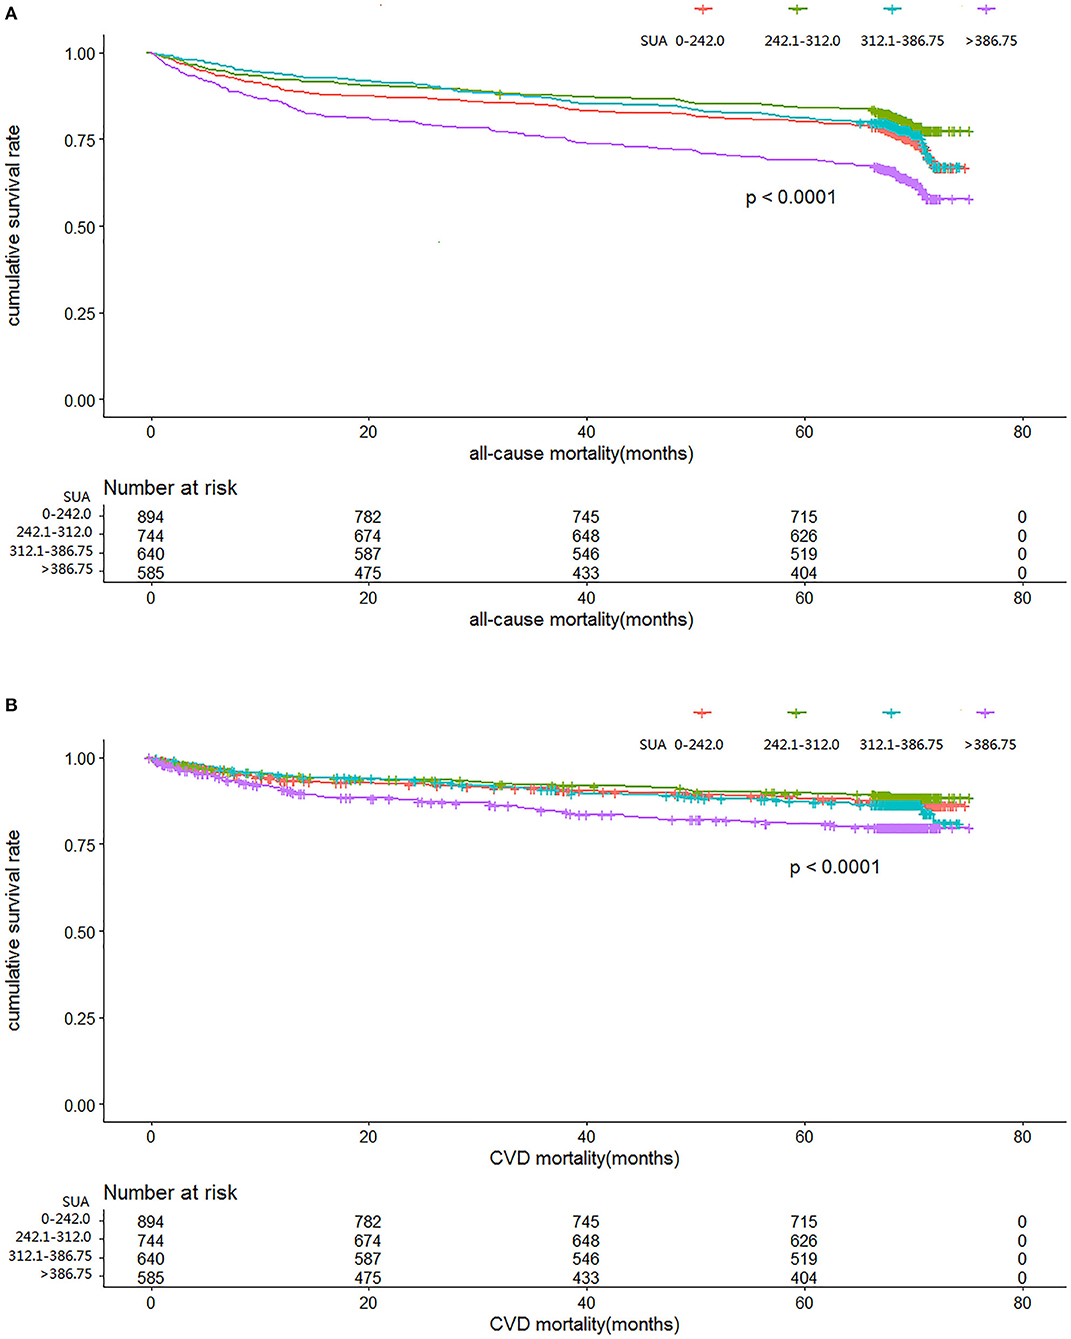
Figure 2. Time course to death from all causes (A) and cardiovascular disease (CVD) (B) according to serum uric acid level in the cohort study during 6-year follow-up.
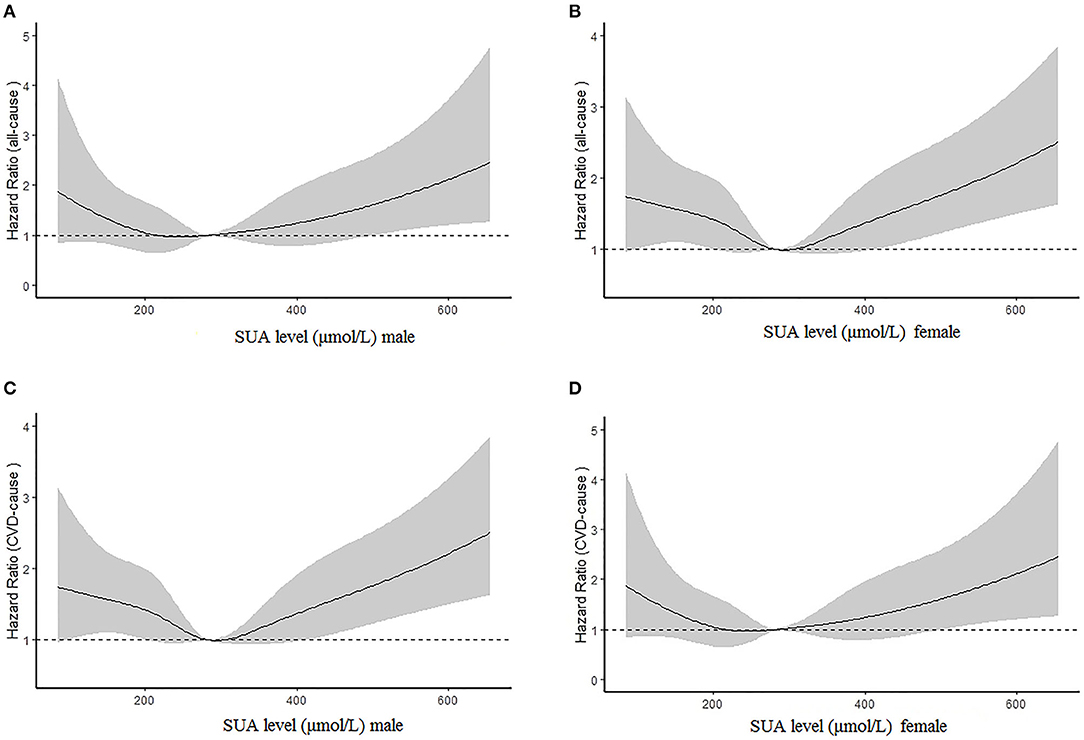
Figure 3. Multivariable adjusted cubic spline models for the association between serum uric acid (SUA) level and hazard ratios (HRs) for all-cause mortality among males (A) and females (B) and cardiovascular disease (CVD) mortality between males (C) and females (D).
The results of age- and sex-adjusted survival ROCs (Figure 4) indicated that SUA level can predict all-cause mortality, with an AUC of apparent prediction of 0.706 (95% CI = 0.696–0.727; P < 0.001); when adjusted for age and sex, the AUC was 0.702 (95% CI = 0.692–0.725, P < 0.001). Meanwhile, SUA levels predicted CVD-cause mortality, and the AUC of apparent prediction was 0.716 (95% CI = 0.701–0.747, P < 0.001); when adjusted for age and sex, the AUC was 0.711 (95% CI = 0.697–0.742, P < 0.001).
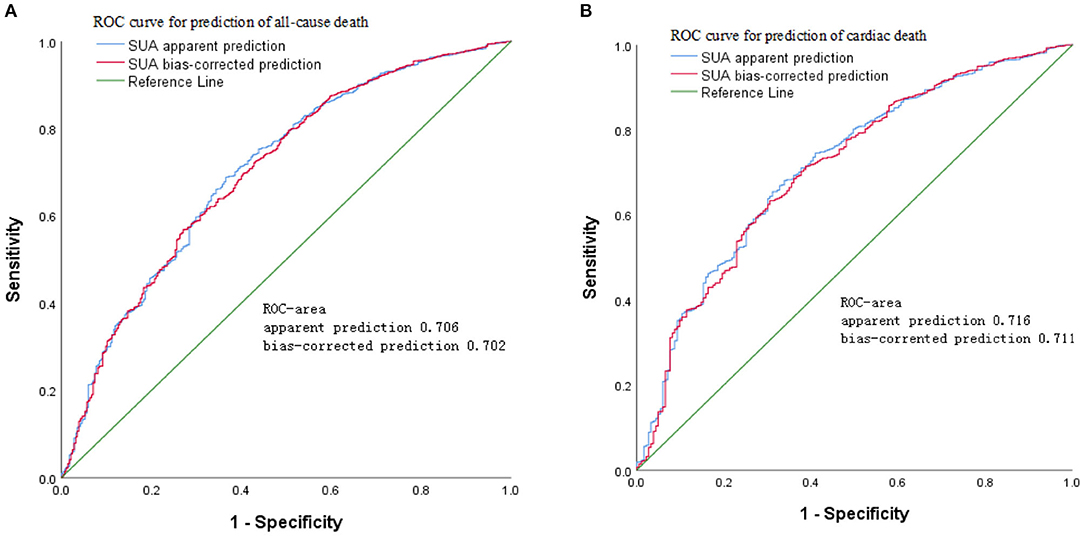
Figure 4. Age- and sex-adjusted receiver operating characteristic (ROC) curves for predicting (A) all-cause mortality and (B) cardiovascular disease (CVD) mortality according to serum uric acid (SUA) in the cohort study during 6-year follow-up.
Figure 5 shows the adjusted proportional HR of mortality according to SUA cutoff value. Compared with the SUA 180.5–370.5 μmol/L subgroup, HRs for all-cause mortality and cardiovascular mortality in males in the SUA 0–180.5 and SUA >370.5 μmol/L subgroups were 2.01 (95% CI = 1.35–2.56) and 2.08 (95% CI = 1.42–2.57) and 1.79 (95% CI = 1.45–2.57) and 2.09 (95% CI = 1.47–2.62), respectively, after adjusting for age, hypertension, stroke, MI history, smoking status, chronic renal disease, PAD history, PTCA history, and CABG history. In females, HRs of all-cause and CVD mortality were 1.98 (95% CI = 1.25–2.53) and 2.04 (95% CI = 1.39–2.61), and 1.89 (95% CI = 1.31–2.67) and 2.02 (95% CI = 1.43–2.74), respectively.
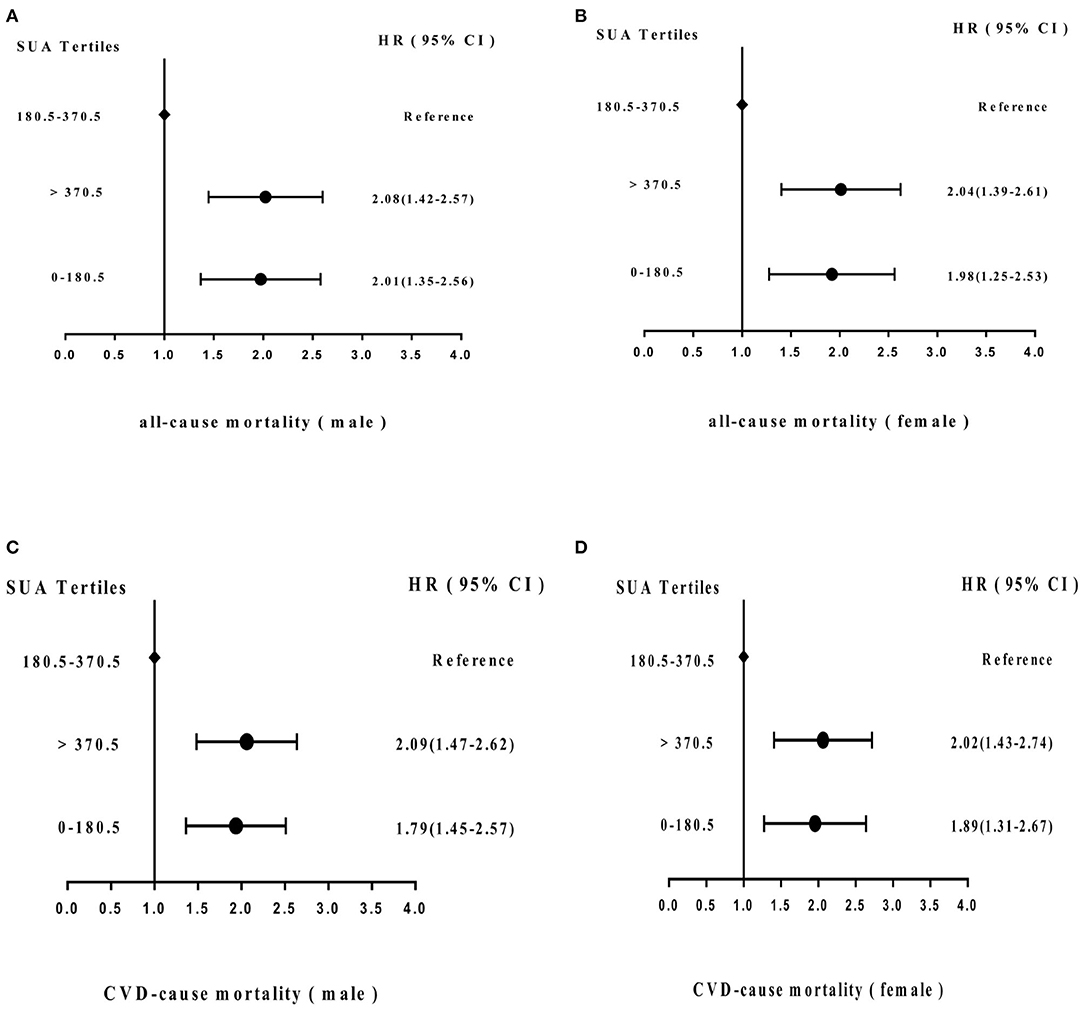
Figure 5. Adjusted hazard ratios (HRs) for (A) all-cause mortality (male) and (B) (female) and (C) cardiovascular disease (CVD) mortality (male) and (D) (female) according to cutoff values of SUA level in the cohort study during 6-year follow-up. CI, confidence interval.
Based on Figures 6A,B, Cox regression models also demonstrated that factors for risk of mortality included sex, age, hypertension, stroke, metabolic syndrome, DM, MI history, PAD history, hyperlipidemia history, smoking status, PTCA history, CABG history, and low eGFR. Of note, among these risk factors, age, hypertension, stroke, DM, lower eGFR, abnormal ABI, MI history, and CABG history occupied major positions.
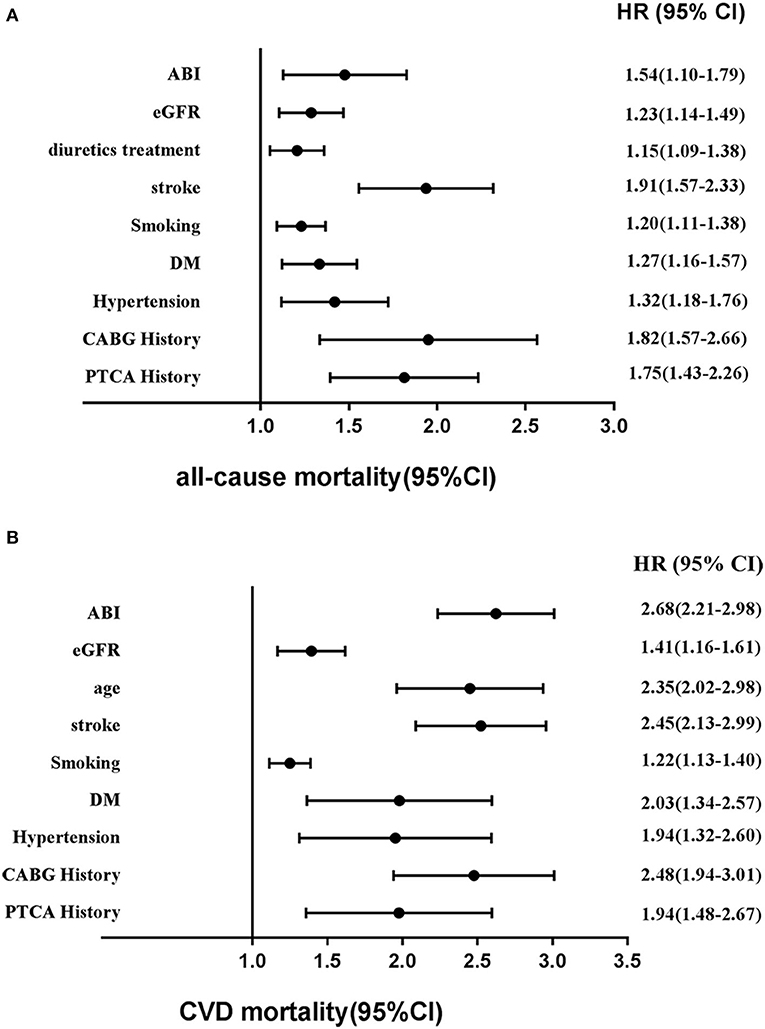
Figure 6. Adjusted other hazards ratios for (A) all-cause mortality and (B) CVD mortality in the cohort study during 6-year follow-up. CVD, cardiovascular disease; HR, hazards ratio; CI, confidence interval; eGFR, estimated glomerular filtration rate; ABI, ankle–brachial index.
Because of the close relationship between SUA level, dietary structure, and obvious diet differences among northern and southern China, we selected in-hospital patients from Beijing and Shanghai to represent these areas. In this cohort study, after further adjusting for potential confounders, the main findings according to SUA levels suggest a U-shaped, independent relationship, instead of a dose–response relationship, between SUA level and all-cause mortality and CVD mortality in both males and females. Furthermore, the findings indicate that long-term average SUA levels >370.5 μmol/L or 6.22 mg/dL (male) and >327.65 μmol/L or 5.50 mg/dL (female) significantly increase the risk of all-cause mortality and CVD mortality. Moreover, long-term low-level SUA <180.5 μmol/L or 3.03 mg/dL (male) <165.7 μmol/L or 2.78 mg/dL (female) was an independent risk factor for all-cause mortality and CVD mortality.
According to normal hyperuricemia and hypouricemia definitions, the prevalences of hyperuricemia and hypouricemia were 18.1 and 16.7%, respectively. Previous studies have indicated that sex affects SUA metabolism and the normal value range. Therefore, sex stratification analysis was carried out. Considering that FRS was a potential confounding factor, the Cox regression model was adjusted for FRS between males and females. The results revealed that the second quartile of SUA level (242.0–312.0 μmol/L) had the least mortality compared with other quartiles. In addition, RCSs and Kaplan–Meier survival estimation indicated high and low SUA to be undesirable.
Because we enrolled HAR patients, baseline characteristics indicated no significant difference in stroke, DM, MI history, PTCA history, CABG history, hyperlipidemia, or smoking status. Nonetheless, we found that the use of diuretics and low eGFR correlated substantially with SUA; after controlling for eGFR and diuretic use, HR estimates suggested only marginal changes, and the data only demonstrated some collinearity among eGFR, diuretics, and SUA. Consequently, the results revealed an independent association between SUA, all-cause mortality, and CVD mortality.
The relationship between SUA and mortality has been explored in previous studies. Similarly, several studies including a longitudinal Taiwanese cohort study (23), US adult cohort study (24), Korean study (25, 26) and Chinese chronic kidney disease study (17) reported U-shaped associations between SUA and all-cause mortality as well as cardiovascular mortality. Nevertheless, the different patient populations recruited might affect the occurrence of ending events to affect different SUA cutoff values and ranges of variation. Our study assessed values providing better prediction by X-Tile Software and ROC curves. After adjusting for confounding factors, this research revealed that the lowest mortality for a range of SUA of 180.5–370.5 μmol/L or 3.03–6.22 mg/dL (male) and 165.7–327.65 μmol/L or 2.78–5.50 mg/dL (female). Although early studies, including the Framingham Heart Study (27), Atherosclerosis Risk In Communities study (28), and Vorarlberg Health Monitoring and Promotion Program (29), reported a relationship between SUA and CHD and death, no U-curve distribution was observed because the studies mainly focused on patients with hyperuricemia. Recently, the Journal of Hypertension, High Blood Pressure, and Cardiovascular Prevention all published cutoff points (30, 31). Notably, the URRAH Project investigating hyperuricemia correlations with all-cause mortality and CVD mortality reported the best cutoff values of 4.7 and 5.6 mg/dL, respectively (31). Although our findings were similar, AUCs were smaller than the URRAH Project's results. The reason may be that ROC curves only assess statistical performance for single-trend variables, and the statistical efficiency is insufficient to demonstrate a U-shaped curve. For this reason, our study involved adding transformed SUA variables by RCS to a Cox regression model and calculating predictive all-cause and CVD-cause mortality scores. Then, the optimum predictive effect of the SUA level was determined using ROC analysis. This may explain why the AUC was slightly smaller but the HR higher than in the URRAH Project.
From the perspective of pathophysiology, previous studies have revealed that hyperuricemia may have detrimental effects on the endothelium and functions of platelets (32), induce oxidative stress and activate the local renin–angiotensin system in cultured vascular smooth muscle cells (33), lead to attenuated nitric oxide bioavailability, and promote the proliferation of vascular smooth muscle (32, 34, 35). Further studies have reported that reduced SUA levels may contribute to the treatment of hyperuricemia-associated diseases (36, 37).
Notably, hypouricemia was also found to be associated with all-cause mortality and cardiovascular mortality. Recently, several studies, including USA Adults Study, reported similar results (24). At present, there is no recognized standard for the diagnosis of hypouricemia. According to the definition of hypouricemia in most previous studies (16, 17, 38, 39), the reference limit was defined as a level of SUA < 149 μmol/L or 2.5 mg/dL. A possible etiology by which hypouricemia increases all-cause mortality may be caused by malignancy (40, 41), DM, and concomitant medication (42, 43). Nevertheless, these studies were limited by the absence of important covariates, such as smoking status and BMI. Recently, growing evidence suggests that SUA plays an important role in immune regulation and tumor inhibition (43). Therefore, the increase in mortality due to hypouricemia is partly owing to cancer incidence (44). Meanwhile, malignant tumors, as a kind of consumptive disease, have repeatedly appeared later in hypouricemia (45). These details may partly explain why hypouricemia patients tend to have higher all-cause mortality. SUA also acts as an antioxidant that can interact with hydrogen peroxide and hydroxy radicals to effectively scavenge free radicals in the body, thus protecting vascular endothelial cells (12). This research also indicates that patients with hypouricemia have increased all-cause and CVD mortality.
In addition to hyperuricemia and hypouricemia, age, smoking status, hypertension, ischemic stroke, MI, PAD, BMI, and lower eGFR were independent mortality risk factors in this study.
In conclusion, the findings reveal a U-shaped relationship between SUA level and all-cause mortality and cardiovascular mortality in HAR patients, regardless of sex. The results indicate that hyperuricemia and hypouricemia increased mortality and that SUA may serve as an easily tested index to predict mortality. Therefore, more intensive management regarding SUA is needed in clinical practice, especially in HAR patients. In addition, well-designed clinical trials focusing on SUA and its concomitant changes are needed to prevent all-cause and cardiovascular mortality.
First, subjects with HAR were enrolled to assemble a study population as homogeneous as possible, as HAR patients have a poor prognosis. Thus, the results cannot be extended to the entire population. Second, as follow-up participants were contacted by annual phone interviews, our results may have information bias. In addition, some patients had poor compliance, and withdrawal bias may exist. Finally, the follow-up time was not long compared with Western country prospective cohort studies. Hence, the data from this research are not comprehensive, and additional studies are needed.
The strengths of our study include its prospective design and reliable assessment of mortality and cardiovascular events. Second, this research was a multicenter prospective cohort registration study with little heterogeneity. This cohort study also had a longer follow-up time and larger sample size than other Chinese studies.
After adjusting for sex and other covariates, this study revealed that SUA level shows a U-shaped relationship with all-cause mortality and cardiovascular mortality. Abnormal SUA values correlated strongly, independently, and inversely with all-cause and cardiovascular mortality. Long-term average SUA levels >370.5 μmol/L or 6.22 mg/dL (male) and >327.65 μmol/L or 5.50 mg/dL significantly increased the risk of all-cause mortality and CVD mortality in females. Meanwhile, low-level SUA <180.5 μmol/L or 3.03 mg/dL (male) and <165.7 μmol/L or 2.78 mg/dL (female) was an independent risk factor for all-cause mortality and CVD mortality. Age- and sex-adjusted survival ROC curve analyses indicated that SUA level can predict all-cause mortality, with an AUC of 0.702 (95% CI = 0.692–0.725, P < 0.001), and CVD mortality, with an AUC of 0.711 (95% CI = 0.697–0.742, P < 0.001). After adjusting for confounding factors, compared with the SUA 180.5–370.5 μmol/L subgroup, HRs for all-cause mortality and cardiovascular mortality were 2.01 (95% CI = 1.35–2.56) and 2.08 (95% CI = 1.42–2.57) and 1.79 (95% CI = 1.45–2.57) and 2.09 (95% CI = 1.47–2.62), respectively, in males in SUA (0–180.5) and SUA >370.5 μmol/L subgroups and 1.98 (95% CI = 1.25–2.53) and 2.04 (95% CI = 1.39–2.61), and 1.89 (95% CI = 1.31–2.67) and 2.02 (95% CI = 1.43–2.74), respectively, in females in SUA (0–180.5) and SUA >370.5 μmol/L subgroups. In addition to hyperuricemia and hypouricemia, age, smoking status, hypertension, ischemic stroke, MI, PAD, BMI, and lower eGFR are independent mortality risk factors.
The original contributions presented in the study are included in the article/supplementary material, further inquiries can be directed to the corresponding author/s.
The studies involving human participants were reviewed and approved by the ethics committee of Tongji University (NCT03616769). The patients/participants provided their written informed consent to participate in this study. Written informed consent was obtained from the individual(s) for the publication of any potentially identifiable images or data included in this article.
YC had full access to all of the data in the study and takes responsibility for the integrity of the data and the accuracy of the data analysis. YC: study concept and design, analysis and interpretation of data, drafting of the manuscript, critical revision of the manuscript for important intellectual content, and statistical analysis. YC and SX: acquisition of data. YC and YX: study supervision. All authors contributed to the article and approved the submitted version.
This study was sponsored by Shanghai Municipal Population and Family Planning Commission (Grant no: 15GWZK1002).
The authors declare that the research was conducted in the absence of any commercial or financial relationships that could be construed as a potential conflict of interest.
We thank all the people who contributed to this paper, especially survey collaboration members and all participants.
CVD, cardiovascular disease; SUA, serum uric acid; ABI, ankle–brachial index; HAR, high atherosclerotic risk; RCS, restricted cubic splines; BMI, body mass index; TC, total cholesterol; HDL-C, high-density lipoprotein cholesterol; LDL-C, low-density lipoprotein cholesterol; DM, diabetes mellitus; HR, hazard ratios; FRS, Framingham risk score; PAD, peripheral arterial disease; SBP, systolic blood pressure; DBP, diastolic blood pressure; IS, ischemic stroke; CRI, chronic renal insufficiency; DL, dyslipidemia; eGFR, estimated glomerular filtration rate; CHD, coronary heart disease; PCI, percutaneous coronary stent implantation; CABG, coronary artery bypass grafting; MI, myocardial infarction; Cr, serum creatinine; ROC, receiver operating characteristic; AUC, area under the curve.
1. Khan F, George J, Wong K, McSwiggan S, Struthers AD, Belch JJF. The association between serum urate levels and arterial stiffness/endothelial function in stroke survivors. Atherosclerosis. (2008) 200:374–9. doi: 10.1016/j.atherosclerosis.2007.12.023
2. So A, Thorens B. Uric acid transport and disease. J Clin Invest. (2010) 120:1791–9. doi: 10.1172/JCI42344
3. Strazzullo P, Puig JG. Uric acid and oxidative stress: relative impact on cardiovascular risk? Nutr Metab Cardiovasc Dis. (2007) 17:409–14. doi: 10.1016/j.numecd.2007.02.011
4. Doehner W, Landmesser U. Xanthine oxidase and uric acid in cardiovascular disease: clinical impact and therapeutic options. Semin Nephrol. (2011) 31:433–40. doi: 10.1016/j.semnephrol.2011.08.007
5. Wang R, Song Y, Yan Y, Ding Z. Elevated serum uric acid and risk of cardiovascular or all-cause mortality in people with suspected or definite coronary artery disease: a meta-analysis. Atherosclerosis. (2016) 254:193–9. doi: 10.1016/j.atherosclerosis.2016.10.006
6. Zhang W, Iso H, Murakami Y, Miura K, Nagai M, Sugiyama D, et al. Serum uric acid and mortality form cardiovascular disease: EPOCH-JAPAN study. J Atheroscler Thromb. (2016) 23:692–703. doi: 10.5551/jat.Er31591
7. Magnoni M, Berteotti M, Ceriotti F, Mallia V, Vergani V, Peretto G, et al. Serum uric acid on admission predicts in-hospital mortality in patients with acute coronary syndrome. Int J Cardiol. (2017) 240:25–9. doi: 10.1016/j.ijcard.2017.04.027
8. Braga F, Pasqualetti S, Ferraro S, Panteghini M. Hyperuricemia as risk factor for coronary heart disease incidence and mortality in the general population: a systematic review and meta-analysis. Clin Chem Lab Med. (2016) 54:7–15. doi: 10.1515/cclm-2015-0523
9. Wang J, Qin T, Chen J, Li Y, Wang L, Huang H, et al. Hyperuricemia and risk of incident hypertension: a systematic review and meta-analysis of observational studies. PLoS ONE. (2014) 9:e114259. doi: 10.1371/journal.pone.0114259
10. Huang H, Huang B, Li Y, Huang Y, Li J, Yao H, et al. Uric acid and risk of heart failure: a systematic review and meta-analysis. Eur J Heart Fail. (2014) 16:15–24. doi: 10.1093/eurjhf/hft132
11. Li Q, Zhang Y, Ding D, Yang Y, Chen Q, Liu C, et al. Association between serum uric acid and mortality among Chinese patients with coronary artery disease. Cardiology. (2016) 134:347–56. doi: 10.1159/000443518
12. Korn EL, Graubard BI, Midthune D. Time-to-event analysis of longitudinal follow-up of a survey: choice of the time-scale. Am J Epidemiol. (1997) 145:72–80. doi: 10.1093/oxfordjournals.aje.a009034
13. Wilson PWF, Bozeman SR, Burton TM, Hoaglin DC, Ben-Joseph R, Pashos CL. Prediction of first events of coronary heart disease and stroke with consideration of adiposity. Circulation. (2008) 118:124–30. doi: 10.1161/CIRCULATIONAHA.108.772962
14. Greenland P, Knoll MD, Stamler J, Neaton JD, Dyer AR, Garside DB, et al. Major risk factors as antecedents of fatal and nonfatal coronary heart disease events. JAMA. (2003) 290:891–7. doi: 10.1001/jama.290.7.891
15. Fang J, Alderman MH. Serum uric acid and cardiovascular mortality the NHANES I epidemiologic follow-up study, 1971-1992. National Health and Nutrition Examination Survey. JAMA. (2000) 283:2404–10. doi: 10.1001/jama.283.18.2404
16. Bairaktari ET, Kakafika AI, Pritsivelis N, Hatzidimou KG, Tsianos EV, Seferiadis KI, et al. Hypouricemia in individuals admitted to an inpatient hospital-based facility. Am J Kidney Dis. (2003) 41:1225–32. doi: 10.1016/S0272-6386(03)00355-X
17. Li Z, Ding H, Chen C, Chen Y, Wang DW, Lv Y. Novel URAT1 mutations caused acute renal failure after exercise in two Chinese families with renal hypouricemia. Gene. (2013) 512:97–101. doi: 10.1016/j.gene.2012.09.115
18. Expert Panel on Detection E Treatment of High Blood Cholesterol in A. Executive summary of the third report of the national cholesterol education program (NCEP) expert panel on detection, evaluation, and treatment of high blood cholesterol in adults (Adult Treatment Panel III). JAMA. (2001) 285:2486–97. doi: 10.1001/jama.285.19.2486
19. O'Hare AM, Katz R, Shlipak MG, Cushman M, Newman AB. Mortality and cardiovascular risk across the ankle-arm index spectrum: results from the cardiovascular health study. Circulation. (2006) 113:388–93. doi: 10.1161/CIRCULATIONAHA.105.570903
20. Ankle Brachial Index C, Fowkes FGR, Murray GD, Butcher I, Heald CL, Lee RJ, et al. Ankle brachial index combined with Framingham risk score to predict cardiovascular events and mortality: a meta-analysis. JAMA. (2008) 300:197–208. doi: 10.1001/jama.300.2.197
21. Rose G, McCartney P, Reid DD. Self-administration of a questionnaire on chest pain and intermittent claudication. Br J Prev Soc Med. (1977) 31:42–8. doi: 10.1136/jech.31.1.42
22. R A. Language and Environment for Statistical Computing R Foundation for Statistical Computing. Vienna.
23. Tseng WC, Chen YT, Ou SM, Shih CJ, Tarng DC, Taiwan Geriatric Kidney Disease Research G. U-Shaped association between serum uric acid levels with cardiovascular and all-cause mortality in the elderly: the role of malnourishment. J Am Heart Assoc. (2018) 7:e007523. doi: 10.1161/JAHA.117.007523
24. Hu L, Hu G, Xu BP, Zhu L, Zhou W, Wang T, et al. U-Shaped association of serum uric acid with all-cause and cause-specific mortality in US adults: a cohort study. J Clin Endocrinol Metab. (2020) 105:dgz068. doi: 10.1210/clinem/dgz068
25. Cho SK, Chang Y, Kim I, Ryu S. U-Shaped association between serum uric acid level and risk of mortality: a cohort study. Arthrit Rheumatol. (2018) 70:1122–32. doi: 10.1002/art.40472
26. Kim K, Go S, Son HE, Ryu JY, Lee H, Heo NJ, et al. Association between serum uric acid level and ESRD or death in a Korean population. J Korean Med Sci. (2020) 35:e254. doi: 10.3346/jkms.2020.35.e254
27. Culleton BF, Larson MG, Kannel WB, Levy D. Serum uric acid and risk for cardiovascular disease and death: the Framingham heart study. Anna Inter Med. (1999) 131:7–13. doi: 10.7326/0003-4819-131-1-199907060-00003
28. Moriarity JT, Folsom AR, Iribarren C, Nieto FJ, Rosamond WD. Serum uric acid and risk of coronary heart disease: atherosclerosis risk in communities (ARIC) study. Ann Epidemiol. (2000) 10:136–43. doi: 10.1016/S1047-2797(99)00037-X
29. Ulmer H, Kelleher C, Diem G, Concin H. Long-term tracking of cardiovascular risk factors among men and women in a large population-based health system: the vorarlberg health monitoring & promotion programme. Eur Heart J. (2003) 24:1004–13. doi: 10.1016/S0195-668X(03)00170-2
30. Virdis A, Masi S, Casiglia E, Tikhonoff V, Cicero AFG, Ungar A, et al. Identifification of the uric acid thresholds predicting an increased total and cardiovascular mortality over 20 years. Hypertension. (2020) 75:302–8. doi: 10.1161/HYPERTENSIONAHA.119.13643
31. Maloberti A, Giannattasio C, Bombelli M, Desideri G, Cicero AFG, Muiesan ML, et al. Hyperuricemia and risk of cardiovascular outcomes: the experience of the URRAH (uric acid right for heart health) project. High Blood Press Cardiovasc Prev. (2020) 27:121–8. doi: 10.1007/s40292-020-00368-z
32. Feig DI, Kang DH, Johnson RJ. Uric acid and cardiovascular risk. N Engl J Med. (2008) 359:1811–21. doi: 10.1056/NEJMra0800885
33. Corry DB, Eslami P, Yamamoto K, Nyby MD, Makino H, Tuck ML. Uric acid stimulates vascular smooth muscle cell proliferation and oxidative stress via the vascular renin-angiotensin system. J Hypertens. (2008) 26:269–75. doi: 10.1097/HJH.0b013e3282f240bf
34. Khosla UM, Zharikov S, Finch JL, Nakagawa T, Roncal C, Mu W, et al. Hyperuricemia induces endothelial dysfunction. Kidney Int. (2005) 67:1739–42. doi: 10.1111/j.1523-1755.2005.00273.x
35. Kanbay M, Segal M, Afsar B, Kang DH, Rodriguez-Iturbe B, Johnson RJ. The role of uric acid in the pathogenesis of human cardiovascular disease. Heart. (2013) 99:759–66. doi: 10.1136/heartjnl-2012-302535
36. Rizzo M, Obradovic M, Labudovic-Borovic M, Nikolic D, Montalto G, Rizvi AA, et al. Uric acid metabolism in pre-hypertension and the metabolic syndrome. Curr Vasc Pharmacol. (2014) 12:572–85. doi: 10.2174/1570161111999131205160756
37. Xu L, Shi Y, Zhuang S, Liu N. Recent advances on uric acid transporters. Oncotarget. (2017) 8:100852–62. doi: 10.18632/oncotarget.20135
38. Son C-N, Kim J-M, Kim S-H, Cho S-K, Choi C-B, Sung Y-K, et al. Prevalence and possible causes of hypouricemia at a tertiary care hospital. Korean J Intern Med. (2016) 31:971–6. doi: 10.3904/kjim.2015.125
39. Kuwabara M, Niwa K, Ohtahara A, Hamada T, Miyazaki S, Mizuta E, et al. Prevalence and complications of hypouricemia in a general population: a large-scale cross-sectional study in Japan. PLoS ONE. (2017) 12:e0176055. doi: 10.1371/journal.pone.0176055
40. Lesmes A, Díaz-Curiel M, Castrillo JM. Tumoural hypouricemia. Adv Exp Med Biol. (1980) 122A:145–8. doi: 10.1007/978-1-4615-9140-5_23
42. Shichiri M, Iwamoto H, Shiigai T. Diabetic renal hypouricemia. Arch Intern Med. (1987) 147:225–8. doi: 10.1001/archinte.1987.00370020045033
43. Bo S, Cavallo-Perin P, Gentile L, Repetti E, Pagano G. Hypouricemia and hyperuricemia in type 2 diabetes: two different phenotypes. Eur J Clin Invest. (2001) 31:318–21. doi: 10.1046/j.1365-2362.2001.00812.x
44. Hisatome I, Ogino K, Kotake H, Ishiko R, Saito M, Hasegawa J, et al. Cause of persistent hypouricemia in outpatients. Nephron. (1989) 51:13–6. doi: 10.1159/000185233
Keywords: serum uric acid, all-cause mortality, cardiovascular mortality, framingham risks, atherosclerosis risks
Citation: Cang Y, Xu S, Zhang J, Ju J, Chen Z, Wang K, Li J and Xu Y (2021) Serum Uric Acid Revealed a U-Shaped Relationship With All-Cause Mortality and Cardiovascular Mortality in High Atherosclerosis Risk Patients: The ASSURE Study. Front. Cardiovasc. Med. 8:641513. doi: 10.3389/fcvm.2021.641513
Received: 14 December 2020; Accepted: 23 March 2021;
Published: 24 May 2021.
Edited by:
Simon Fryer, University of Gloucestershire, United KingdomReviewed by:
Arrigo Francesco Giuseppe Cicero, University of Bologna, ItalyCopyright © 2021 Cang, Xu, Zhang, Ju, Chen, Wang, Li and Xu. This is an open-access article distributed under the terms of the Creative Commons Attribution License (CC BY). The use, distribution or reproduction in other forums is permitted, provided the original author(s) and the copyright owner(s) are credited and that the original publication in this journal is cited, in accordance with accepted academic practice. No use, distribution or reproduction is permitted which does not comply with these terms.
*Correspondence: Yan Cang, cang_gu@aliyun.com; Yawei Xu, xuyawei@tongji.edu.cn
Disclaimer: All claims expressed in this article are solely those of the authors and do not necessarily represent those of their affiliated organizations, or those of the publisher, the editors and the reviewers. Any product that may be evaluated in this article or claim that may be made by its manufacturer is not guaranteed or endorsed by the publisher.
Research integrity at Frontiers
Learn more about the work of our research integrity team to safeguard the quality of each article we publish.