
94% of researchers rate our articles as excellent or good
Learn more about the work of our research integrity team to safeguard the quality of each article we publish.
Find out more
ORIGINAL RESEARCH article
Front. Cardiovasc. Med. , 09 February 2021
Sec. Cardiovascular Imaging
Volume 8 - 2021 | https://doi.org/10.3389/fcvm.2021.641088
This article is part of the Research Topic What do we know about COVID-19 implications for cardiovascular disease? View all 109 articles
 Yanting Zhang1,2,3†
 Wei Sun1,2,3†
 Chun Wu1,2,3†
 Yiwei Zhang1,2,3†
 Li Cui1,2,3
 Yuji Xie1,2,3
 Bin Wang1,2,3
 Lin He1,2,3
 Hongliang Yuan1,2,3
 Yongxing Zhang1,2,3
 Yu Cai1,2,3
 Meng Li1,2,3
 Yu Zhang1,2,3
 Yun Yang1,2,3
 Yuman Li1,2,3
 Jing Wang1,2,3
 Yali Yang1,2,3
 Qing Lv1,2,3*
 Li Zhang1,2,3*
 Mingxing Xie1,2,3*
Background: RVEF (right ventricular ejection fraction) measured by three-dimensional echocardiography (3DE) has been used in evaluating right ventricular (RV) function and can provide useful prognostic information in other various cardiovascular diseases. However, the prognostic value of 3D-RVEF in coronavirus disease 2019 (COVID-19) remains unknown. We aimed to investigate whether 3D-RVEF can predict the mortality of COVID-19 patients.
Methods: A cohort of 128 COVID-19-confirmed patients who had undergone echocardiography were studied. Thirty-one healthy volunteers were also enrolled as controls. COVID-19 patients were divided into three subgroups (general, severe, and critical) according to COVID-19 severity-of-illness. Conventional RV structure and function parameters, RV free wall longitudinal strain (FWLS) and 3D-RVEF were acquired. RVFWLS was measured by two-dimensional speckle tracking echocardiography. RVEF was acquired by 3DE.
Results: Compared with controls, 2D-RVFWLS and 3D-RVEF were both significantly decreased in COVID-19 patients (−27.2 ± 4.4% vs. −22.9 ± 4.8%, P < 0.001; 53.7 ± 4.5% vs. 48.5 ± 5.8%, P < 0.001). Critical patients were more likely to have a higher incidence of acute cardiac injury and acute respiratory distress syndrome (ARDS), and worse prognosis than general and severe patients. The critical patients exhibited larger right-heart chambers, worse RV fractional area change (RVFAC), 2D-RVFWLS, and 3D-RVEF and higher proportion of pulmonary hypertension than general and severe patients. Eighteen patients died during a median follow-up of 91 days. The multivariate Cox regression analysis revealed the acute cardiac injury, ARDS, RVFAC, RVFWLS, and 3D-RVEF were independent predictors of death. 3D-RVEF (chi-square to improve 18.3; P < 0.001), RVFAC (chi-square to improve 4.5; P = 0.034) and 2D-RVFWLS (chi-square to improve 5.1; P = 0.024) all provided additional prognostic value of higher mortality over clinical risk factors. Moreover, the incremental predictive value of 3D-RVEF was significantly (P < 0.05) higher than RVFAC and RVFWLS.
Conclusion: 3D-RVEF was the most robust independent predictor of mortality in COVID-19 patients and provided a higher predictive value over conventional RV function parameters and RVFWLS, which may be helpful to identify COVID-19 patients at a higher risk of death.
Cardiac injury was a prevalent complication and was associated with worse prognosis in COVID-19 patients, with an incidence ranging from 7.2 to 27.8% (1–5). The increased cardiac workload resulting from respiratory failure and hypoxemia is a common mechanism of cardiac injury and the right ventricle may bear the brunt of its impact (3). Echocardiography is a convenient and widely available imaging tool for assessing cardiac function. Although both left ventricular (LV) dysfunction and right ventricular (RV) dysfunction are noted in hospitalized COVID-19 patients, the incidence of the latter is higher and the worse RV function is associated with clinical deterioration (i.e., hemodynamic instability, cardiac deterioration, and respiratory deterioration) (6–8). Furthermore, right ventricular free wall longitudinal strain (RVFWLS) derived from two-dimensional speckle tracking echocardiography (2D-STE) has been proven to be a more effective factor to predict mortality than conventional RV function parameters in COVID-19 patients (9). However, 2D-STE has the intrinsic limitation of losing speckles from out-of-plane cardiac motion. Additionally, given the complex structure of the RV and the three–dimensional (3D) motion of heart, 3D analysis could potentially provide better and more accurate assessment compared to 2D analysis. Previous studies have proved that three–dimensional right ventricular ejection fraction (3D-RVEF) can provide valuable prognostic information in various cardiovascular diseases (10–12). However, the prognostic value of 3D-RVEF in COVID-19 patients has not been studied. Accordingly, this study aimed to assess RV structure and function in COVID-19 patients with different severity of illness and to explore whether 3D-RVEF provides incremental prognostic value with regards to fatal outcomes in COVID-19 patients.
This study was performed at Union Hospital in Wuhan, China. We enrolled a total of 172 consecutive patients confirmed with COVID-19 according to the WHO interim guidance (13) from January 29 to March 4, 2020. Bedside echocardiogram was performed in all patients for assessment of cardiac structure and function. The median time from admission to echocardiography examination was 5 days [interquartile range (IQR) 3–10 days]. A total of 44 patients were excluded because of dilated cardiomyopathy (n = 2), old myocardial infarction (n = 4), insufficient image quality for echocardiographic analysis (n = 32), arrhythmia during examination (n = 6), the remaining 128 patients were divided into three subgroups according to the guideline on the diagnosis and treatment of COVID-19 by the National Health Commission (version 7.0) (14): general (n = 41), severe (n = 58) and critical (n = 29) groups. Additionally, thirty-one healthy volunteers having no cardiopulmonary disease based on physical examinations, biochemical tests, electrocardiography, chest X-ray and echocardiogram were enrolled as the control group.
This study was approved by the Ethics Committee of Tongji Medical College, Huazhong University of Science and Technology. Written informed consent was waived for all participants with emerging infectious diseases.
The demographic characteristics and clinical data (vital signs, comorbidities, major laboratory findings, treatment, complications, and prognosis during hospitalization) were extracted from electronic medical records by two researchers. The timing of laboratory measurements was within 3 days of echocardiogram with a median interval of 1 day (Interquartile Range, IQR: 1–2 days). Patients clinical outcomes were followed up to May 18, 2020. Acute cardiac injury was defined as serum plasma levels of high-sensitivity troponin I (hs-TNI) above the 99th percentile of the upper limit of reference (4). Acute respiratory distress syndrome (ARDS) was defined according to the Berlin Definition (15). The criteria for COVID-19 severity-of-illness was defined by the Chinese management guideline for COVID-19 (version 7.0) as follows: (1) general: fever and respiratory symptoms, with evidence of pneumonia on radiological imaging; (2) severe: patients with any of the following symptoms and signs: respiratory distress with respiratory rate ≥30 breaths/min; SpO2 ≤ 93% at rest; and PaO2/FiO2 ≤ 300 mmHg (1 mm Hg = 0.133 kPa); and (3) critical: patients with any of the following conditions: respiratory failure requiring mechanical ventilation, shock, and/or other organ failure requiring admission to the intensive care unit (ICU) (14). The criteria for RV dysfunction is based on published reference, and the COVID-19 patients were divided into three subgroups: 3DRVEF > 45%, 40% < 3DRVEF ≤ 45%, and 30% < 3DRVEF ≤ 40% (16).
Bedside echocardiography was performed using a commercially available system (EPIQ 7C, Philips Medical Systems, Andover, USA). 2D and Doppler echocardiography examinations were performed based on the recommendations of the American Society of Echocardiography (17). And all 2D echocardiographic parameters were acquired according to the published guidelines (18, 19).
The left atrial volume, left ventricular end-diastolic and end-systolic volumes, left ventricular ejection fraction (LVEF) were measured by the biplane Simpson's method in apical two- and four-chamber views and volumes were indexed to body surface area (BSA) (18). Doppler mitral and tricuspid peak early (E) and late (A) diastolic velocities, and E/A velocity ratios were measured from the LV and RV inflow velocities on apical four-chamber view. RV transverse diameter at the base was measured from the RV-focused apical four-chamber view, and the minor right atrial (RA) transverse diameter was measured from the middle level of RA on apical four-chamber view. Tricuspid lateral annular systolic velocity (S'), tricuspid annular plane systolic excursion (TAPSE) and RV fractional area change (FAC) were measured according to the established guidelines (19). Systolic pulmonary arterial pressure (PASP) was calculated by the Bernoulli simplified equation on tricuspid regurgitation (TR) maximum jet velocity sum of estimated RA pressure. Pulmonary hypertension (PH) was defined as PASP > 40 mm Hg (19).
The off-line 2D-STE analysis was performed with the vendor-independent software TomTec (2D Cardiac Performance Analysis 1.2 for 2D-STE; TomTec Imaging Systems, Unterschleissheim, Germany) to acquire the RV strain in the RV focused apical four-chamber view with frame rate of 50–70 MHz, according to the published recommendations (20, 21). The workstation automatically performed a contour tracking of RV endocardium, and a manual adjustment was performed in case of unsatisfactory tacking. Finally, the time-strain curve of RVFWLS was generated automatically. RVFWLS was defined as the mean longitudinal peak systolic strain of three segments of the RV free wall. RVFWLS was performed 3 times during the regular heartbeats and the average was used for analysis.
A wide-angled, single-beat, high frame rate (HeartModel mode) 3D full-volume images data sets were acquired from the apical 4-chamber RV-focused view. The 3DE datasets were stored digitally for offline analysis. The 3D full-volume RV images were analyzed by an experienced echocardiographer. RV-focused one-beat 3D full-volume images were analyzed with a novel, full automated RV quantification software (3D Auto RV, Phillips Medical Systems) that detect RV endocardial contours using artificial intelligence, which consists of knowledge-based identification of initial global shape and RV chamber orientation, followed by 3D speckle tracking analysis throughout a cardiac cycle (22, 23). The software initially identified LV and RV long-axis landmarks in end-diastole in the apical two- and four-chamber views. Based on that, the RV-focused four-chamber view and a short-axis view. Then RV endocardial surfaces were full automatically defined and tracked throughout the cardiac cycle, and a quick minimal manual adjustment was performed in case of unsatisfactory outcomes. Finally, a 3D RV cast, RV volume curves were provided, from which the RV end-diastolic volume (RVEDV), RV end-systolic volume (RVESV), and RVEF were determined (Figures 1A–C).
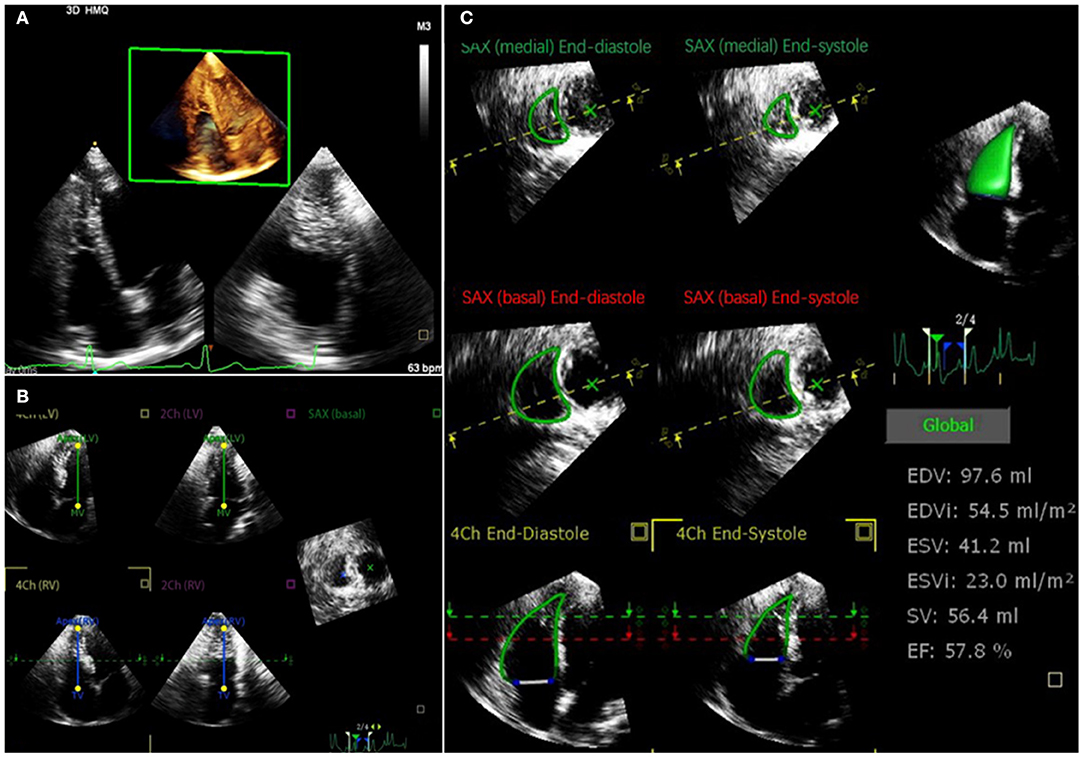
Figure 1. Representative 3DE analysis in a COVID-19 patient. (A) Retrieving 3DE datasets aimed for the RV full-volume images from apical 4-chamber RV-focused view; (B) LV and RV long-axis landmarks in end-diastole in the apical 2- and 4-chamber views were identified by software initially; then, RV focused 4-chamber view and a short-axis view are derived; (C) RV endocardial surfaces were full automatically defined and tracked throughout the cardiac cycle; finally, RV end-diastolic volume, RV end-systolic volume, and RVEF were determined. 3DE, three-dimensional echocardiography; COVID-19, coronavirus disease 2019; LV, left ventricular; RV, right ventricular; RVEF, right ventricular ejection fraction.
Intraobserver and interobserver variability in measurement of 2D-RVFWLS and 3D-RVEF were analyzed in 20 randomly selected subjects. Intraobserver variability was assessed by the same observer 2 weeks later. Interobserver variability was assessed by a second observer in the same 20 patients.
Continuous variables were expressed as mean ± SD, or median (IQR). The normality of distribution was tested by the Shapiro–Wilk test. Comparisons between groups were made by two-sample student t-test or one-way analysis of variance for normally distributed variables; and Mann–Whitney U-test or Kruskal–Wallis test for non-normal distribution of data. The post-hoc pairwise comparisons with Bonferroni correction was used for continuous variables. Categorical data were expressed as percentages and were compared by the χ2 test or Fisher exact test, when appropriate. The correlation between 3D-RVEF and 2D-RVFWLS was examined using Pearson's Correlation coefficients.
Univariate and multivariable Cox proportional hazards models were performed to identify the independent risk factors of mortality in COVID-19 patients. Variables with P < 0.05 at univariate analysis were included in stepwise multivariable analysis. To avoid overfitting and collinearity issues, four separate multivariable Cox proportional hazard models were constructed to determine the independent predictors of higher mortality. To assess the potential additive prognostic value of 3D-RVEF and the other RV parameters, we evaluated the additional increment of the chi-square statistics of the combined models over the baseline model. Receiver operator characteristic curves (ROC) were used to calculate the sensitivity and specificity for predicting death by RV function index and to determine the optimal prognostic cutoff value (Youden method). The Hanley and McNeil methods were applied for comparison of area under the curves (AUCs) of RV function parameters (24). Survival curves were obtained using the Kaplan–Meier method and compared by the log-rank test. The reproducibility of 2D- RVFWLS and 3D-RVEF was assessed using intra-class correlation coefficients (ICC) and Bland-Altman analyses.
All statistical analyses were performed using SPSS version 23.0 (Statistical Package for the Social Sciences, Chicago, IL, USA), STATA software version 10 (StataCorp, Texas, USA) and R version 3.6.3 (R Foundation for Statistical Computing, Vienna, Austria). All tests were 2-tailed; P < 0.05 was considered statistically significant.
The clinical characteristics of the 128 COVID-19 patients were shown in Table 1. The mean age was 61.3 ± 13.1 years and 61 (47.7%) patients were men. Of 128 patients, 7 (5.5%) had chronic obstructive pulmonary disease, 18 (14.1%) had cardiac disease including 14 with known coronary heart disease in the absence of abnormal wall motion by routine echocardiography and 4 with occasional arrhythmia (atrial and ventricular extrasystole) by the recording of a long-term electrocardiograph. Compared with general and severe patients, critical patients were older, predominantly male and had higher heart rates (HR) and lower oxygenation index.
In addition, compared with general and severe patients, critical patients were more likely to have underlying cardiac disease, lower levels of lymphocyte counts, higher levels of C-reactive protein and procalcitonin. They were also more prone to receive high-flow oxygen and invasive mechanical ventilation therapy, and were more likely to develop acute cardiac injury, ARDS. More often than not they got admitted to ICU, and had higher mortality.
Table 2 revealed the echocardiographic characteristics of the subjects. Compared with healthy controls, COVID-19 patients had thickened interventricular septum thickness (IVST), decreased mitral and tricuspid E/A, lower LVEF and FAC, and higher left ventricular end systolic volume index (LVESVI). 2D-RVFWLS and 3D-RVEF were both significantly lower in COVID-19 patients than in controls (−22.9 ± 4.8% vs. −27.2 ± 4.4%, P < 0.001; 48.5 ± 5.8% vs. 53.7 ± 4.5%, P < 0.001). Moreover, 3D-RVEF correlated significantly with 2D-RVFWLS in COVID-19 patients (r = −0.59, P < 0.001) and in controls (r = −0.64, P < 0.001). Furthermore, critical patients exhibited significantly higher mitral E/e′, larger RA, RV and pulmonary artery (PA) diameter, worse FAC, 2D-RVFWLS, and 3D-RVEF. Moreover, a higher proportion of critical patients had PH. Additionally, Table 2 showed that age, HR and systolic blood pressure (SBP) were significantly different between controls and COVID-19 patients. The echocardiographic parameters were further compared between controls and COVID-19 patients after making statistical adjustment of age, HR, and SBP in Table 3. After the adjustment, the differences between COVID-19 patients and controls persisted for the IVST, tricuspid E/A, LVESVI, LVEF, RVFAC, 2D-RVFWLS, and 3D-RVEF. Likewise, sex and BSA were significantly different among the general, severe and critical groups. So, the echocardiographic parameters among the three groups were further compared after statistical adjustment of sex and BSA in Table 3. Larger right heart chambers, worse RVFAC, 2D-RVFWLS, and 3D-RVEF remained statistically significant in critical patients than general and severe patients (Table 3).
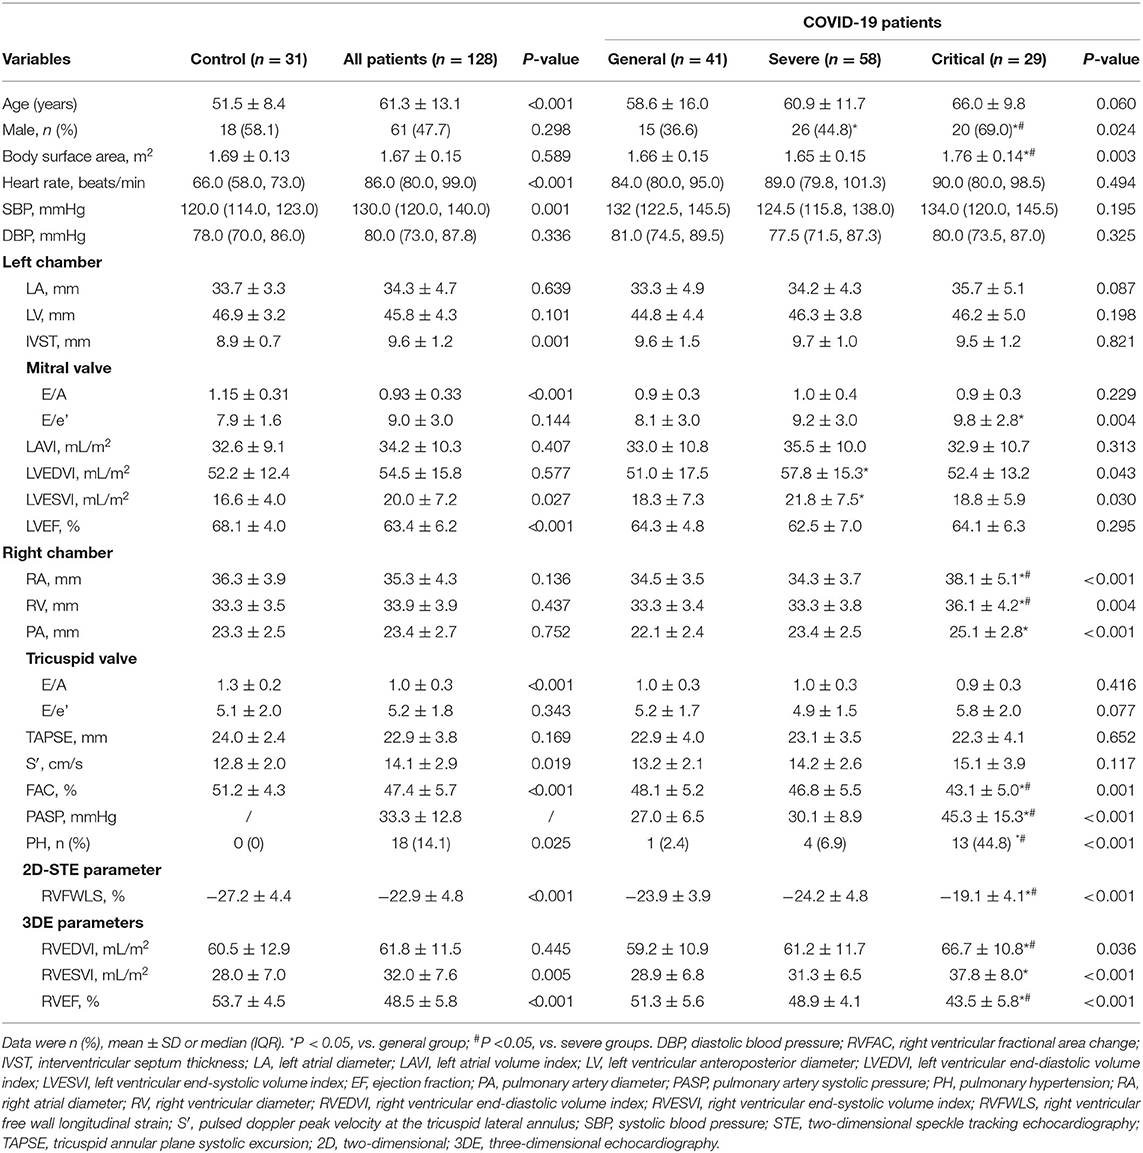
Table 2. Comparisons of baseline characteristics and echocardiographic characteristics in healthy controls and COVID-19 patients.
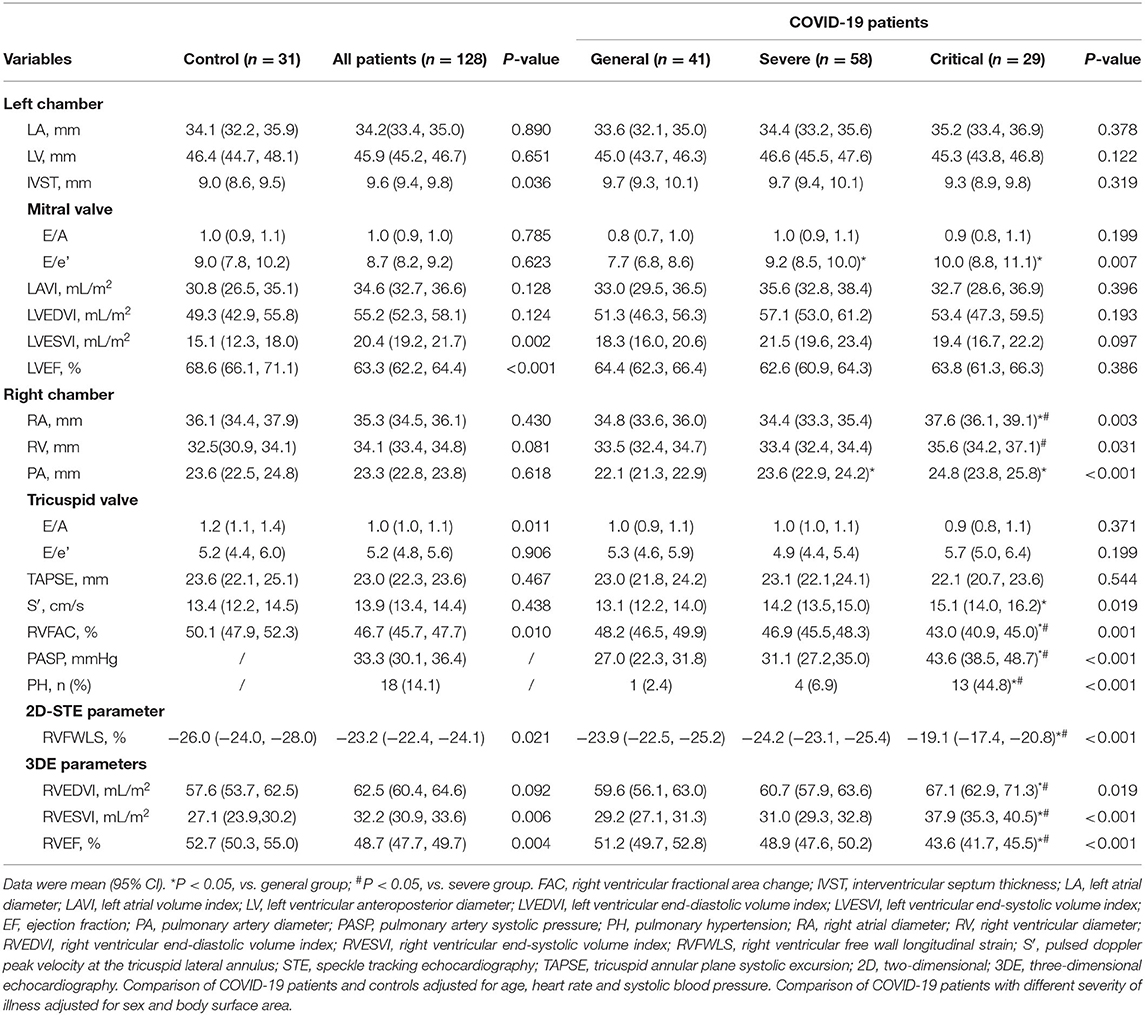
Table 3. Adjusted comparisons of echocardiographic characteristics in healthy controls and COVID-19 patients.
During a median follow-up of 91 days (IQR: 74–93 days), 18 (14.1%) patients died. Non-survivors were more often male. They had lower oxygenation index than the survivors. The prevalence of comorbidities was similar between the two groups. Compared with non-survivors, survivors presented with more abnormal laboratory findings including lower lymphocyte, higher inflammation-related indices (white blood cell counts, C-reactive protein, procalcitonin, D-dimer) and elevated cardiac indices. There were no differences between the survivors and non-survivors in left heart chamber size and LV function parameters. However, the non-survivors showed larger RA, RV and PA diameters, lower tricuspid E/A, RVFAC, 2D-RVFWLS and 3D-RVEF than survivors. Moreover, a higher proportion of non-survivors presented PH than survivors (Table 4).
Conventional RV function parameters including RVFAC, TAPSE and S′, 2D-RVFWLS and 3D-RVEF were analyzed by ROC for predicting mortality in COVID-19 patients. The ROC analyses showed only RVFAC, 2D-RVFWLS, and 3D-RVEF were associated with mortality (Figure 2). Moreover, the AUC of 3D-RVEF was greater than that of RVFAC (0.93 vs. 0.79, P = 0.039) and RVFWLS (0.93 vs. 0.83, P = 0.032). The best cutoff value to predict mortality was 42.7% for RVFAC (AUC, 0.79, P < 0.001; sensitivity, 72%; specificity, 78%), −18.9% for 2D-FWLS (AUC, 0.83, P < 0.001; sensitivity, 72%; specificity, 85%), and 42.5% for 3D-RVEF (AUC, 0.93, P < 0.001; sensitivity, 83%; specificity, 96%).
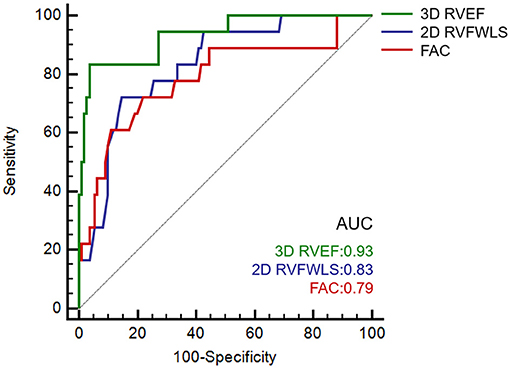
Figure 2. Receiver operating characteristic curves in predicting the death of COVIID-19 patients. COVID-19, coronavirus disease 2019.
Kaplan–Meier survival curves showed lower survival rates for the groups with decreased RVFAC ( ≤ 42.7%), 2D-RVFWLS (>−18.9%), and 3D-RVEF ( ≤ 42.5%) that was classified by cutoff values of the above RV functional parameters (Figures 3A–C). In addition, decreased RVFAC, 2D-RVFWLS, and 3D-RVEF occurred in 37 (28.9%) patients, 29 (22.7%) patients and 19 (14.8%) patients, respectively. The incidence rate of mortality in these patients was significantly higher than in patients whose RVFAC (>42.7%), 2D-RVFWLS ( ≤ −18.9%), and 3D-RVEF (>42.5%) were not decreased (Figures 3D–F; P < 0.001 for all). In addition, we further divided the COVID-19 patients into three subgroups: 3DRVEF > 45% (n = 107), 40% < 3DRVEF ≤ 45% (n = 15), 30% < 3DRVEF ≤ 40% (n = 6). The Kaplan–Meier survival curves showed that the three groups had significantly different survival rates (P < 0.001), with the group of 30% < 3DRVEF ≤ 40% having the lowest survival rate (Supplementary Figure 1).
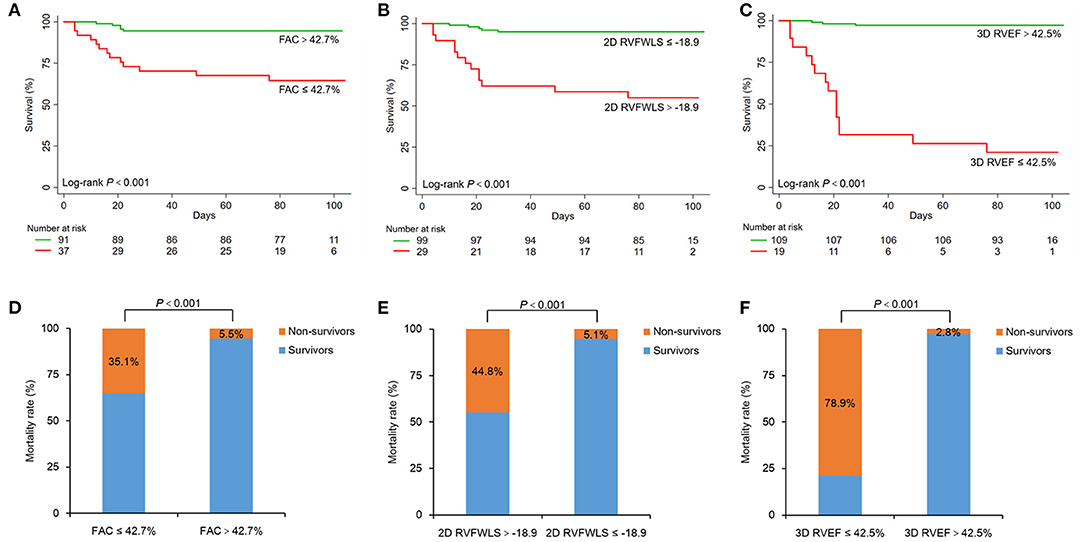
Figure 3. Kaplan–Meier survival curves and percent bar graph of mortality rate in COVID-19 patients. Top, cumulative percentage survival free from death according to FAC (A), 2D-RVFWLS (B), and 3D-RVEF (C). Bottom, mortality rates of different groups dividing by the cut-off value of FAC (D), 2D-RVFWLS (E), and 3D-RVEF (F). COVID-19, coronavirus disease 2019; 2D-RVFWLS, two-dimensional right ventricular free wall longitudinal strain; 3D-RVEF, three-dimensional right ventricular ejection fraction; FAC, fractional area change.
In univariate analysis (Table 5), sex, acute cardiac injury, ARDS, RVFAC, 2D-RVFWLS, and 3D-RVEF were significantly associated with higher mortality in COVID-19 patients. In stepwise multivariate analysis, acute cardiac injury and ARDS were used to construct the baseline model for predicting death in COVID-19 patients. Separated models using RVFAC, 2D-RVFWLS, and 3D-RVEF were found to have significant additional prognostic value for mortality over the baseline model (Table 4, Figure 4). Notably, the incremental predictive value of 3D-RVEF (chi-square to improve 18.3; P < 0.001) was significantly higher (P < 0.05) than RVFAC (chi-square to improve 4.5; P = 0.034) and 2D-RVFWLS (chi-square to improve 5.1; P = 0.024).
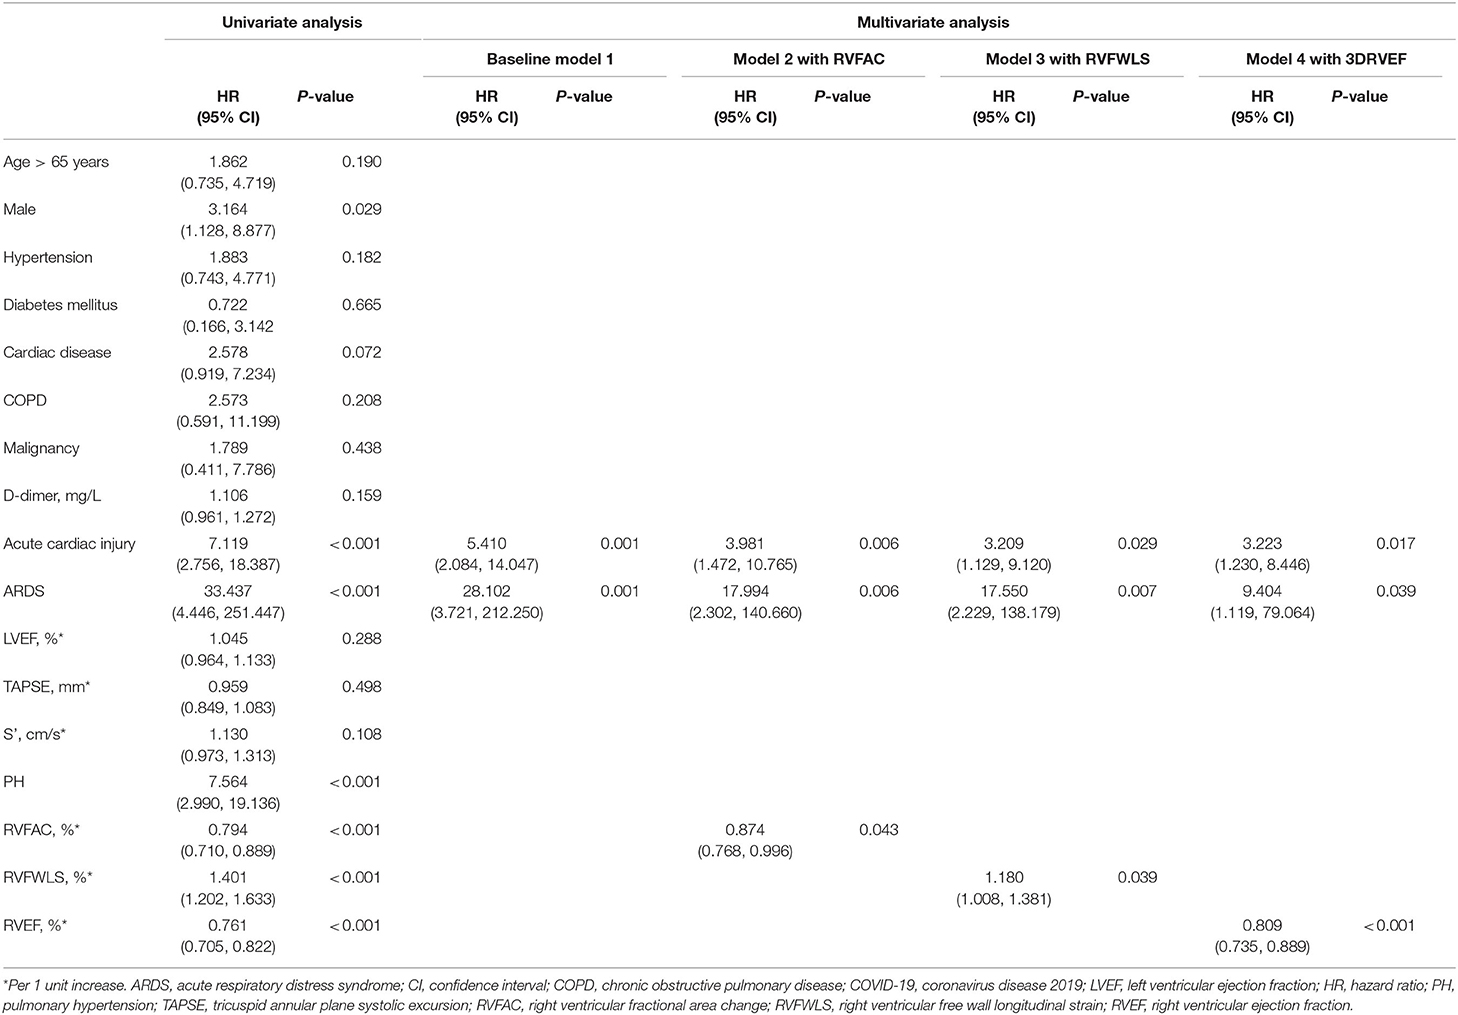
Table 5. Univariate and multivariate COX proportional hazard models for predicting death of COVID-19 patients.
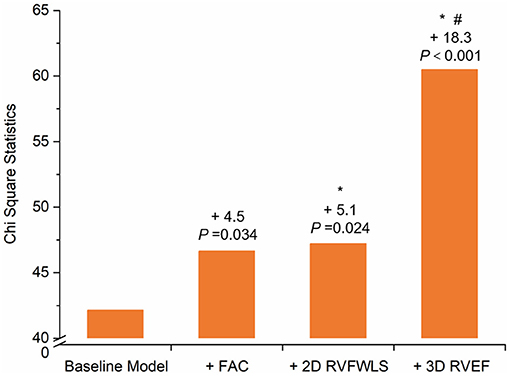
Figure 4. Chi-Square Statistic of Models. Chi-square statistic of the baseline model and different RV functional tests value to predict mortality over the baseline model. Values indicate the additional chi-square value of the different models. *P < 0.05 vs. FAC and #P < 0.001 vs. 2D-RVFWLS. Statistical comparisons by likelihood ratio tests. 2D-RVFWLS, two-dimensional right ventricular free wall longitudinal strain; 3D-RVEF, three-dimensional right ventricular ejection fraction; FAC, fractional area change; RV, right ventricular.
The intraobserver and interobserver variability for RVFWLS were 0.3 ± 4.3% and 0.6 ± 5.8%, 3D-RVEF were 0.3 ± 3.1% and 0.5 ± 3.9%. The intraobserver and interobserver ICC for RVFWLS were 0.95 and 0.90, 3D-RVEF were 0.95 and 0.91.
To our knowledge, this is the first study to comprehensively depict the conventional, 2D strain and 3DE characteristics of RV in COVID-19 patients with different severity of illness and to explore the prognostic value of 3D-RVEF in COVID-19 patients by directly comparing its utility with that derived from conventional echocardiography and 2D-STE. The major findings were as follows: (1) critical COVID-19 patients were more prone to have larger right heart chamber size, more impaired RV function and a higher prevalence of PH; (2) RVFAC, 2D-RVFWLS, and 3D-RVEF were all significant predictors for mortality in COVID-19 patients; and (3) 3D-RVEF could provide incremental value over 2D-RVFWLS and conventional echocardiographic parameters for predicting mortality in COVID-19 patients.
Accumulating studies revealed that acute cardiac injury was a common complication and was associated with fatal outcomes in COVID-19 patients (1, 2, 5). We found 27 (21.1%) patients in this cohort had acute cardiac injury as determined by plasma hs-TNI levels. The increased cardiac stress due to respiratory failure and hypoxemia may contribute to cardiac injury and the RV may bear the brunt of its impact (3, 25). Therefore, assessment of RV structure and function could be imperative and significant for COVID-19 patients. There are certain limitations for the assessment of RV size and function by 2D echocardiography due to its complex geometrical anatomy. 3D analysis has the advantage of full-volume acquisition of the entire RV, which may overcome the limitations of 2D analysis. In this study, we assessed RV size and function by the novel, fully automated 3D RV quantification software based on new machine learning algorithm, which provided reasonably accurate RV function measurements are available for clinical use with excellent reproducibility and reliability, as well as less analysis time (10).
Our study showed that COVID-19 patients and the controls had similar size of right heart chambers, which was consistent with a previous study (9). We further depicted the right heart chamber size in COVID-19 patients with different severity of illness and found that the critical groups had larger right heart chambers than general and severe groups. Worse RVFAC, RVFWLS, and 3D-RVEF were also noted in COVID-19 patients than in controls. Moreover, decreased RV systolic function was more marked in critical patients and less pronounced in general and severe groups. A previous study has pointed out that severe COVID-19 patients might progress to ARDS more quickly (26). ARDS might cause a rise in RV afterload by increased vascular resistance and hypoxemia (3). The proportion of ARDS in critical groups was significantly higher than general and severe groups in our study, which may explain why critical groups were more likely to had the larger right heart chambers and RV dysfunction. It is suggested that clinicians should be alert to RV dysfunction in critically ill patients and take prompt treatments to improve patient outcomes.
Previously, the prognostic value of RVFWLS and conventional RV function parameters in COVID-19 patients have been reported (9). 3D-RVEF also has been demonstrated as a strong prognostic value in other various cardiovascular diseases (11, 12, 27, 28), while its prognostic value in COVID-19 patients has not been validated yet. In our study, univariate and multivariate regression models revealed 3D-RVEF, RVFWLS, and FAC all were independent predictors for mortality after adjustment for gender, ARDS, and acute cardiac injury. The S′ and TAPSE were not predictors of mortality in our patients, possibly because they are angle-dependent and only reflect the longitudinal function of the basal portion of the RV free wall. RVFAC [cut-off value of 39% by Houard et al. (29) 40% by Amano et al. (30)], RVFWLS [cut-off value of −19% by Houard et al. (29) 22% by Gavazzoni et al. (31)] and 3D-RVEF [cut-off value of 43% by Jone et al. (28)] have been proven to be independent predictors of adverse outcomes in other various cardiovascular diseases. Moreover, a recent study suggested that a 43.5% threshold of RVFAC could help identify COVID-19 patients at higher risks of mortality (9). The prognostic value of RVFAC, RVFWLS, and 3D-RVEF to predict mortality was also noted in our study, with the best cut-off value of 42.7% for RVFAC, −18.9% for RVFWLS, and 42.5% for 3D-RVEF. More notably, we found the multivariate regression model with 3D-RVEF showed an incremental prognostic value of higher mortality over that with RVFWLS and FAC, which was in line with the previous study that reported 3D-RVEF was superior to RVFWLS and conventional echocardiographic parameters in predicting adverse clinical events in PH (28). Additionally, the COVID-19 patients were divided into three subgroups based on the published reference: (16) 3DRVEF > 45%, 40% < 3DRVEF ≤ 45%, and 30% < 3DRVEF ≤ 40%. The Kaplan–Meier survival curves showed that the three groups had significantly different prognosis (P < 0.001), with the group of 30% < 3DRVEF ≤ 40% having the lowest survival rate. RVFAC was measured by planimetry of the RV cavity and its measurement variability was limited by the accurate identification of the RV endocardial border. RVFWLS is mainly based on longitudinal myocardium deformation of RV outflow portions, neglecting the contributions of myocardium deformation in other directions (32). The study by Bleakley et al. reported that RVFWLS was not sensitive in identifying RV dysfunction, because severe COVID-19 is associated with a specific phenotype of RV radial impairment with sparing of longitudinal function (33). However, 3D-RVEF can comprehensively evaluate the different parts of the RV (including the inflow, apical, and outflow) and is not limited to longitudinal myocardial function (34, 35). Our study demonstrated that 3D-RVEF as a more robust prognostic indicator for mortality and could provide incremental prognostic value over RVFWLS and conventional echocardiography in COVID-19 patients.
Our findings emphasized that the significance of evaluating RV function and validated its predictive value in COVID-19 patients. Critical COVID-19 patients were more likely to suffer from RV dysfunction. This study offered the first evidence about the prognostic value of RVEF measured by 3DE in COVID-19 patients. 3D-RVEF is theoretically superior to conventional echocardiographic parameters and RVFWLS derived from 2D-STE in assessing RV function due to the complex anatomy of RV. Therefore, we demonstrated that 3D-RVEF could provide an incremental predictive value of death over the RVFWLS and conventional echocardiographic parameters in COVID-19 patients, which may help identify COVID-19 patients at higher risks of adverse outcomes.
Our study did have some limitations. First, as both 3DE and 2D-STE analyses were dependent on good image quality, we excluded 38 (22.1%) patients with insufficient image quality or arrhythmia during examination, which may cause some selection bias. As a result, our findings were not applicable to COVID-19 patients with arrhythmia or unsatisfactory image quality. Moreover, part of subjects (78/128) in our study were included in the previous work (9), which was focus on the prognostic value of RV free wall longitudinal strain (RVFWLS) in COVID-19 patients. Second, this was a single-center study with a relatively small sample of hospitalized COVID-19 patients at different disease status, further studies with multi-center and larger sample size should be performed to validate our findings. Third, the cutoff values reported in this study may not be applicable to other software due to inter-vendor variability. Finally, the current fully automated 3D RV software does not provide 3D RV strain values yet, and hence the evidence of the prognostic value of 3D RV strain in COVID-19 patients was lacking in our study. Future studies should be performed to determine the prognostic superiority of 3D RV strain.
Our study emphasized that 3D-RVEF was an independent predictor of mortality in COVID-19 patients and provided an incremental prognostic value superior to RVFWLS and conventional echocardiographic parameters.
The original contributions presented in the study are included in the article/Supplementary Material, further inquiries can be directed to the corresponding author/s.
The studies involving human participants were reviewed and approved by the Ethics Committee of Tongji Medical College, Huazhong University of Science and Technology. Written informed consent was waived for all participants with emerging infectious diseases. Written informed consent for participation was not required for this study in accordance with the national legislation and the institutional requirements. Written informed consent was not obtained from the individual(s) for the publication of any potentially identifiable images or data included in this article.
All authors listed have made a substantial, direct and intellectual contribution to the work, and approved it for publication.
This work was supported by the National Natural Science Foundation of China (Grant No. 81922033 to Dr. Zhang Li; Grant No. 81727805 to Dr. Xie Mingxing) and the Fundamental Research Funds for the Central Universities (Grant No. 5003530082 to Dr. Xie Mingxing).
The authors declare that the research was conducted in the absence of any commercial or financial relationships that could be construed as a potential conflict of interest.
The authors would like to express their appreciation for all of the emergency services, nurses, doctors, and other hospital staff for their efforts to combat the COVID-19 outbreak.
The Supplementary Material for this article can be found online at: https://www.frontiersin.org/articles/10.3389/fcvm.2021.641088/full#supplementary-material
2D, Two-dimensional; 3D, Three-dimensional; 3DE, Three-dimensional echocardiography; A, Late diastolic inflow velocity; COVID-19, Coronavirus disease 2019; E, Early diastolic inflow velocity; e', Early diastolic tissue velocity; FAC, Fractional area change; hs-TNI, high-sensitivity troponin I; ICC, intra-class correlation coefficient; IQR, interquartile range; PH, Pulmonary hypertension; RVFWLS, right ventricular free wall longitudinal strain; RVEDVI, Right ventricular end-diastolic volume index; RVESVI, Right ventricular end-systolic volume index; SARS-CoV-2, Severe acute respiratory syndrome coronavirus 2; STE, Speckle-tracking echocardiography; S', Tricuspid lateral annular systolic velocity; TAPSE, Tricuspid annular plane systolic excursion; TR, Tricuspid regurgitation.
1. Guo T, Fan Y, Chen M, Wu X, Zhang L, He T, et al. Cardiovascular implications of fatal outcomes of patients with coronavirus disease 2019 (COVID-19). JAMA Cardiol. (2020) 5:811–8. doi: 10.1001/jamacardio.2020.1017
2. Shi S, Qin M, Shen B, Cai Y, Liu T, Yang F, et al. Association of cardiac injury with mortality in hospitalized patients with COVID-19 in Wuhan, China. JAMA Cardiol. (2020) 5:802–10. doi: 10.1001/jamacardio.2020.0950
3. Akhmerov A, Marban E. COVID-19 and the heart. Circ Res. (2020) 126:1443–55. doi: 10.1161/CIRCRESAHA.120.317055
4. Huang C, Wang Y, Li X, Ren L, Zhao J, Hu Y, et al. Clinical features of patients infected with 2019 novel coronavirus in Wuhan, China. The Lancet. (2020) 395:497–506. doi: 10.1016/S0140-6736(20)30183-5
5. Shi S, Qin M, Cai Y, Liu T, Shen B, Yang F, et al. Characteristics and clinical significance of myocardial injury in patients with severe coronavirus disease 2019. Eur Heart J. (2020) 41:2070–9. doi: 10.1093/eurheartj/ehaa408
6. Szekely Y, Lichter Y, Taieb P, Banai A, Hochstadt A, Merdler I, et al. Spectrum of cardiac manifestations in covid-19: a systematic echocardiographic study. Circulation. (2020) 142:342–53. doi: 10.1161/circulationaha.120.047971
7. Li Y, Li H, Li M, Zhang L, Xie M. The prevalence, risk factors and outcome of cardiac dysfunction in hospitalized patients with COVID-19. Intensive Care Med. (2020) 46:2096–8. doi: 10.1007/s00134-020-06205-0
8. Zhang L, Wang B, Zhou J, Kirkpatrick J, Xie M, Johri A M. Bedside focused cardiac ultrasound in covid-19 from the Wuhan epicenter: the role of cardiac point-of-care ultrasound, limited transthoracic echocardiography, and critical care echocardiography. J Am Soc Echocardiogr. (2020) 33:676–82. doi: 10.1016/j.echo.2020.04.004
9. Li Y, Li H, Zhu S, Xie Y, Wang B, He L, et al. Prognostic value of right ventricular longitudinal strain in patients with COVID-19. JACC Cardiovasc Imaging. (2020) 13:2287–99. doi: 10.1016/j.jcmg.2020.04.014
10. Muraru D, Spadotto V, Cecchetto A, Romeo G, Aruta P, Ermacora D, et al. New speckle-tracking algorithm for right ventricular volume analysis from three-dimensional echocardiographic data sets: validation with cardiac magnetic resonance and comparison with the previous analysis tool. Eur Heart J Cardiovasc Imaging. (2016) 17:1279–89. doi: 10.1093/ehjci/jev309
11. Moceri P, Duchateau N, Baudouy D, Schouver ED, Leroy S, Squara F, et al. Three-dimensional right-ventricular regional deformation and survival in pulmonary hypertension. Eur Heart J Cardiovasc Imaging. (2018) 19:450–8. doi: 10.1093/ehjci/jex163
12. Surkova E, Muraru D, Genovese D, Aruta P, Palermo C, Badano LP. Relative prognostic importance of left and right ventricular ejection fraction in patients with cardiac diseases. J Am Soc Echocardiogr. (2019) 32:1407–15.e3. doi: 10.1016/j.echo.2019.06.009
13. World Health Organization. Clinical Management of Severe Acute Respiratory Infection When Novel Coronavirus (nCoV) Infection Is Suspected: Interim Guidance. World Health Organization. (2020). Available online at: https://apps.who.int/iris/handle/10665/330854 (accessed January 25, 2020)
14. Guideline for the Diagnosis and Treatment of 2019 Novel Coronavirus (2019-nCoV) in-fected Pneumonia. (2020). Available online at: http://www.nhc.gov.cn/yzygj/s7653p/202003/46c9294a7dfe4cef80dc7f5912eb1989/files/ce3e6945832a438eaae415350a8ce964.pdf
15. Ranieri VM, Rubenfeld GD, Thompson BT, Ferguson ND, Caldwell E, Fan E, et al. Acute respiratory distress syndrome: the Berlin definition. JAMA. (2012) 307:2526–33. doi: 10.1001/jama.2012.5669
16. Muraru D, Badano LP, Nagata Y, Surkova E, Nabeshima Y, Genovese D, et al. Development and prognostic validation of partition values to grade right ventricular dysfunction severity using 3D echocardiography. Eur Heart J Cardiovasc Imaging. (2020) 21:10–21. doi: 10.1093/ehjci/jez233
17. Mitchell C, Rahko PS, Blauwet LA, Canaday B, Finstuen JA, Foster MC, et al. Guidelines for performing a comprehensive transthoracic echocardiographic examination in adults: recommendations from the American society of echocardiography. J Am Soc Echocardiogr. (2019) 32:1–64. doi: 10.1016/j.echo.2018.06.004
18. Lang RM, Badano LP, Mor-Avi V, Afilalo J, Armstrong A, Ernande L, et al. Recommendations for cardiac chamber quantification by echocardiography in adults: an update from the American society of echocardiography and the European association of cardiovascular imaging. Eur Heart J Cardiovasc Imaging. (2015) 16:233–70. doi: 10.1093/ehjci/jev014
19. Rudski LG, Lai WW, Afilalo J, Hua L, Handschumacher MD, Chandrasekaran K, et al. Guidelines for the echocardiographic assessment of the right heart in adults: a report from the American Society of Echocardiography endorsed by the European association of echocardiography, a registered branch of the European society of cardiology, and the Canadian society of echocardiography. J Am Soc Echocardiogr. (2010) 23:685–788. doi: 10.1016/j.echo.2010.05.010
20. Badano LP, Kolias TJ, Muraru D, Abraham TP, Aurigemma G, Edvardsen T, et al. Standardization of left atrial, right ventricular, and right atrial deformation imaging using two-dimensional speckle tracking echocardiography: a consensus document of the EACVI/ASE/industry task force to standardize deformation imaging. Eur Heart J Cardiovasc Imaging. (2018) 19:591–600. doi: 10.1093/ehjci/jey042
21. Badano LP, Muraru D, Parati G, Haugaa K, Voigt JU. How to do right ventricular strain. Eur Heart J Cardiovasc Imaging. (2020) 21:825–27. doi: 10.1093/ehjci/jeaa126
22. Genovese D, Rashedi N, Weinert L, Narang A, Addetia K, Patel AR, et al. Machine Learning-based three-dimensional echocardiographic quantification of right ventricular size and function: validation against cardiac magnetic resonance. J Am Soc Echocardiogr. (2019) 32:969–77. doi: 10.1016/j.echo.2019.04.001
23. Otani K, Nabeshima Y, Kitano T, Takeuchi M. Accuracy of fully automated right ventricular quantification software with 3D echocardiography: direct comparison with cardiac magnetic resonance and semi-automated quantification software. Eur Heart J Cardiovasc Imaging. (2019) 21:787–95. doi: 10.1093/ehjci/jez236
24. Hanley JA, McNeil BJ. A method of comparing the areas under receiver operating characteristic curves derived from the same cases. Radiology. (1983) 148:839–43. doi: 10.1148/radiology.148.3.6878708
25. Chen T, Wu D, Chen H, Yan W, Yang D, Chen G, et al. Clinical characteristics of 113 deceased patients with coronavirus disease 2019: retrospective study. BMJ. (2020) 368:m1091. doi: 10.1136/bmj.m1091
26. Zhu N, Zhang D, Wang W, Li X, Yang B, Song J, et al. A novel coronavirus from patients with pneumonia in China, 2019. N Engl J Med. (2020) 382:727–33. doi: 10.1056/NEJMoa2001017
27. Nagata Y, Wu VC, Kado Y, Otani K, Lin FC, Otsuji Y, et al. Prognostic value of right ventricular ejection fraction assessed by transthoracic 3D echocardiography. Circ Cardiovasc Imaging. (2017) 10:e005384. doi: 10.1161/CIRCIMAGING.116.005384
28. Jone PN, Schäfer M, Pan Z, Bremen C, Ivy DD. 3D echocardiographic evaluation of right ventricular function and strain: a prognostic study in paediatric pulmonary hypertension. Eur Heart J Cardiovasc Imaging. (2018) 19:1026–33. doi: 10.1093/ehjci/jex205
29. Houard L, Benaets M-B, de Meester de Ravenstein C, Rousseau MF, Ahn SA, Amzulescu M-S, et al. Additional prognostic value of 2D right ventricular speckle-tracking strain for prediction of survival in heart failure and reduced ejection fraction. JACC Cardiovasc Imaging. (2019) 12:2373–85. doi: 10.1016/j.jcmg.2018.11.028
30. Amano M, Izumi C, Baba M, Abe R, Matsutani H, Inao T, et al. Progression of right ventricular dysfunction and predictors of mortality in patients with idiopathic interstitial pneumonias. J Cardiol. (2020) 75:242–9. doi: 10.1016/j.jjcc.2019.08.010
31. Gavazzoni M, Badano LP, Vizzardi E, Raddino R, Genovese D, Taramasso M, et al. Prognostic value of right ventricular free wall longitudinal strain in a large cohort of outpatients with left-side heart disease. Eur Heart J Cardiovasc Imaging. (2019) 21:1013–21. doi: 10.1093/ehjci/jez246
32. Cheung YF. The role of 3D wall motion tracking in heart failure. Nat Rev Cardiol. (2012) 11:644–57. doi: 10.1038/nrcardio.2012.128
33. Bleakley C, Singh S, Garfield B, Morosin M, Surkova E, Mandalia MS, et al. Right ventricular dysfunction in critically ill COVID-19 ARDS. Int J Cardiol. (2020) 23. doi: 10.1016/j.ijcard.2020.11.043
34. Ishizu T, Seo Y, Atsumi A, Tanaka YO, Yamamoto M, Machino-Ohtsuka T, et al. Global and regional right ventricular function assessed by novel three-dimensional speckle-tracking echocardiography. J Am Soc Echocardiogr. (2017) 30:1203–13. doi: 10.1016/j.echo.2017.08.007
Keywords: three-dimensional echocardiography, right ventricular function, Coronavirus disease 2019, myocardial strain, prognosis
Citation: Zhang Y, Sun W, Wu C, Zhang Y, Cui L, Xie Y, Wang B, He L, Yuan H, Zhang Y, Cai Y, Li M, Zhang Y, Yang Y, Li Y, Wang J, Yang Y, Lv Q, Zhang L and Xie M (2021) Prognostic Value of Right Ventricular Ejection Fraction Assessed by 3D Echocardiography in COVID-19 Patients. Front. Cardiovasc. Med. 8:641088. doi: 10.3389/fcvm.2021.641088
Received: 13 December 2020; Accepted: 19 January 2021;
Published: 09 February 2021.
Edited by:
Salah D. Qanadli, University of Lausanne, SwitzerlandReviewed by:
Luigi Badano, University of Milano Bicocca, ItalyCopyright © 2021 Zhang, Sun, Wu, Zhang, Cui, Xie, Wang, He, Yuan, Zhang, Cai, Li, Zhang, Yang, Li, Wang, Yang, Lv, Zhang and Xie. This is an open-access article distributed under the terms of the Creative Commons Attribution License (CC BY). The use, distribution or reproduction in other forums is permitted, provided the original author(s) and the copyright owner(s) are credited and that the original publication in this journal is cited, in accordance with accepted academic practice. No use, distribution or reproduction is permitted which does not comply with these terms.
*Correspondence: Mingxing Xie, eGllbXhAaHVzdC5lZHUuY24=; Li Zhang, emxpNDI5QGh1c3QuZWR1LmNu; Qing Lv, bHZxaW5nMTk4N0BodXN0LmVkdS5jbg==
†These authors have contributed equally to this work and share first authorship
Disclaimer: All claims expressed in this article are solely those of the authors and do not necessarily represent those of their affiliated organizations, or those of the publisher, the editors and the reviewers. Any product that may be evaluated in this article or claim that may be made by its manufacturer is not guaranteed or endorsed by the publisher.
Research integrity at Frontiers

Learn more about the work of our research integrity team to safeguard the quality of each article we publish.