 Linsheng Liu
 Xurui Jin
 Yangfeng Wu3
 Mei Yang
 Xianglian Li
94% of researchers rate our articles as excellent or good
Learn more about the work of our research integrity team to safeguard the quality of each article we publish.
Find out more
ORIGINAL RESEARCH article
Front. Cardiovasc. Med. , 09 October 2020
Sec. General Cardiovascular Medicine
Volume 7 - 2020 | https://doi.org/10.3389/fcvm.2020.542519
Cardiovascular diseases (CVDs) are the leading cause of death in China. Conventional diagnostic methods are dependent on advanced instruments, which are expensive, inaccessible, and inconvenient in underdeveloped areas. To build a novel dried blood spot (DBS) detection strategy for imaging CVDs, in this study, a total of 12 compounds, including seven amino acids [homocysteine (Hcy), isoleucine (Ile), leucine (Leu), valine (Val), phenylalanine (Phe), tyrosine (Tyr), and tryptophan (Trp)], three amino acid derivatives [choline, betaine, and trimethylamine N-oxide (TMAO)], L-carnitine, and creatinine, were screened for their ability to identify CVD. A rapid and reliable method was established for the quantitative analysis of the 12 compounds in DBS. A total of 526 CVD patients and 200 healthy volunteers in five provinces of China were recruited and divided into the following groups: stroke, coronary heart disease, diabetes, and high blood pressure. The orthogonal projection to latent structures-discriminant analysis (OPLSDA) model was used to characterize the difference between each CVD group. Marked differences between the groups based on the OPLSDA model were observed. Based on the model, the patients in the three training sets were mostly accurately categorized into the appropriate group. In addition, the receiver operating characteristic (ROC) curves and logistic regression of each metabolite chosen by the OPLSDA model had an excellent predictive value in both the test and validation groups. DBS detection of 12 biomarkers was sensitive and powerful for characterizing different types of CVD. Such differentiation may reduce unnecessary invasive coronary angiography, enhance predictive value, and complement current diagnostic methods.
Cardiovascular diseases (CVDs) and cerebrovascular diseases refer to all heart and cerebral diseases related to vasculopathy, which mainly include coronary heart disease (CHD), hypertension, and stroke (1). Diabetes mellitus is a risk factor for CVD (2). CVD is a serious threat to the health of humans, especially middle-aged and older people over 50 years old, who have a high prevalence, high disability, and high mortality rate. Up to 30 million people die of CVD every year worldwide (3). The age-standardized death rate attributable to all CVDs in the US population was 223.9 per 100,000 (4). Stroke and ischemic heart disease were the leading causes of death in China in 2017 (5). Even when utilizing the most advanced and sophisticated treatments available, more than 50% of survivors are unable to take care of themselves (3).
Studies have shown that the pathogenesis of CVD may be due to blood vessel lesions, which are secretive, gradual, and systemic, and it is difficult to identify obvious clinical symptoms in the early stage (6). Finding reasonable and effective biomarkers to diagnose, classify, and guide the treatment of CVD has always been a focus of clinical diagnostics (1). CVD is essentially a metabolic disease (7). At present, a series of relatively mature and widely clinically used biomarker tests have provided an important reference for the diagnosis and treatment of CVD. The more mature cardiovascular markers mainly include the blood vessels themselves, markers of the coagulation system (such as platelets and fibrinolysis), lipid metabolism and inflammatory markers, plaque calcification, non-calcified detachment predictive markers, and organ damage markers, such as myocardial injury and brain injury markers. However, these diagnostic methods require advanced instruments and are expensive, requiring patients to enter the hospital for examination; additionally, these methods are difficult to fully develop implementing in underdeveloped areas.
Dried blood spot (DBS) technology that can be stored stably enables new possibilities for bioanalytical procedures that can be beneficial for patients, health care providers, and laboratories, and the technology can be inexpensive (8). The sampling can be performed in a non-hospital environment and is suitable for large-scale disease screening (9). DBS technology also reduces the sample processing burden and is characterized by straightforward waste disposal. A DBS method was applied for the detection of metabolites toward hypertension and healthy controls (10). This study aimed to screen and validate CVD biomarkers that can be measured by DBS testing. In this article, we selected 12 biomarkers [choline, betaine, trimethylamine N-oxide (TMAO), creatinine, L-carnitine, homocysteine (Hcy), isoleucine (Ile), leucine (Leu), valine (Val), phenylalanine (Phe), tyrosine (Tyr), tryptophan (Trp)] from the literature that may characterize CVD features. After quantifying the 12 biomarkers in DBSs, the orthogonal projection to latent structures-discriminant analysis (OPLSDA) model was used to screen the potential biomarkers. Then, the receiver operating characteristic (ROC) curve and logistic algorithm were applied to three validation sets to verify whether the selected markers could characterize the occurrence of CVD for clinical diagnosis and risk prediction.
A literature search was conducted using the PubMed and EMBASE databases, and the Preferred Reporting Items for Systematic Reviews and Meta-Analyses (PRISMA) statement was used (11). The search terms were “cardiovascular diseases” OR “coronary artery disease” OR “stroke” OR “diabetes mellitus” AND “metabolite” OR “metabolomics” OR “biomarkers.” There was no language restriction, and the period covered database inception until October 31, 2017. Our inclusion criteria were as follows: (1) study subjects were humans; (2) study subjects had only metabolic syndrome but no other diseases; and (3) studies reported changes in metabolites in the plasma or serum resulting from metabolic syndrome. To further compile a comprehensive list of relevant literature, manual searches of the reference lists in book chapters and gray literature were conducted. The key metabolites associated with CVD are summarized in Supplementary Table 1. Considering the compatibility of DBS sampling and mass spectrometry analysis, 12 compounds (choline, betaine, TMAO, creatinine, L-carnitine, Hcy, Ile, Leu, Val, Phe, Tyr, Trp) were selected for clinical validation.
The study protocol was approved by the Ethics Committee of The First Affiliated Hospital of Soochow University. Male and female adults who were diagnosed with stroke, CHD, diabetes, and high blood pressure (HBP) as well as healthy individuals (HIs) were recruited from five provinces (Hebei, Shaanxi, Liaoning, Ningxia, and Shanxi) in China. Participants fully understood the risks and benefits of the study and provided informed consent. Capillary blood was spotted on paper cards (whatman filter paper) by direct application from the fingertip. According to the severity of the diseases, patients with CVD were divided into four groups: stroke, CHD, diabetes, and HBP. Patients in one group may have also had subsequent complications. That is, if a patient had stroke, diabetes, CHD, and HBP, s/he would be assigned to the stroke group (Table 1).
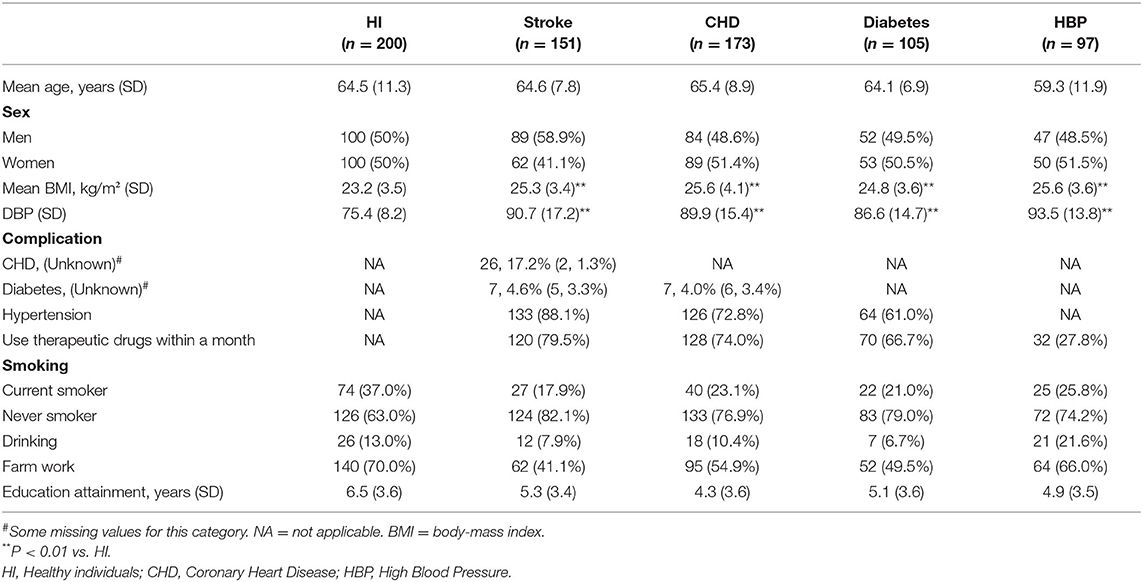
Table 1. Population characteristics in communities study (Five provinces: Hebei, Shaanxi, Liaoning, Ningxia, and Shanxi).
For preparation of calibration curves and quality control (QC) of the metabolites, DBSs spiked with known concentrations were used. The concentration ranges of 12 metabolites are shown in Table 2. Six-millimeter (diameter) DBS was placed in a 96-well protein precipitation plate, 20 μl of 10 mg/ml dithiothreitol (DTT) was added to each well, and the plate was shaken at 600 rpm for 5 min. Then, 300 μl mixed extracting solution [0.1% formic acid–acetonitrile containing 5 μl internal standard (IS)] was added to each well and shaken at 600 rpm for 30 min. The extraction solution was filtered by 0.02 MPa and collected. Each sample was diluted with 200 μl of 80% (V/V) acetonitrile water solution and mixed at 600 rpm for 5 min. All of the calibration curves were computed by plotting the relative peak area ratios of analyte to IS vs. the plasma concentrations of each analyte using a weight factor of 1/x2 at each concentration.
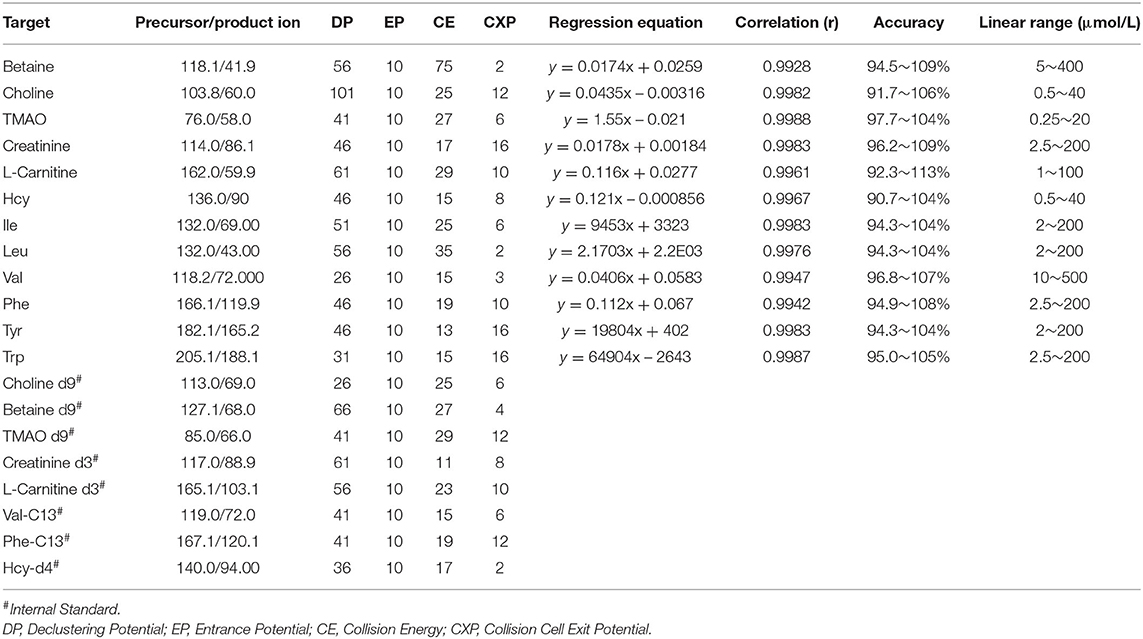
Table 2. MS/MS detection parameters and calibration curves of 12 compound with the internal standard.
Ultra-performance liquid chromatography (UPLC) separation was performed on a Waters ACQUITY UPLC® BEH HILIC column (2.1 × 100 mm, 1.7 μm) at 40°C at a flow rate of 0.4 ml/min. The autosampler was conditioned at 4°C, and the injection volume was 5 μl. The two mobile phases consisted of 0.1% formic acid−10 mmol/L ammonium formate in water (solvent A) and acetonitrile (solvent B). Separation was carried out in 5 min under the following conditions: 0~1 min, 80% B; 1~2 min, 80~70% B; 2~2.5 min, 70% B; 2.5~3 min, 70~80% B; and 3~5 min, 80% B.
An API 4000 mass spectrometer equipped with an electrospray ionization (ESI) source (AB SCIEX, USA) was used to acquire mass spectra profiles. The optimized operating parameters were as follows: source voltage, 5.0 kV (positive mode); and curtain gas (CUR), 30 psi. Quantitation was performed using MRM mode to monitor the protonated precursor to product ion transition. The compound-dependent parameters, such as m/z, declustering potential (DP), focusing potential (FP), collision energy (CE), and cell exit potential (CXP) were optimized and are shown in Table 2.
MS data were processed using AB SCIEX Analyst 1.6 software, and compound concentrations of DBS samples were calculated. Compound concentrations of DBS samples, participant characteristics [body mass index (BMI), age, diastolic blood pressure (DBP), and sex], and clinical diagnoses were analyzed using the logistic algorithm based on the genetic algorithm to fit the grid model. To verify model accuracy and hopefully national promotion, data from 358 participants in two provinces (test phase, Hebei and Shaanxi) were analyzed as a training set for building the model, and data from 368 participants in the other three provinces (Liaoning, Ningxia, and Shanxi) were used for model validation to verify the accuracy of the model.
OPLSDA was applied to explore the differences in metabolic profiles between each group to identify the response variables that contributed most strongly to the model (SIMCA version 13.0 Umetrics AB, Umea, Sweden). The model was evaluated using three quantitative parameters: R2X is the explained variation in X, R2Y is the explained variation in Y, and Q2 is the predicted variation in Y. The values of Q2 approaching one indicate the perfect fit of the model. Variable importance in the projection (VIP) >1 contributed most to the model and the prediction. In addition, one-way ANOVA with Bonferroni and Hochberg correction was applied for each metabolite. Heat maps were generated using R GUI after standardization between groups (Supplementary Figure 1). ROC analysis and logistic regression analysis were performed to differentiate different CVD categories. The cutoff value was calculated by maximizing Yoden's index with equal weighting for sensitivity and specificity. Statistical analyses were performed using SPSS software version 19.0 (IBM Corp., Armonk, New York). A p-value of <0.05 was considered statistically significant.
In this study, the 726 enrolled participants (Table 1) belonged to five groups: no CVD or other diseases (HI group, n = 200), stroke (n = 151), CHD (n = 173), diabetes (n = 105), and HBP (n = 97). The distributions of sex and age among the CVD groups and healthy group were not significantly different. The BMI and DBP levels of CVD patients were significantly higher than those of the healthy volunteers. This result was consistent with previous reports, as BMI and DBP are high risk factors for CVD (2, 12, 13).
The training set included 358 participants from Hebei and Shaanxi (96 HI, 74 stroke, 73 CHD, 65 diabetes, and 50 HBP volunteers). Their characteristics are shown in Supplementary Table 2. Compared with HI subjects, CVD patients had higher levels of BMI and HBP and a low proportion of smoking and farm work. Interestingly, the higher the disease risk, the greater the percentage of medication use found.
The validation sets from Liaoning, Ningxia, and Shanxi included 368 participants. Their demographic information is shown in Supplementary Tables 3–5. The higher levels of BMI and HBP and the low proportion of smoking and farm work of CVD patients found in the test phase were also found in these three data sets.
The method was validated for linearity, extraction recovery, accuracy, and precision in this study. Detailed results of the methodology validation are provided in Table 2 and Supplementary Tables 6, 7.
Twelve biomarkers including amino acids, amino acid derivatives, L-carnitine, and creatinine were measured in DBS samples. The OPLSDA model was used to characterize the difference between each CVD group and to find discrepant compounds via variable importance in the projection (VIP). We also validated the patient classification in the three training groups by establishing the OPLSDA model. There were obvious differences between the groups in the OPLSDA model (Figure 1), which provides a theoretical basis for us to establish a prediction model. In Figure 1, we can see that according to the established OPLSDA model, the patients in the three training groups were mostly categorized into the appropriate group. The metabolites with VIP values >1.0 were considered potential differential metabolites. Individuals with various types of CVD were compared to HI and with each other, characterizing specific metabolites.
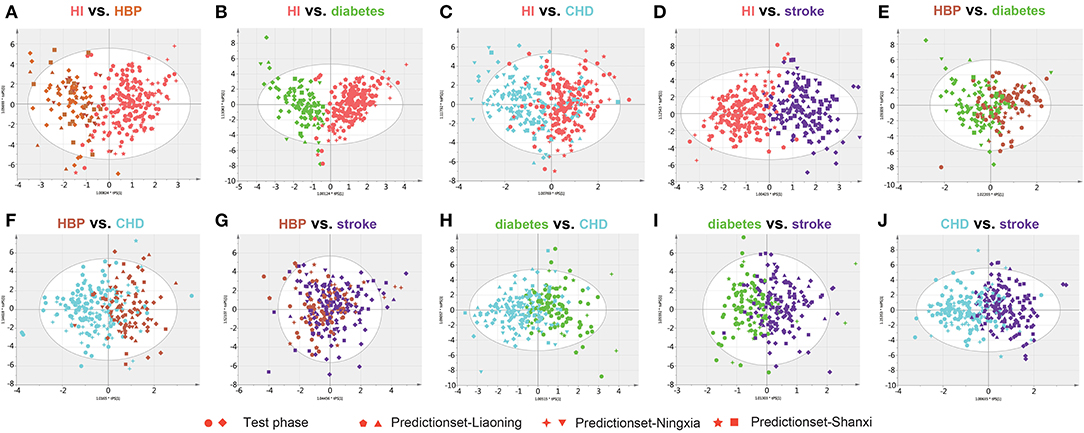
Figure 1. Orthogonal projection to latent structures-discriminant analysis (OPLSDA) prediction modeling to characterize the difference between each cardiovascular disease (CVD) group using the test samples with the 12 metabolites (A–J). There were obvious differences between the groups in the OPLSDA model. According to this prediction model, individuals in the three training groups could be categorized into the correct region of the prediction set. HI, healthy individual; CHD, coronary heart disease; HBP, high blood pressure.
Clear differences were identified, and the three quantitative parameters are shown in Supplementary Table 8. The metabolites with VIP values >1.0 are shown in Table 3. Concentration changes associated with Hcy, Lle, Ile, Trp, and creatinine were the most significant in all paired comparisons.
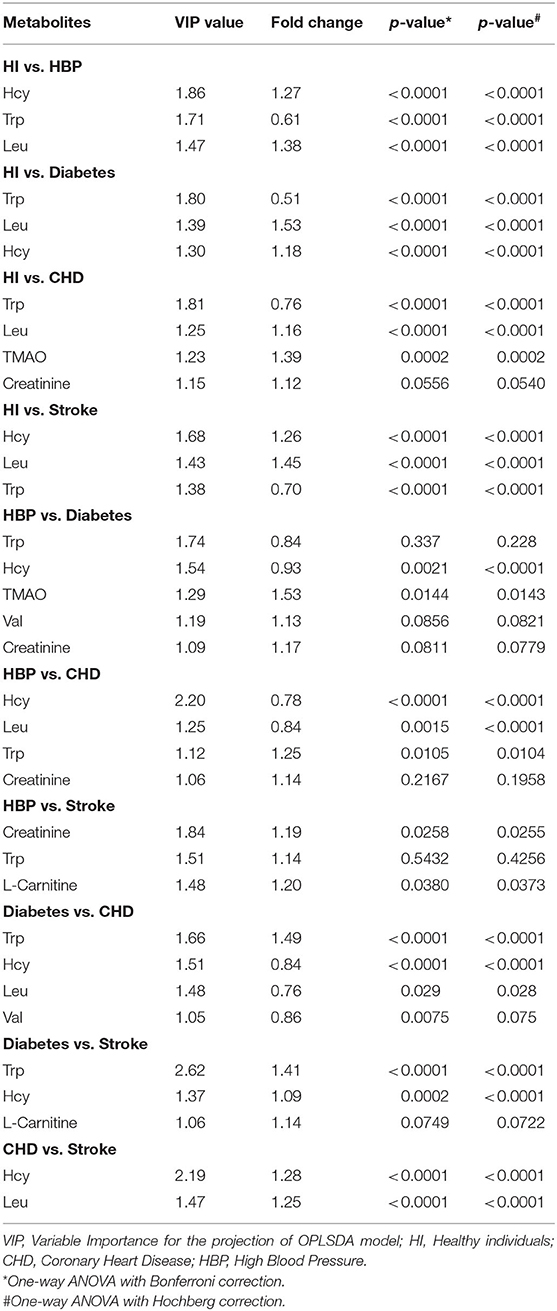
Table 3. Statistical analysis of diagnostic biomarkers: discovery phase.
Through 10 comprehensive cross-comparisons of different groups, seven differential metabolites were confirmed. The concentrations of all the metabolites in HI and individuals in the different CVD groups are summarized in Table 3 and Supplementary Tables 9–11.
As summarized in Table 3, the accurate diagnosis of different types of CVD is fundamental for precision medicine. The criteria for biomarkers were VIP >1.0 in each OPLSDA model was used for differential diagnosis. The ROC curves, on the basis of the logistic regression of each metabolite from the test set, are displayed in Supplementary Figure 2; the areas under the curve (AUCs), sensitivity, and specificity were used to evaluate the prediction accuracy. The patient characteristics, including BMI, age, gender, and DBP, were also taken into consideration. Although it has no effect in many models, it still improves the AUC for a few models, especially in HBP vs. stroke (0.762 vs. 0.653; Figure 2, Supplementary Figure 2). This means that patient characteristics partially characterize CVD.
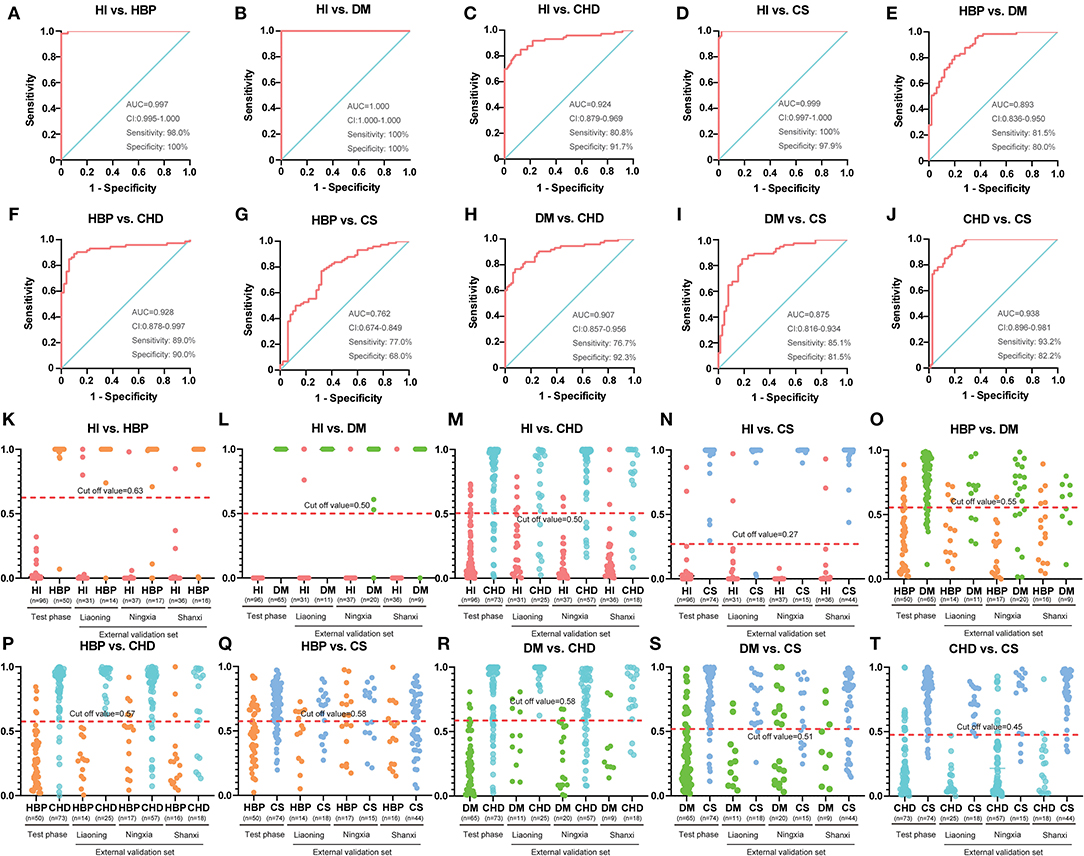
Figure 2. Diagnostic outcomes and prediction accuracies with population characteristics. (A–J) The receiver operating characteristic (ROC) curves, on the basis of the logistic regression of each metabolite from the test set. (K–T) The prediction accuracies by the biomarkers in the test phase and validation sets were compared between each group. HI, healthy individual; DM, diabetes mellitus; CHD, coronary heart disease; HBP, high blood pressure.
The AUC, sensitivity, and specificity were 0.997, 98.0%, and 100% for HI vs. HBP (Figure 2A); 1.000, 100%, and 100% for HBP vs. diabetes (Figure 2B); 0.924, 80.8%, and 91.7% for HI vs. CHD (Figure 2C); 0.999, 100%, and 97.9% for HI vs. stroke (Figure 2D); 0.893, 81.5%, and 80.0% for HBP vs. diabetes (Figure 2E); 0.928, 89.0%, and 90.0% for HBP vs. CHD (Figure 2F); 0.762, 77.0%, and 68.0% for HBP vs. stroke (Figure 2G); 0.907, 76.7%, and 92.3% for diabetes vs. CHD (Figure 2H); 0.875, 85.1%, and 81.5% for diabetes vs. stroke (Figure 2I); and 0.938, 93.2%, and 82.2% for CHD vs. stroke (Figure 2J); respectively. For additional cross-comparisons, AUCs ranged from 0.519 to 1.000, sensitivities from 52.3 to 100%, and specificities from 35.3 to 100% in the other three-center external validation sets, which are shown in Supplementary Figures 3–8. The logistic regression curve and cutoff values in all cross-comparisons in the test phase are shown in Supplementary Tables 12, 13.
Based on the highest prediction sensitivity and specificity of the ROC in the test phase, the optimal cutoff values were 0.63 for HI vs. HBP (Figure 2K), 0.50 for HI vs. diabetes and HI vs. CHD (Figures 2L,M), 0.27 for HI vs. stroke (Figure 2N), 0.55 for HBP vs. diabetes (Figure 2O), 0.57 for HBP vs. CHD (Figure 2P), 0.58 for HBP vs. stroke and diabetes vs. CHD (Figures 2Q,R), 0.51 for diabetes vs. stroke (Figure 2S), and 0.45 for CHD vs. stroke (Figure 2T). The cutoff values were then used to predict the different types of CVD in the test phase and external sets. The predictive accuracy was 100% for HI vs. HBP, HI vs. diabetes and HI vs. stroke, 86.4% for HI vs. CHD, 79.1% for HBP vs. diabetes, 89.4% for HBP vs. CHD, 72.6% for HBP vs. stroke, 84.1% for diabetes vs. CHD, 83.5% for diabetes vs. stroke, and 87.8% for CHD cs. stroke in the test phase (Table 4). The predictive accuracy of the three-centered external validation sets was shown in Supplementary Tables 14–20, and other results of the laboratory diagnostic evaluation indicators obtained by the compounds we selected are shown in Table 4 and Supplementary Tables 14–20.
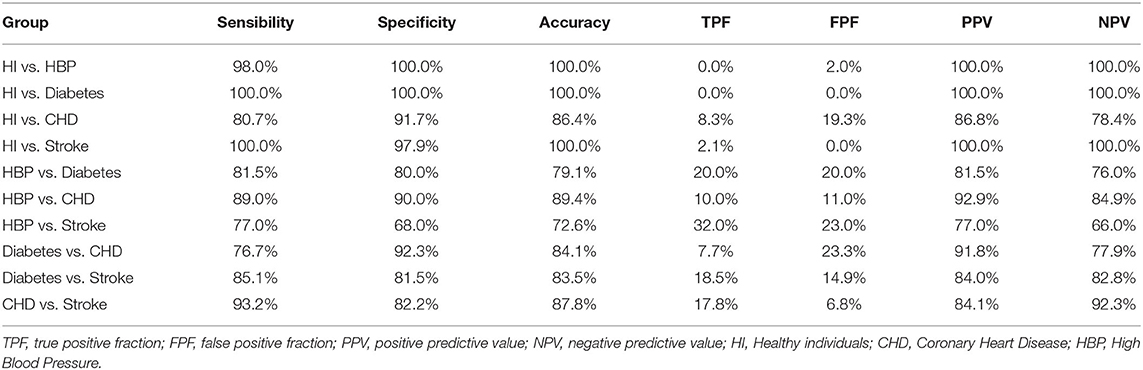
Table 4. Diagnostic test evaluation index of our model in the test phase with population characteristics.
As shown in Table 5, there was a difference in the concentration of the 12 metabolites between each group. For example, the level of Trp is the highest in the HI group, while Leu is the lowest among the HI group. After stepwise regression, we found multi-collinearity between Leu and Ile and deleted Ile in subsequent studies. The calculated value can be obtained through our calculation equation (Supplementary Tables 12, 13). After comparing with the cutoff value, high PPV and NPV values can be obtained (Table 4); in other words, different groups could be characterized.
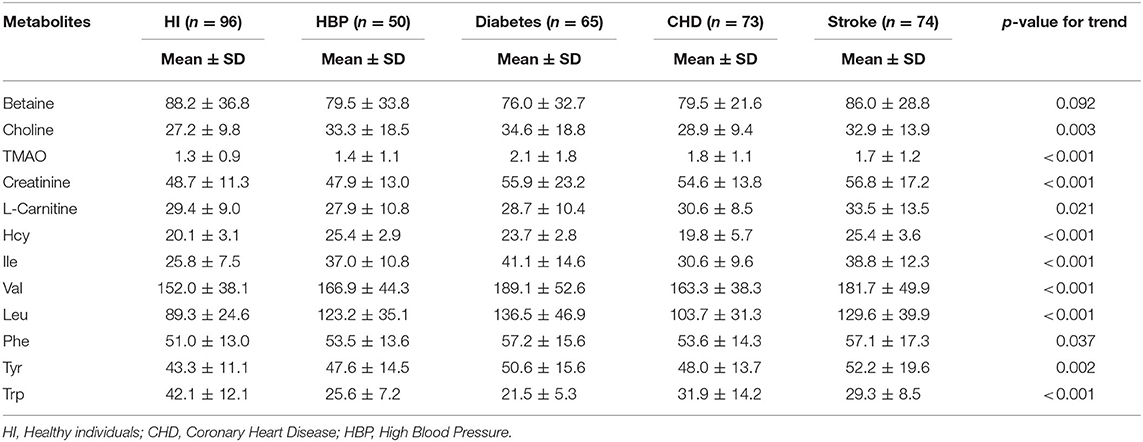
Table 5. Concentrations (μmol/L) of 12 differential metabolites in the test phase.
As a sensitive and effective technology, DBS was first used for newborn screening (14–16), then it is widely successfully applied to the diagnosis of other diseases (17, 18). Our work describes a targeted metabolomics assessment of 526 patients with CVD and 200 healthy volunteers in five provinces of China. Models constructed from the 12 metabolites showed significant pattern differences between healthy people and patients and between patients of all types. There were at least three significantly regulated metabolites in the DBS samples in each group. The combination of metabolic biomarkers provides excellent predictive value for distinguishing between each disease type and healthy people and those with disease.
Common risk factors for CVD include serum lipids (specifically including total cholesterol, triglycerides, and apolipoproteins), as well as C-reactive protein (CRP) and Hcy (19). Hcy is a degradation product of the process of protein metabolism. Under normal circumstances, Hcy in the blood participates in the body's transsulfuration and transmethylation processes with the aid of enzymes and vitamin B6 and folic acid, is degraded to cysteine, and converted into partial proteins (20). When metabolic disturbances occur, if Hcy cannot be degraded, it will accumulate in the body. A high concentration of Hcy can cause damage to the inner wall of the blood vessel and thickening and roughening of the intima of the blood vessel, forming plaque, which can narrow or even block the lumen, resulting in insufficient blood supply to the artery being incomplete, which leads to atherosclerosis and CHD (21). Numerous studies have shown that hyperhomocysteinemia is an independent risk factor for CVD (22).
The intestinal microbiota metabolism of L-carnitine and choline promotes the development of CVD (23–25). Intestinal microorganisms can use excessive amounts of choline, betaine, and L-carnitine as sources of carbon energy, and their unique trimethylamine lyase can break CN bonds. Trimethylamine (TMA) is released as a metabolic waste product and enters the liver through the portal vein. TMA is further oxidized by the liver's secreted flavin-containing monooxygenase 3 (FMO3) to form TMAO (26). TMAO is associated with cholesterol metabolism, insulin resistance, platelet aggregation, thrombosis, vascular inflammatory response, and atherosclerotic plaque formation, which may lead to atherosclerosis, heart failure, hypertension, and stroke. Gut microbiota-derived TMAO is emerging as a new potentially important cause of increased cardiovascular risk (27, 28).
Creatinine is a product of muscle metabolism in the human body. Its level is related to renal function. Long-term hypertension or heart failure can cause kidney damage, which in turn increases creatinine levels (29).
Val, Leu, and Ile are known as branched-chain amino acids (BCAAs). Elevated BCAAs are associated with numerous systemic diseases, including cancer, diabetes, and heart failure (30, 31). Elevated levels of BCAAs activate mammalian target of rapamycin complex 1 (mTORC1) and downstream p70 ribosomal S6 kinase (S6K1), which block the insulin signaling pathway by inducing insulin receptor substrate 1 (IRS-1) serine phosphorylation, causing insulin resistance (32). High levels of BCAAs may also travel to skeletal muscle, interfere with the accumulation of lipid metabolites, and cause skeletal muscle insulin resistance when degraded in the muscle (30). BCAAs drive vascular fatty acid transport and cause insulin resistance (33). Insulin resistance is an independent and important risk factor for CVD. Insulin resistance aggravates CVD by causing the occurrence and development of abnormal glucose metabolism, impacting lipid metabolism, decreasing nitric oxide (NO) production, inducting hypertension, and reducing fibrinolytic activity (34).
During the development of CVD, interferon-γ-mediated inflammation accelerates the degradation of Trp into downstream metabolites (35). Trp could be catalyzed by an alternative inducible indoleamine-pyrrole 2,3-dioxygenase under certain pathophysiological conditions, such as CVD, which consequently increases the formation of kynurenine metabolites. The kynurenine pathway plays a key role in the increased prevalence of CVD (36), and we also found that individuals in the CVD group had a lower level of Trp than in the healthy subjects in this study (Table 5 and Supplementary Tables 9–11). In addition, clinical studies have revealed that Phe and Tyr metabolic abnormalities are also closely related to CVD (35, 37, 38). However, no differences were found between the groups in our study.
In the ROC model we established, most sensitivity and specificity values were high. Only the HBP and stroke groups were poorly classified: sensitivity and specificity were 77.0% and 68.0% in the test phase, respectively. Since 90.5% of stroke patients enrolled in our study also had HBP, we speculate that it is difficult to distinguish between the two groups.
DBS sampling as a microsampling technology has gained interest for many new applications. Increased interest in DBS technology in various fields enables new possibilities in bioanalytical procedures that can be beneficial for patients, health care providers, and laboratories (8). Very large potential from an economical point of view was also shown for DBS technology. The cost for collecting a DBS sample was estimated to be only 20–25% of that of a conventional venous blood sample (8). Moreover, DBS sampling can be performed in a non-hospital environment with a finger or heel prick by a technician or by the patient himself or herself after training. Less reactivity of analytes was found because the adsorption and drying of blood on a solid phase facilitated shipment and storage and reduced costs. Most pathogenic factors are inactivated during blood adsorption and drying, resulting in safer sample handling (39). At present, there are many methods for the clinical diagnosis of CVD, such as computerized tomography (CT), coronary angiography (40), and image-based cardiac diagnosis with machine learning (41). However, in remote rural areas, these methods are relatively lacking and difficult to implement. Blood sampling is relatively simple and convenient but often difficult to transport and preserve. We have developed a sensitive and powerful DBS detection and logistic algorithm, and better sample stability could be observed. Samples that can be stored at room temperature and the DBS method allow for more convenient blood collection, easier transportation, lower detection cost were also considered, and high forecast accuracy. Convenient and inexpensive multidimensional diagnostic methods are important for people, especially in relatively isolated rural areas and are suitable for clinical diagnosis in areas with undeveloped medical facilities.
First, the cardiovascular risk models built in this paper remain incomplete. Analyses of more compounds, such as unsaturated fatty acids, are recommended in future studies. Second, our study population consisted of middle-aged to elderly patients in five provinces of China. Younger age groups with suspected or confirmed CVD could be considered. Third, our strategy requires a mass spectrometry facility, which is not common in some underdeveloped regions, and the equipment is very expensive. Transport of DBS to a qualified laboratory for testing is required in future studies; the scope could be broadened to include other provinces and other ethnicities within Asia, other races, and larger sized samples.
We analyzed 12 biomarkers from DBSs to characterize CVD features. This improved evaluation can lead to the clinical diagnosis of CVD. Novel algorithms predict and differentiate between CVD types; such differentiation may reduce unnecessary invasive coronary angiography, enhance predictive value, and complement current diagnostic methods.
All datasets generated for this study are included in the article/Supplementary Material.
The studies involving human participants were reviewed and approved by the study protocol was approved by the Ethics Committee of The First Affiliated Hospital of Soochow University. The patients/participants provided their written informed consent to participate in this study.
LL, JR, and LY designed the study. LL, YW, MY, TX, and XL performed experiments and collected and analyzed the data. LL wrote the manuscript. All authors contributed to the article and approved the submitted version.
This work was supported by the National Natural Science Foundation of China (81503140) and the National Key New Drug Creation Special Programs (2017ZX09304-021).
MY and JR were employed by the company Suzhou BioNovoGene Metabolomics Platform.
The remaining authors declare that the research was conducted in the absence of any commercial or financial relationships that could be construed as a potential conflict of interest.
The Supplementary Material for this article can be found online at: https://www.frontiersin.org/articles/10.3389/fcvm.2020.542519/full#supplementary-material
CVD, cardiovascular disease; CHD, coronary heart disease; DBS, dried blood spot; ROC, receiver operating characteristic; TMAO, trimethylamine N-oxide; Hcy, homocysteine; Ile, isoleucine; Leu, leucine; Val, valine; Phe, phenylalanine; Tyr, tyrosine; Trp, tryptophan; HI, healthy individual; HBP, high blood pressure; BMI, body mass index; DBP, diastolic blood pressure; OPLSDA, orthogonal projection to latent structures-discriminant analysis; VIP, variable importance in the projection.
1. Fan Y, Li Y, Chen Y, Zhao YJ, Liu LW, Li J, et al. Comprehensive metabolomic characterization of coronary artery diseases. J Am Coll Cardiol. (2016) 68:1281–93. doi: 10.1016/j.jacc.2016.06.044
2. Bell JA, Carslake D, O'Keeffe LM, Frysz M, Howe LD, Hamer M, et al. Associations of body mass and fat indexes with cardiometabolic traits. J Am Coll Cardiol. (2018) 72:3142–54. doi: 10.1016/j.jacc.2018.09.066
3. Wang X, Guan Q, Chen W, Hu X, Li L. Novel nanoliposomal delivery system for polydatin: preparation, characterization, and in vivo evaluation. Drug Des Devel Ther. (2015) 9:1805–13. doi: 10.2147/DDDT.S77615
4. Writing Group Members, Mozaffarian D, Benjamin EJ, Go AS, Arnett DK, Blaha MJ, et al. Heart disease and stroke statistics-2016 update: a report from the American heart association. Circulation. (2016) 133:e38-360. doi: 10.1161/CIR.0000000000000350
5. Zhou M, Wang H, Zeng X, Yin P, Zhu J, Chen W, et al. Mortality, morbidity, and risk factors in China and its provinces, 1990–2017: a systematic analysis for the global burden of disease study 2017. Lancet. (2019) 394:1145–58. doi: 10.1016/S0140-6736(19)30427-1
6. Zhang H, Watanabe R, Berry GJ, Vaglio A, Liao YJ, Warrington KJ, et al. Immunoinhibitory checkpoint deficiency in medium and large vessel vasculitis. Proc Natl Acad Sci USA. (2017) 114:E970–9. doi: 10.1073/pnas.1616848114
7. Suhre K, Shin SY, Petersen AK, Mohney RP, Meredith D, Wagele B, et al. Human metabolic individuality in biomedical and pharmaceutical research. Nature. (2011) 477:54–60. doi: 10.1038/nature10354
8. Lenk G, Ullah S, Stemme G, Beck O, Roxhed N Evaluation of a volumetric dried blood spot card using a gravimetric method and a bioanalytical method with capillary blood from 44 volunteers. Anal Chem. (2019) 91:5558–65. doi: 10.1021/acs.analchem.8b02905
9. Varela P, Mastroianni Kirsztajn G, Motta FL, Martin RP, Turaca LT, Ferrer HLF, et al. Correlation between GLA variants and alpha-galactosidase a profile in dried blood spot: an observational study in Brazilian patients. Orphanet J Rare Dis. (2020) 15:30. doi: 10.1186/s13023-019-1274-3
10. Bai Q, Peng B, Wu X, Cao Y, Sun X, Hong M, et al. Metabolomic study for essential hypertension patients based on dried blood spot mass spectrometry approach. IUBMB Life. (2018) 70:777–85. doi: 10.1002/iub.1885
11. Ruiz-Canela M, Hruby A, Clish CB, Liang L, Martinez-Gonzalez MA, Hu FB. Comprehensive metabolomic profiling and incident cardiovascular disease: a systematic review. J Am Heart Assoc. (2017) 6:e005705. doi: 10.1161/JAHA.117.005705
12. Twig G, Yaniv G, Levine H, Leiba A, Goldberger N, Derazne E, et al. Body-mass index in 2.3 million adolescents and cardiovascular death in adulthood. N Engl J Med. (2016) 374:2430–40. doi: 10.1056/NEJMoa1503840
13. Robertson J, Schaufelberger M, Lindgren M, Adiels M, Schioler L, Toren K, et al. Higher body mass index in adolescence predicts cardiomyopathy risk in midlife. Circulation. (2019) 140:117–25. doi: 10.1161/CIRCULATIONAHA.118.039132
14. Wiesinger T, Mechtler T, Schwarz M, Xie X, Grosse R, Nieves Cobos P, et al. Investigating the suitability of high-resolution mass spectrometry for newborn screening: identification of hemoglobinopathies and beta-thalassemias in dried blood spots. Clin Chem Lab Med. (2020) 58:810–6. doi: 10.1515/cclm-2019-0832
15. Huffnagel IC, van de Beek MC, Showers AL, Orsini JJ, Klouwer FCC, Dijkstra IME, et al. Comparison of C26:0-carnitine and C26:0-lysophosphatidylcholine as diagnostic markers in dried blood spots from newborns and patients with adrenoleukodystrophy. Mol Genet Metab. (2017) 122:209–15. doi: 10.1016/j.ymgme.2017.10.012
16. Tajima G, Hara K, Tsumura M, Kagawa R, Okada S, Sakura N, et al. Newborn screening for carnitine palmitoyltransferase II deficiency using (C16+C18:1)/C2: evaluation of additional indices for adequate sensitivity and lower false-positivity. Mol Genet Metab. (2017) 122:67–75. doi: 10.1016/j.ymgme.2017.07.011
17. Brown M, Ashcraft P, Arning E, Bottiglieri T, Roullet JB, Gibson KM. Gamma-hydroxybutyrate content in dried bloodspots facilitates newborn detection of succinic semialdehyde dehydrogenase deficiency. Mol Genet Metab. (2019) 128:109–12. doi: 10.1016/j.ymgme.2019.07.010
18. Lai Y, Zhang G, Zhou Z, Inhaber N, Bernstein JA, Chockalingam PS, et al. A novel functional C1 inhibitor activity assay in dried blood spot for diagnosis of hereditary angioedema. Clin Chim Acta. (2020) 504:155–62. doi: 10.1016/j.cca.2020.02.010
19. Alvarez-Sanchez N, Alvarez-Rios AI, Guerrero JM, Garcia-Garcia FJ, Rodriguez-Manas L, Cruz-Chamorro I, et al. Homocysteine and C-reactive protein levels are associated with frailty in older spaniards: the toledo study for healthy aging. J Gerontol A Biol Sci Med Sci. (2019) 75:1488–94. doi: 10.1093/gerona/glz168
20. Borowczyk K, Piechocka J, Glowacki R, Dhar I, Midtun O, Tell GS, et al. Urinary excretion of homocysteine thiolactone and the risk of acute myocardial infarction in coronary artery disease patients: the WENBIT trial. J Intern Med. (2019) 285:232–44. doi: 10.1111/joim.12834
21. Liu Z, Luo H, Zhang L, Huang Y, Liu B, Ma K, et al. Hyperhomocysteinemia exaggerates adventitial inflammation and angiotensin II-induced abdominal aortic aneurysm in mice. Circ Res. (2012) 111:1261–73. doi: 10.1161/CIRCRESAHA.112.270520
22. Jakubowski H. Homocysteine modification in protein structure/function and human disease. Physiol Rev. (2019) 99:555–604. doi: 10.1152/physrev.00003.2018
23. Tang WH, Wang Z, Levison BS, Koeth RA, Britt EB, Fu X, et al. Intestinal microbial metabolism of phosphatidylcholine and cardiovascular risk. N Engl J Med. (2013) 368:1575–84. doi: 10.1056/NEJMoa1109400
24. Koeth RA, Wang Z, Levison BS, Buffa JA, Org E, Sheehy BT, et al. Intestinal microbiota metabolism of L-carnitine, a nutrient in red meat, promotes atherosclerosis. Nat Med. (2013) 19:576–85. doi: 10.1038/nm.3145
25. Hartiala JA, Tang WH, Wang Z, Crow AL, Stewart AF, Roberts R, et al. Genome-wide association study and targeted metabolomics identifies sex-specific association of CPS1 with coronary artery disease. Nat Commun. (2016) 7:10558. doi: 10.1038/ncomms10558
26. Fennema D, Phillips IR, Shephard EA. Trimethylamine and trimethylamine N-oxide, a flavin-containing monooxygenase 3 (FMO3)-mediated host-microbiome metabolic axis implicated in health and disease. Drug Metab Dispos. (2016) 44:1839–50. doi: 10.1124/dmd.116.070615
27. Schiattarella GG, Sannino A, Toscano E, Giugliano G, Gargiulo G, Franzone A, et al. Gut microbe-generated metabolite trimethylamine-N-oxide as cardiovascular risk biomarker: a systematic review and dose-response meta-analysis. Eur Heart J. (2017) 38:2948–56. doi: 10.1093/eurheartj/ehx342
28. Zhu W, Gregory JC, Org E, Buffa JA, Gupta N, Wang Z, et al. Gut microbial metabolite TMAO enhances platelet hyperreactivity and thrombosis risk. Cell. (2016) 165:111–24. doi: 10.1016/j.cell.2016.02.011
29. Nishanth A, Thiruvaran T. Identifying important attributes for early detection of chronic kidney disease. IEEE Rev Biomed Eng. (2018) 11:208–16. doi: 10.1109/RBME.2017.2787480
30. Neinast MD, Jang C, Hui S, Murashige DS, Chu Q, Morscher RJ, et al. Quantitative analysis of the whole-body metabolic fate of branched-chain amino acids. Cell Metab. (2019) 29:417–29.e4. doi: 10.1016/j.cmet.2018.10.013
31. Mangge H, Zelzer S, Pruller F, Schnedl WJ, Weghuber D, Enko D, et al. Branched-chain amino acids are associated with cardiometabolic risk profiles found already in lean, overweight and obese young. J Nutr Biochem. (2016) 32:123–7. doi: 10.1016/j.jnutbio.2016.02.007
32. Moberg M, Apro W, Ekblom B, van Hall G, Holmberg HC, Blomstrand E. Activation of mTORC1 by leucine is potentiated by branched-chain amino acids and even more so by essential amino acids following resistance exercise. Am J Physiol Cell Physiol. (2016) 310:C874–84. doi: 10.1152/ajpcell.00374.2015
33. Jang C, Oh SF, Wada S, Rowe GC, Liu L, Chan MC, et al. A branched-chain amino acid metabolite drives vascular fatty acid transport and causes insulin resistance. Nat Med. (2016) 22:421–6. doi: 10.1038/nm.4057
34. Laakso M, Kuusisto J. Insulin resistance and hyperglycaemia in cardiovascular disease development. Nat Rev Endocrinol. (2014) 10:293–302. doi: 10.1038/nrendo.2014.29
35. Yu E, Ruiz-Canela M, Guasch-Ferre M, Zheng Y, Toledo E, Clish CB, et al. Increases in plasma tryptophan are inversely associated with incident cardiovascular disease in the prevencion con dieta mediterranea (PREDIMED) study. J Nutr. (2017) 147:314–22. doi: 10.3945/jn.117.251801
36. Wang Q, Liu D, Song P, Zou MH. Tryptophan-kynurenine pathway is dysregulated in inflammation, and immune activation. Front Biosci. (2015) 20:1116–43. doi: 10.2741/4363
37. Wurtz P, Havulinna AS, Soininen P, Tynkkynen T, Prieto-Merino D, Tillin T, et al. Metabolite profiling and cardiovascular event risk: a prospective study of 3 population-based cohorts. Circulation. (2015) 131:774–85. doi: 10.1161/CIRCULATIONAHA.114.013116
38. Magnusson M, Lewis GD, Ericson U, Orho-Melander M, Hedblad B, Engstrom G, et al. A diabetes-predictive amino acid score and future cardiovascular disease. Eur Heart J. (2013) 34:1982–9. doi: 10.1093/eurheartj/ehs424
39. Joye T, Sidibe J, Deglon J, Karmime A, Sporkert F, Widmer C, et al. Liquid chromatography-high resolution mass spectrometry for broad-spectrum drug screening of dried blood spot as microsampling procedure. Anal Chim Acta. (2019) 1063:110–6. doi: 10.1016/j.aca.2019.02.011
40. Curley D, Lavin Plaza B, Shah AM, Botnar RM. Molecular imaging of cardiac remodelling after myocardial infarction. Basic Res Cardiol. (2018) 113:10. doi: 10.1007/s00395-018-0668-z
Keywords: cardiovascular diseases, biomarker, risk prediction, DBS, metabolomics
Citation: Liu L, Jin X, Wu Y, Yang M, Xu T, Li X, Ren J and Yan LL (2020) A Novel Dried Blood Spot Detection Strategy for Characterizing Cardiovascular Diseases. Front. Cardiovasc. Med. 7:542519. doi: 10.3389/fcvm.2020.542519
Received: 13 March 2020; Accepted: 21 August 2020;
Published: 09 October 2020.
Edited by:
Per Tornvall, Karolinska Institutet (KI), SwedenReviewed by:
Harry Staines, Independent Researcher, Balmullo, United KingdomCopyright © 2020 Liu, Jin, Wu, Yang, Xu, Li, Ren and Yan. This is an open-access article distributed under the terms of the Creative Commons Attribution License (CC BY). The use, distribution or reproduction in other forums is permitted, provided the original author(s) and the copyright owner(s) are credited and that the original publication in this journal is cited, in accordance with accepted academic practice. No use, distribution or reproduction is permitted which does not comply with these terms.
*Correspondence: Linsheng Liu, bGl1bGluc2hlbmdAc3VkYS5lZHUuY24=; bGluc2hlbmdfbGl1QDEyNi5jb20=; Lijing L. Yan, bGlqaW5nLnlhbkBkdWtla3Vuc2hhbi5lZHUuY24=; Jianhong Ren, cmpoQGJpb25vdm9nZW5lLmNvbQ==
Disclaimer: All claims expressed in this article are solely those of the authors and do not necessarily represent those of their affiliated organizations, or those of the publisher, the editors and the reviewers. Any product that may be evaluated in this article or claim that may be made by its manufacturer is not guaranteed or endorsed by the publisher.
Research integrity at Frontiers
Learn more about the work of our research integrity team to safeguard the quality of each article we publish.