- 1Centre for Advanced Imaging, University of Queensland, Brisbane, QLD, Australia
- 2The Prince Charles Hospital, Brisbane, QLD, Australia
- 3Medical Imaging and Radiation Science, Monash University, Clayton, VIC, Australia
- 4Translational Research Institute, Brisbane, QLD, Australia
Cardiac magnetic resonance (CMR) imaging has been widely used to assess myocardial perfusion and scar and is the non-invasive gold standard for identification of focal myocardial fibrosis. However, the late gadolinium enhancement technique is limited in its accuracy for absolute quantification and assessment of diffuse myocardial fibrosis by technical and pathophysiological features. CMR relaxometry, incorporating T1 mapping, has emerged as an accurate, reproducible, highly sensitive, and quantitative technique for the assessment of diffuse myocardial fibrosis in a number of disease states. We comprehensively review the physics behind CMR relaxometry, the evidence base, and the clinical applications of this emerging technique.
Cardiac magnetic resonance (CMR) imaging has been used widely to assess myocardial perfusion and scar (1–5). It is the non-invasive gold standard for left and right ventricular quantitation, as well as the assessment and quantitation of focal myocardial fibrosis (after infarction or due to other causes of cellular injury). Myocardial necrosis causes high signal on late gadolinium enhancement (LGE) inversion recovery (IR) T1-weighted images with excellent signal-noise ratios, and this has become the reference standard for non-invasive scar imaging in cardiomyopathies of various causes (1–4). However, LGE is limited in its ability to assess and quantitate diffuse (non-focal) myocardial injury and fibrosis. LGE is affected by inconsistencies in acquisition parameters, such as choice inversion time (TI), and in post-processing when signal intensity (SI) thresholds may be arbitrarily applied to distinguish normal myocardium from fibrotic tissue (6, 7). Moreover, the critical issue with LGE is that SI is expressed on an arbitrary scale (relative SI compared to “nulled” normal myocardium). Imaging of myocardial fibrosis using relative differences between scar and normal myocardium tissue is therefore qualitative. Semi-quantitative analysis of LGE can be performed using signal thresholding applied to LGE images; however, there are differences in technique for infarct quantitation (8), and this is only relevant when regional scar/enhancement is present; it does not allow quantitation of diffuse interstitial fibrosis.
Thus, in non-ischemic cardiomyopathies, such as hypertension or diabetes, LGE CMR is unable to detect signal differential where the collagen deposition is diffuse and widespread throughout the myocardium (9).
CMR Relaxometry
Cardiac magnetic resonance is an evolving technique, providing valuable and comprehensive data on the anatomy and functional integrity of both the heart and coronary blood vessels. Currently, CMR is performed at magnetic field strengths of 1.5 or 3 T. MR images generate by exploiting the magnetic property (called spin) of nuclei that have an odd atomic number or mass number (10). A proton generates a small magnetic field much like a bar magnet, because the proton has mass, a positive charge, and spins. This small magnetic field is referred to as its magnetic moment. The single proton of the hydrogen molecule gives it a significant magnetic moment and combined with its abundance in the human body, makes it an ideal marker for clinical MRI.
In the absence of an applied magnetic field, the magnetic moments of the hydrogen nuclei are oriented randomly; when placed in a high static magnetic field (B0) they will align either parallel or anti-parallel to the magnetic field. Spins that aligned parallel to B0 have a lower energy than those aligned anti-parallel, and therefore more align parallel creating a net magnetization (M0) of the sample in the direction of the magnetic field B0 (11).
Larmor Equation
The interaction of a magnetic moment with B0 causes the magnetic moment to precess about the axis of the static magnetic field (B0), at a frequency specific to the strength of (B0)— the Larmor frequency. The Larmor frequency is defined as follows:
where ν is the frequency, in megahertz, B0 is the strength of the magnetic field, γ is the gyromagnetic ratio for hydrogen, and γ/2π = 42.57 MHz/T (11).
When a radio frequency (RF) pulse at the Larmor frequency is applied to the nuclei within the magnetic field, nuclei begin to resonate and those in the lower energy state absorb energy. Depending on the RF pulse length, the precession of affected nuclei will be moved into the transverse magnetization plane (xy axis) and be in phase. With cessation of the RF field, the nuclei will realign to their original orientation parallel to B0—a process referred to as relaxation. During the relaxation process, the net relaxation induces an RF signal, at the characteristic frequency, which can be measured by a receiver coil. This signal is known as free induction decay (FID).
MRI Relaxation Time
Three different properties of the interaction of the magnetic moments with B0 can be measured. These are the longitudinal time constant T1, or “spin-lattice” relaxation, and transverse time constant T2, or “spin–spin” relaxation and , which is governed by a combination of the effect of spin–spin relaxation, and the homogeneity of the magnetic field. These constants are parameters that are used in MRI to distinguish between normal tissue types and pathological process. The SI of these times depends on the technical parameters that are used for image acquisition (12, 13) and the magnetic properties of a given tissue (14). At a given magnetic field strength, each tissue has a normal range for relaxation time. So, the variation of relaxation time from their normal value can be used to identify pathological process (e.g., edema and scar tissue).
T1 relaxation time refers to the tissue-specific time constant and is a measure of the time taken for protons to realign with the static field after perturbation by the RF pulse. This realignment with B0 is termed T1 longitudinal relaxation and the time in milliseconds. The above diagram T1 recovery curves demonstrate the fat has shorter T1 times than water molecules. This results from the fact that the fat nuclei lose their energy to lattice quickly, due to slow molecular motion, giving a relatively shorter T1 time. The quicker the system returns to the equilibrium state, such as occurs in fat, the greater the magnetization available to be excited by the next imaging pulse, producing more signals. Thus, fat appears bright in T1-weighted image (11).
T2 relaxation causes decay of signal arising from the dephasing of nuclear precession and consequent loss of net coherence (Figure 1) (15). T2 decay due to the magnetic interaction that occurs between protons, results in an exponential decay of the transverse magnetization vector, also governed by tissue structure. Unlike T1 relaxations, T2 does not involve a transfer of energy but only a change in phase. The water molecules have a long T2 decay and appear brighter in T2-weighted images due to the property that more rapidly moving molecules have a lower tendency to transfer their spin leading to a slower dephasing of the transverse magnetization.
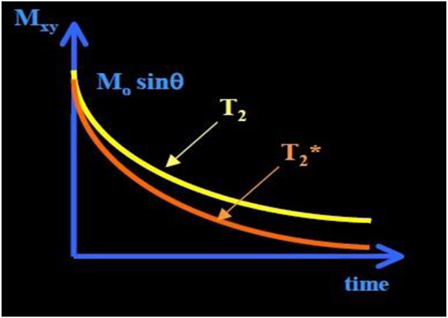
Figure 1. T2 and curve. The has shorter time than T2 time. exponential decay (≈30–100 ms, and shorter for higher B0).
A third decay parameter, , describes the decay of transverse magnetization, due to spin–spin relaxation (T2), together with inhomogeneity in the static magnetic field (ΔB0), which occurs at tissue interfaces. This leads to a more rapid loss of phase coherence and the MR signal. These relaxation times are influenced by several factors, including field strength, blood iron content, blood volume, temperature, and blood oxygenation (15).
Myocardial T1 Mapping in the Setting of Myocardial Fibrosis
The conventional T1 mapping method can be generated with an inversion recovery spin echo (IR-SE) sequence. Spin echo uses a 180°RF pulse to invert the spins within the selected slice, followed by a 90°RF pulse rotate the recovered magnetization at TI into the transverse plane, and a further 180° RF pulse to form the spin echo (12). Sampling of IR curve repeats multiple times with different TIs. The repetition time (TR) of the sequence must be long enough for recovery longitudinal magnetization before the next 180°inversion pulse. The SI of the final image is proportional to the relaxed fraction of the magnetization during the TI as follows:
where the first exponential term relates to signal decay due to transverse relaxation (during TE), the second exponential refers to T1 relaxation (during TI). IR-SE is a gold standard to estimate T1 with a good accuracy. However, the drawback of IR-SE is that the TR of the sequence should be very long, i.e., TR should be at least five times longer T1 to allow full recovery of longitudinal magnetization. To reduce the acquisition time, inversion recovery turbo spin echo is currently used for routine clinical purposes (12).
On traditional T1-weighted images, the focal differences in T1 signal are measured qualitatively, assessed by visual inspection using relative units, and cannot be consistently compared between scans (16). For more precise measurement, an emerging technique for CMR T1 mapping has been applied to measure myocardial signal (in milliseconds) directly on a standardized scale within a single breath hold. This quantification of T1 mapping provides a benefit over the T1-weighted imaging of the myocardium by giving a quantitative measure of T1 time from multiple scans. A parametric map can be then reconstructed by calculating T1 values on a pixel-by-pixel basis (17), so, pixel intensities correspond to T1 values. Different cardiac MR acquisition sequences have been applied to create myocardial T1 maps, including Look–Locker (LL) and modified Look–Locker inversion recovery (MOLLI) (9, 16, 18–24).
T1 Mapping Using the LL Technique
The most common technique to measure spin-lattice T1 relaxation time values is the eponymously named “LL” sequence (also known as “TI scout”). It has been widely used to estimate the optimal TI for assessment of myocardial LGE (23, 25). It was originally proposed by Look and Locker in 1968 and developed more fully in 1970 (24). It consists of an initial inversion pulse, followed by a train of pulses with a constant, limited flip angle (7–15°). The inversion pulse prepares the longitudinal magnetization, which then recovers exponentially according to the T1 (24). The experiment is repeated until the k-space Cartesian map of data is filled, allowing an image to be reconstructed. By producing a train of absorption or dispersion signals (continuous wave magnetic resonance) or FIDs (pulsed magnetic resonance), it is possible to save time in spin-lattice relaxation measurements due to the fact that it is not necessary to wait for equilibrium magnetization before initiating the train (24) (see Figure 2). The total time required to acquire T1 would be significantly reduced compared to IR because the LL technique allows for multiple of MZ in a single measurement period (TM).
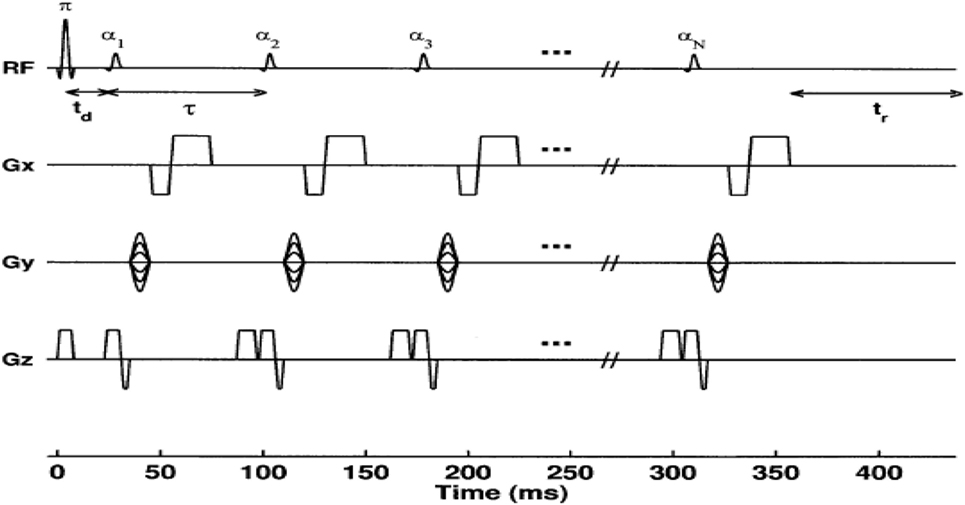
Figure 2. Diagram of a conventional 2D Look–Locker pulse sequence. The inversion-pulse/α-pulse train is repeated for every ky phase encode step. For N α-pulses, a series of N images are formed corresponding to times TIn = td + (n − 1)τ(n + 1, 2, …, N) after the inversion pulse, where td is the time between the inversion pulse and the first α-pulse (26).
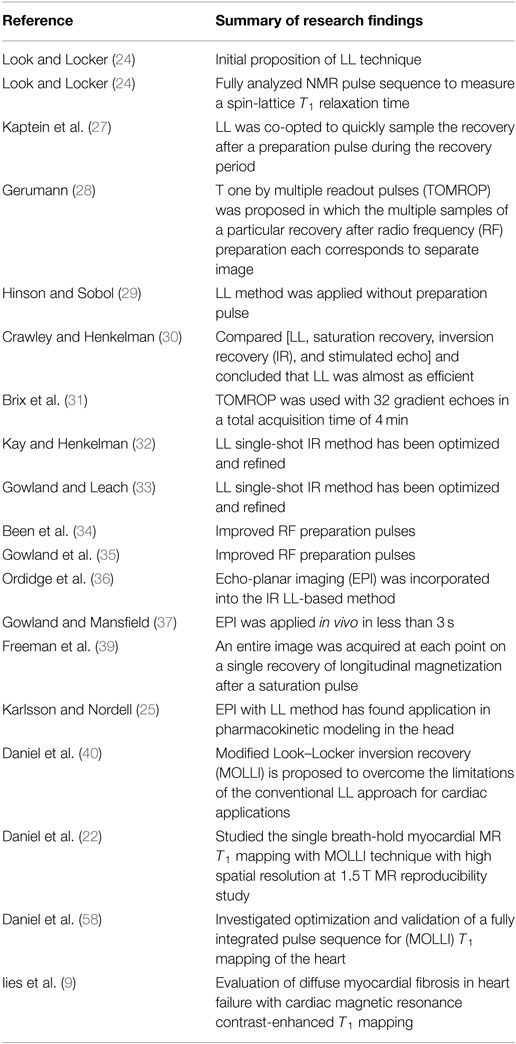
It was co-opted by Kaptein et al. in 1976 to quickly sample the recovery after a preparation pulse, during the recovery period or transient phase (27). This method was developed into the T one by multiple readout pulses (TOMROP) imaging sequence (28). In TOMROP, the multiple samples of a particular recovery after RF preparation each correspond to separate image. To acquire a complete data set for each image, the whole sequence must be repeated numerous times. Each repetition fills the next line of k-space for each image, and so on. Each image has a unique delay time. Early LL-based T1 techniques required the return to equilibrium of the spin system before the next application of an RF preparation pulse. Consequently, the acquisition time per slice of such implementations was long (28). Hinson and Sobol (29) used an LL method with no preparation pulse but the method suffered from poor accuracy, attributed to the slice profile. The late 1980s and early 1990s saw the LL method used for T1 measurements in a number of publications. Crawley and Henkelman (30) compared a number of one-shot and IR methods (LL, saturation recovery, IR, and stimulated echo) and concluded that the LL method was almost as efficient (in terms of dynamic range of the data and the proportion of the imaging time used to sample MR signals) as IR. Brix and colleagues used the TOMROP method with 32 gradient echoes to test for non-exponential behavior, found in fatty tissues (31), in a total acquisition time of 4 min. The LL single-shot IR method has been optimized and refined (32, 33) including improved RF preparation pulses (34, 35).
Echo-planar imaging (EPI) was incorporated into the IR LL-based method (36), by interleaving EPI readouts for eight different slices after an inversion pulse. The sequence was repeated, and the slice order was changed to achieve a range of TIs for each slice, with a total acquisition time of 30 s. LL with EPI was later applied in vivo in less than 3 s (37), using a modified blipped EPI technique (38), sacrificing and accuracy to some extent. An entire image was acquired at each point on a single recovery of longitudinal magnetization after a saturation pulse. The technique was optimized in 1998 (39) and has found applications in pharmacokinetic modeling (25).
The development of LL technique, which is available on Philips, GE, and Siemens platforms, is summarized in Table 1.
The LL sequence has been widely applied in CMR due to its fast acquisition with minimal breath-hold requirements. The LL sequence has been used to measure T1 values in patients with myocardial fibrosis (23). However, it suffers from significant limitations: low flip angle RF pulse exciting the magnetization and the two RR intervals in the LL sequence are not sufficient for the magnetization to return to equilibrium. This causes underestimation of true T1 values using LL. Furthermore, the LL T1 images with different TIs are acquired at different cardiac phases. Therefore, images are “cine” with cardiac motion effect, which requires tedious manually tracking of the myocardial borders for each phase, a labor-intensive and error-prone process which will is challenging in clinical practice. The drawing of regions of interest (ROI) in myocardial segments requires adjusting for cardiac motion, which result in including blood pool (partial volume averaging) and artificially increasing the measured T1 (40). T1 times between patients may vary due to differences in Gd kinetics (such as in renal impairment), or with different contrast agents; correction factors have been proposed using kinetic modeling for the LL technique (41).
To address these shortcomings, several myocardial T1 mapping sequences have been created, including MOLLI.
T1 Mapping with MOLLI
Currently, the most evaluated sequence for myocardium T1 mapping is an MOLLI sequence (22, 42). The T1 mapping identifies a significant variation between normal and abnormal myocardium. It demonstrates that the myocardial fibrosis among different myocardial disorders includes ischemia (18), acute/chronic infraction (19), amyloidosis (20), diabetic (21), dilated and hypertrophic cardiomyopathy (17), and heart failure (9).
Modified Look–Locker inversion recovery is a CMR pulse sequence that is used for accurate T1 mapping of myocardium with high spatial resolution. A T1 map of the myocardium is a reconstructed image, where the T1 relaxation value is computed for every pixel of the corresponding myocardial voxel. Signal recovery from each myocardial voxel is acquired at different TIs following a single inversion pulse, all gated to the same cardiac phase, thereby enabling a pixel-based T1 quantification in the myocardium. MOLLI has introduced two variations to the standard LL sequence; selective data acquisition at a given time of the cardiac cycle over successive heartbeats, and merging of image sets from multiple LL experiments with varying TIs into one data set (22, 40). While selective data acquisition effectively decreases the number of images acquired in each LL experiment to one per heartbeat, the use of multiple LL experiments with different TIs increases the number of samples of the relaxation curve to a value that is sufficiently high for accurate T1 estimation.
Modified Look–Locker inversion recovery is an ECG-gated pulse sequence scheme and uses three prepared LL experiments consecutively within one breath hold over 17 heartbeats to reconstruct 11 images with different TIs. Three successive ECG-triggered LL experiments (LL1, LL2, and LL3) are carried out with three, three, and five single-shot readouts, respectively, at end diastole of consecutive heartbeats to sample the recovery of longitudinal magnetization after the inversion pulse. MOLLI pulse sequence scheme is illustrated (Figure 3). T1 maps can be generated any time before or after contrast agent (e.g., gadolinium) administration (40).

Figure 3. Modified Look–Locker inversion recovery pulse sequence scheme. There are three Look–Locker (LL) experiments, each prepared by a separate 180°inversion pulse (“inv”). The first is defined as TIminimum, and then TI of the second and third LL experiments is determined by TIminimum − TIincrement and TIminimum − 2TIincrement. After inversion pulses, readout is in a non-segmented fashion with a single flip angle (α). A defined pause of a certain number of R–R intervals allows for signal recovery (40).
Reconstruction of T1 maps from MOLLI source images is performed offline using purpose written customized software, or inline using vendor-specific processing, with ROI (septal or endo–epicardial) able to be analyzed in a pixel-wise quantitative fashion (Figure 4).
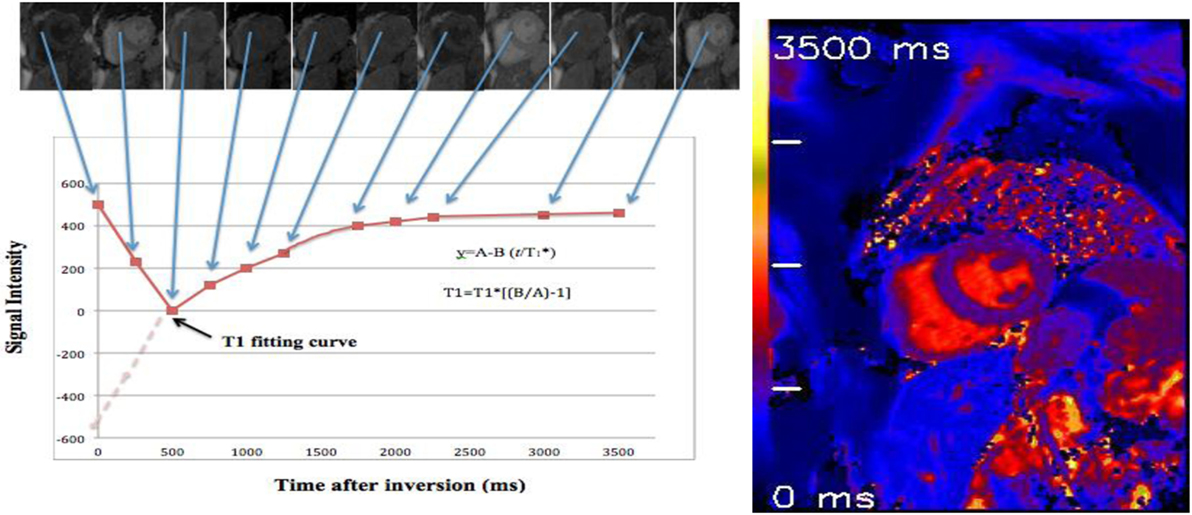
Figure 4. T1 map of a healthy volunteer: using 17 heartbeats to reconstruct 11 images with different inversion times (TIs) at end of diastole phase. By merging these images into one data set, T1 values are computed for every pixel with three parameter curve fitting (39, 41). A reconstructed T1 map with parametric color scale is produced for these pixel values, and the segmental and global T1 times can be estimated.
Image data are sorted by their effective TI, which are given by
where N = image number within the LL experiment and RR = heartbeat interval. Three-parameter non-linear curve fitting using a Levenberg–Marquardt algorithm is performed for corresponding pixel, which is given by
where y denotes SI and corresponds to the apparent, modified T1 in an LL experiment.
Correction for readout-induced attenuation of the relaxation curve is attempted by using the three-curve fitting parameters , A, and B for the calculation of T1. Then, T1 estimates as in conventional LL methods by
The MOLLI sequence has been fully described, optimized, tested/re-tested, in phantoms and in large cohorts of healthy volunteers (22, 40) as well as being applied in cardiomyopathies (9, 17, 18, 20, 43). In addition, the T1 mapping with MOLLI has been validated against histopathology for assessment of myocardial fibrosis. It demonstrated that the pre-contrast “native T1” has a linear correlation with percentage of myocardial fibrosis as measured histologically on invasive myocardial biopsy. T1 times post-contrast administration (10–15 min) had an inverse linear relationship with collagen content in myocardial fibrosis subjects (9, 44, 45).
Nacif et al. (46) compared n = 168 myocardial T1 maps using LL and MOLLI at 1.5 T, showing that pre-contrast (native) T1 values had good agreement, but LL had wider limits of agreement, and post-contrast T1 maps also had good agreement but with LL giving higher values than MOLLI, hence they are not interchangeable (46).
T1 mapping can be generated for different segments of the myocardium (base, mid-cavity, and apex) within a single breath hold of about 15–20 s. However, the apex T1 values with MOLLI are slightly higher than basal and mid-cavity. The increasing in T1 values may be caused by partial volume effect and some degree of overestimation effect in apical level of left ventricle. These effects occur as a result of the ventricular wall being somewhat tilted toward the apex and no longer being aligned perpendicular to the short axis images (47–49).
Furthermore, T1 mapping with MOLLI has a greater reproducibility, accuracy, and an excellent overall inter- and intraobserver agreement over a wide range of TIs in pre- and post-contrast agent administration compared to the LL technique (22, 42). However, the T1 mapping with MOLLI sequence is sensitive to extremes of heart rate (bradycardia or tachycardia) (22) leading to slightly underestimation of T1 values. This may be corrected though “heart rate correction” by changing in the timing of the readouts with respect to the inversion pulses at different heart rates. This variation introduces various degrees of disturbance of the T1 relaxation curve. The heart rate affects the T1 value if the T1 value is higher than 750 ms or less than 200 ms with MOLLI (22, 42).
Moreover, MOLLI is limited by long breath hold about 15–20 s (17 heart beats to acquire the final T1 maps). This may be difficult for elderly and pulmonary compromised patients and generates respiratory and motion artifacts (50). However, modern inline processing provides registration tools to reduce motion artifacts before the computation of final T1 maps (motion corrected or “MoCo MOLLI”). This will minimize the sensitivity of T1 mapping to motion artifacts and heart rate. Also, various acquisition sequences with short breath hold, such as shortened modified Look–Locker inversion recovery, have been validated and recently applied for cardiomyopathies (51, 52). At 1.5 T, the pre- and post-contrast (10 min) T1 times of normal myocardium are 980 ± 53 and 470 ± 26 ms, respectively (Figure 5) (22). Pre-contrast T1 values of myocardial fibrosis (infarction scar) are significantly longer than those of normal myocardium (1,060 ± 61 vs. 987 ± 34 ms) (43). The longer pre-contrast T1 values in myocardial fibrosis patients have been reported in different cardiomyopathies. Infarction, myocarditis, and interstitial diffuse fibrosis, all have high pre-contrast T1 values when compared with normal myocardial T1 times (17, 20, 43). However, longer T1 values may also be noticed in different pathologically important processes, such as edema (53). Previous phantom, animal, and human tissue based studies lend insight into the effects on T1 signal by showing that T1 increases with increased water content and amount of extracellular fibrillar macromolecules (14, 54). Messroghli et al. concluded that increased myocardial T1 mapping corresponds to the areas of the human myocardial infarction, which showed on LGE (43). However, the links between the exact molecular mechanism in healthy tissue and myocardial fibrosis and corresponding pre-contrast T1 are less well understood. On the hand, the decrease in post-contrast T1 values in diffuse myocardial fibrosis has been previously related to increased extracellular space. It has been well described in acute, chronic ischemic, diffuse myocardial fibrosis, and inflammatory myocardial injury. The post-contrast T1 times (10 min) were significantly shorter in chronic infarct scar compared with normal myocardium at 0.15 mmol/kg (390 ± 20 vs. 483 ± 23 ms, respectively) (43).
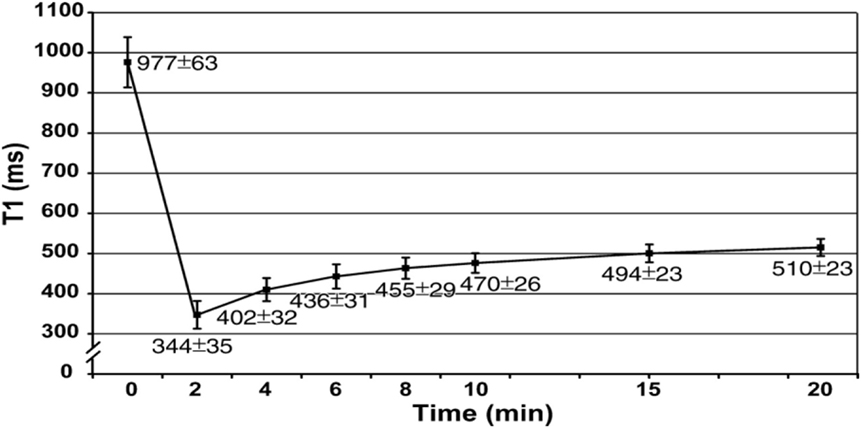
Figure 5. Graph shows recovery of absolute T1 (mean ± SD in milliseconds) at 1.5 T in mid-cavity short axis slices at pre- and post-contrast (0–20 min) after administration of 0.15 mmol/kg of gadopentetate dimeglumine (22).
Also, T1 mapping with high magnetic field (3 T) has been reported in a few studies of interstitial myocardial fibrosis. It was similar to 1.5 T, the pre-contrast T1 was longer, and post-contrast T1 was shorter in myocardial fibrosis patients compared to normal myocardium. Puntmann et al. (55) reported higher pre-contrast T1 values for hypertrophic and non-ischemic-dilated cardiomyopathies at 3 T compared to controls (hypertrophic 1.254 ± 43 ms and non-ischemic-dilated cardiomyopathy 1.239 ± 57 ms vs. healthy 1.070 ± 55 ms). Also, the post-contrast T1 values (10 min) at 3 T were shorter in hypertrophic and dilated cardiomyopathies compared to healthy (hypertrophic: 307 ± 47 ms, dilated cardiomyopathies: 296 ± 43 ms vs. controls: 402 ± 58 ms) (55).
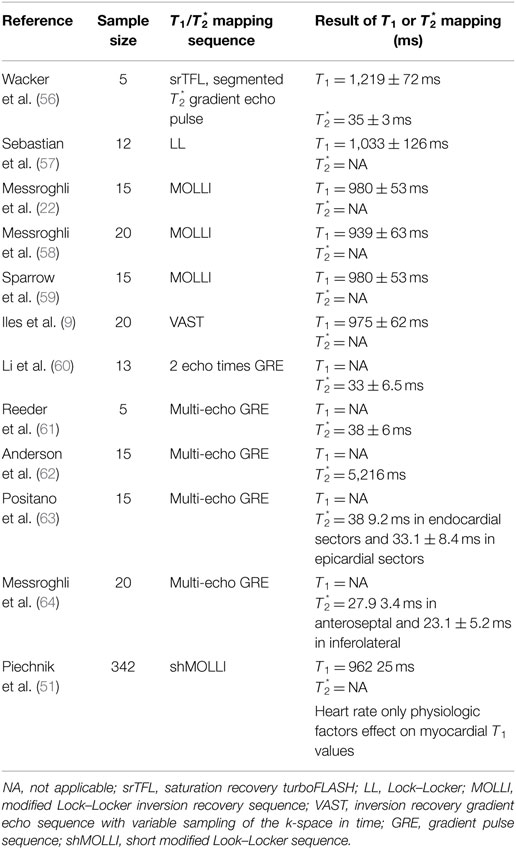
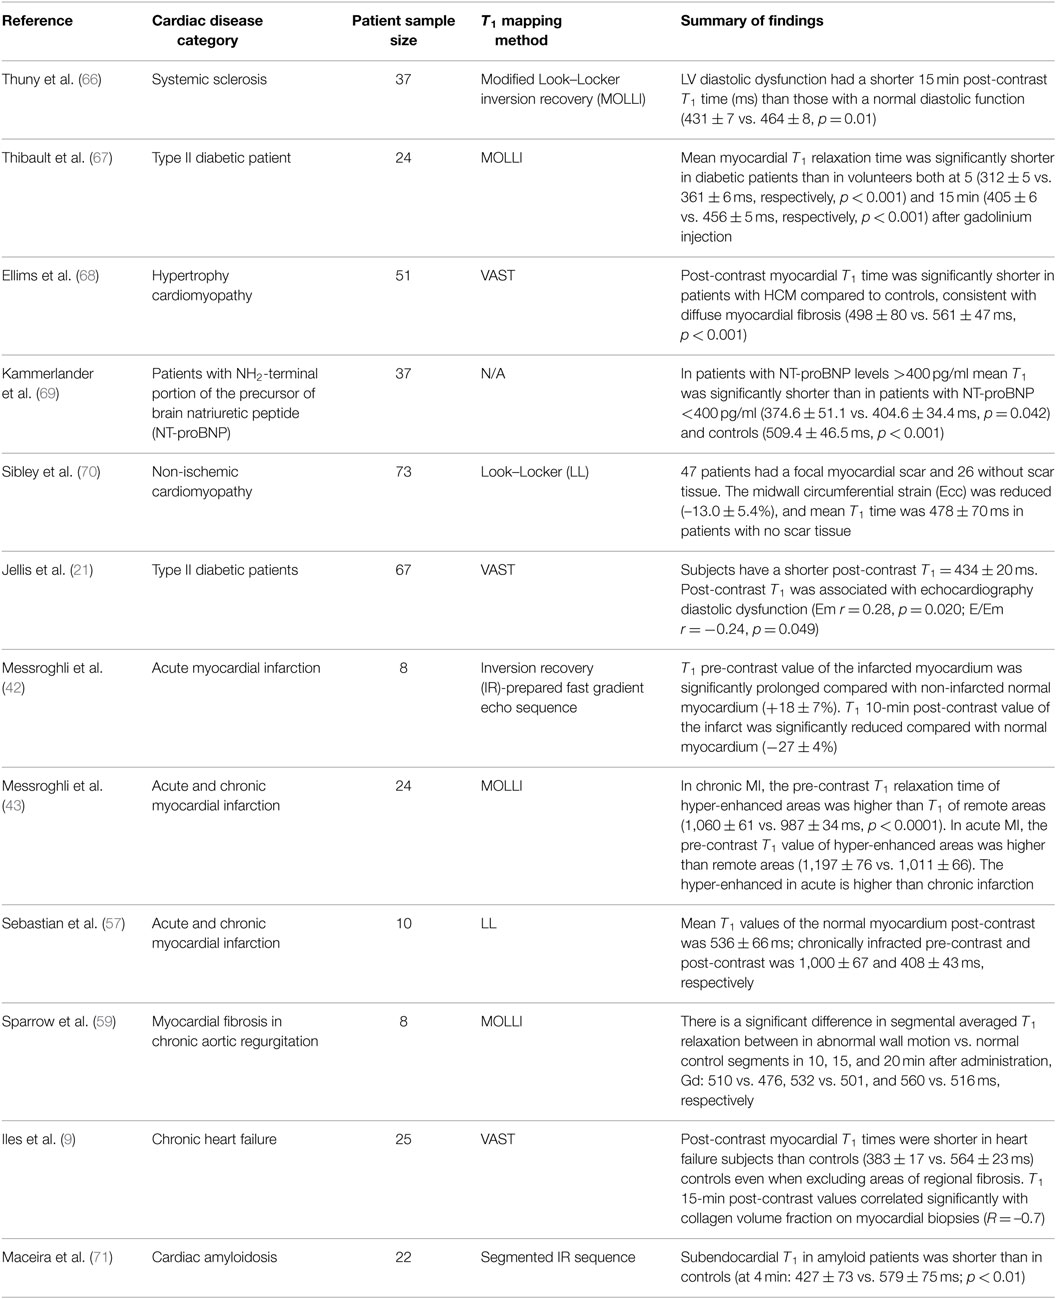
There are studies published for normal and diffuse myocardial fibrosis of myocardium T1 values, as described comprehensively in Tables 2 and 3.
The myocardium is made of densely packed myocytes, contributing to approximately 90% of myocardial mass. Signal from pre-contrast imaging reflects the majority of signal from the myocytes themselves. Conversely, in post-contrast imaging, the majority of Gd-based contrast signal arises from the interstitium (as Gd is an extracellular contrast agent and does not, therefore, reside within myocytes unless they are damaged); thus, post-contrast T1 mainly reflects interstitial or replacement fibrosis (see Box 1, below), hence the ability to calculate extracellular volume (ECV) from the difference between these two parameters.
Box 1. Source of T1 signal.
Pre-contrast “Native” T1 = predominant signal from myocytes (replacement fibrosis, or intracellular accumulation, e.g., Fabry disease). Post-contrast T1 = predominant signal from interstitial space (interstitial fibrosis).
Extracellular Volume
T1 mapping data can be used to calculate ECV fraction, using the pre- and post-contrast T1 times and hematocrit. Details of this technique and its uses are beyond the scope of this review; SCMR guidelines exist to guide application of T1 mapping and ECV quantitation (65).
Limitations of T1 Mapping
Challenges remain with myocardial relaxometry for T1 mapping. These include technical challenges such as variations of T1 times at different field strength and across different vendors, and the rapidity in growth of pulse sequences being released as product and as works-in-progress, calling into question both the inherent accuracy and the level agreement between these techniques. Furthermore, the variations in T1 relaxometry values with different contrast doses and image timing require further investigation, to establish the test–retest and inter-site reproducibility of this technique. Next, the challenges to application of T1 mapping to clinical practice include establishment of robust normal ranges in large cohorts across multiple ethnic groups, and the observation that T1 mapping appears to be a highly sensitive technique, with the ability to discriminate healthy normal myocardium and identify very early changes in substrate. However, this technique lacks specificity; a wide variety of conditions prolongs native T1 and/or shortens post-contrast myocardial T1. Therefore, further clinical data are required in order to establish the use of these parameters in relation to disease (e.g., early detection of target organ damage in systemic conditions such as hypertension or diabetes), to inform treatment decisions, and their ability to predict or alter clinical outcomes.
Conclusion
Myocardial T1 mapping using quantitative relaxometry is an emerging and important tool in the assessment of global myocardial fibrosis. It is a highly sensitive marker of disease but is not specific, with changes in myocardial T1 occurring in many different conditions. Nevertheless, the high sensitivity and excellent reproducibility of the technique offers a tool for the early detection of myocardial damage, over-and-above techniques such as the CMR LGE technique and other modalities such as speckle tracking echocardiography, pulse wave velocity, and tissue tagging. Native T1 mapping is proving to be a robust indicator of early myocardial disease in many conditions, and normal ranges and guidelines for post-processing have been published by the Society of Cardiovascular Magnetic Resonance (65). Myocardial T1 mapping is a rapidly evolving technique, now with longitudinal prognostic data emerging, and normal ranges established at 1.5 and 3.0 T in healthy humans and in aging. Further questions remain as to the standardization of pulse sequences across field strengths and between vendors, the affect of contrast type, dose and timing, the post-processing software, and the interpretation of T1 mapping results to inform clinical practice.
Author Contributions
CH-C, MS, and GG: main contributions to the conception or design of the work; the interpretation of data for the work; drafted the work and revised it critically for important intellectual content; final approval of the version to be published; and agreement to be accountable for all aspects of the work in ensuring that questions related to the accuracy or integrity of any part of the work are appropriately investigated and resolved.
Conflict of Interest Statement
The authors declare that the research was conducted in the absence of any commercial or financial relationships that could be construed as a potential conflict of interest.
Acknowledgments
The authors thank Dr. Qurain Alshammari for his input.
Funding
CH-C was funded by the DSITIA Smart Futures Fellowship Early Careers Grant.
References
1. Croisille P, Revel D, Saeed M. Contrast agents and cardiac MR imaging of myocardial ischemia: from bench to bedside. Eur Radiol (2006) 16:1951–63. doi: 10.1007/s00330-006-0244-z
2. Judd RM, Atalay MK, Rottman GA, Zerhouni EA. Effects of myocardial water exchange on T1 enhancement during bolus administration of MR contrast agents. Magn Reson Med (1995) 33:215–23. doi:10.1002/mrm.1910330211
3. Lima JAC. Myocardial viability assessment by contrast-enhanced magnetic resonance imaging. J Am Coll Cardiol (2003) 42:902–4. doi:10.1016/S0735-1097(03)00839-8
4. Kim RJ, Chen E-L, Lima JA, Judd RM. Myocardial Gd-DTPA kinetics determine MRI contrast enhancement and reflect the extent and severity of myocardial injury after acute reperfused infarction. Circulation (1996) 94:3318–26. doi:10.1161/01.CIR.94.12.3318
5. Mahrholdt H, Wagner A, Judd RM, Sechtem U, Kim RJ. Delayed enhancement cardiovascular magnetic resonance assessment of non-ischaemic cardiomyopathies. Eur Heart J (2005) 26:1461–74. doi:10.1093/eurheartj/ehi258
6. Simonetti OP, Kim RJ, Fieno DS, Hillenbrand HB, Wu E, Bundy JM, et al. An improved MR imaging technique for the visualization of myocardial infarction1. Radiology (2001) 218:215–23. doi:10.1148/radiology.218.1.r01ja50215
7. Spiewak M, Malek LA, Misko J, Chojnowska L, Milosz B, Klopotowski M, et al. Comparison of different quantification methods of late gadolinium enhancement in patients with hypertrophic cardiomyopathy. Eur J Radiol (2010) 74:e149–53. doi:10.1016/j.ejrad.2009.05.035
8. Flett AS, Hasleton J, Cook C, Hausenloy D, Quarta G, Ariti C, et al. Evaluation of techniques for the quantification of myocardial scar of differing etiology using cardiac magnetic resonance. JACC Cardiovasc Imaging (2011) 4:150–6. doi:10.1016/j.jcmg.2010.11.015
9. Iles L, Pfluger H, Phrommintikul A, Cherayath J, Aksit P, Gupta SN, et al. Evaluation of diffuse myocardial fibrosis in heart failure with cardiac magnetic resonance contrast-enhanced T1 mapping. J Am Coll Cardiol (2008) 52:1574–80. doi:10.1016/j.jacc.2008.06.049
10. Matthews PM, Adcock J, Chen Y-P, Fu S, Devlin JT, Rushworth MFS, et al. Towards understanding language organization in the brain using FMRI. Hum Brain Mapp (2003) 18:239–47. doi:10.1002/hbm.10099
12. Kaldoudi E, Williams SCR. Relaxation time measurements in NMR imgaging. Part I: longitudinal relaxation time. Concepts Magn Reson (1993) 5:217–42. doi:10.1002/cmr.1820050303
13. Kingsley PB. Methods of measuring spin-lattice (T1) relaxation times: an annotated bibliography. Concepts Magn Reson (1999) 11:243–76. doi:10.1002/(SICI)1099-0534(1999)11:4<243::AID-CMR5>3.3.CO;2-3
14. Bottomley PA, Foster TH, Argersinger RE, Pfeifer LM. A review of normal tissue hydrogen NMR relaxation times and relaxation mechanisms from 1-100 MHz: dependence on tissue type, NMR frequency, temperature, species, excision, and age. Med Phys (1984) 11:425–48. doi:10.1118/1.595535
15. Hasemi RH, Bradley WG, Lisanti CJ. MRI: The Basics. Philadelphia: Lippincott Williams & Wilkins (2004).
16. Higgins DM, Ridgway JP, Radjenovic A, Sivananthan UM, Smith MA. T1 measurement using a short acquisition period for quantitative cardiac applications. Med Phys (2005) 32:1738–46. doi:10.1118/1.1921668
17. Dass S, Suttie JJ, Piechnik SK, Ferreira VM, Holloway CJ, Banerjee R, et al. Myocardial tissue characterization using magnetic resonance non-contrast T1 mapping in hypertrophic and dilated cardiomyopathy. Circ Cardiovasc Imaging (2012) 5(6):726–33.
18. Goldfarb JW, Arnold S, Han J. Recent myocardial infarction: assessment with unenhanced T1-weighted MR imaging1. Radiology (2007) 245:245–50. doi:10.1148/radiol.2451061590
19. Messroghli DR, Greiser A, Fröhlich M, Dietz R, Schulz-Menger J. Optimization and validation of a fully-integrated pulse sequence for modified Look-Locker inversion-recovery (MOLLI) T1 mapping of the heart. J Magn Reson Imaging (2007) 26:1081–6. doi:10.1002/jmri.21119
20. Karamitsos TD, Piechnik SK, Banypersad SM, Fontana M, Ntusi NB, Ferreira VM, et al. Noncontrast T1 mapping for the diagnosis of cardiac amyloidosis. JACC Cardiovasc Imaging (2013) 6:488–97. doi:10.1016/j.jcmg.2012.11.013
21. Jellis C, Wright J, Kennedy D, Sacre J, Jenkins C, Haluska B, et al. Association of imaging markers of myocardial fibrosis with metabolic and functional disturbances in early diabetic cardiomyopathy. Circ Cardiovasc Imaging (2011) 4:693–702. doi:10.1161/CIRCIMAGING.111.963587
22. Messroghli DR, Plein S, Higgins DM, Walters K, Jones TR, Ridgway JP, et al. Human myocardium: single-breath-hold MR T1 mapping with high spatial resolution—reproducibility study. Radiology (2006) 238:1004–12. doi:10.1148/radiol.2382041903
23. Amano Y, Takayama M, Kumita S. Contrast-enhanced myocardial T1-weighted scout (Look–Locker) imaging for the detection of myocardial damages in hypertrophic cardiomyopathy. J Magn Reson Imaging (2009) 30:778–84. doi:10.1002/jmri.21921
24. Look DC, Locker DR. Time saving in measurement of NMR and EPR relaxation times. Rev Sci Instrum (1970) 41:250–1. doi:10.1063/1.1684482
25. Karlsson M, Nordell B. Analysis of the Look-Locker T1 mapping sequence in dynamic contrast uptake studies: simulation and in vivo validation. Magn Reson Imaging (2000) 18:947–54. doi:10.1016/S0730-725X(00)00193-4
26. Henderson E, McKinnon G, Lee T-Y, Rutt BK. A fast 3D Look-Locker method for volumetric T1 mapping. Magn Reson Imaging (1999) 17:1163–71. doi:10.1016/S0730-725X(99)00025-9
27. Kaptein R, Dijkstra K, Tarr CE. A single-scan Fourier transform method for measuring spin-lattice relaxation times. J Magn Reson (1969) 1976(24): 295–300.
28. Graumann R, Barfuss H, Fischer H, Hentschel D, Oppelt A. TOMROP: a sequence for determining the longitudinal relaxation time T1 in NMR. Electromedica (1987) 55:67–72.
29. Hinson WH, Sobol WT. A new method of computing spin-lattice relaxation maps in magnetic resonance imaging using fast scanning protocols. Med Phys (1988) 15:551–61. doi:10.1118/1.596206
30. Crawley AP, Henkelman RM. A comparison of one-shot and recovery methods in T1 imaging. Magn Reson Med (1988) 7:23–34. doi:10.1002/mrm.1910070104
31. Brix G, Schad LR, Deimling M, Lorenz WJ. Fast and precise T1 imaging using a TOMROP sequence. Magn Reson Imaging (1990) 8:351–6. doi:10.1016/0730-725X(90)90041-Y
32. Kay I, Henkelman RM. Practical implementation and optimization of one-shot T1 imaging. Magn Reson Med (1991) 22:414–24. doi:10.1002/mrm.1910220249
33. Gowland PA, Leach MO. Fast and accurate measurements of T1 using a multi-readout single inversion-recovery sequence. Magn Reson Med (1992) 26:79–88. doi:10.1002/mrm.1910260109
34. Been M, Smith MA, Ridgway JP, Douglas RH, de Bono DP, Best JJ, et al. Serial changes in the T1 magnetic relaxation parameter after myocardial infarction in man. Br Heart J (1988):1–8. doi:10.1136/hrt.59.1.1
35. Gowland PA, Leach MO, Sharp JC. The use of an improved inversion pulse with the Spin-Echo/inversion-recovery sequence to give increased accuracy and reduced imaging time for T1 measurements. Magn Reson Med (1989) 12:261–7. doi:10.1002/mrm.1910120215
36. Ordidge RJ, Gibbs P, Chapman B, Stehling MK, Mansfield P. High-speed multislice T1 mapping using inversion-recovery echo-planar imaging. Magn Reson Med (1990) 16:238–45. doi:10.1002/mrm.1910160205
37. Gowland P, Mansfield P. Accurate measurement of T1 in less than 3 seconds using echo-planar imaging. Magn Reson Med (1993) 30:351–4. doi:10.1002/mrm.1910300312
38. Ordidge RJ, Howseman A, Coxon R, Turner R, Chapman B, Glover P, et al. Snapshot imaging at 0.5 t using echo-planar techniques. Magn Reson Med (1989) 10:227–40. doi:10.1002/mrm.1910100207
39. Freeman AJ, Gowland PA, Mansfield P. Optimization of the ultrafast Look-Locker echo-planar imaging T1 mapping sequence. Magn Reson Imaging (1998) 16:765–72. doi:10.1016/S0730-725X(98)00011-3
40. Messroghli DR, Radjenovic A, Kozerke S, Higgins DM, Sivananthan MU, Ridgway JP. Modified Look-Locker inversion recovery (MOLLI) for high-resolution T1 mapping of the heart. Magn Reson Med (2004) 52:141–6. doi:10.1002/mrm.20110
41. Gai N, Turkbey EB, Nazarian S, van der Geest RJ, Liu CY, Lima JA, et al. T1 mapping of the gadolinium-enhanced myocardium: adjustment for factors affecting interpatient comparison. Magn Reson Med (2011) 65:1407–15. doi:10.1002/mrm.22716
42. Messroghli DR, Niendorf T, Schulz-Menger J, Dietz R, Friedrich MG. T1 mapping in patients with acute myocardial infarction. J Cardiovasc Magn Reson (2003) 5:353–9. doi:10.1081/JCMR-120019418
43. Messroghli DR, Walters K, Plein S, Sparrow P, Friedrich MG, Ridgway JP, et al. Myocardial T1 mapping: application to patients with acute and chronic myocardial infarction. Magn Reson Med (2007) 58:34–40. doi:10.1002/mrm.21272
44. Sibley CT, Noureldin RA, Gai N, Nacif MS, Liu S, Turkbey EB, et al. T1 mapping in cardiomyopathy at cardiac MR: comparison with endomyocardial biopsy. Radiology (2012) 256:724–32. doi:10.1148/radiol.12112721
45. Bull S, White SK, Piechnik SK, Flett AS, Ferreira VM, Loudon M, et al. Human non-contrast T1 values and correlation with histology in diffuse fibrosis. Heart (2013) 99:923–7. doi:10.1136/heartjnl-2012-303052
46. Nacif MS, Turkbey EB, Gai N, Nazarian S, van der Geest RJ, Noureldin RA, et al. Myocardial T1 mapping with MRI: comparison of Look-Locker and MOLLI sequences. J Magn Reson Imaging (2011) 34:1367–73. doi:10.1002/jmri.22753
47. Lima JA, Jeremy R, Guier W, Bouton S, Zerhouni EA, McVeigh E, et al. Accurate systolic wall thickening by nuclear magnetic resonance imaging with tissue tagging: correlation with sonomicrometers in normal and ischemic myocardium. J Am Coll Cardiol (1993) 21:1741–51. doi:10.1016/0735-1097(93)90397-J
48. Forbat SM, Karwatowski SP, Gatehouse PD, Firmin DN, Longmore DB, Underwood SR. Rapid measurement of left ventricular mass by spin echo magnetic resonance imaging. Br J Radiol (1994) 67:86–90. doi:10.1259/0007-1285-67-793-86
49. Aurigemma G, Davidoff A, Silver K, Boehmer J, Pattison N. Left ventricular mass quantitaton using single-phase cardiac magnetic resonance imaging. Am J Cardiol (1992) 70:259–62. doi:10.1016/0002-9149(92)91285-C
50. Solano JP, Gomes B, Higginson IJ. A comparison of symptom prevalence in far advanced cancer, AIDS, heart disease, chronic obstructive pulmonary disease and renal disease. J Pain Symptom Manage (2006) 31:58–69. doi:10.1016/j.jpainsymman.2005.06.007
51. Piechnik S, Ferreira V, Lewandowski A, Ntusi NA, Banerjee R, Holloway C, et al. Normal variation of magnetic resonance T1 relaxation times in the human population at 1.5 T using ShMOLLI. J Cardiovasc Magn Reson (2013) 15:13. doi:10.1186/1532-429X-15-13
52. Piechnik SK, Ferreira VM, Dall’Armellina E, Cochlin LE, Greiser A, Neubauer S, et al. Shortened Modified Look-Locker Inversion recovery (ShMOLLI) for clinical myocardial T1-mapping at 1.5 and 3 T within a 9 heartbeat breathhold. J Cardiovasc Magn Reson (2010) 12:69. doi:10.1186/1532-429X-12-69
53. Ferreira V, Piechnik S, Dall’Armellina E, Karamitsos TD, Francis JM, Choudhury RP, et al. Non-contrast T1-mapping detects acute myocardial edema with high diagnostic accuracy: a comparison to T2-weighted cardiovascular magnetic resonance. J Cardiovasc Magn Reson (2012) 14:42. doi:10.1186/1532-429X-14-42
54. Cameron IL, Ord VA, Fullerton GD. Characterization of proton NMR relaxation times in normal and pathological tissues by correlation with other tissue parameters. Magn Reson Imaging (1984) 2:97–106. doi:10.1016/0730-725X(84)90063-8
55. Puntmann VO, Voigt T, Chen Z, Mayr M, Karim R, Rhode K, et al. Native T1 mapping in differentiation of normal myocardium from diffuse disease in hypertrophic and dilated cardiomyopathy. JACC: Cardiovascular Imaging (2013) 6:475–84. doi:10.1016/j.jcmg.2012.08.019
56. Wacker CM, Bock M, Hartlep AW, Beck G, van Kaick G, Ertl G, et al. Changes in myocardial oxygenation and perfusion under pharmacological stress with dipyridamole: assessment using T*2 and T1 measurements. Magn Reson Med (1999) 41:686–95. doi:10.1002/(SICI)1522-2594(199904)41:4<686::AID-MRM6>3.3.CO;2-0
57. Sebastian J, Flacke SEF, Christine H. Lorenz measurement of the gadopentetate dimeglumine partition coefficient in human myocardium in vivo: normal distribution and elevation in acute and chronic infarction. Radiology (2001) 218:703–10. doi:10.1148/radiology.218.3.r01fe18703
58. Messroghli DR, Greiser A, Frohlich M, Dietz R, Schulz-Menger J. Optimization and validation of a fully-integrated pulse sequence for modified Look-Locker inversion-recovery (MOLLI) T1 mapping of the heart. J Magn Reson Imaging (2007) 26:1081–6. doi:10.1002/jmri.21119
59. Sparrow P, Messroghli DR, Reid S, Ridgway SP, Bainbridge G, Sivanthan MU. Myocardial T1 mapping for detection of left ventricular myocardial fibrosis in chronic aortic regurgitation: pilot study. AJR Am J Roentgenol (2006) 187:630–5. doi:10.2214/AJR.05.1264
60. Li D, Dhawale P, Rubin PJ, Haacke EM, Gropler RJ. Myocardial signal response to dipyridamole and dobutamine: demonstration of the BOLD effect using a double-echo gradient-echo sequence. Magn Reson Med (1996) 36:16–20. doi:10.1002/mrm.1910360105
61. Reeder SB, Faranesh AZ, Boxerman JL, McVeigh ER. In vivo measurement of T2 star and field inhomogeneity maps in the human heart at 1.5 T. Magn Reson Med (1998) 39:988–98. doi:10.1002/mrm.1910390617
62. Anderson LJ, Holden S, Davis B, Prescott E, Charrier CC, Bunce NH, et al. Cardiovascular T2-star (T2*) magnetic resonance for the early diagnosis of myocardial iron overload. Eur Heart J (2001) 22:2171–9. doi:10.1053/euhj.2001.2822
63. Positano V, Pepe A, Santarelli MF, Scattini B, De Marchi D, Ramazzotti A, et al. Standardized T2* map of normal human heart in vivo to correct T2* segmental artefacts. NMR Biomed (2007) 20:578–90. doi:10.1002/nbm.1121
64. Messroghli DR, Wassmuth R, Zagrosek A, Rudolph A, Schulz-Menger J. Assessment of myocardial T2* from pixel-by-pixel maps on a clinical MR system. J Cardiovasc Magn Reson (2008) 10(Suppl 1):A240. doi:10.1186/1532-429X-10-S1-A240
65. Moon JC, Messroghli DR, Kellman P, Piechnik SK, Robson MD, Ugander M, et al. Myocardial T1 mapping and extracellular volume quantification: a Society for Cardiovascular Magnetic Resonance (SCMR) and CMR Working Group of the European Society of Cardiology consensus statement. J Cardiovasc Magn Reson (2013) 15:92. doi:10.1186/1532-429X-15-92
66. Thuny F, Potton L, Rapacchi S, Thibault H, Bergerot C, Viallon M, et al. Myocardial T1-mapping for early detection of left ventricular myocardial fibrosis in systemic sclerosis. J Cardiovasc Magn Reson (2011) 13(Suppl 1):M10.
67. Thibault H, Ernande L, Rapacchi S, Viallon M, Bergerot C, Thuny F, et al. Early detection of myocardial fibrosis in type II diabetic patients using MR T1-mapping. J Cardiovasc Magn Reson (2011) 13(Suppl 1):O110. doi:10.1186/1532-429X-13-S1-O110
68. Ellims AH, Iles LM, Ling LH, Chong B, Macciocca I, Slavin GS, et al. A comprehensive evaluation of myocardial fibrosis in hypertrophic cardiomyopathy with cardiac magnetic resonance imaging: linking genotype with fibrotic phenotype. Eur Heart J Cardiovasc Imaging (2014) 15(10):1108–16. doi:10.1093/ehjci/jeu077
69. Kammerlander AA, Marzluf BA, Zotter-Tufaro C, Aschauer S, Duca F, Bachmann A, et al. T1 mapping by CMR imaging from histological validation to clinical implication. JACC Cardiovasc Imaging (2016) 9(1):14–23. doi:10.1016/j.jcmg.2015.11.002
70. Sibley CT, Noureldin RA, Gai N, Nacif MS, Liu S, Turkbey EB, et al. T1 mapping in cardiomyopathy at cardiac MR: comparison with endomyocardial biopsy. Radiology (2012) 265(3):724–32. doi:10.1148/radiol.12112721
Keywords: T1 mapping, cardiac magnetic resonance, MRI, relaxometry, cardiovascular imaging
Citation: Hamilton-Craig CR, Strudwick MW and Galloway GJ (2017) T1 Mapping for Myocardial Fibrosis by Cardiac Magnetic Resonance Relaxometry—A Comprehensive Technical Review. Front. Cardiovasc. Med. 3:49. doi: 10.3389/fcvm.2016.00049
Received: 10 June 2016; Accepted: 24 November 2016;
Published: 16 March 2017
Edited by:
Joseph B. Selvanayagam, Flinders University, AustraliaReviewed by:
Gaetano Nucifora, South Australian Health and Medical Research Institute, AustraliaDiego Bellavia, Istituto Mediterraneo per i Trapianti e Terapie ad Alta Specializzazione, Italy
Copyright: © 2017 Hamilton-Craig, Strudwick and Galloway. This is an open-access article distributed under the terms of the Creative Commons Attribution License (CC BY). The use, distribution or reproduction in other forums is permitted, provided the original author(s) or licensor are credited and that the original publication in this journal is cited, in accordance with accepted academic practice. No use, distribution or reproduction is permitted which does not comply with these terms.
*Correspondence: Christian R. Hamilton-Craig, Yy5oYW1pbHRvbmNyYWlnQHVxLmVkdS5hdQ==
 Christian R. Hamilton-Craig
 Mark W. Strudwick
 Graham J. Galloway