 R. Craig Herndon
- Hillman Cancer Center, Radiation Oncology, University of Pittsburgh Medical Center, Williamsport, PA, United States
Introduction: Functional information transmission through a complex biological system is introduced as a method for biological response (bioresponse) adaptation using qualified biological marker (biomarker) data.
Methods: This information guided adaptation methodology traverses the series of complex connections, defined by disparate bioresponse and biomarkers data sets, by placing both data sets on the common platiorm defined by information. The absolute uncertainty associated with these data sets can be defined in terms of decimal digits of information. This relationship between the data’s absolute uncertainty and its information entropy is used to decompose information entropy into functional and relative uncertainty components, where the functional component quantifies the function or meaning of a data set in units of information.
Results: Application of functional information to adapt patient medical treatments using the information values for the bioresponse model and the biomarker model are outlined in detail and presented tabularly.
Discussion: Functional information provides a mathematical connection between a bioresponse model and a biomarker model by quantifying both data sets in the units of information and thereby providing the means to implement precision therapeutic plans by quantitatively adapting patient treatments using their biomarker measurements.
1 Introduction
The human body is the quintessential complex system with its multiple interacting heterogeneous components that display emergent macro-level behavior due to multiple non-linear interconnections that are typically unknown and inseparable, and therefore cannot be modeled (Johnson, 2006; Sheard and Mostashari, 2009; Earl and Nicholson, 2021; San Miguel, 2023). Medical diagnosis of the bodies’ biological response (bioresponse) to disease and treatment based on biological markers (biomarkers) is an effective method for understanding, treating, and managing complex disease processes (National Cancer Institute). Understanding the complexity inherent in cancer progression presents a profound challenge to researchers and is being actively investigated through the application of biomarkers in the field known as precision medicine (Chatterjee and Zetter, 2005). Precision medicine is a methodology that uses patient information to understand and manage the health of the complex biological system that is the human body.
Precision medicine uses patient information about their genes or proteins to prevent, diagnose, or treat their disease (National Cancer Institute). The prominence of precision medicine has increased in recent years because of advances in basic research areas including molecular biology, genomics, and bioinformatics (Collins and Varmus, 2015). These advances have enabled more precise targeting of subgroups of disease with new therapies (Ashley, 2016). The intrinsic link between precision medicine and biomarkers is illustrated by the Precision Medicine Initiative (PMI) launched by the US National Institutes of Health (NIH) with the goal of improving health care by combining clinical data and multi-omic biomarker measurements on a large scale (Vargas and Harris, 2016; Olivier et al., 2019). Multi-omics combines multiple omic data sets, (e.g., genomics, epigenomics, transcriptomics, proteomics, metagenomics), during data analysis to determine the mechanism of a biological process (Kim et al., 2012; Urbanowicz et al., 2018; Krassowski et al., 2020; Momeni et al., 2020; Peng et al., 2020; Shi et al., 2021). This paper extends the application of information to the PMI goal of incorporating a patients’ bioresponse and biomarker data into the planning, execution, and adaptation of their treatments during their prescribed course of therapy. This is accomplished by placing both the bioresponse and the biomarker data in the same analytic data space through the conversion of both data sets into functional information, i.e., all data are analyzed in the units of information. Thus, biomarker data can be fed directly back into bioresponse models to adapt patient therapies based on the patient’s current biological profile.
Information-theoretic analysis began 75 years ago when Claude Shannon presented a mathematical measure of the amount of information that can be transmitted over a potentially noisy communication channel (Shannon, 1948). This mathematical theory optimizes the transmission of message data by quantifying how many bits of information are contained in the message, however, it does not determine if the data have meaning. This is termed the semantic problem because two messages can have identical information even though one message has meaning, and the other is nonsense (Weaver). Applications of information entropy in biomedical informatics include semantics, genetic selection, feature selection, and biomarkers (Li et al., 2004; Cohen and Widdows, 2009; Saha et al., 2009; Liu et al., 2010; Bolón-Canedo et al., 2014; Chen et al., 2017; Sato and Akimoto, 2017; Bakal et al., 2018; Jadon, 2020). Recently, through the application of measurement theory, the definition of information has been extended beyond the data streams associated with communications to include functional data associated with curves and graphs thus quantifying data meaning in terms of information bits (Herndon, 2022). The absolute uncertainty associated with measured data, in the form y = f(x), has been defined in terms of real-valued decimal digits (dits) of information (Herndon, 2017; 2021). This relationship is used to decompose information into functional and relative uncertainty components, where the functional component quantifies the function or meaning of a process data set, y = f(x), in units of information (Herndon, 2022).
Functional information, If, offers an unprecedented way to quantify system response when using surrogate measurements to assess system status. A biological system response, or bioresponse, model characterizes system response to an event, but if it is not measurable then a surrogate biological system measurement, or biomarker, is used because it is an objective indicator of the bioresponse to a therapeutic intervention (Strimbu and Tavel, 2010; Califf, 2018). The biomarker contains no parametric data from the system model and cannot be used to calculate the bioresponse status. Functional information removes this constraint between bioresponses and biomarkers by quantifying a value for the number of information-carrying decimal digits (dits) in each data set, thus providing a common space for analysis. Bioresponse will be adapted using functional information, IS, acquired from the bioresponse function, S, and functional information, IV, acquired using a biomarker function, V.
Applications of this method include individualizing patient drug dosages based on their molecular profiles. This could be as routine as adapting an antibiotic drug prescription to fight a specific infection based on a patient’s blood test or as specialized as prescribing immunotherapy uniquely to each patient’s disease. Functional information is used to create the mathematical machinery that permits ongoing adaptative therapy during a patient’s treatment course.
2 Materials and methods
2.1 Functional information
Separation of Shannon information entropy, H, into functional (meaningful) and relative uncertainty (noisy) information components has been mathematically developed and presented (Herndon, 2022). Functional information forms the mathematical basis for the adaptation methodology which is the focus of the paper. Therefore, functional information is reviewed first, then the information guided adaptation methodology is presented, following by applications to demonstrate the range of the method’s applicability and provide a detailed outline of the process.
Quantization uncertainty associated with the data measurement process was linked to the information associated with the function that maps to the measured data (Herndon, 2017; 2021). Information associated with measured data is defined in terms of the data’s real-valued decimal digit (dits) or binary digit (bits) accuracy and is based on the absolute uncertainty of the data set. Real-valued digit accuracy, q, is the number of dits, or bits, required to describe each data point, i.e., the real-valued digit accuracy, q, is equivalent to the Shannon information, h, associated with each data point (q = h) (Herndon, 2017; 2021). A relationship between data uncertainty and information is obtained and used to decompose the information entropy, H, into functional, If, and relative uncertainty, Iu, information components (Herndon, 2022). The functional information component, If, quantifies mathematical model data, f(x), into a value in the units of information that describes the entire function.
The exponential, y (Figure 1A), illustrates a data set acquired with m equiprobable measurements. The exponential function, ubiquitous in nature, graphically illustrates the useful transition from measurement data to uncertainty data that is detailed below (Figures 1B, C). Information entropy, H (Eq. 1), is the average of a data set’s information components, h, when determined from these m equiprobable measurements (Cover and Thomas, 2006; Stone, 2015; Çengel, 2021).
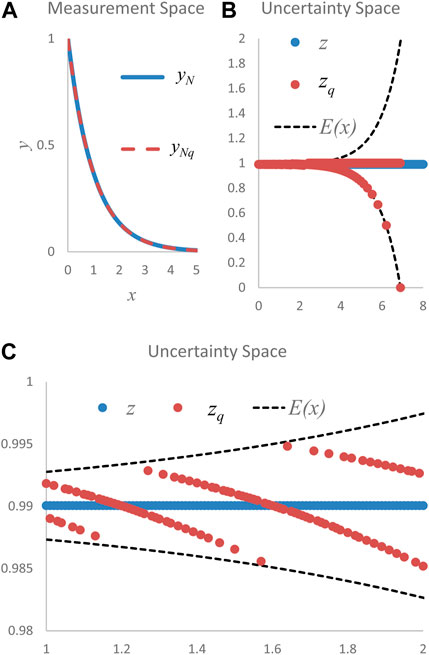
FIGURE 1. (A). Measurement space normalized exponential data, yN = f(x)N = exp(-x)N, and quantized normalized exponential data, yN,q, are graphically indistinguishable (B). Differences between uncertainty space data, z (straight line of blue dots) and zq (spread of orange dots), calculated using normalized data, yN, and normalized quantized (q = 3) measurement space data, yN,q, are apparent. The envelope function, E(x), provides an upper and lower boundary for the quantized data, zq (C). A zoomed closeup of uncertainty space shows all quantized points, zq (orange data points), are contained within the envelope and illustrates that the spread of the envelope defines the spread of the data, zq. All zq data points are single valued for each input value of x. Note that the ideal, or unquantized uncertainty data, z (blue data points), have no spread.
Data constituting this exponential function have information components, h, that are defined in terms of the data’s real-valued digit accuracy and are determined in uncertainty space (Herndon, 2017; 2021). Measured data in the form, y = f(x), are transformed from measurement space data, y, into uncertainty space data, z, by the γ operation in Eq. 2 (Figure 1B). Data, y, are normalized (subscript N), yN, before transformation to uncertainty space data. Normalizing refers to preprocessing steps necessary to ensure all data values range from zero to one while maintaining the form of the measured data. After normalization, the data are quantized (subscript q) to the whole number that corresponds to the integer-valued digit accuracy of the measured data (Herndon, 2017). Uncertainty space data, zq, determined by the γ operation, are defined by the sequence, zq (Eq. 2), where ur is the data’s relative uncertainty (Figure 1B). Unquantized uncertainty space data, z, is ideal and therefore is not quantized and produces no data spread (z plotted as blue dots in Figures 1B, C).
There is also an envelope function, E(x) (Eq. 3), in uncertainty space (Figures 1B, C) that is characterized by the normalized function, yN = f(x)N, and the information component, h, which was defined by the real-valued digit accuracy, q (Herndon, 2017; 2021).
An equivalency exists in uncertainty space (Eq. 4) between the relative uncertainty, ur, associated with the spread of the data, zq, and the spread of the envelope function, E(x) (Herndon, 2017; 2021; 2022).
The equivalency of Eq. 4 is illustrated graphically in Figure 1B where the spread of the uncertainty space data, zq, is bounded by the spread of the envelope function, E(x), which is further demonstrated in the closeup of Figure 1C; Eq. 4 is used to decompose the information entropy, H, into separate components that quantify data function (f(x)N) information, If, and the data relative uncertainty (ur) information, Iu (Eq. 5) (Herndon, 2022).
Information, If, quantifies a value for the number of functional information-carrying real-valued decimal digits (dits) in a data set by determining the average of all individual data point functional information values, i (Eq. 6) (Herndon, 2022). This deterministic value, If, assigns meaning to the model function, f(x), in terms of information, thus any function can be identified in terms of information. Functional information becomes the common platform for comparison of data sets that were previously considered disparate.
Next, the information formulation for adapting bioresponses using biomarkers, based on Eq. 6, is presented.
2.2 Information guided adaptation methodology
An event, x, acts upon a complex biological system and causes a response or effect, S, that can be as modeled by S = f1(x). Typically, this biological system response model or bioresponse, S = f1(x), cannot be directly measured, so a valid surrogate biological system marker model or biomarker, V, is measured to obtain an indirect quantification of system response (Strimbu and Tavel, 2010; Califf, 2018). If the mathematical chain of intermediate functions, Ci (Eq. 7), connecting the biological system response, S, to the biomarker response, V, were known, then a cause-effect feedback mechanism based upon calculated and measured biomarker units would be available for adaptive therapies. However, this functional chain is unknown which means the input, Cn-1, to the biomarker, V, is unknown, therefore biomarker data is measured against an appropriate independent variable, y (Eq. 8), and modeled by function g.
The bioresponse and biomarker models, S = f(x) and V = g(y), must be used to analyze the system since the chain of models represented by f2 → fn in Eq. 7) are not available in complex biological systems. The formula used to relate bioresponse and biomarker information, IS and IV, is determined from the informational relationship between a function’s current state, f, and its adapted state,
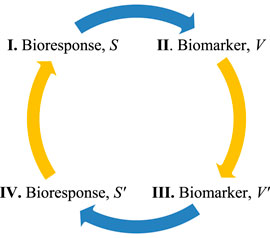
FIGURE 2. Information cycle, I-IV, used to adapt bioresponse data to biomarker-specified changes. Functional information can cross the knowledge gap represented by the blue arrows and permit changing the bioresponse model, S, using the adapted biomarker data, V’.
Functional information can be used to adapt treatments using measured outcomes because information is transmitted through the complex connections forming the bioresponse/biomarker system (illustrated by the blue arrows in Figure 2). Biomarkers must be investigator qualified as legitimate surrogates of the bioresponse to minimize uncertainties when modeling information flow through a biological system (Eq. 9). Next, the adapted bioresponse information (Eq. 9) will be used to determine the bioresponse input, x, that is necessary to adapt the bioresponse to the desired goal, i.e., a linear relationship, based on information, is used to solve a previously intractable nonlinear problem. A functional bioresponse-biomarker chain, based on process (7), will be synthesized to demonstrate that the mathematical foundation provided by functional information (Eq. 6) can be successfully applied to bioresponse/biomarker models (Eq. 9).
3 Results and discussion
3.1 Adaptation process outline
Exponential and power/polynomial examples are presented to demonstrate the range of functional groups applicable to the adaptation formulation developed in Section 2.2. For example, the adaptation formula (Eq. 9) robustly applies across exponential bioresponse models regardless of parametric changes to the models. Robustness is quantified by determining whether the information criterion
The implementation process is outlined to show how functional information is transmitted through the complex connections of a bioresponse/biomarker system and can be used to adapt bioresponses using biomarker measurements. Adaptation of the bioresponse using biomarker information will be demonstrated using different sets of models based on the exponential, power, and polynomial functions. Exponential functions are used primarily because of their natural ubiquity in the biological sciences and power/polynomial functions are selected to demonstrate the flexibility of this methodology. These example applications demonstrate that information transferred through a complex biological system can be leveraged for adaptation purposes (Eq. 9).
The process of information flow from bioresponse, S, to biomarker, V, (Eq. 7), will be synthesized to demonstrate the utility of applied functional information. Information flow described in Eq. 9 can be visualized in the information cycle in Figure 2, where information is the mechanism that creates the bioresponse-biomarker data connection. Application of this information cycle begins with synthesizing a composition of functions that connects step I and II. Input changes in the bioresponse model, S, will automatically propagate to changes in the biomarker model, V. Next, the biomarker data of II will be modeled independently and then changed to affect the desired response (III). At step III the adapted biomarker data, V′, does not equal the biomarker data of step II, V′ ≠ V. Information determined from steps I-III are then used to determine the adapted bioresponse information, IS′ (Eq. 9), in step IV. This information, IS′, is then used to determine the adapted input to the next iteration of the cycle (step I). If the adaptive information formula (Eq. 9) is valid then the next iteration of biomarker data, V, in step II will equal the previous adapted biomarker data of step III, i.e., V = V′ verifying the method. Equivalently, if functional information adaptation is viable, the next cycle of biomarker functional information (II) will equal the previous adapted biomarker functional information (III), i.e.,
Step I and II of Figure 2 and the processes connecting them are modeled by the composition of functions (Eq. 10) that automatically calculate the current biomarker, V, from the current bioresponse, S. This synthetic process is a simplified version of Eq. 7, where the bioresponse is modeled as
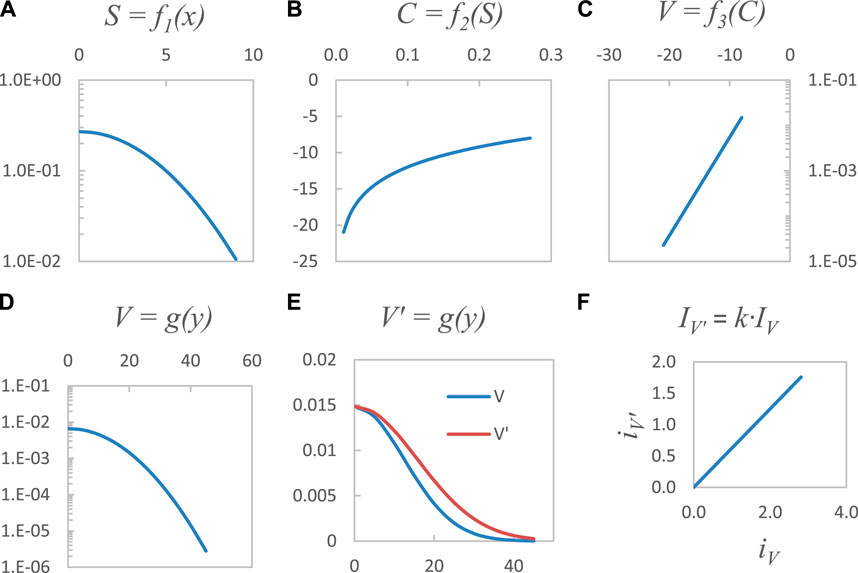
FIGURE 3. The functional composition
This biomarker data, V, is then independently modeled following Eq. 8, where
3.2 Adaptation process details
Application of the information adaptation Formula 9 presented in the following steps uses exponential data for the bioresponse and biomarker models. The models and the example parameters are listed in the steps below and in Table 1.
1) The bioresponse model is
2) Biomarker data, V, is automatically determined by the function composition
a) Biomarker data, V, is modeled in linear increments of the independent variable, y, simulating the laboratory environment where the function V = f3(C) is unknown. The investigator now has biomarker data in terms of the function
3) Current biomarker data, V, is adapted to the investigator’s achievable goal, V′ using the model
a) The parametric change, d1 = 0.0032 to d1′ = 0.002, results in a change in biomarker information from IV = 0.9902 dits to IV′ = 0.6189 dits.
i) Linearity between the biomarker and adapted biomarker information,
4) The information adaptation formula (Eq. 9) is used to determine the adapted information value, IS′, for the adapted state of the bioresponse model, S′. Step IV (Figure 2).
a) The adapted bioresponse information value, IS′ = 0.3094 dits (Table 1C), is determined using the initial bioresponse information, IS, the initial biomarker information, IV, and the adapted biomarker information, IV′, from Tables 1A, B (IS = 0.4951 dits, IV = 0.9902 dits, and IV′ = 0.6189 dits) and Eq. 9.
5) Finally, the parameter-of-interest, a2 = 0.04, is iteratively adjusted to a2′ = 0.025 until the next cycle of bioresponse information, IS, is equal to the target value, IS′ = 0.3094 dits. The cycle begins again at Step I by setting a2 = a2′, and calculating the next iteration of biomarker data, V. If this current iteration of biomarker data equals the adapted biomarker data, V′, of Step IV (from #4 above), then the adaptation process is finished. An alternate method to determine if adaptation is finished occurs when there is an equivalency between the new cycle of biomarker information, IV = 0.6189 dits (Table 1C), and the adapted biomarker information, IV′ (Table 1B).
a) Adaptation of a complex biological system based on functional information has been demonstrated when
6) The application process outlined above in steps 1–5 is applied to a power function model, where the bioresponse model,
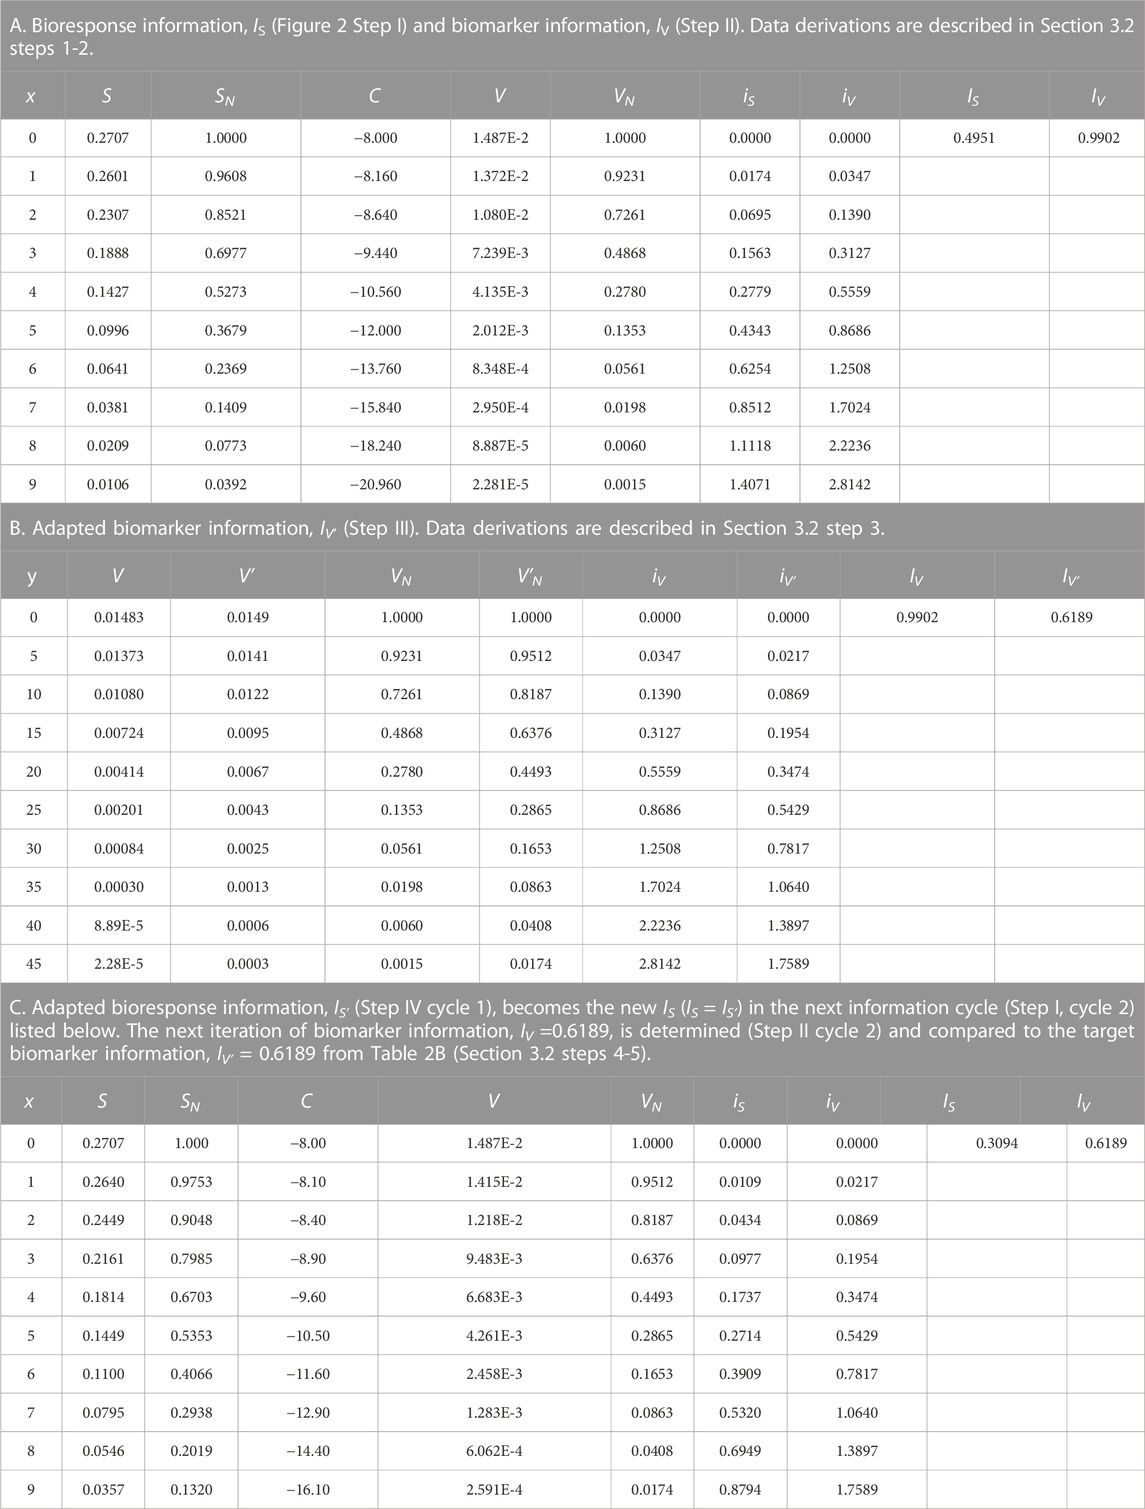
TABLE 1. Exponential function application data.
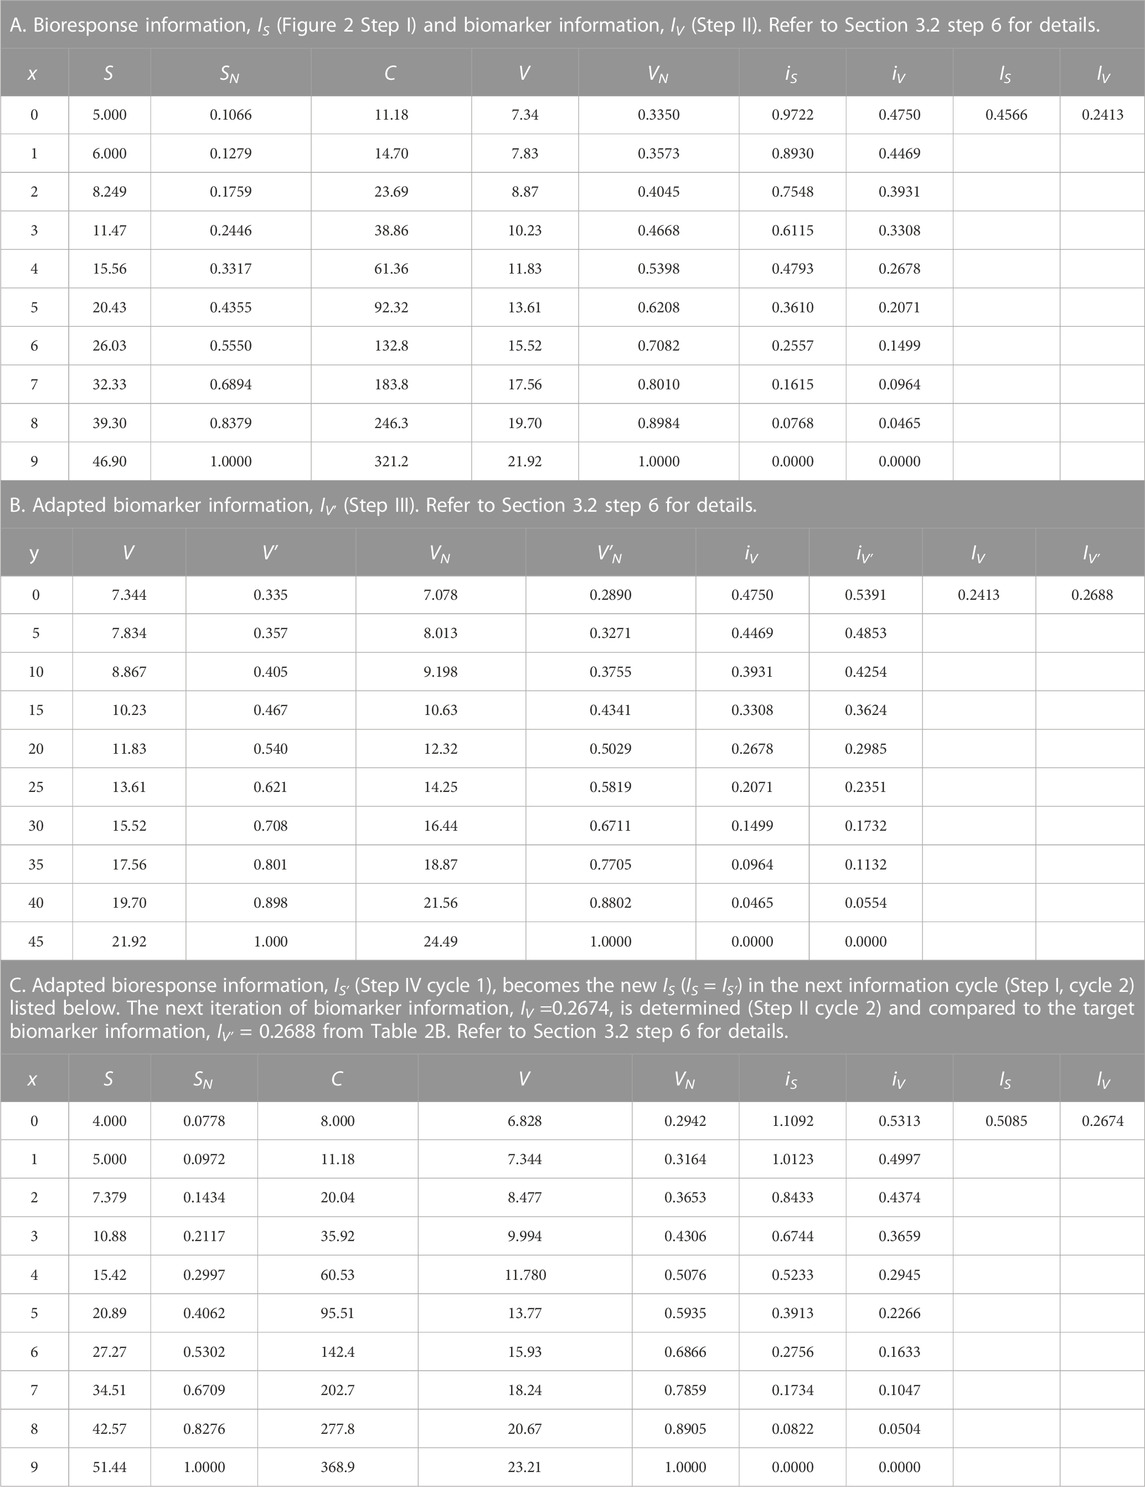
TABLE 2. Power/Polynomial function application data.
Functional information transmission through the complexities of the bioresponse/biomarker relationship provides a mechanism for precision medicine. Application to precision medicine has been demonstrated using the reproducible processes outlined and detailed in Section 3.1, Section 3.2. The adaptation formulation (Eq. 9) is applicable to a range of bioresponse, S = f(x), and biomarker, V = g(y), models including exponential-based and power/polynomial-based models. Adaptation is performed at the fundamental level of information where the effect the prescribed therapy has on the patient is analyzed in the same units (dits) as the patient’s measured outcomes. This information foundation permits quantitative adaptions of individual patient treatment responses based on changes defined by the patients’ biomarker measurements. Functional information assists current efforts in the bioinformatics community to classify and verify candidate biomarkers (Shin et al., 2008; Wang et al., 2009; Ganchev et al., 2011; Asgari et al., 2018; Liu and Gao, 2018; Yaghoobi et al., 2021; Ding et al., 2023; Nazari and Zinati, 2023). Information guided precision medicine also provides a mechanism for solving inherently complex biological problems like those encountered in the active research areas of targeted and adaptive oncology therapies (Sawyers, 2004; Aggarwal, 2010; Baudino, 2015; Padma, 2015; Wang et al., 2007; Bhullar et al., 2018; Yang et al., 1038; Zhong et al., 2021; Gatenby et al., 2009; Pazarentzos and Bivona, 2015; Neri et al., 2007). Oncology applications are emphasized because it is the focus of the NIH PMI, however, information-guided analysis is broadly applicable to any functional analysis of signal data.
4 Conclusion
Functional information’s mathematical origin in metrology has been presented and applied to complex biological systems by adapting bioresponses using biomarker information. Information-guided analysis is directly applicable to the bioresponse/biomarker relationships found in immunotherapy, chemotherapy, and radiotherapy and is extensible within the health sciences to include bioinformatics and computational biology. In addition, it has application to systems engineering where it provides a feedback mechanism for complex control systems. Functional information also impacts basic sciences because it defines the wave function in units of information.
Functional information guided adaptation of complex biological systems has been introduced as a promising analytic tool for investigators in the growing field of precision medicine. Information guided analysis of complex oncological processes will augment ongoing research efforts by combining information from the collective knowledge of oncology researchers in support of the near-term focus on cancer research established by the NIH Precision Medicine Initiative (PMI). Generally, functional information has potential application in any research area where signal function analysis is relevant.
Data availability statement
The original contributions presented in the study are included in the article/Supplementary material, further inquiries can be directed to the corresponding author.
Author contributions
The author confirms being the sole contributor of this work and has approved it for publication.
Conflict of interest
The authors declare that the research was conducted in the absence of any commercial or financial relationships that could be construed as a potential conflict of interest.
Publisher’s note
All claims expressed in this article are solely those of the authors and do not necessarily represent those of their affiliated organizations, or those of the publisher, the editors and the reviewers. Any product that may be evaluated in this article, or claim that may be made by its manufacturer, is not guaranteed or endorsed by the publisher.
Supplementary material
The Supplementary Material for this article can be found online at: https://www.frontiersin.org/articles/10.3389/fcpxs.2023.1208066/full#supplementary-material
References
Asgari, Y., Khosravi, P., Zabihinpour, Z., and Habibi, M. (2018). Exploring candidate biomarkers for lung and prostate cancers using gene expression and flux variability analysis. Integr. Biol. 10 (2), 113–120. doi:10.1039/c7ib00135e
Ashley, E. A. (2016). Towards precision medicine. Nat. Rev. Genet. 17 (9), 507–522. doi:10.1038/nrg.2016.86
Aggarwal, S., “Targeted cancer therapies,” Nat. Rev. Drug Discov., vol. 9, no. 427, 428. doi:10.1038/nrd31866, 2010.
Bakal, G., Talari, P., Kakani, E. V., and Kavuluru, R. (2018). Exploiting semantic patterns over biomedical knowledge graphs for predicting treatment and causative relations. J. Biomed. Inf. 82, 189–199. doi:10.1016/j.jbi.2018.05.003
Baudino, T. A. (2015). Targeted cancer therapy: The next generation of cancer treatment. Curr. Drug Discov. Technol. 12 (1), 3–20. doi:10.2174/1570163812666150602144310
Bhullar, K. S., Lagarón, N. O., McGowan, E. M., Parmar, I., Jha, A., Hubbard, B. P., et al. (2018). Kinase-targeted cancer therapies: Progress, challenges and future directions. Mol. Cancer 17, 48–20. doi:10.1186/s12943-018-0804-2
Bolón-Canedo, V., Sánchez-Marono, N., Alonso-Betanzos, A., Benítez, J. M., and Herrera, F. (2014). A review of microarray datasets and applied feature selection methods. Inf. Sci. 282, 111–135. doi:10.1016/j.ins.2014.05.042
Califf, R. M. (2018). Biomarker definitions and their applications. Exp. Biol. Med. 243 (3), 213–221. doi:10.1177/1535370217750088
Çengel, Y. A., “On entropy, information, and conservation of information,” Entropy, vol. 23, no. 6, 779, 2021.
Chatterjee, S. K., and Zetter, B. R. (2005). Cancer biomarkers: Knowing the present and predicting the future. Future Oncol. 1 (1), 37–50. doi:10.1517/14796694.1.1.37
Chen, Y., Zhang, Z., Zheng, J., Ma, Y., and Xue, Y. (2017). Gene selection for tumor classification using neighborhood rough sets and entropy measures. J. Biomed. Inf. 67, 59–68. doi:10.1016/j.jbi.2017.02.007
Cohen, T., and Widdows, D. (2009). Empirical distributional semantics: Methods and biomedical applications. J. Biomed. Inf. 42 (2), 390–405. doi:10.1016/j.jbi.2009.02.002
Collins, F. S., and Varmus, H. (2015). A new initiative on precision medicine. N. Engl. J. Med. 372 (9), 793–795. doi:10.1056/nejmp1500523
Cover, T. M., and Thomas, J. A. (2006). Elements of information theory. 2nd. Hoboken, NJ, USA: John Wiley and Sons.
Ding, Y., Lei, X., Liao, B., and Wu, F. X. (2023). Biomarker identification via a factorization machine-based neural network with binary pairwise encoding. IEEE/ACM Trans. Comput. Biol. Bioinforma. 20, 2136–2146. doi:10.1109/tcbb.2023.3235299
Earl, R., and Nicholson, J. (2021). The concise oxford dictionary of mathematics. Oxford, England: Oxford University Press.
Ganchev, P., Malehorn, D., Bigbee, W. L., and Gopalakrishnan, V. (2011). Transfer learning of classification rules for biomarker discovery and verification from molecular profiling studies. J. Biomed. Inf. 44, S17–S23. doi:10.1016/j.jbi.2011.04.009
Gatenby, R. A., Silva, A. S., Gillies, R. J., and Frieden, B. R. (2009). Adaptive therapy. Cancer Res. 69 (11), 4894–4903. doi:10.1158/0008-5472.can-08-3658
Herndon, R. C. (2022). Data entropy decomposition into functional and uncertainty components. Measurement 188, 110541.
Herndon, R. C. (2021). Determining signal entropy in uncertainty space. Measurement 178, 109336. doi:10.1016/j.measurement.2021.109336
Herndon, R. C. (2017). Measurement analysis in uncertainty space. Measurement 105, 106–113. doi:10.1016/j.measurement.2017.04.012
Jadon, Shruti. (2020). “A survey of loss functions for semantic segmentation,” in Proceedings of the IEEE Conference on Computational Intelligence in Bioinformatics and Computational Biology (CIBCB), Via del Mar, Chile, December 2020, 1–7.
Johnson, C. W. (2006). What are emergent properties and how do they affect the engineering of complex systems? Reliab. Eng. Syst. Saf. 91 (12), 1475–1481. doi:10.1016/j.ress.2006.01.008
Kim, D., Shin, H., Song, Y. S., and Kim, J. H. (2012). Synergistic effect of different levels of genomic data for cancer clinical outcome prediction. J. Biomed. Inf. 45 (6), 1191–1198. doi:10.1016/j.jbi.2012.07.008
Krassowski, M., Das, V., Sahu, S. K., and Misra, B. B. (2020). State of the field in multi-omics research: From computational needs to data mining and sharing. Front. Genet. 11, 610798. doi:10.3389/fgene.2020.610798
Li, Haifeng, Zhang, Keshu, and Jiang, Tao (2004). “Minimum entropy clustering and applications to gene expression analysis,” in Proceedings. 2004 IEEE Computational Systems Bioinformatics Conference, Stanford, CA, USA, August 2004, 142–151.
Liu, H., Liu, L., and Zhang, H. (2010). Ensemble gene selection by grouping for microarray data classification. J. Biomed. Inf. 43 (1), 81–87. doi:10.1016/j.jbi.2009.08.010
Liu, Z. P., and Gao, R. (2018). Detecting pathway biomarkers of diabetic progression with differential entropy. J. Biomed. Inf. 82, 143–153. doi:10.1016/j.jbi.2018.05.006
Momeni, Z., Hassanzadeh, E., Saniee Abadeh, M., and Bellazzi, R. (2020). A survey on single and multi omics data mining methods in cancer data classification. J. Biomed. Inf. 107, 103466. doi:10.1016/j.jbi.2020.103466
National Cancer Institute, Dictionary of cancer terms. https://www.cancer.gov/publications/dictionaries/cancer-terms (Accessed April 17, 2023).
Nazari, L., and Zinati, Z. (2023). Gene expression classification for biomarker identification in maize subjected to various biotic stresses. IEEE/ACM Trans. Comput. Biol. Bioinforma. 20, 2170–2176. doi:10.1109/tcbb.2022.3233844
Neri, Ferrante, Toivanen, Jari, Cascella, G. L., and Ong, Yew-Soon (2007). An adaptive multimeme algorithm for designing HIV multidrug therapies. IEEE/ACM Trans. Comput. Biol. Bioinforma. 4 (2), 264–278. doi:10.1109/tcbb.2007.070202
Olivier, M., Asmis, R., Hawkins, G. A., Howard, T. D., and Cox, L. A. (2019). The need for multi-omics biomarker signatures in precision medicine. Int. J. Mol. Sci. 20 (19), 4781. doi:10.3390/ijms20194781
Padma, V. V. (2015). An overview of targeted cancer therapy. BioMedicine 5, 1–6. doi:10.7603/s40681-015-0019-4
Pazarentzos, E., and Bivona, T. G. (2015). Adaptive stress signaling in targeted cancer therapy resistance. Oncogene 34 (45), 5599–5606. doi:10.1038/onc.2015.26
Peng, C., Zheng, Y., and Huang, D. (2020). Capsule network based modeling of multi-omics data for discovery of breast cancer-related genes. IEEE/ACM Trans. Comput. Biol. Bioinforma. 17 (5), 1605–1612. doi:10.1109/tcbb.2019.2909905
Saha, S. K., Sarkar, S., and Mitra, P. (2009). Feature selection techniques for maximum entropy based biomedical named entity recognition. J. Biomed. Inf. 42 (5), 905–911. doi:10.1016/j.jbi.2008.12.012
San Miguel, M. (2023). Frontiers in complex systems. Front. Complex Syst. 1 (2). doi:10.3389/fcpxs.2022.1080801
Sato, K., and Akimoto, K. (2017). Expression levels of KMT2C and SLC20A1 identified by information-theoretical analysis are powerful prognostic biomarkers in estrogen receptor-positive breast cancer. Clin. Breast Cancer 17 (3), e135–e142. doi:10.1016/j.clbc.2016.11.005
Shannon, C. E. (1948). A mathematical theory of communication. Bell Syst. Tech. J. 27 (3), 379–423. doi:10.1002/j.1538-7305.1948.tb01338.x
Sheard, S. A., and Mostashari, A. (2009). Principles of complex systems for systems engineering. Syst. Eng. 12 (4), 295–311. doi:10.1002/sys.20124
Shi, K., Lin, W., and Zhao, X. (2021). Identifying molecular biomarkers for diseases with machine learning based on integrative omics. IEEE/ACM Trans. Comput. Biol. Bioinforma. 18 (6), 2514–2525. doi:10.1109/tcbb.2020.2986387
Shin, H., Sheu, B., Joseph, M., and Markey, M. K. (2008). Guilt-by-association feature selection: Identifying biomarkers from proteomic profiles. J. Biomed. Inf. 41 (1), 124–136. doi:10.1016/j.jbi.2007.04.003
Strimbu, K., and Tavel, J. A. (2010). What are biomarkers? Curr. Opin. HIV AIDS 5 (6), 463–466. doi:10.1097/coh.0b013e32833ed177
Urbanowicz, R. J., Olson, R. S., Schmitt, P., Meeker, M., and Moore, J. H. (2018). Benchmarking relief-based feature selection methods for bioinformatics data mining. J. Biomed. Inf. 85, 168–188. doi:10.1016/j.jbi.2018.07.015
Vargas, A. J., and Harris, C. C. (2016). Biomarker development in the precision medicine era: Lung cancer as a case study. Nat. Rev. Cancer 16 (8), 525–537. doi:10.1038/nrc.2016.56
Wang, H. Q., Wong, H. S., Zhu, H., and Yip, T. T. (2009). A neural network-based biomarker association information extraction approach for cancer classification. J. Biomed. Inf. 42 (4), 654–666. doi:10.1016/j.jbi.2008.12.010
Wang, M. D., Shin, D. M., Simons, J. W., and Nie, S. (2007). Nanotechnology for targeted cancer therapy. Expert Rev. Anticancer Ther. 7 (6), 833–837. doi:10.1586/14737140.7.6.833
Weaver, W. (1953). Recent contributions to the mathematical theory of communication. ETC Rev. Gen. Semant. 10, 261–281.
Yaghoobi, H., Babaei, E., Hussen, B. M., and Emami, A. (2021). Ebst: An evolutionary multi-objective optimization based tool for discovering potential biomarkers in ovarian cancer. IEEE/ACM Trans. Comput. Biol. Bioinforma. 18 (6), 2384–2393. doi:10.1109/tcbb.2020.2993150
Yang, L., Shi, P., Zhao, G., Xu, J., Peng, W., Zhang, J., et al. Targeting cancer stem cell pathways for cancer therapy. Signal Transduct. Target. Ther. 5 (8). doi:10.1038/s41392-020-0110-5
Keywords: information theory, complexity, bioinformatics, functional information, complex adaptive systems, computational biology
Citation: Herndon RC (2023) Information guided adaptation of complex biological systems. Front. Complex Syst. 1:1208066. doi: 10.3389/fcpxs.2023.1208066
Received: 18 April 2023; Accepted: 05 June 2023;
Published: 16 June 2023.
Edited by:
Marta C. Gonzalez, University of California, United StatesReviewed by:
Soumyajyoti Biswas, SRM University, IndiaRudolf Marcel Füchslin, Zurich University of Applied Sciences, Switzerland
Copyright © 2023 Herndon. This is an open-access article distributed under the terms of the Creative Commons Attribution License (CC BY). The use, distribution or reproduction in other forums is permitted, provided the original author(s) and the copyright owner(s) are credited and that the original publication in this journal is cited, in accordance with accepted academic practice. No use, distribution or reproduction is permitted which does not comply with these terms.
*Correspondence: R. Craig Herndon, aGVybmRvbnJjQHVwbWMuZWR1