 Fayelynn Fox Scheideman
 L. Stefan Ekernas
 John G. Swallow
- 1Department of Integrative Biology, University of Colorado Denver, Denver, CO, United States
- 2Denver Zoo Conservation Alliance, Colorado Field Conservation, Denver, CO, United States
Recovering species are often managed in small numbers, requiring management strategies that maintain genetic variation for long-term viability. Here, we evaluate the genetic outcomes of two restored American bison (Bison bison) populations 15 generations after its reintroduction as Colorado’s first wildlife reintroduction. After initial reintroduction in 1914 to Genesee park, the herd was split into two separate populations in 1938. To determine the genetic viability of the restored populations, we genotyped 36 individuals from both herds, analyzing 52 microsatellite markers to asses heterozygosity, allelic richness, inbreeding, and population structure. Both herds exhibit relatively high observed heterozygosity (Genesee: 0.775 sd = 0.183; Daniels: 0.781 sd = 0.178), high allelic richness (Genesee: 5.17 sd = 1.45; Daniels: 4.96 sd = 1.46), and negative FIS values (Genesee: -0.112 bootstraps = -0.158, -0.065; Daniels: -0.15, bootstraps = -0.191, -0.108), indicating a lack of inbreeding. Despite ongoing gene flow, the herds remain genetically distinct, as supported by pairwise FST (0.0354, bootstraps = 0.024, 0.046), Nei’s D (0.136), and AMOVA results (FST = 0.078, p = 0.001). STRUCTURE analysis further confirmed that the herds maintain genetic clustering despite some admixture. These results suggest that Denver Mountain Parks’ long-term management strategies – promoting controlled gene flow while preventing inbreeding – have been effective in maintaining genetic variation. Intentional individual movement between herds and introductions from external metapopulations have contributed to the long-term viability of these herds. This study highlights the success of small, intensively managed bison populations in maintaining genetic health over many generations and underscores the importance of gene flow strategies in wildlife restoration.
1 Introduction
The North American bison underwent a severe bottleneck event during the 19th century, where approximately 12-16 million bison spread across North America were reduced to less than 4,000 (Flores, 1991; Gates et al., 2010; Hedrick, 2009; Zontek, 1995). This was due to factors including the genocide of indigenous peoples by the U.S. Army and rapid expansion into the American West by colonizers (Flores, 1991; Gates et al., 2010; Zontek, 1995). Restoration efforts for this species have occurred since the genocide first began in the mid-19th century and continue to the present day (Dratch and Gogan, 2010; Gates et al., 2010; Halbert and Derr, 2008; Hartway et al., 2020). Due to land-use constraints, the rapidly shrinking landscape of the Great Plains, and political conflicts, many restored populations have taken the form of fenced herds ranging from fewer than 50 individuals to several hundred (Dratch and Gogan, 2010; Gates et al., 2010; Hartway et al., 2020). The median herd since in conservation populations is estimated to be fewer than 400 individuals (Gates et al., 2010), meaning that most restored populations must be actively managed to maintain genetic diversity over time. Though this method of restoration is common and typically the most feasible given land and resource constraints in many situations, there are also concerns of smaller populations not being able to persist over long periods of time without extensive management (DeWoody et al., 2021; Halbert et al., 2004; Hartway et al., 2020; Hedrick, 1995, 2009; Hohenlohe et al., 2021). This is due to smaller populations being at higher risk of inbreeding, which can lead to an overall reduction of health in the herds. For example, in some small bison populations, being kept in small numbers has led to sperm deformity and high calf mortality (Halbert et al., 2004).
The Denver Mountain Parks bison herds, established in 1914 and 1938, were the first wildlife restoration efforts in the state of Colorado and currently serve as source populations for continuing bison restoration efforts around the country. The Denver Mountain Parks (DMP) bison herds, were the first bison restoration efforts in Colorado and have since become important source populations for reintroduction projects across the U.S. These herds are part of a broader network of managed conservation populations, including the Yellowstone National Park herd (~5,000 bison), the National Bison Range (~350 bison), and the American Prairie Reserve (~800 bison) (Gates et al., 2010; Hartway et al., 2020). The Genesee Mountain Park herd, established in 1914, was founded by eighteen Bison believed to have originated form Yellowstone National Park and the National Bison Range. The Daniels Park herd was later established in 1938 using surplus bison from the Genesee herd. Though both herds have grown slightly since their establishment, they are both maintained at small population sizes due to range restraints (approximately one bull to 20 adult cows for the Genesee herd and two bulls to 20 adult cows for the Daniels Park herd). Cows typically produce one offspring per year, but most offspring are removed from both populations once they are about a year old. Two female yearlings are kept from each herd about every two-to-four years and moved between herds to promote gene flow. Whereas yearlings removed from Genesee and Daniels were originally auctioned off privately, yearlings are now donated to indigenous communities and contribute to larger bison restoration efforts across the country (Radde, 2023). Yearlings translocated from the Denver Mountain Parks herds either supplement existing tribally-owned herds or found new herds across the United States. This history and current status of the Denver Mountain Parks herds makes them important both for the restoration of bison in Colorado and for larger bison restoration efforts across the United States.
Denver Mountain Parks has employed a variety of management practices to maintain both of these herds at relatively small effective population sizes over the past 100 years. The bison in both herds are minimally handled and supplementally fed hay during the winter. As mentioned previously, two female yearlings from each herd are kept and moved between herds every two-to-four years. These yearlings will reach sexual maturity when they are around 2-3 years old, then begin mating with bull(s) (Bowyer et al., 2007; Lott, 2002). Male offspring are always removed from the herds as a part of the yearling roundup to prevent backcrossing with parents. Gene flow primarily derives from the regular rotation of bulls in each herd; breeding bulls are removed and replaced with new bulls, all from the same private ranch, approximately once per generation (four to seven years). This replacement of bulls from outside populations has been documented for at least the past 30 years and likely started earlier. However, the origin of bulls used earlier in the breeding history of these herds is not known. There is no recorded history of cattle introgression in either the founding members or in the bulls that have been moved into either herd. These management practices largely follow the recommendations that are currently available for population management of fence-restricted, small populations (Dratch and Gogan, 2010; Giglio et al., 2016; Hartway et al., 2020; Hedrick, 2009). Both herds maintain high natality and low calf mortality.
Genetic analysis, especially in more cost-friendly and readily available formats such as microsatellites, enables the proper assessment and revision of management strategies to best fit the needs of individual restoration efforts such as with the Denver Mountain Parks bison herds. Microsatellites, or Short Tandem Repeats (STRs), have been used extensively in wildlife conservation and management to asses inbreeding and population differentiation in wild endangered populations, as well as in restoration efforts (Abdul-Muneer, 2014; Balloux and Lugon-Moulin, 2002; Beaumont, 1999; Benzie and Williams, 1992). By utilizing microsatellite analyses, managers in smaller restoration projects can assess the effectiveness of management strategies and adjust them to the unique genetic background and circumstances that surround their restoration project (Abdul-Muneer, 2014; Halbert et al., 2004; Jangjoo et al., 2016; Ogden et al., 2020; Pertoldi et al., 2001; Westemeier et al., 1998; Wisely et al., 2002). Genetic information, therefore, fills a short-term management need while also allowing a more detailed understanding of how specific management practices affect small populations.
We sought to use microsatellite analyses to assess the genetic diversity and population structuring present in both of the Denver Mountain Park herds and to evaluate the effectiveness of management strategies on this long-term restoration project. By using genetic analysis to evaluate both herds, there is an opportunity to assess what has been effective about the management strategies used over time, and to make recommendations for adjustment where needed. We also aimed to evaluate how viable the Denver Mountain Parks herds are as source populations for ongoing bison restoration efforts across the United States. Ultimately, the Denver Mountains Parks herds not only serve as a case study in small, long-term wildlife restoration projects, but are also intrinsically valuable to investigate as they are actively contributing to bison restoration currently.
2 Materials and methods
2.1 Sample collection and DNA extraction
Denver Mountain Parks staff collected tail hairs from all available offspring (n = 33) born in 2021, along with a subset of reproductively active cows (n = 3), for a total of 36 individuals. This included 18 yearlings and one adult cow from Daniels Park as well as 15 yearlings and two adult cows from Genesee Mountain Park (n = 36). Though the total number of individuals sampled may appear small, this dataset includes all offspring produced that year and a subset of breeding females from both herds. Given that the entire reproductive output of both herds was included, random sampling was not necessary to capture the full extent of genetic variation present in the next generation. Our dataset encompassed 47% of all individuals in both herds at the time of sampling, including an entire cohort of offspring, which incorporates a substantial proportion of the total genetic variation within these herds. Tail hairs were stored in cool, dry conditions before being sent to the University of California Davis Veterinary Genetics Lab (Davis, CA) for DNA extraction and sequencing.
A unique Veterinary Genetics Lab case number was assigned to each sample, and DNA extractions were completed using a lysis buffer that dissolved cell membranes and released nuclear and mitochondrial DNA. Aliquots with two-to-three microliters of DNA solution were used for PCR.
PCR was implemented using multiplexed panels (five total) with 52 previously-developed microsatellite markers to identify genetic diversity in bison (Halbert and Derr, 2008) using primer mixes where one of a pair is fluorescence-labeled. To separate fluorescence-labeled PCR product for each marker panel, an aliquot of each sample was subjected to electrophoresis. Laser detection was used to collect fluorescence signals from PCR products, and electropherograms were developed for each sample based on this data. Both the PCR and electrophoresis were performed with a reference sample as a positive control.
The STRand software (Toonen and Hughes, 2003) was implemented for genotype analysis by the UCDavis Veterinary Genetics lab. This software processed the electropherogram output by the PCR gel electrophoreses and generated the genotypes.
In addition to the DNA extraction and microsatellite marker calling, the UC Davis Veterinary Genetics lab performed an introgression analysis with both the autosomal microsatellite markers (Halbert and Derr, 2008) and a single mtDNA maker. The purpose of this was to identify potential introgression with cattle that may be present in the Denver Mountain Parks herds, as cattle introgression is common amongst bison populations (Dratch and Gogan, 2010; Gates et al., 2010; Hedrick, 2009; Stroupe et al., 2022). They found no evidence of introgression with cattle, either autosomal or along the mitochondrial line, in the Denver Mountain Parks herds (unpublished).
2.2 Data analysis
2.2.1 Genetic diversity
To better understand the genetic diversity present in both herds, we used a variety of packages in the program R v. 4.3.3 (R Core Team, 2023). We used the R package hierfstat v. 0.5-11 (Goudet, 2005) to estimate FIS, observed heterozygosity (HO), and allelic richness (AR) for each herd. To determine FIS and observed heterozygosity, we used the function basic.stats, and we used boot.ppfis (5000 iterations) for bootstrapping the FIS (sensitivity analysis was done to determine the optimal number of bootstrap iterations). Allelic richness was found using the function allelic.richness. The R package adegenet v. 2.1.10 (Jombart, 2008) was used to estimate the expected heterozygosity (HE) using the function Hs.
For observed heterozygosity and allelic richness, we tested for normalcy using the Shapiro-Wilk test via the R stats package (R Core Team, 2023). Both datasets were determined to be non-normally distributed (p < 0.05), so the Wilcox test was then used to test for statistical significance in values between the herds with the R stats package (R Core Team, 2023).
2.2.2 Genetic differentiation and structure
We produced a Principal Components Analysis (PCA) using ade4 v.1.7-22 (Dray and Dufour, 2007) to assess relative genetic similarities between individuals based on allele frequency variation. This was done by summarizing allele frequency differences in principal components (PCs). Principal components were constructed using the dudi.pca function in the ade4 package, and then the variation between the first and second PCs was plotted using ggplot2 v. 3.4.4 (Wickham, 2016).
We then used the STRUCTURE software v. 2.3.4 (Falush et al., 2003; Pritchard et al., 2000) to investigate admixture and population structuring between the Denver Mountain Park herds. For the parameter set, we used a burn-in period of 50,000 iterations followed by 200,000 Markov Chain Monte Carlo (MCMC) iterations (optimal number of iterations determined from sensitivity analysis of alpha values and log-transformed likelihood (lnP(D)) values across different parameter sets). We ran the simulations under an admixture model with correlated allele frequencies assuming individuals could have ancestry from multiple clusters. This parameter set was run for K = 1-10 for 10 iterations per K-value, and the Q membership proportions were produced in addition to the primary results for every iteration.
To determine the optimal number of clusters from the STRUCTURE results, we used both the lnP(D) and Evanno methods (Falush et al., 2003; Pritchard et al., 2000). In the lnP(D) method, we evaluated when the lnP(D) stabilized without large variation between iterations. We also used the Evanno method (Earl and vonHoldt, 2012; Evanno et al., 2005), which is based on the rate of change in K values (ΔK) between iterations. We used the python script STRUCTURE Harvester (Earl and vonHoldt, 2012; Evanno et al., 2005) to calculate ΔK, then plotted ΔK vs. K to determine the peak ΔK value. We then visualized the admixture results for the two most optimal clusters using the R package ggplot2.
We also did an Analysis of Molecular Variance (AMOVA) on the dataset (Excoffier et al., 1992) using the R packages poppr v.2.9.5 (Kamvar et al., 2014), adegenet, and ade4. Here, we calculated the total variance both between individuals and between groups and generated the ΦST value to explain the total variance explained by between-group variance using the function poppr.amova. We then did a permutation test (999 iterations) to generate a null distribution and derived a p-value for genetic distinction between herds using the randtest function in ade4.
Additionally, we calculated Nei’s pairwise FST (Nei, 1987) for the herds in the R package pegas v.1.2 (Paradis, 2010) using the function Fst. Bootstrapping of the pairwise FST was generated in hierfstat using boot.ppfst (5000 iterations, Goudet, 2005). Sensitivity analysis was done to determine the optimal number bootstrap iterations. We also used adegenet (Jombart, 2008) to produce Nei’s D-statistic (Nei, 1987), providing another way of assessing genetic distance between two groups.
3 Results
3.1 Signals of genetic diversity
Neither of the Denver Mountain Parks herds showed strong indications of inbreeding, with FIS values of -0.15 (bootstrap: -0.191, -0.108) for Daniels and -0.112 (bootstrap: -0.158, -0.065) for Genesee (Table 1). Rather, both herds demonstrate high levels of genetic variation, with observed heterozygosity being 0.781 (sd = 0.178) for Daniels and 0.775 (sd = 0.188) for Genesee (Table 1). Significance testing did not indicate that the HO between herds is significant (V = 576, p = 0.702). Allelic richness was approximately 4.96 (sd = 1.46) for the Daniels herd and 5.17 (sd = 1.45) for the Genesee herd (Table 1). Further significance testing did indicate that there is a significant difference in the AR between the Daniels and Genesee herds (V = 264, p = 0.0005).
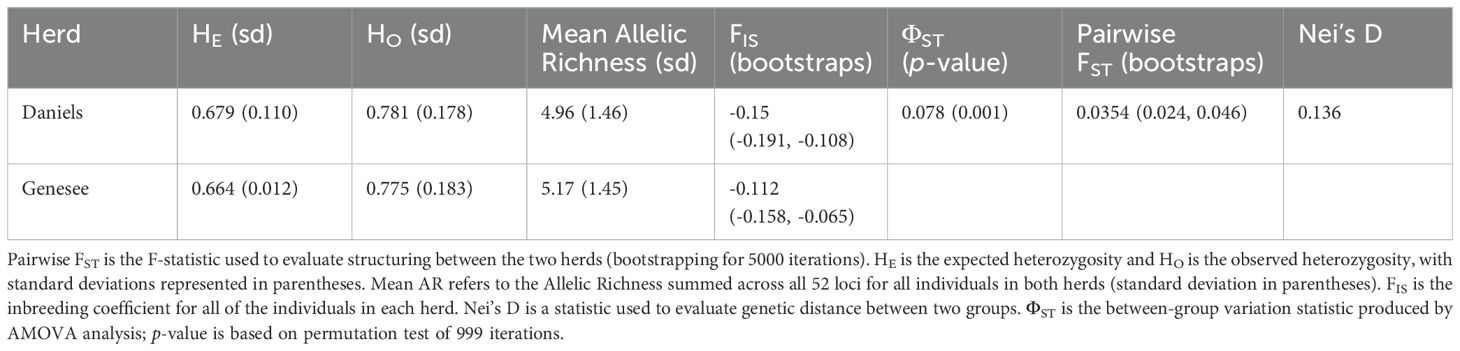
Table 1. Summary of the genetic diversity and differentiation statistics estimated for the Denver Mountain Parks herds.
3.2 Patterns of differentiation
We detected some structuring between the herds using both individual and subpopulation-based analyses. Figure 1 shows the genetic variation between individuals from both herds across the first two principal components (PCs). Here, PC1 represented 11.05% of the variation across all loci, while PC2 represented 7.69% of variance. When looking at potential clustering, 12 of the 17 Genesee individuals cluster together, while the remaining five cluster more closely with Daniels individuals (Figure 1). Additionally, there was more genetic variation between individuals in Daniels than there was variation between Genesee individuals (Figure 1). However, given the low amount of variation that is represented in the these first two PCs, there is not strong evidence of distinct genetic clustering from this analysis.
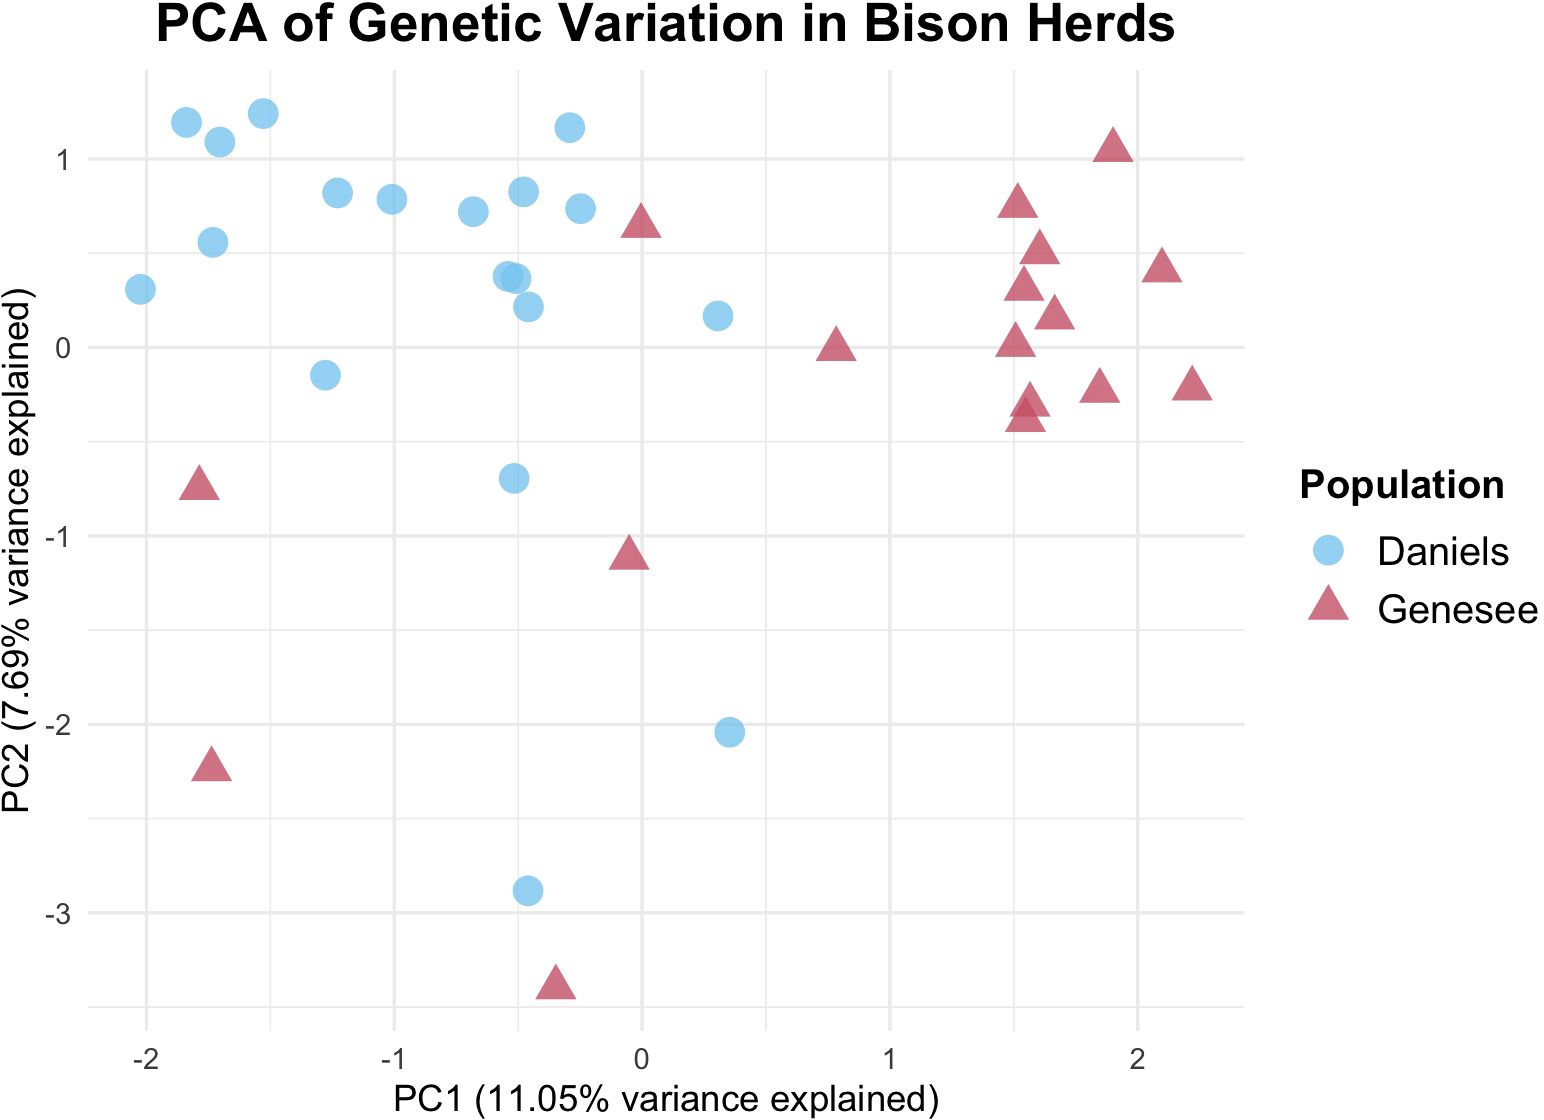
Figure 1. Principal Components Analysis (PCA) of individuals across both Denver Mountain Parks herds. Each point represents an individual, and both color and shape indicate herd membership. Distance between points represents genetic variation. PC1 (11.05% variance) is shown on the x-axis while PC2 (7.69% of variance) is shown on the y-axis. Tight clustering is shown with most Genesee individuals, with five Genesee individuals clustering more with the Daniels Park herd. Daniels Park individuals show more distancing from each other. Overall population distinctions are weak, however, due to the low variance explained by the principal components.
Bayesian clustering analysis using STRUCTURE suggests that the optimal number of clusters between the Daniels and Genesee herds is K = 2. Mean lnP(D) improved until reaching the highest value at K=3. However, the variation also increased significantly between lnP(D) values for K = 2 and K = 3, suggesting that K = 2 is the more optimal cluster. Additionally, ΔK peaked at K = 2, with the second-highest value being K = 3, but with more uncertainty.
The genetic membership of individuals in the K = 2 scenario is shows in Figure 2A. Here, the Daniels and Genesee herds formed distinct genetic clusters, but with evidence of admixture between groups. Specifically, several Daniels individuals show signs of more admixture with the Genesee herd. Additionally, the genetic membership of individuals under the K = 3 model is shown in Figure 2B. Though this model is less stable given the lnP(D) results, it does demonstrate that there may be some substructuring in individuals, particularly in the Daniels herd. The K = 2 model is still the most likely representation of population structure given this analysis.
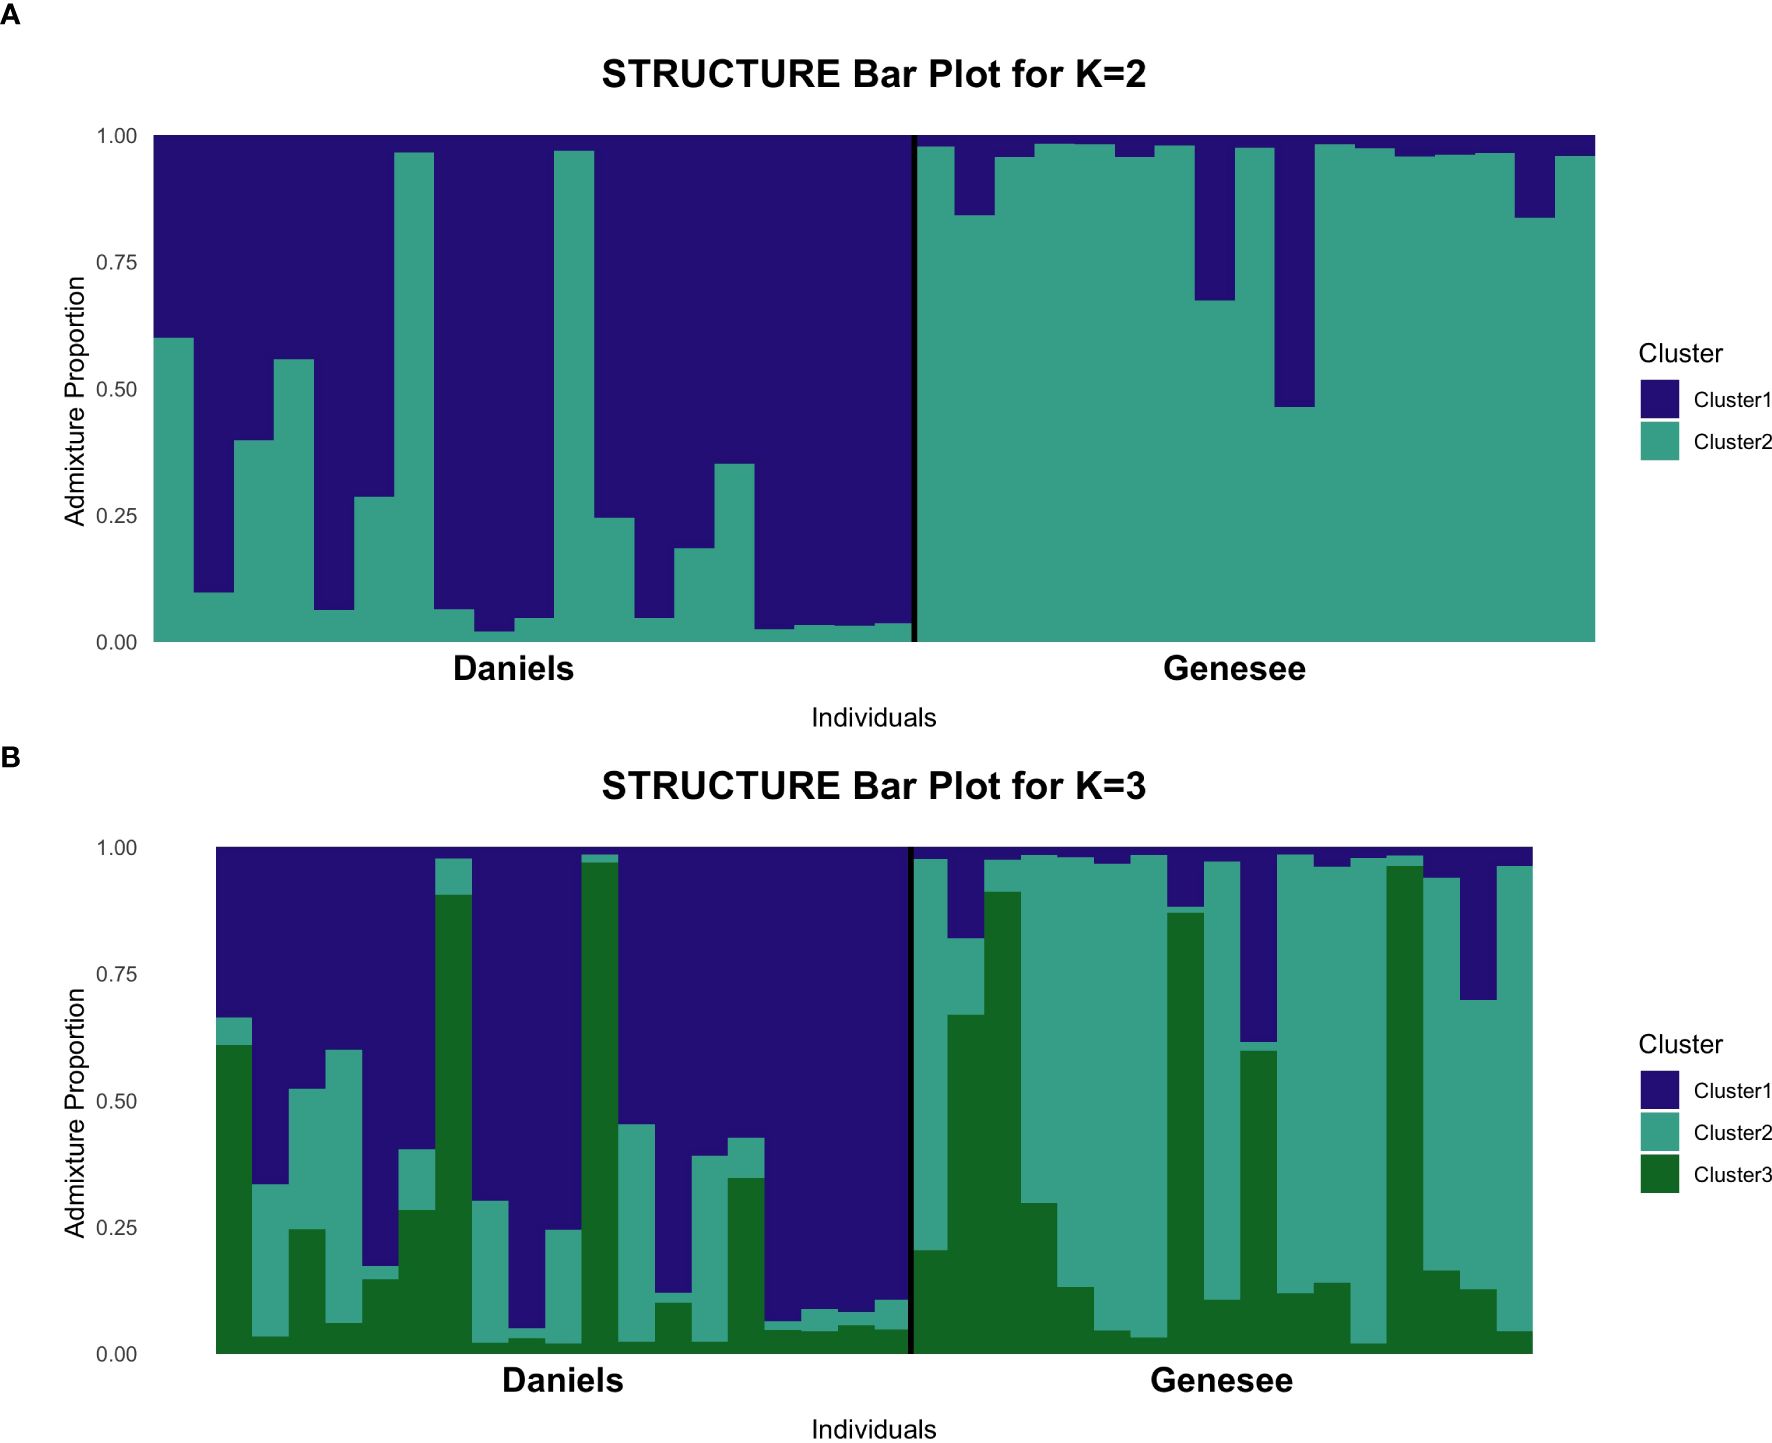
Figure 2. Allele membership of Denver Mountain Parks individuals determined by STRUCTURE analysis for K = 2 and K = 3. Each vertical bar represents microsatellite markers of an individual and the group membership calculated for each marker. (A) Membership probability at microsatellite markers for K = 2 clusters, which is the optimal number of clusters suggested by the Evanno and lnP(D) methods. The Daniels herd primarily clusters in one group (dark blue), while the Genesee herd primarily clusters in a second group (teal), but some admixture is visible. (B) Membership probability at microsatellite markers for K = 3 clusters, the second-most optimal grouping based on statistical analysis. The addition of a third cluster, represented by green, suggests potential substructuring, particularly in the Daniels herd.
Further tests for population structuring between the Daniels and Genesee herds revealed present, but weak, structuring. AMOVA analysis produced a ΦST value of 0.078, indicating that approximately 7.8% of variation is explained by between-herd differences, while approximately 92.2% is explained by variation between individuals (Table 1). However, permutation tests of 999 replicates indicate that there is a non-random difference between the two herds (p = 0.001; Table 1) The pairwise FST value was 0.0354 (bootstrap: 0.024, 0.046) and Nei’s D-Statistic was 0.136 (Table 1). These values indicate that there is a non-random difference between the two herds, but that structuring is not strong.
Overall, STRUCTURE analysis and AMOVA showed evidence of at least two distinct genetic clusters between the Daniels and Genesee herds, where FST and Nei’s D-statistic indicate that the level of differentiation between the groups is weak. The PCA indicates that there is potentially more genetic distance between Daniels Park individuals than between Genesee individuals (Figure 1), which is supported by the potential substructuring in the K = 3 model produced by STRUCTURE (Figure 2B).
4 Discussion
4.1 Overall genetic diversity and differences in population structuring
The results of this research indicate that both herds have high levels of genetic variation (Table 1). When comparing to other research, positive FIS values are typically interpreted as a sign of inbreeding or homozygote excess (Amigues et al., 2011; Hartway et al., 2020; Sætre et al., 2001). However, both the Daniels and Genesee herds exhibited negative FIS values, indicating that observed heterozygosity (HO) exceeded expected heterozygosity (HE). This pattern can arise due to multiple factors, including heterozygote advantage, gene flow (migration), or the Wahlund effect (population substructure) (Chikhi et al., 2010; Wahlund, 1928). Given that Denver Mountain Parks actively manages these herds by moving individuals between herds, the most likely explanation for this pattern is gene flow. The regular exchange of female yearlings and periodic introduction of external bulls likely maintains high heterozygosity, reducing the potential for inbreeding (Slatkin, 1987). Additionally, the STRUCTURE and AMOVA results confirm that the herds, while distinct, still experience gene flow, which can contribute to an excess of heterozygotes compared to Hardy-Weinberg expectations (Slatkin, 1987). Another possible explanation is a mild Wahlund effect, where genetic substructuring within herds creates an artificial excess of heterozygotes when analyzed as a single unit (Chikhi et al., 2010; Wahlund, 1928). This could be particularly relevant for the Daniels herd, which is potentially exhibiting additional substructuring at K = 3 in STRUCTURE analysis (Figure 2B). Although heterozygote advantage cannot be entirely ruled out, there is no direct evidence for selection favoring heterozygosity in this population.
Compared with the genetic variation statistics from bison herds owned by the Department of the Interior (DOI), the Denver Mountain Parks herds have observed heterozygosity values substantially higher than the global value of 0.598 (sd = 0.088), and is consistent with DOI herds with higher values such as Yellowstone (YNP), the National Bison Range (NBR), and Rocky Mountain Arsenal (RMA) (Hartway et al., 2020). This was also the case for allelic richness, where the allelic richness for DOI herds ranged from 2.60 to 4.12 (Hartway et al., 2020). The Genesee herd also had significantly higher allelic richness than the Daniels herd. Additionally, both of the herds have observed heterozygosity values above the less-than 0.5 cutoff that was suggested by the National Park Service for bison populations needing genetic intervention (Dratch and Gogan, 2010).
Though the total number of individuals sampled appears small (n = 36), this dataset includes all offspring produced during the sampling year and a subset of breeding females from both herds. As a result, the dataset represents 47% of all individuals in the herds at the time of sampling, capturing a substantial proportion of the genetic variation within these herds. The inclusion of an entire reproductive cohort, combined with the genetic clustering analyses and bootstrapping results, supports that our sample provides an accurate representation of the broader herd genetic structure.
The Denver Mountain Parks herds exhibited weak but detectable population structuring as evidenced by multiple genetic analyses (Table 1, Figures 1, 2). Pairwise genetic differentiation metrics, including FST (0.0354) and Nei’s D-statistic (0.136), suggest low but measurable genetic divergence between the Daniels and Genesee herds (Table 1; Balloux and Lugon-Moulin, 2002; Benzie and Williams, 1992; Sætre et al., 2001; Pertoldi et al., 2001). Similarly, AMOVA results detected a statistically significant, non-random difference between groups (ΦST = 0.078, p = 0.001; Table 1), indicating that while the two herds share considerable genetic variation, they are not entirely panmictic.
Multivariate clustering analyses further support the presence of subtle genetic structure. The PCA (Figure 1) suggests weak differentiation between herds, with some individuals from Daniels and Genesee clustering separately but with overlapping genetic variation. STRUCTURE analysis at K = 2 (Figure 2A) reveals that individuals generally group by herd, though admixture is apparent in both herds, likely reflecting historical and recent gene flow. At K = 3 (Figure 2B), additional substructuring within the Daniels herd emerges, suggesting potential underlying genetic variation not clearly reflected in the FST, Nei’s D, or AMOVA results.
One possible explanation for this increased genetic complexity within the Daniels herd is differences in male reproductive contributions. The Daniels herd has historically had two bulls, while the Genesee herd only had one. Having more than one bull in Daniels may have maintained higher allelic diversity and led to greater variation in individual genetic ancestries in the offspring sampled, as observed in both PCA and STRUCTURE results. Additionally, differences in past herd management (such as the timing of introduced bulls) could have contributed to this pattern.
The high levels of heterozygosity and low inbreeding present in the Denver Mountain Parks herds indicate that they are suitable herds for contribution to tribally-owned bison herds. Bison from Denver Mountain Parks herds that are added to existing tribally-owned herds could provide an important form of gene flow (Hedrick, 1995; Jangjoo et al., 2016; Ogden et al., 2020; Saremi et al., 2019). Additionally, the high genetic variation in both herds means that transferred individuals are less likely to suffer from effects of inbreeding and have more adaptive potential over time (Ogden et al., 2020). Overall, these results point towards the Denver Mountain Parks herds being genetically valuable in the larger bison restoration effort.
4.2 Managing for gene flow and prevention of inbreeding
Intentional management to promote gene flow and prevent backcrossing in the herds has been key in maintaining genetic variation and preventing inbreeding within the Denver Mountain Parks herds. Since both of the herds were established, male offspring have been removed and not allowed to backcross with the parental population, and female yearlings have been moved between herds every two-to-three years. Additionally, substituting bulls from non-DMP populations approximately once per generation appears to have effectively prevented inbreeding, as indicated by relatively high observed heterozygosity and negative FIS values (Table 1).
This strategy has allowed Denver Mountain Parks to maintain genetic diversity without collapsing the two herds into a single panmictic population. STRUCTURE results (Figure 2) indicate that the herds still exhibit genetic clustering, while AMOVA (Table 1) confirms a statistically significant differentiation between them. This suggests that DMP’s approach has successfully prevented excessive inbreeding while maintaining genetic structure between herds.
Gene flow between the herds has played an important role in maintaining genetic variation. Establishing the Daniels herd as a second herd increased effective population size, allowing for more bulls to be introduced. This also allowed for further gene flow between the herds via the swapping of female yearlings every couple of years, reducing the risk of allele loss due to drift. However, despite this exchange, the AMOVA results confirm that the herds have not become completely genetically homogenized. While shared ancestry is apparent in STRUCTURE (Figure 2), the differentiation detected by AMOVA suggests that gene flow has been controlled enough to retain distinct herd identities.
On a larger scale, Denver Mountain Parks’ periodic replacement of bulls with individuals from external herds introduces additional genetic variation, buffering against inbreeding risks. For example, in least the last 20 years and likely much longer, external bulls have come from large, commercial bison herds. The combination of within-herd gene flow and external introductions of genetic diversity has helped maintain viable populations despite their relatively low effective population size. The genetic structuring observed between the herds reflects a well-balanced management strategy, where inbreeding is minimized, genetic variation is preserved, and populations remain genetically distinct yet connected.
The management of the Denver Mountain Parks herds helped in avoiding negative consequences of closed populations and inbreeding that have been observed in other bison herds established at a similar time. An example of this is the Texas State bison herd, which was established by Charles Goodnight in the 1880s with five wild-caught individuals and kept as a closed population, resulting in an effective population size of only 13 by the early 2000s (Halbert et al., 2005). An investigation done in 2004 found that the herd was experiencing high calf mortality and sperm deformity in males, both indicative of inbreeding. Genetic investigation showed significantly low heterozygosity (0.399) and a herd extinction likelihood of 99% (Halbert et al., 2004). Despite the Denver Mountain Parks herds also being founded early in the bison recovery movement and being maintained in small populations, the intentional management of the herds to promote gene flow and prevent backcrossing were successful in maintaining genetic variation and avoiding negative consequences of inbreeding as was seen in the Texas State bison herd.
4.3 Lessons in the larger context of wildlife restoration
The successful management of the Denver Mountain Parks herds points towards the importance of metapopulations when recovering threatened and endangered populations. Even though the Denver Mountain Parks herds both needed to stay at small sizes due to space constraints, having both herds as well as other metapopulations to move animals between was vital in maintaining genetic diversity and enabling the long-term success of these herds. In many cases, threatened and endangered species must be kept at smaller effective population sizes during restoration and conservation efforts (Giglio et al., 2016; Hedrick, 1995; Jangjoo et al., 2016; Ogden et al., 2020; Westemeier et al., 1998; Wisely et al., 2002). This research suggests that it is possible to maintain small populations successfully over a long period of time with the intentional prevention of backcrossing and by having other metapopulations to promote gene flow.
4.4 Conclusion
As more wildlife species are becoming threatened and endangered worldwide, understanding effective management strategies for restoration and conservation efforts is paramount, particularly for populations that need to be maintained at small sizes over long periods of time. The Denver Mountain Parks herds serve as a case study in what effective management can look like for restoring species at smaller effective population sizes, primarily by managing to promote gene flow and prevent backcrossing. Particularly, conserving metapopulations, rather than focusing on genetically distinct subpopulations, has been effective with these herds. Identifying the successful strategies used by Denver Mountain Parks will hopefully be valuable as more populations of bison are reintroduced to the landscape, including by the indigenous communities that have been and continue to receive bison from Denver Mountain Parks (Radde, 2023). Ultimately, these results not only impact the Denver Mountain Parks herds, but also contribute to the larger understanding of bison recovery in North America and the recovery of threatened and endangered species as biodiversity conservation efforts continue worldwide.
Data availability statement
The original contributions presented in the study are publicly available. This data can be found here: Dryad, https://doi.org/10.5061/dryad.rxwdbrvmb.
Ethics statement
Ethical approval was not required for the studies involving animals in accordance with the local legislation and institutional requirements because biological samples were collected as part of Denver Mountain Park’s disease management procedures, and not primarily for research purposes. Therefore, given that Denver Mountain Parks is not a research entity, procedures were not subject to animal care and use (IACUC) review.
Author contributions
FS: Writing – original draft, Writing – review & editing, Conceptualization, Formal analysis, Investigation, Methodology, Software, Visualization. SE: Conceptualization, Data curation, Formal analysis, Funding acquisition, Project administration, Resources, Supervision, Writing – review & editing. JS: Conceptualization, Funding acquisition, Project administration, Resources, Supervision, Writing – review & editing.
Funding
The author(s) declare that financial support was received for the research and/or publication of this article. The Denver Zoo Conservation Alliance paid for the genetic testing of all samples. Additional support for this research was provided by the National Science Foundation (NSF) Graduate Research Fellowship Program (GRFP) under Grant No. DGE-2439026 (FFS) and by NSF Grant No. 1656465 (JGS).
Acknowledgments
The authors extend their sincere gratitude to Denver Mountain Parks for their invaluable collaboration and support of this research. We deeply appreciate their dedication to bison conservation and management and their willingness to facilitate this stidy through access to the Daniels Park and Genesee herds. Their long-term stewardship of thse herds has been instrumental in advancing bison restoration, and this research would not have been possible without their partnership.
Conflict of interest
The authors declare that the research was conducted in the absence of any commercial or financial relationships that could be construed as a potential conflict of interest.
The author(s) declared that they were an editorial board member of Frontiers, at the time of submission. This had no impact on the peer review process and the final decision.
Generative AI statement
The author(s) declare that no Generative AI was used in the creation of this manuscript.
Publisher’s note
All claims expressed in this article are solely those of the authors and do not necessarily represent those of their affiliated organizations, or those of the publisher, the editors and the reviewers. Any product that may be evaluated in this article, or claim that may be made by its manufacturer, is not guaranteed or endorsed by the publisher.
References
Abdul-Muneer P. M. (2014). Application of microsatellite markers in conservation genetics and fisheries management: recent advances in population structure analysis and conservation strategies. Genet. Res. Int. 2014, 1–11. doi: 10.1155/2014/691759
Amigues Y., Boitard S., Bertrand C., Sancristobal M., Rocha D. (2011). Genetic characterization of the Blonde d’Aquitaine cattle breed using microsatellite markers and relationship with three other French cattle populations. J. Anim. Breed. Genet. 128, 201–208. doi: 10.1111/j.1439-0388.2010.00890.x
Balloux F., Lugon-Moulin N. (2002). The estimation of population differentiation with microsatellite markers. Mol. Ecol. 11, 155–165. doi: 10.1046/j.0962-1083.2001.01436.x
Beaumont M. A. (1999). Detecting population expansion and decline using microsatellites. Available online at: https://academic.oup.com/genetics/article/153/4/2013/6035072 (Accessed December 6, 2024).
Benzie J. A., Williams S. T. (1992). Genetic structure of giant clam (Tridacna maxima) populations from reefs in the Western Coral Sea. Coral reefs. 11, 135–141. doi: 10.1007/BF00255467
Bowyer R. T., Bleich V. C., Manteca X., Whiting J. C., Stewart K. M. (2007). Sociality, mate choice, and timing of mating in American bison (Bison bison): Effects of large males. Ethology 113, 1048–1060. doi: 10.1111/j.1439-0310.2007.01411.x
Chikhi L., Sousa V. C., Luisi P., Goossens B., Beaumont M. A. (2010). The confounding effects of population structure, genetic diversity and the sampling scheme on the detection and quantification of population size changes. Genetics 186, 983–995. doi: 10.1534/genetics.110.118661
DeWoody J. A., Harder A. M., Mathur S., Willoughby J. R. (2021). The long-standing significance of genetic diversity in conservation. Mol. Ecol. 30, 4147–4154. doi: 10.1111/mec.16051
Dratch P., Gogan P. (2010). Bison Conservation Genetics Workshop: Report and Recommendations. Natural Resource Report NPS/NRPC/BRMD/NRR—2010/257 (Fort Collins, Colorado: National Park Service).
Dray S., Dufour A. B. (2007). The ade4 package: implementing the duality diagram for ecologists. J. Stat. Software 22, 1–20. doi: 10.18637/jss.v022.i04
Earl D. A., vonHoldt B. M. (2012). STRUCTURE HARVESTER: a website and program for visualizing STRUCTURE output and implementing the Evanno method. Conserv. Genet. Resour. 4, 359–361. doi: 10.1007/s12686-011-9548-7
Evanno G., Regnaut S., Goudet J. (2005). Detecting the number of clusters of individuals using the software STRUCTURE: a simulation study. Mol. Ecol. 14, 2611–2620. doi: 10.1111/j.1365-294X.2005.02553.x
Excoffier L., Smouse P. E., Quattro J. M. (1992). Analysis of molecular variance inferred from metric distances among DNA haplotypes: application to human mitochondrial DNA restriction data. Genetics 131, 479–491. doi: 10.1093/genetics/131.2.479
Falush D., Stephens M., Pritchard J. K. (2003). Inference of population structure using multilocus genotype data: linked loci and correlated allele frequencies. Genetics 164, 1567–1587. doi: 10.1093/genetics/164.4.1567
Flores D. (1991). Bison ecology and bison diplomacy: The Southern Plains from 1800 to 1850. J. Am. History 78, 465–485. doi: 10.2307/2079300
Gates C., Freese H., Gogan P., Kotzman M. (2010). American bison status survey and conservation guidelines. Available online at: http://www.iucn.org/about/work/programmes/species/about_ssc/ (Accessed December 6, 2024).
Giglio R. M., Ivy J. A., Jones L. C., Latch E. K. (2016). Evaluation of alternative management strategies for maintenance of genetic variation in wildlife populations. Anim. Conserv. 19, 380–390. doi: 10.1111/acv.12254
Goudet J. (2005). HIERFSTAT, a package for R to compute and test hierarchical F-statistics. Mol. Ecol. Notes 5, 184–186. doi: 10.1111/j.1471-8278
Halbert N. D., Derr J. N. (2008). Patterns of genetic variation in US federal bison herds. Mol. Ecol. 17, 4963–4977. doi: 10.1111/j.1365-294X.2008.03973.x
Halbert N. D., Grant W. E., Derr J. N. (2005). Genetic and demographic consequences of importing animals into a small population: A simulation model of the Texas State Bison Herd (USA). Ecol. Model. 181, 263–276. doi: 10.1016/j.ecolmodel.2004.02.022
Halbert N. D., Raudsepp T., Chowdhary B. P., Derr J. N. (2004). Conservation genetic analysis of the Texas state bison herd. J. Mammal 85, 924–931. doi: 10.1644/BER-029
Hartway C., Hardy A., Jones L., Moynahan B., Traylor-Holzer K., McCann B., et al. (2020). Long-term Viability of Department of the Interior Bison Under Current Management and Potential Metapopulation Management Strategies. Natural Resource Report NPS/NRSS/BRD—2020/2097 (Fort Collins, Colorado: National Park Service).
Hedrick P. W. (1995). Gene flow and genetic restoration: the florida panther as a case study. Biology 9, 996–1007. doi: 10.1046/j.1523-1739.1995.9050988.x-i1
Hedrick P. W. (2009). Conservation genetics and North American bison (Bison bison). J. Heredity 100, 411–420. doi: 10.1093/jhered/esp024
Hohenlohe P. A., Funk W. C., Rajora O. P. (2021). Population genomics for wildlife conservation and management. Mol. Ecol. 30, 62–82. doi: 10.1111/mec.15720
Jangjoo M., Matter S. F., Roland J., Keyghobadi N. (2016). Connectivity rescues genetic diversity after a demographic bottleneck in a butterfly population network. Proc. Natl. Acad. Sci. United States America 113, 10914–10919. doi: 10.1073/pnas.1600865113
Jombart T. (2008). Adegenet: A R package for the multivariate analysis of genetic markers. Bioinformatics 24, 1403–1405. doi: 10.1093/bioinformatics/btn129
Kamvar Z. N., Tabima J. F., Grünwald N. J. (2014). Poppr: an R package for genetic analysis of populations with clonal, partially clonal, and/or sexual reproduction. PeerJ 2, e281. doi: 10.7717/peerj.281
Ogden R., Chuven J., Gilbert T., Hosking C., Gharbi K., Craig M., et al. (2020). Benefits and pitfalls of captive conservation genetic management: Evaluating diversity in scimitar-horned oryx to support reintroduction planning. Biol. Conserv. 241, 108244. doi: 10.1016/j.biocon.2019.108244
Paradis E. (2010). Pegas: An R package for population genetics with an integrated-modular approach. Bioinformatics 26, 419–420. doi: 10.1093/bioinformatics/btp696
Pertoldi C., Hansen M. M., Loeschcke V., Madsen A. B., Jacobsen L., Baagoe H. (2001). Genetic consequences of population decline in the European otter (Lutra lutra): An assessment of microsatellite DNA variation in Danish otters from 1883 to 1993. Proc. R. Soc. B: Biol. Sci. 268, 1775–1781. doi: 10.1098/rspb.2001.1762
Pritchard J. K., Stephens M., Donnelly P. (2000). Inference of population structure using multilocus genotype data. Genetics 155, 945–959. doi: 10.1093/genetics/155.2.945
Radde K. (2023). Denver donates 35 bison to Native American tribes. National Public Radio. Available online at: https://www.npr.org/2023/03/16/1164015750/native-american-bison-buffalo-denver-donate (Accessed December 6, 2024).
R Core Team (2023). R: A language and environment for statistical computing (Vienna, Austria: R Foundation for Statistical Computing). Available at: https://www.R-project.org/ (Accessed November 15, 2024).
Sætre G. P., Borge T., Lindell J., Moum T., Primmer C. R., Sheldon B. C., et al. (2001). Speciation, introgressive hybridization and nonlinear rate of molecular evolution in flycatchers. Mol. Ecol. 10, 737–749. doi: 10.1046/j.1365-294X.2001.01208.x
Saremi N. F., Supple M. A., Byrne A., Cahill J. A., Coutinho L. L., Dalén L., et al. (2019). Puma genomes from North and South America provide insights into the genomic consequences of inbreeding. Nat. Commun. 10, 4769. doi: 10.1038/s41467-019-12741-1
Slatkin M. (1987). Gene flow and the geographic structure of natural populations. Science 236, 787–792. doi: 10.1126/science.3576198
Stroupe S., Forgacs D., Harris A., Derr J. N., Davis B. W. (2022). Genomic evaluation of hybridization in historic and modern North American Bison (Bison bison). Sci. Rep. 12, 6397. doi: 10.1038/s41598-022-09828-z
Toonen R. J., Hughes S. (2003). Increased throughput for fragment analysis on an ABI PRISM 377 automated sequencer using a membrane comb and STRand software. Available online at: https://www.researchgate.net/publication/229088959 (Accessed December 6, 2024).
Wahlund S. (1928). Zusammensetzung von Populationen und Korrelationserscheinungen vom Standpunkt der Vererbungslehre aus Betrachtet. Hereditas 11, 65–106. doi: 10.1111/j.1601-5223.1928.tb02483.x
Westemeier R. L., Brawn J. D., Simpson S. A., Esker T. L., Jansen R. W., Walk J. W., et al. (1998). Tracking the long-term decline and recovery of an isolated population. Science 282 (5394), 1695–1698. doi: 10.1126/science.282.5394.1695
Wisely S. M., Buskirk S. W., Fleming M. A., Mcdonald D. B., Ostrander E. A. (2002). Genetic diversity and fitness in black-footed ferrets before and during a bottleneck. Available online at: https://academic.oup.com/jhered/article/93/4/231/2187195 (Accessed December 6, 2024).
Zontek K. (1995). HUNT, CAPTURE, RAISE, INCREASE: THE PEOPLE WHO SAVED THE BISON. Source: Great Plains Q. 15, 133–149. Available at: https://www.jstor.org/stable/23531808?seq=1&cid=pdf- (Accessed November 15, 2024).
Keywords: microsatellites, bison, reintroduction, wildlife management, conservation genetics, wildlife genetics
Citation: Scheideman FF, Ekernas LS and Swallow JG (2025) Genetic viability of small American bison (Bison bison) populations a century after reintroduction. Front. Conserv. Sci. 6:1553543. doi: 10.3389/fcosc.2025.1553543
Received: 30 December 2024; Accepted: 19 February 2025;
Published: 13 March 2025.
Edited by:
Arne Ludwig, Leibniz Institute for Zoo and Wildlife Research (LG), GermanyReviewed by:
Daniel W Foerster, Leibniz Institute for Zoo and Wildlife Research (LG), GermanyJakub Skorupski, University of Szczecin, Poland
Copyright © 2025 Scheideman, Ekernas and Swallow. This is an open-access article distributed under the terms of the Creative Commons Attribution License (CC BY). The use, distribution or reproduction in other forums is permitted, provided the original author(s) and the copyright owner(s) are credited and that the original publication in this journal is cited, in accordance with accepted academic practice. No use, distribution or reproduction is permitted which does not comply with these terms.
*Correspondence: Fayelynn Fox Scheideman, ZmF5ZWx5bm5rYXRAZ21haWwuY29t