- Upstream Aquatic Institute, Dover, DE, United States
In recent decades, many jurisdictions have established regulations governing the use of live baitfish in recreational fishing. Live baitfish can originate from either aquaculture farms or wild harvest. Live bait regulations are usually motivated by conservation concerns, such as the role that live baitfish play in the spread of invasive species and aquatic diseases. One barrier that may prevent policy regulation of live baitfish is the fear among policymakers that limiting the use of live baitfish could impact the general public’s interest in fishing. However, conservation policy is hindered by the fact that there is very little research on this concern. In this study, we conduct a before-after control-intervention (BACI) analysis to test whether live baitfish regulations in the United States are followed by changes in recreational fishing. Using data from the 1960s to the present day, we analyze four states that have implemented live baitfish restrictions: Maine, New York, Vermont and Colorado. We find that live baitfish restrictions do not cause a decline in the public’s participation in fishing. Our results can empower policymakers to craft evidence-based regulations on the use of live baitfish for conservation purposes while remaining confident that such policies are not likely to cause any unintended consequences on the recreational fishing community.
Introduction
Recreational fishing is a popular pastime in countries all over the world. People may participate in recreational fishing for many reasons—people may want to catch their own food, to engage with nature, to socialize with other people, to experience a temporary escape, and to experience a sense of accomplishment, among other motivations (Arlinghaus et al., 2021). Since recreational fishing involves an economically, biologically, and socially important use of aquatic resources, recreational fishing has many implications for government policy (Scheufele and Pascoe, 2022).
One area of recreational fishing with important policy implications is the use of live baitfish. In North America, fishers may purchase live baitfish from retail stores, but fishers may also catch live baitfish themselves or use dead or artificial baits (Drake and Mandrak, 2014). The type of bait used may depend on the fisher’s personal preference and the fishing context—for example, many game fishing tournaments prohibit the use of live bait, and live bait may pose a higher risk of gut hooking. The effects of live bait restrictions on recreational fishing are not immediately obvious. On one hand, a moderate proportion of recreational fishers appear to use live baitfish (e.g. 17% in a recent survey in Colorado, USA (Platis and Schisler, 2021); 55% in a recent survey in Ontario, Canada (Hunt et al., 2022)). On the other hand, these fishers use live baitfish as one bait type among many; it is rare for fishers to state that they use live baitfish exclusively (Hunt et al., 2022; Platis and Schisler, 2021).
In this study, we analyze the effects of live baitfish restrictions on recreational fishing. The past half-century has seen a number of statutes and regulations restricting the use of live baitfish. There are a number of states in the United States that have implemented restrictions on live baitfish (Kerr, 2012). Some examples of states with meaningful restrictions are Maine (Me. Stat. tit. 12, § 12461), New York (N.Y. Comp. Codes R. & Regs. tit. 6, pts. 10, 35, 188), Colorado (2 Colo. Code Regs. § 406-1-104) and Vermont (Vt. Code R. 12-010-088). The most common restriction is a prohibition on taking live baitfish and using those baitfish for fishing in a different waterbody—most states allow recreational fishers to catch live baitfish and then use those baitfish within the same body of water from which they were caught. Other states place bans on imports of live baitfish only (Kerr, 2012).
Restrictions tend to be motivated by environmental concerns. The transfer of live baitfish to new water bodies has been a primary cause for the establishment of invasive fish species in the United States (Kerr, 2012; McEachran et al., 2023). The risk of introducing invasive species is highest when baitfish is purchased live from retailers, as this causes baitfish to be farmed or caught in one water body and then used for fishing in a different water body. Fishers may empty bait buckets at the end of fishing trips, exacerbating the risk of introducing invasive species (Kerr, 2012). Recent studies have found that many retail stores in the United States sell live baitfish species known to be invasive (Mulligan et al., 2023; Snyder et al., 2020). Live baitfish may also cause the spread of aquatic viruses, diseases (e.g. parasitic tapeworms), and invasive invertebrates (e.g. spiny water flea) (Kerr, 2012). For example, one study found that the Asian fish tapeworm was widespread in live baitfish sold by retail stores in Michigan (Boonthai et al., 2017). Restrictions in the United States mirror developments in other jurisdictions, including many provinces in Canada and parts of Europe (Gunderson and Tucker, 2000; Kerr, 2012).
The United States is somewhat unique in having a small industry dedicated to producing farm-raised fish for use as live bait. The United States Department of Agriculture reports that, in 2022, there were 320 farms producing baitfish in the United States with a total value of 56 million USD (United States Department of Agriculture, 2024). Production tends to be clustered in a few large farms, with the most important states for the production of live baitfish being Arkansas, Ohio, Wisconsin, and Minnesota (United States Department of Agriculture, 2019).
Production volumes and prices have been declining over time (O’Dierno et al., 2003). The majority of costs experienced by farms are from labor, feed costs, marketing costs, and regulatory costs (Engle et al., 2020; van Senten and Engle, 2017). Many farms that produce baitfish are also involved in other industries, such as sportfish production (Van Senten et al., 2018). Baitfish are typically sold for between 4 and 10 USD per pound, depending on species, size, and time of year (Mcintosh, 2010). Baitfish can pass through multiple market stakeholders before finally reaching retail sale to customers for use in fishing (Mcintosh, 2010; O’Dierno et al., 2003). The most common species include fathead minnows (Pimephales promelas) and golden shiners (Notemigonus crysoleucas), plus a smaller number of fish from other species (McEachran et al., 2022; Mcintosh, 2010; United States Department of Agriculture, 2019). The industry focuses on freshwater baitfish for use in freshwater fishing, though some farms produce saltwater species for use in marine fishing.
A key question surrounding this policy debate is whether a restriction on live baitfish could impact the public’s interest in recreational fishing (e.g. Copping, 2007). This question is relevant for three reasons. Firstly, states may place an intrinsic value on promoting fishing as a recreational activity. Secondly, state fisheries agencies often obtain revenue from the sale of fishing licenses. Thirdly, the number of fishing licenses sold in a state is used by the federal government to apportion, for that state, a particular share of the federal Wildlife and Sport Fish Restoration funding (Fish and Wildlife Service, 2024).
Therefore, it would be beneficial for state policymakers to know whether a ban on live baitfish could be expected to impact the public’s interest in fishing. Despite the importance of this question, there has been basically no sophisticated analysis of whether live baitfish restrictions could impact the public’s interest in fishing. A couple of studies have attempted to answer this question. One study concluded that there was no impact of baitfish regulations on license sales—however, this study was limited to Maine and was only able to use data up until 1991 (Frost and Trial, 1993). Another study concluded that the number of baitfish dealer licenses exhibited no statistical relationship with the number of anglers (Parker, 2021). This study was more recent, but it was also limited to Maine. This means that we are lacking information on most of the states that have implemented baitfish restrictions, especially since the turn of the century. In this paper, we address this knowledge gap by conducting a statistical analysis to untangle the effects of live baitfish restrictions on the public’s interest in fishing.
Methods
Statistical modeling
How can we detect whether a live baitfish restriction affects interest in fishing? There are two possible effects of a live baitfish restriction. One possibility is that a live baitfish restriction could cause a sudden, discrete change in fishing. Another possibility is that a live baitfish restriction could cause a gradual change in fishing over time—that is, a change in the trend of fishing. Furthermore, previous research has shown that the per-capita interest in fishing has decreased over time in many Western countries as other recreational activities have become available (Arlinghaus et al., 2021). This means that we need to detect any changes against this pre-existing background trajectory.
The statistical model that is appropriate is a before-after, control-intervention, paired series (BACIPS) model. A review of BACIPS models is given by Wauchope et al. (2021). Specifically, we use the model published as equation 4 in section S3 of that paper’s Supplementary Material.
This model uses a time series of some outcome variable across two groups: an intervention group and a control group. The time series is separated into “before” and “after” the policy change that we are interested in. This way, we can measure whether the outcome variable responds to the policy change in a way that cannot be explained by background changes. We can also distinguish between immediate and longer-term effects of the policy change—the parameter β[BA*CI] represents the immediate effect of the policy change, while the parameter β[BA*CI*T] represents the effect of the policy change on the long-term trend. We conduct the analysis in the statistical programming software R (R Core Team, 2020), using the packages ggplot2 (Wickham, 2016) and sjPlot (Lüdecke, 2021) to visualize our results.
In our case, we use annual data on fishing interest—the intervention group contains a state that has implemented a baitfish restriction in a particular year, and the control group contains the states in the surrounding region that did not implement such a ban. For example, if we want to examine the impacts of New York’s live bait restriction in 2007 (Figure 1B), then our intervention group is New York; our control group is other states in the Northeast region of the United States; and our time series is separated into before 2007 and after 2007. In a minority of geographic locations, there are modest fluctuations in the historical license data. For example, fluctuations are visible around the year 1990 in Vermont (Figure 1C) and the West region (Figure 1D). The former may be attributable to demographic change, as there were no major management reforms relating to Vermont’s recreational fishing licenses around 1990, but there was a sharp increase in urban population sizes in Vermont between 1980 and 1990 (U.S. Census Bureau, 2012; Vermont General Assembly, 2024). The latter may relate to a series of largely administrative changes in California license regulations in the late 1980s (California Department of Fish and Wildlife, 1999). Visual inspection reveals no meaningful differences in trends near the time of the live bait regulations studied here.
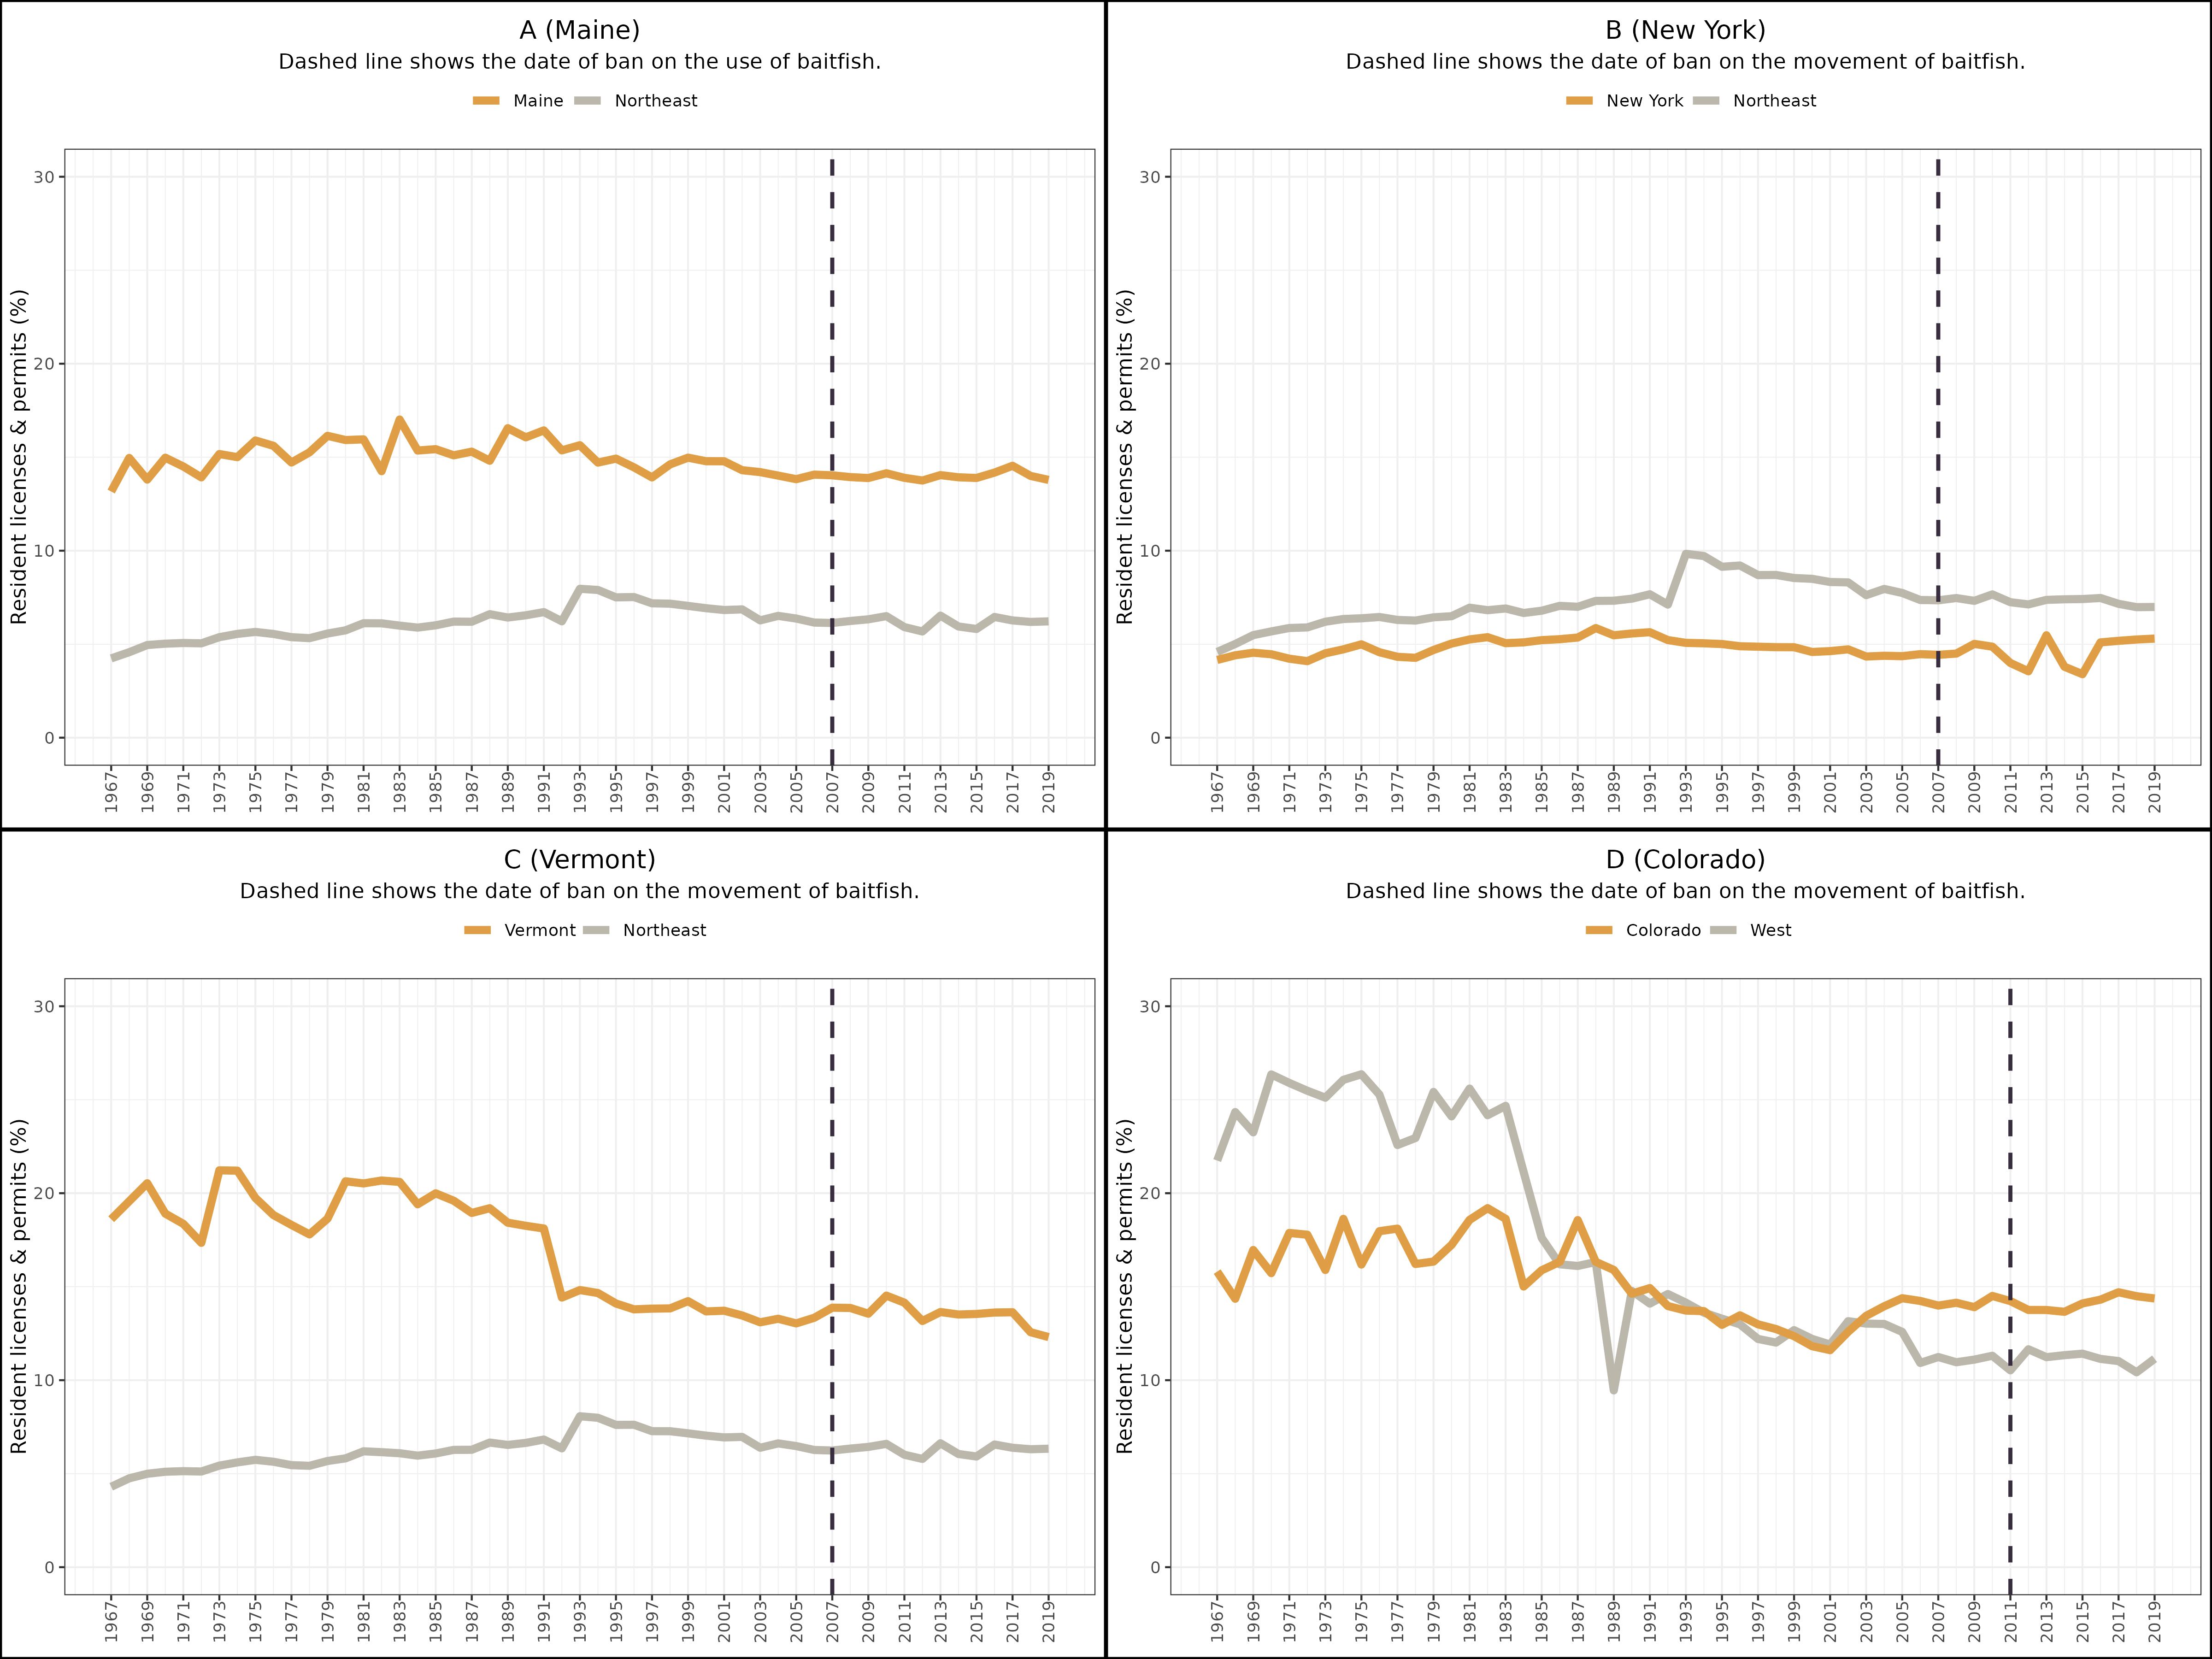
Figure 1. Trends in paid fishing licenses over time in four key states (A: Maine; B: New York; C: Vermont; D: Colorado) with restrictions on live baitfish (gold line) compared to other states in each region (gray line). Trends are expressed as a percent of the human population. Vertical dashed lines show the year in which a state’s live baitfish regulation was established. Data: United States Fish and Wildlife Service (2024).
We conduct a separate statistical analysis on all four states that have implemented restrictions on the use or movement of live baitfish, as long as those restrictions were implemented within the date range of our data. These states are Maine (2007) (Figure 1A), New York (2007), Vermont (2007), and Colorado (2011). We exclude states whose baitfish restrictions were implemented before the beginning of our dataset—Alaska (1960), Idaho (1947), Oregon (1940s), Minnesota (1927), Utah (1956), and Washington (1948). We also exclude the numerous states that have implemented import bans only, as an import ban would presumably have less impact on the day-to-day behavior of recreational anglers and would therefore be more difficult to detect statistically.
Data sources
As a measure for recreational fishing participation, we use data on the number of fishing licenses. Specifically, we obtained data on two variables:
● “Paid fishing license holders”, which we use as a measure of the revenue that state fishing agencies obtain from fishers.
● “Resident fishing licenses, tags, permits and stamps”, which we use as a measure of the general public’s engagement in recreational fishing in a particular state.
Both variables are reported by state and year, with data from most states ranging from 1961 to 2021. The dataset is available for public download from the United States Fish and Wildlife Service via Amazon Quicksight (Fish and Wildlife Service, 2024). We inspected the data and removed a single outlier, which was clearly indicative of an administrative error (Vermont in 1970). Note that we express the data in terms of the year in which a license was issued, which is two years before the apportionment year (as expressed in the original dataset) (Fish and Wildlife Service, 2024).
The population of the United States has changed dramatically since the 1960s. To account for this, we express both of our variables as “per capita”—that is, divided by the number of people living in a particular state in a particular year. To convert our variables to per-capita, we obtained data on the United States human population. This dataset is made publicly available on Github by Tauberer (2020), which fetches and aggregates data on the annual population estimates originally estimated by the United States Census and published by the Federal Reserve Bank of St. Louis. This data gives annual estimates of the population of each state from 1900 to 2020.
We note that we do not correct for multiple comparisons. In the scientific community, opinions vary about whether or how to correct for multiple comparisons (Barnett et al., 2022; Greenland, 2021; Midway et al., 2020). For our analysis, we retain the standard significance threshold of 0.05—this allows us to decrease the risk that we fail to detect a real relationship, at the expense of increasing the risk that we “detect” a relationship that does not exist in reality. This is the most appropriate choice for our specific research question; if live baitfish restrictions indeed have an impact on the public’s engagement in recreational fishing, this is a relationship that the relevant stakeholders for this analysis (i.e., policymakers) ought not to miss (Barnett et al., 2022; Greenland, 2021). To address the higher risk of false positives, we simply note any findings we detect that are on the threshold of statistical significance, as these are the findings for which correcting for multiple comparisons would cause us to draw different conclusions.
Results and discussion
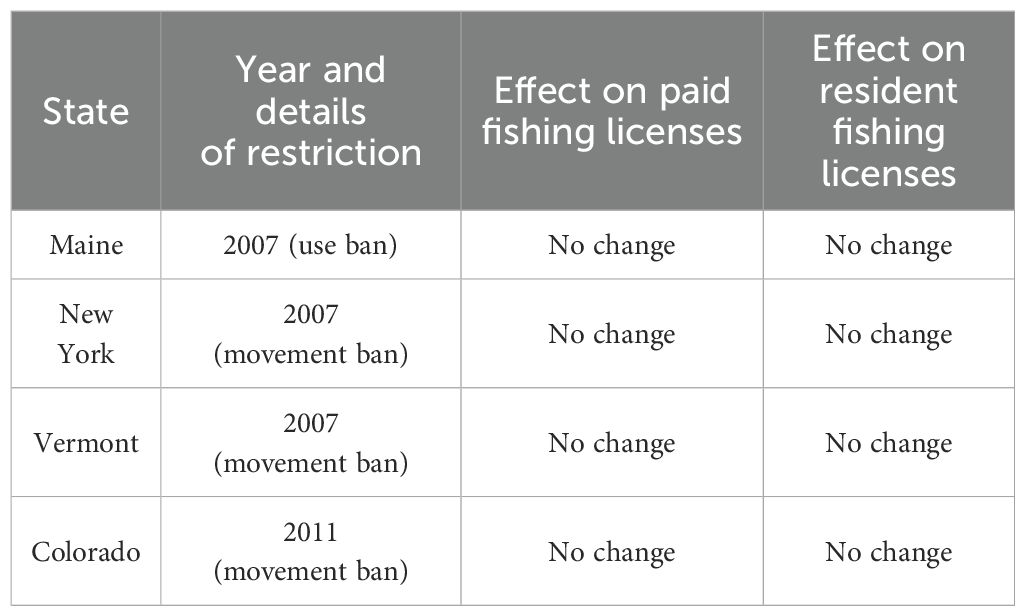
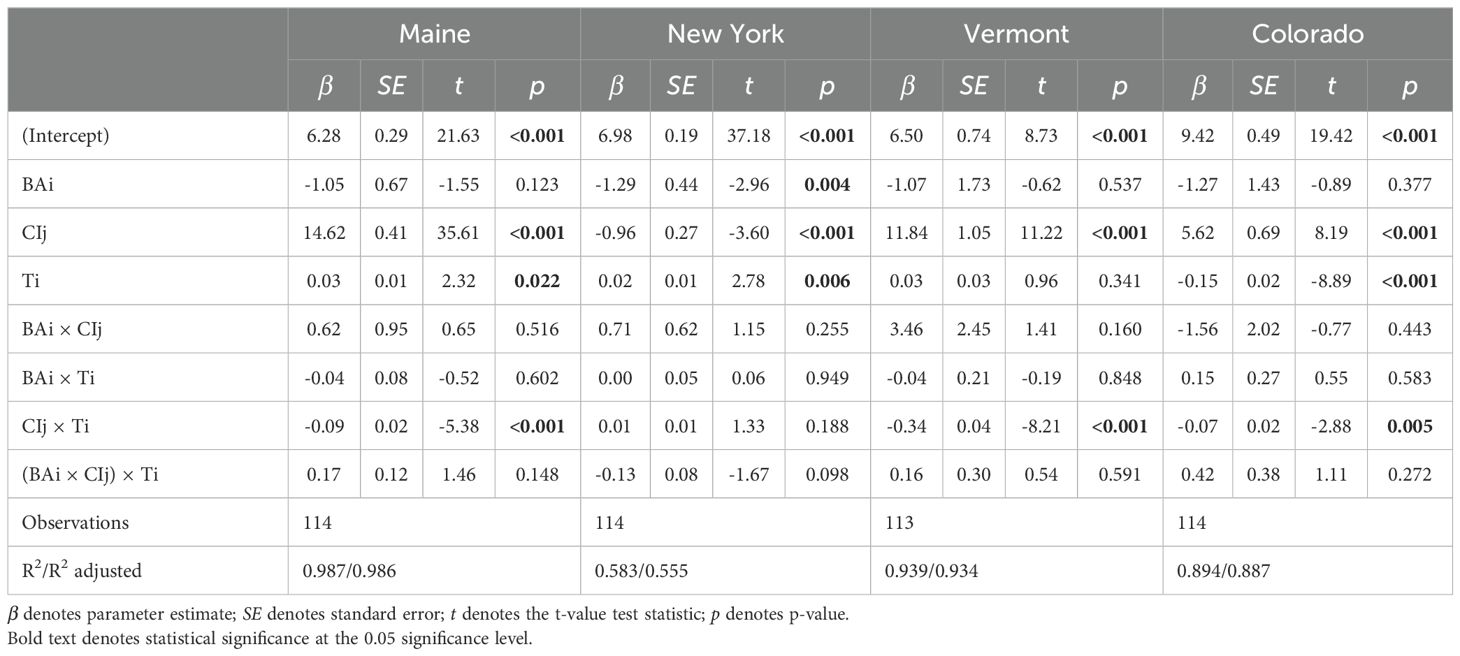
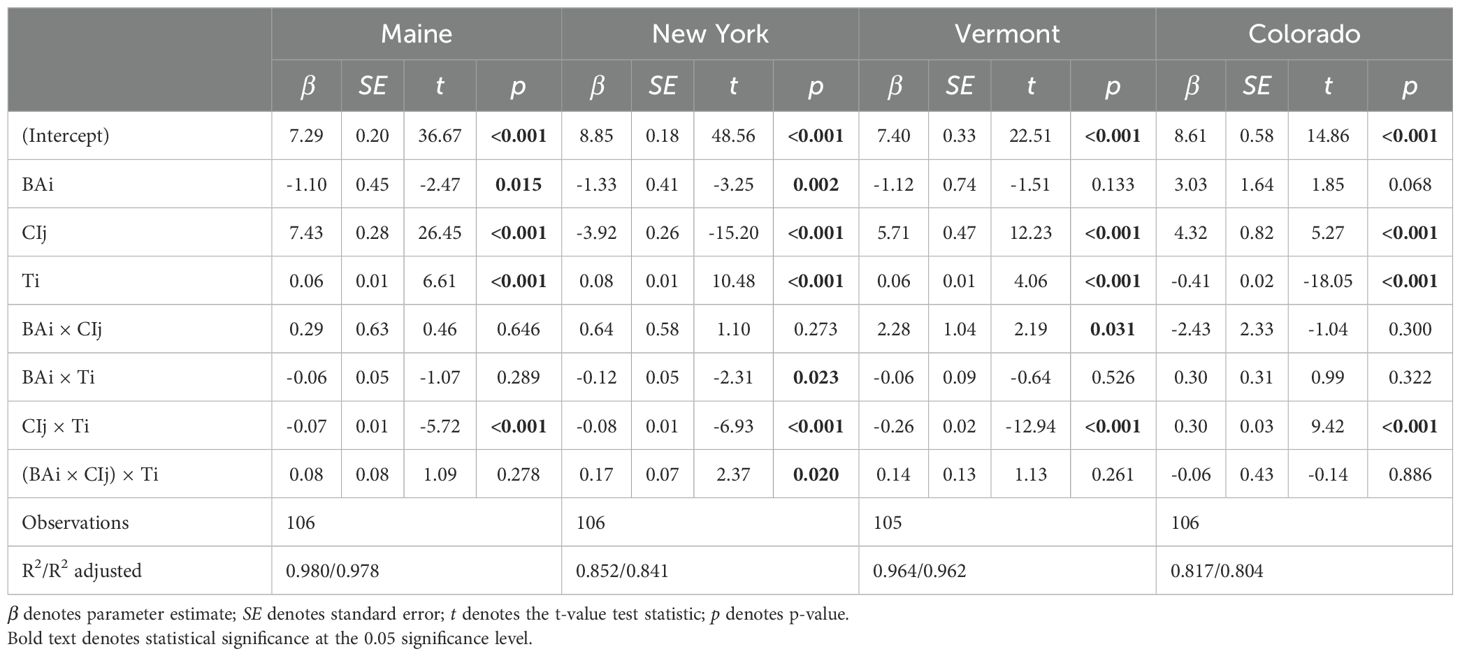
Our analysis shows that live baitfish restrictions have no detectable impact on the public’s engagement in recreational fishing (Table 1, Figure 2). This was true for both paid licenses and residential licenses and permits.
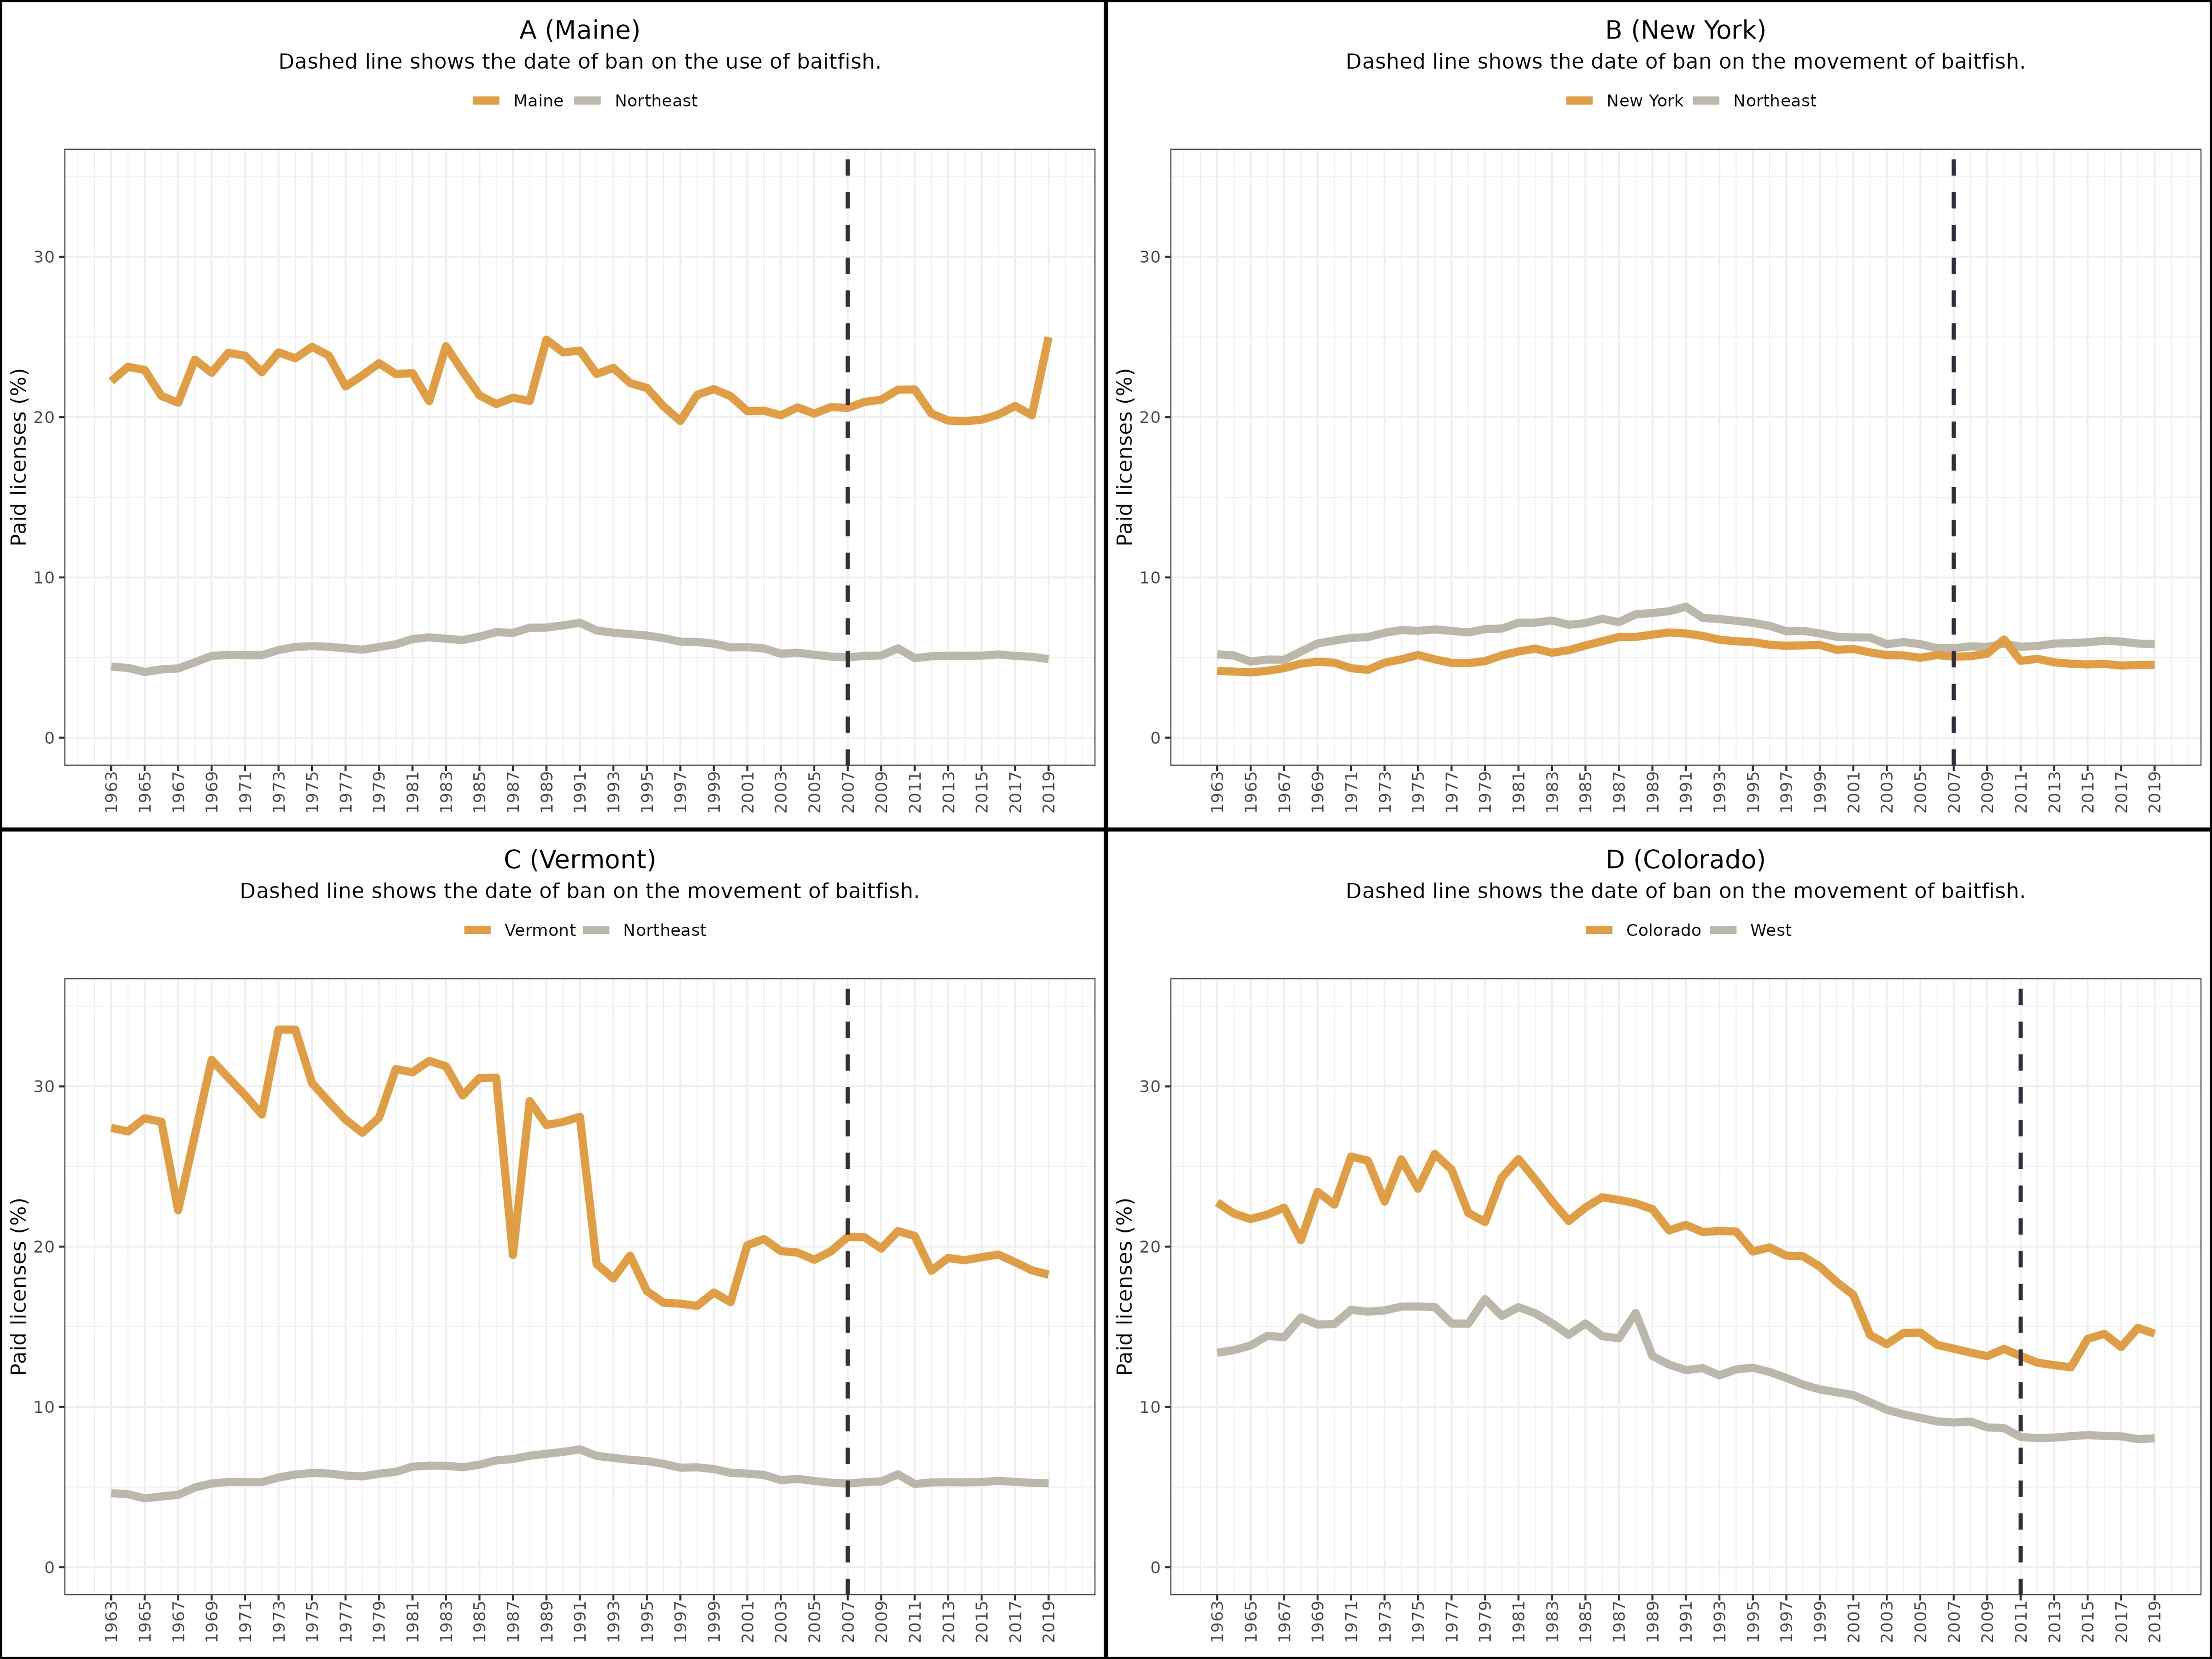
Figure 2. Trends in resident fishing licenses, permits, tags, and stamps over time in the four key states (A: Maine; B: New York; C: Vermont; D: Colorado) with restrictions on live baitfish (gold line) compared to other states in each region (gray line). Trends are expressed as a percent of the human population. Vertical dashed lines show the year in which a state’s live baitfish regulation was established. Data: United States Fish and Wildlife Service (2024).
For paid licenses, every state’s regression model showed no significant effect of the live baitfish restriction on the percentage of people who held paid licenses (compared to other states in that region) (Table 2). No state showed a meaningful change after the live baitfish restriction was implemented, whether immediately (table row BAi × CIj) or in the long-term trend (table row BAi × CIj × Ti).
Likewise, for residential licenses/permits, every state’s regression model showed no significant effect of the live baitfish restrictions on the percentage of people who held licenses (Table 3). Here too, no state showed a meaningful change after the live baitfish restriction was implemented, whether immediately (table row BAi × CIj) or in the long-term trend (table row BAi × CIj × Ti). There are two possible exceptions. For New York, the regression model estimates that there was a 0.12% decrease in the number of residents who held licenses/permits after the baitfish regulations (table row BAi × CIj). The model also estimates that this was followed by a 0.17% increase each year after the regulations (table row BAi × CIj × Ti). Likewise, for Vermont, the analysis estimates that the live baitfish regulations were associated with a 2.28% increase in the residential license/permit holders each year after the regulations (table row BAi × CIj × Ti). However, all three of these parameters had associated p-values that were very much on the threshold of significance (p = 0.023, 0.02, and 0.031 respectively). Had we corrected for multiple comparisons, these estimates would have been non-significant, indicating that these specific estimates may simply be a statistical artifact.
As such, the overall conclusion that can be drawn from our analysis is that live baitfish restrictions have no detectable impact on the public’s engagement in recreational fishing. This lends credence to the findings of earlier state-specific studies, which also concluded that live baitfish regulations do not seem to impact the public’s engagement in recreational fishing (Frost and Trial, 1993; Parker, 2021). This finding is reasonable given the trends in baitfish use typically observed in surveys of recreational anglers. While the proportion of fishers who use live baitfish is reasonably high (e.g. 17% in Colorado, USA and 55% in Ontario, Canada), fishers overwhelmingly report using multiple bait types rather than live baitfish exclusively (Hunt et al., 2022; Platis and Schisler, 2021). It is possible that fishers faced with a new live bait restriction simply switch to other types of bait, which would explain the lack of an effect of restrictions on total recreational fishing activities as documented in this study.
Our results are subject to the usual caveats and limitations that apply to all studies like ours. The biggest caveat is that our data, like that of any similar policy study, is observational. Some disciplines such as medicine can use experimental trials to establish the effects of a particular policy on some relevant outcome variable (e.g. O’Donoughue Jenkins et al., 2016). However, in economics and resource policy, observational data from “natural experiments” are often the best available source of information (e.g. Eicher and Schreiber, 2010). We advise caution when attributing causation to any particular policy on the basis of data like ours. In fact, there is one reason that might confound our analysis—three of the four baitfish restrictions in our dataset were motivated by viral hemorrhagic septicemia (VHS). It is conceivable that public concern about VHS might have suppressed interest in recreational fishing independently of any effect on baitfish. However, if VHS does indeed confound our data, then it is likely to push our analysis towards detecting an effect of baitfish regulation—that is, public concern about VHS would cause false positives in our analysis. Thus, the fact that we did not detect any effect of baitfish restrictions on recreational fishing is unlikely to be confounded by the presence of VHS.
Another limitation with our study is that we assume that the best “control” group for a particular state contains all other states in the region of the United States (e.g. for New York, all other states in the Northeast). We maintain that this is the most appropriate choice, given the available data—indeed, this method has been applied in other studies on agricultural and resource economics (Carter et al., 2021). However, we cannot rule out the possibility that there might be state-specific differences that are not accounted for by using nearby states as the control group.
Rigorous evidence can empower legislators and regulatory agencies to ensure that aquatic ecosystem management and policy is based on the best available science and a belief in the possibility of positive change (Esch et al., 2018; McAfee et al., 2019; Ryder et al., 2010). In this study, we have provided the best available evidence on the effects of live baitfish regulations on public engagement in fishing. We anticipate that the evidence and analysis provided in this study will empower policymakers to craft sound, evidence-based regulations on the use of live baitfish in the United States.
Data availability statement
The original contributions presented in the study are included in the article/supplementary material. Further inquiries can be directed to the corresponding author.
Author contributions
VD: Conceptualization, Formal Analysis, Methodology, Writing – original draft, Writing – review & editing. AH: Conceptualization, Formal Analysis, Methodology, Writing – original draft, Writing – review & editing.
Funding
The author(s) declare that no financial support was received for the research, authorship, and/or publication of this article.
Conflict of interest
The authors declare that the research was conducted in the absence of any commercial or financial relationships that could be construed as a potential conflict of interest.
Publisher’s note
All claims expressed in this article are solely those of the authors and do not necessarily represent those of their affiliated organizations, or those of the publisher, the editors and the reviewers. Any product that may be evaluated in this article, or claim that may be made by its manufacturer, is not guaranteed or endorsed by the publisher.
References
Arlinghaus R., Aas Ø., Alós J., Arismendi I., Bower S., Carle S., et al. (2021). Global participation in and public attitudes toward recreational fishing: international perspectives and developments. Rev. Fisheries Sci. Aquaculture 29, 58–95. doi: 10.1080/23308249.2020.1782340
Barnett M. J., Doroudgar S., Khosraviani V., Ip E. J. (2022). Multiple comparisons: To compare or not to compare, that is the question. Res. Soc. Administrative Pharmacy: RSAP 18, 2331–2334. doi: 10.1016/j.sapharm.2021.07.006
Boonthai T., Herbst S. J., Whelan G. E., Van Deuren M. G., Loch T. P., Faisal M. (2017). The Asian fish tapeworm Schyzocotyle acheilognathi is widespread in baitfish retail stores in Michigan, USA. Parasites Vectors 10. doi: 10.1186/s13071-017-2541-6
California Department of Fish and Wildlife (1999). “Department of Fish and Game celebrates 130 years of serving California,” in Outdoor California. Sacramento, CA, California: Department of Fish and Wildlife. Available at: https://wildlife.ca.gov/Publications/History.
Carter C. A., Schaefer K. A., Scheitrum D. (2021). Piecemeal farm regulation and the U.s. commerce clause. Am. J. Agric. Economics 103, 1141–1163. doi: 10.1111/ajae.12104
Copping J. (2007).Anglers fear ban on “cruel“ live bait will spread. Telegraph. Available online at: https://web.archive.org/web/20070110054707/http://www.telegraph.co.uk/news/main.jhtml?xml=/news/2007/01/07/nangle07.xml. (accessed November 13, 2024)
Drake D. A. R., Mandrak N. E. (2014). Ecological risk of live bait fisheries: A new angle on selective fishing. Fisheries 39, 201–211. doi: 10.1080/03632415.2014.903835
Eicher T. S., Schreiber T. (2010). Structural policies and growth: Time series evidence from a natural experiment. J. Dev. Economics 91, 169–179. doi: 10.1016/j.jdeveco.2009.05.003
Engle C. R., Kumar G., van Senten J. (2020). Cost drivers and profitability of US pond, raceway, and RAS aquaculture. J. World Aquaculture Soc. 51, 847–873. doi: 10.1111/jwas.12706
Esch B. E., Waltz A. E. M., Wasserman T. N., Kalies E. L. (2018). Using best available science information: determining best and available. J. Forestry 116, 473–480. doi: 10.1093/jofore/fvy037
Fish and Wildlife Service (2024). Fishing Licenses, Holders, and Costs by Apportionment Year (Washington, DC: Amazon QuickSight). Available at: https://us-east-1.quicksight.aws.amazon.com/sn/accounts/329180516311/dashboards/602cf050-6e11-4da5-9917-7229fd08648b/sheets/602cf050-6e11-4da5-9917-7229fd08648b_6af87d82-d05b-429c-8723-8ce03fa38df3.
Frost F. O., Trial J. G. (1993). Factors affecting baitfish supply and retail prices paid by Maine Anglers. North Am. J. Fisheries Manage. 13, 586–593. doi: 10.1577/1548-8675(1993)013<0586:FABSAR>2.3.CO;2
Greenland S. (2021). Analysis goals, error-cost sensitivity, and analysis hacking: Essential considerations in hypothesis testing and multiple comparisons. Paediatric Perinatal Epidemiol. 35, 8–23. doi: 10.1111/ppe.12711
Gunderson J. L., Tucker P. (2000). A White Paper on the Status and needs of Baitfish Aquaculture in the North Central Region (Ames, IA: North Central Regional Aquaculture Center).
Hunt L. M., Ball H., Ecclestone A., Wiebe M. (2022). Selected results from the 2020 recreational fishing survey in Ontario (Peterborough, ON: Science and Research Branch, Ministry of Natural Resources and Forestry, Ontario). Available at: https://www.ontario.ca/page/summary-results-2020-recreational-fishing-survey-ontario.
Kerr S. J. (2012). The Management of Bait in Ontario: A Review (Published in Peterborough, ON: Fisheries Policy Section, Biodiversity Branch. Ontario Ministry of Natural Resources).
Lüdecke D. (2021). sjPlot: Data Visualization for Statistics in Social Science. Available online at: https://CRAN.R-project.org/package=sjPlot. (accessed November 13, 2024)
McAfee D., Doubleday Z. A., Geiger N., Connell S. D. (2019). Everyone loves a success story: optimism inspires conservation engagement. Bioscience 69, 274–281. doi: 10.1093/biosci/biz019
McEachran M. C., Mladonicky J., Picasso-Risso C., Drake A. R., Phelps N. B. D. (2023). Release of live baitfish by recreational anglers drives fish pathogen introduction risk. Prev. Veterinary Med. 217. doi: 10.1016/j.prevetmed.2023.105960
McEachran M. C., Mohr A. H., Lindsay T., Fulton D. C., Phelps N. B. D. (2022). Patterns of live baitfish use and release among recreational anglers in a regulated landscape. North Am. J. Fisheries Manage. 42, 295–306. doi: 10.1002/nafm.10747
Mcintosh D. (2010). An Overview of Baitfish Aquaculture in the Northeast (No. NRAC Publication No. 218-2010) (College Park, MD: Northeast Regional Aquaculture Center). Available at: https://citeseerx.ist.psu.edu/document?repid=rep1&type=pdf&doi=1f721afda6b86d0300415aad6083b90c00df490e.
Midway S., Robertson M., Flinn S., Kaller M. (2020). Comparing multiple comparisons: practical guidance for choosing the best multiple comparisons test. PeerJ 8, e10387. doi: 10.7717/peerj.10387
Mulligan H., Schall B. J., Davis T., Coulter A. A. (2023). Opportunities for regional collaboration and prevention: Assessing the risk of the live bait trade as a pathway of invasive species. Biol. Conserv. 287. doi: 10.1016/j.biocon.2023.110342
O’Dierno L., White D. S., Garfield S. (2003). Aquaculture Marketing Analysis and Opportunities in the Northeast Region (College Park, MD: Regional Aquaculture Center (NRAC) Publication).
O’Donoughue Jenkins L., Kelly P. M., Cherbuin N., Anstey K. J. (2016). Evaluating and using observational evidence: the contrasting views of policy makers and epidemiologists. Front. Public Health 4. doi: 10.3389/fpubh.2016.00267
Parker J. (2021). Summary of Inland Commercial Fisheries in Maine (Augusta, ME: Maine Department of Inland Fisheries & Wildlife). Available at: https://www.maine.gov/ifw/docs/Summary%20of%20Inland%20Commercial%20Fisheries%20in%20Maine.pdf.
Platis N., Schisler G. J. (2021). 2020 Colorado Angler Survey Summary Report (Denver, CO: Colorado Parks & Wildlife).
R Core Team (2020). R: A Language and Environment for Statistical Computing (Vienna, Austria: R Foundation for Statistical Computing). Available at: https://www.R-project.org/.
Ryder D., Tomlinson M., Gawne B., Likens G. (2010). Defining and using “best available science”: a policy conundrum for the management of aquatic ecosystems. Mar. Freshw. Res. 61, 821–828. doi: 10.1071/MF10113
Scheufele G., Pascoe S. (2022). Estimation and use of recreational fishing values in management decisions. Ambio 51, 1275–1286. doi: 10.1007/s13280-021-01634-7
Snyder M. R., Stepien C. A., Marshall N. T., Scheppler H. B., Black C. L., Czajkowski K. P. (2020). Detecting aquatic invasive species in bait and pond stores with targeted environmental (e)DNA high-throughput sequencing metabarcode assays: Angler, retailer, and manager implications. Biol. Conserv. 245. doi: 10.1016/j.biocon.2020.108430
Tauberer J. (2020). Historical Population of the U.S. States - Spreadsheet (CSV) (San Francisco, CA: GitHub). Available at: https://github.com/JoshData/historical-state-population-csv.
United States Department of Agriculture (2019). 2018 Census of Aquaculture (No. Volume 3 • Special Studies • Part 2 AC-17-SS-2 ). Available online at: https://www.nass.usda.gov/Publications/AgCensus/2017/Online_Resources/Aquaculture/Aqua.pdf. (accessed November 13, 2024)
United States Department of Agriculture (2024). QuickStats (Washington, D.C.: National Agriculture Statistics Service). Available at: https://quickstats.nass.usda.gov/results/77F26388-4790-380C-8615-BB70C2A35866.
U.S. Census Bureau (2012). Vermont: 2010 Population and Housing Unit Counts: 2010 Census of Population and Housing (Washington, D.C.: U.S. Government Printing Office). Available at: https://www2.census.gov/library/publications/decennial/2010/cph-2/cph-2-47.pdf.
Van Senten J., Dey M. M., Engle C. R. (2018). Effects of regulations on technical efficiency of US baitfish and sportfish producers. Aquaculture Economics Manage. 22, 284–305. doi: 10.1080/13657305.2018.1454539
van Senten J., Engle C. R. (2017). The costs of regulations on US baitfish and Sportfish producers. J. World Aquaculture Soc. 48, 503–517. doi: 10.1111/jwas.12416
Vermont General Assembly (2024). Title 10 Appendix: Vermont Fish and Wildlife Regulations (Montpelier, VT: The Vermont Statutes Online). Available at: https://legislature.vermont.gov/statutes/fullchapter/10APPENDIX/001.
Wauchope H. S., Amano T., Geldmann J., Johnston A., Simmons B. I., Sutherland W. J., et al. (2021). Evaluating impact using time-series data. Trends Ecol. Evol. 36, 196–205. doi: 10.1016/j.tree.2020.11.001
Wickham H. (2016). ggplot2: Elegant Graphics for Data Analysis (New York, NY: Springer-Verlag New York). Available at: https://ggplot2.tidyverse.org.
Keywords: baitfish farming, fathead minnow, golden shiner, impact analysis, recreational fishing, fisheries management
Citation: DeRooy V and Hansen A (2024) Untangling the impact of live baitfish restrictions on recreational fishing participation in the United States. Front. Conserv. Sci. 5:1446550. doi: 10.3389/fcosc.2024.1446550
Received: 10 June 2024; Accepted: 15 November 2024;
Published: 29 November 2024.
Edited by:
Chiara Bragagnolo, Federal University of Alagoas, BrazilReviewed by:
José Oliveira, Federal University of Alagoas, BrazilYifan Lu, Leibniz Association (LG), Germany
Copyright © 2024 DeRooy and Hansen. This is an open-access article distributed under the terms of the Creative Commons Attribution License (CC BY). The use, distribution or reproduction in other forums is permitted, provided the original author(s) and the copyright owner(s) are credited and that the original publication in this journal is cited, in accordance with accepted academic practice. No use, distribution or reproduction is permitted which does not comply with these terms.
*Correspondence: Victoria DeRooy, dmljdG9yaWFAdXBzdHJlYW1hcXVhdGljLm9yZw==
 Victoria DeRooy
 Amanda Hansen