 Peter S. Puskic
 Ross Holmberg
 Rebecca R. McIntosh
- Phillip Island Nature Parks, Conservation Department, Cowes, VIC, Australia
In rapidly changing ocean systems, there is a dual need to engage and educate community members and carry out rapid data acquisition. There is a body of evidence to support community or citizen science projects as successful vehicles for achieving these goals, with a particular need to increase global ocean literacy. The online SealSpotter program is a citizen science initiative aimed at monitoring trends in Australian fur seal (Arctocephalus pusillus doriferus) populations and connecting people to the marine environment. Here we present the findings of five years of monitoring of fur seals using drone surveys counted by citizen scientists via SealSpotter. Over five years, global participants from 23 countries were engaged in counting seals with a focus on the annual breeding season and pup abundance, with an average of 13,479 images and 171,137 seals counted per year. SealSpotter participants presented more conservative (lower) counts than expert counts, however both groups detected similar trends in abundance, emphasizing success of the project aims that included obtaining a precise index of pup abundance; ultimately a more achievable goal than accuracy due to the difficulties in measuring absolute abundance. We reflect on SealSpotter’s accomplishments and highlight the potential for marine citizen science programs as important tools for addressing global ocean literacy needs. The SealSpotter program contributes to our understanding of marine ecosystems through a simple but effective citizen science program.
1 Introduction
Anthropogenic stressors to the marine environment are leading to great uncertainty for marine environments. Climate change impacts include shifts in species abundance, phenology, physiology, and distribution (Hoegh-Guldberg and Bruno, 2010). In the marine environment, climate-driven species redistribution is a pronounced impact of global warming (Pecl et al., 2017), with broad global estimates of between 25–85% of marine species having already shifted in range (Melbourne-Thomas et al., 2021). Linking changes or declines in animal populations with environmental change requires frequently collected and reliable data. Given the number of species and regions that are undergoing change and ideally require monitoring, efficient methods to observe changes and forecast future scenarios are needed (Chapin et al., 2010).
In order to respond to changing ocean systems, scientists, policy makers, and decision makers require rapid acquisition of reliable information. People also need to be connected to the ocean to support the policies and decisions being made such as adaptation policies for planned coastal retreat of developed areas (e.g., The State of Victoria Department of Environment, Land, Water and Planning, 2020). Conservation scientists are therefore faced with two concurrent pressures; the need to gain real-time data, and the need to connect people to the ocean (Kelly et al., 2021; Nash et al., 2022). ‘Ocean literacy’ is broadly used to describe a sense of connectedness and understanding between the community and the ocean (Schoedinger et al., 2010), and while the term has evolved since its inception a decade ago, ocean literacy broadly conceptualizes increased knowledge, awareness, and attitudes to the marine environment (McKinley et al., 2023). Ocean literacy is currently endorsed by the United Nations Ocean Decade, with ‘an Inspiring Ocean’ named as one of the key ocean decade actions currently targeted by the decade initiative (McKinley et al., 2023; Ryabinin et al., 2019). Within the current decade (2021 – 2030) and beyond, an increase in global ocean literacy is being promoted as a means to combat changing marine environments and better protect the ocean (Ellwood et al., 2017; Kelly et al., 2021).
Community or citizen science provides an opportunity to both increase data collection (Brown and Williams, 2019) and foster ocean literacy and connection to the environment (Worm et al., 2021; Kelly et al., 2022b). Ocean education initiatives and citizen science tools can empower people with new skills that may be important towards changing individual and community awareness, behaviors, and activism around ocean issues (Kelly et al., 2023). Many have praised citizen science projects for providing access and experience in the scientific process to the public and for fostering emotional connections to local environments and the ocean (Ellwood et al., 2017; Kelly et al., 2020). Democratizing science through citizen science is an important aspiration; however, research of over 14 million participants in major online citizen science programs identified that 80% of participants were trained in science, therefore it is important to test this goal rather than assume success (Strasser et al., 2019).
The Zooniverse1 is a well-known online citizen science platform that currently supports 90 projects from different disciplines including climate, biology, medicine, astronomy, social science and the humanities. Participants are asked to perform tasks for research projects and many participate in multiple projects, contributing to many noteworthy discoveries including the discovery of new galaxies (Spiers et al., 2019). The sustainability of citizen science relies on maintaining engagement while optimizing projects for scientific outputs, but the high number of citizen science projects available also causes competition for participants and forces developers to consider design flexibility and life expectancy. Understanding the target audience from the community and the tension between engagement and data outputs is critical.
To be successful, citizen science methods must balance functionality to maximize participation, promotion for engagement, and be purpose built to fulfill the research questions by obtaining data of suitable quality; good design, training and researcher engagement are critical (Cox et al., 2015; Brown and Williams, 2019; Spiers et al., 2019; Weiser et al., 2020). Participation may be uneven where a small number of individuals perform a majority of the work; also, retention of experienced individuals is valuable because they are often long-term participants and their increasing skills can improve data quality providing another tension in the sustainability, participant diversity and democratization of citizen science projects (Spiers et al., 2019; Strasser et al., 2023). Citizen science platforms must remain flexible to manage such conflicts and/or be designed with purpose to accurately communicate expectations and limitations for potential participants to ensure transparency.
The combination of emerging technologies such as aerial imaging has been widely adapted to wildlife monitoring programs that use citizen scientists to aid in counting species. Remote sensing technologies, such as the use of Remote Piloted Aircraft (RPA) platforms (or drones) and associated cameras or sensors, are a powerful tool that allow for rapid data acquisition and consistent monitoring. In marine and coastal settings, the use of drones is helping to overcome a number of data collection challenges, such as identifying and sampling marine species (Apprill et al., 2017; Hodgson et al., 2020; Wiley et al., 2023), mapping coastal environments (Ierodiaconou et al., 2022; Pucino et al., 2021), and understanding environmental changes (Yaney-Keller et al., 2019). Drones have seen great success in collecting population data on species that are typically challenging to access, such as marine mammals and wetland and marine birds (Hodgson et al., 2020; Howell et al., 2023). Despite concerns around the disturbance of wildlife from drone flights, best practice guidelines have been identified (Hodgson and Koh, 2016) and drone surveys can still present a less-invasive method than hands-on approaches to population monitoring. Such best practice guidelines include testing localized wildlife sensitivities to drones because they can be species and site specific (Sorrell et al., 2023; Weimerskirch et al., 2018).
In the context of pinniped research, drone surveys have many benefits in addition to more frequent population counts and the provision of precise and reliable abundance data for trends analyses (Hodgson et al., 2018; Wood et al., 2021). They provide a rapid and less invasive method to collect data and reduce occupational health and safety risk to researchers working along rocky coastlines. Drones allow researchers to conduct more frequent surveys of pup numbers over the breeding season, thus overcoming many challenges of studying seals at this time. During the height of pup births, disturbance to the seals could interfere with breeding behaviors and cause young pup mortality through stampedes and it can be difficult to access the site because of aggressive guarding by breeding bull seals (McIntosh et al., 2018). However, drone surveys generate large amounts of imagery data, which presents numerous challenges including accessing sufficient digital storage space and developing efficient data processing workflows. Additionally, when counting thousands of colonially grouped seals, the time commitment required for experts to process the images may be unsustainable, leading to the development of citizen science and artificial intelligence to improve efficiency (McIntosh et al., 2018; Gonzalez et al., 2016; Dujon et al., 2021; Christin et al., 2019). The Australian fur seal (Arctocephalus pusillus doriferus) has seen large fluxes in population and recent declines of over 20% in pup numbers have been reported (McIntosh et al., 2018). Similar to seal populations around the globe, Australian fur seals are under threat from marine-based industry activities (Cummings et al., 2019), climate impacts (McLean et al., 2018), and marine pollution (McIntosh et al., 2015; Taylor et al., 2021). Australian fur seals typically breed on rocky offshore islands, where the numbers of individual animals may fluctuate based on foraging needs and prey availability, or time of year (e.g., breeding season).
Typically, to estimate population size, estimates of pup production are used because they are the only age class all available at one time and one pup represents one breeding female (Berkson and DeMaster, 1985). The methods of estimating pup production are via direct ground counts, capture mark resight (CMR) and aerial surveys by small, piloted aircraft; recently, drones have also been used (McIntosh et al. 2018);. In 2017, on-ground survey methods were compared with counts performed from drone images (Sorrell et al., 2019). This study demonstrated that drone image counts were lower than a CMR because the CMR method is more accurate, being able to estimate all seal pups present at the time of the survey including those under the water or rocks. In comparison, ground counts were less accurate than the drone surveys because they only included pups that were able to be seen at the time of the survey. The drone image counts were higher than ground counts, but lower than CMR because, similar to ground counts, only the pups that could be seen in the images could be counted. Importantly, repeated image counts taken by the drone, performed by different users, resulted in similar estimates of abundance, showing that the method provides precise and reliable results (Sorrell et al., 2019). Precision and accuracy are often used interchangeably, but their distinction is important. An accurate estimate is one that is close to the true population number, yet the true size of open wildlife populations is rarely known (Sutherland et al., 2004). By contrast, precision is a measure of the consistency of replicated estimates irrespective of true population size (Sutherland et al., 2004). Regular, precise counts assist the detection of small-scale population fluctuations and improve confidence in the resulting trends. For population monitoring, a focus on techniques that prioritize precision over accuracy is therefore accepted practice (Sorrell et al., 2019; Sutherland et al., 2004; Hodgson et al., 2016; Wood et al., 2021).
Given the logistic benefits of using drones, the reliable scientific results, and the benefits towards ocean literacy and education, we decided to utilize drone surveys and citizen science for monitoring the fur seals. In 2018, we tested the portal (Sorrell et al., 2019), launching the global online citizen science program called ‘SealSpotter’2 in 2019. Our next goal was to determine whether long-term trends could be measured and how participants engaged with the program in order to remain flexible and sustain engagement. Additionally, to be an authentic citizen science program, SealSpotter needed to succeed independent of expert or researcher counts. This would have the added benefit of providing efficiencies for the scientists so they could focus on analyses and communication of results.
The current SealSpotter project has five main goals: 1) to count abundances of four categories of fur seals: adults-juveniles, live pups, dead pups and individuals entangled in marine plastic debris; 2) to provide annual pup abundance indices to better understand the declines observed for Australian fur seals and capture any change in trends over time; 3) provide an online citizen science collaboration for community benefit and education opportunities; 4) provide labelled images for the development of machine learning and automation processes; and 5) retain a digital library of image surveys that can be revisited for future research projects. Here we provide results that highlight the success of the SealSpotter program in addressing these aims. We report on five years of the program since 2018 and reflect on the success of SealSpotter as a whole, discussing our lessons learned and recommendations for other similar citizen science programs.
2 Methods
2.1 Image collection and processing
Fur seals were counted from photographs taken from an RPA, flown over the area potentially occupied by pups (McIntosh et al., 2018; Sorrell et al., 2019). Image acquisition took place over the breeding season that occurs during the Austral-summer from late October when the first pups were born to early January when the breeding season was finished; with most pups born by mid-December. In this study, survey results were compared by date of survey and may therefore span across years (e.g. December 2017- January 2018).
We used a quadcopter-type RPA equipped with a downward facing camera to count the number of pups, juveniles, and adults in the breeding areas of fur seals at two breeding sites (Figure 1): Seal Rocks (38°30ˈS, 145°10ˈE) and The Skerries (37°45ˈS, 149°31ˈE). These sites were selected as long-term monitoring sites for the SealSpotter program being two of the largest breeding sites for the species, spanning different oceanographic areas of north-central Bass Strait and the East Australian Current respectively, and being amenable to the method (McIntosh et al., 2018; Sorrell et al., 2019). The Skerries is a very remote location and is visited once per breeding season (between mid-December and early January), whereas Seal Rocks is 1.8 km from Phillip Island and is surveyed approximately every 7 - 10 days during the breeding season (late October to early January) resulting in more data for the Seal Rocks site.
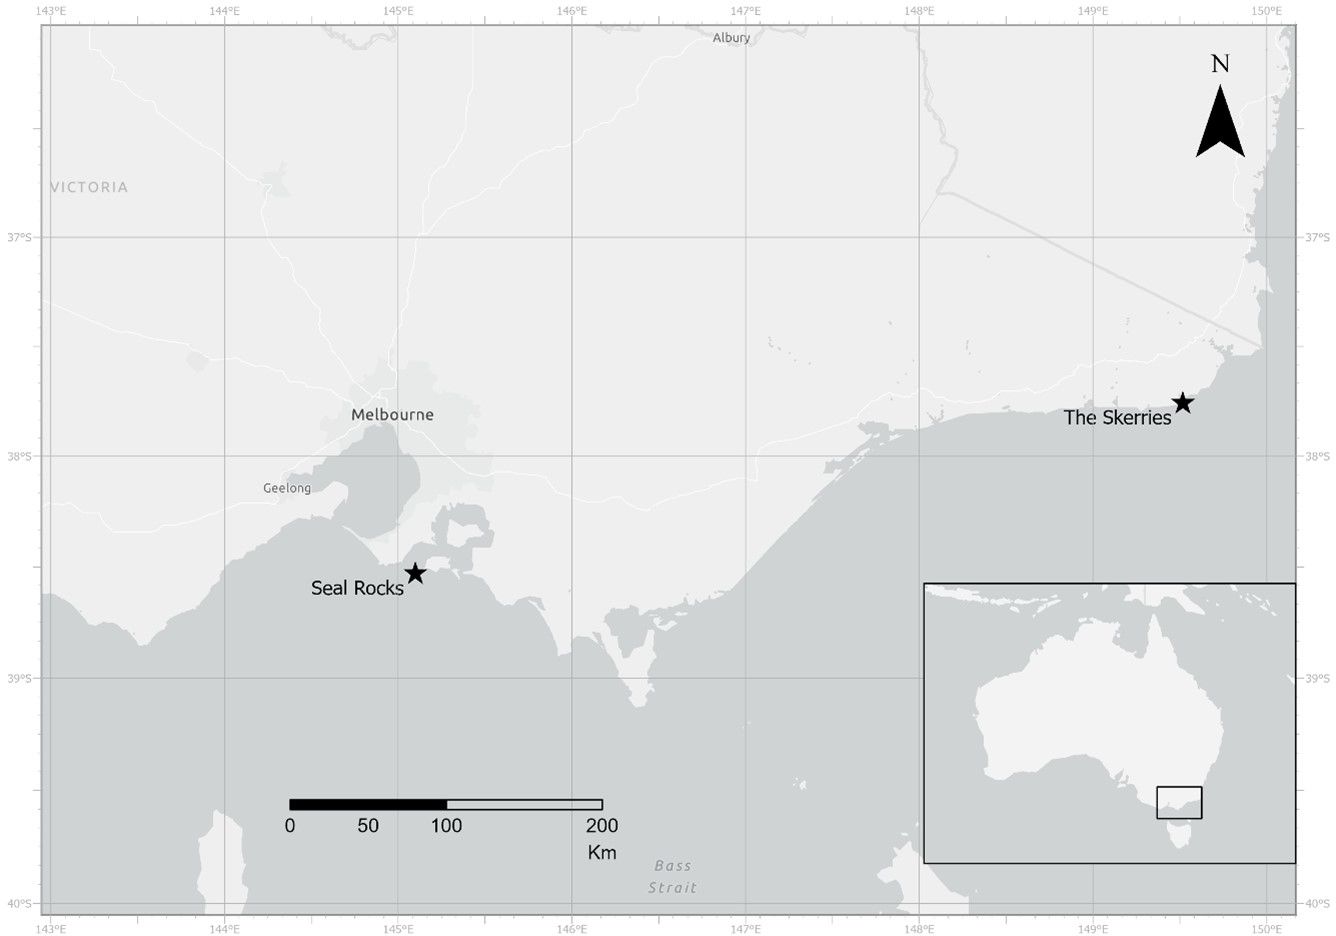
Figure 1. Map of the two Australian fur seal (Arctocephalus pusillus doriferus) breeding sites monitored using aerial imaging taken from drones.
The RPA was flown over the sites at altitudes tested to avoid disturbance while providing sufficient image resolution for pup identification (30-70 m above the seals depending on the topography of the site and the drone size: DJI Phantom 4-Pro (<2kg system) or DJI Matrice 210 equipped with a Zenmuse X7 35mm camera (<7kg system). Surveys were flown by licensed pilots under Ethics and Research permits and the Nature Parks’ Remote Pilot Operators Certificate (ReOC) from the Australian Civil Aviation Safety Authority (CASA).
To increase the distance range for the method when flying visual line of sight, ratifying the CASA regulations for drones in Australia, we adapted the DJI Phantom 4-Pro survey settings (McIntosh et al., 2018; Sorrell et al., 2019) for a DJI Matrice 210 with a Zenmuse X7 camera and 35mm lens for high resolution image quality. The camera faced directly down and the focus was set to infinity for all surveys. For variable light conditions (eg patchy cloud), automatic camera settings were used for adjustment of ISO, white balance, shutter speed, and aperture; where light conditions were more stable (eg even cloud cover or clear sky) manual settings were used to ensure consistent exposure throughout each survey. Side-lap and front-lap were set nominally at 70% to enhance stitching of images, allowing for the complexity of the topography at both sites. A 2-s delay was set between image captures, resulting in air speed during capture of ~7 m/s depending on altitude.
Flights maximized battery time and survey coverage, but also varied slightly depending on the site profile and system in use (lower flight altitudes for smaller Phantom 4-Pro and higher for larger Matrice 210). For Seal Rocks, there are 10 m high plateau areas that have fur seals and seabirds on them, and so the drone is flown at 40-70 m above sea level to avoid collisions and minimize disturbance. At The Skerries, the site is lower, allowing flights of 30-60 m above sea level without observed disturbance to the seals and seabirds breeding and roosting on the sites.
The images were processed using Agisoft Metashape Professional (Version 1.8.4) and a photomosaic image model of the survey area created. The photomosaic was then exported as smaller tiles (1200 x 1000 pixels typically) and loaded into the SealSpotter portal for counting without image overlap. Tile size was selected to maximize zoom and image resolution for ease of counting within the SealSpotter portal.
2.2 Citizen science
The first use of SealSpotter was by Sorrell et al. (2019) who recruited 644 participants in February 2018, mostly within Australia, and opened the portal for one month to count the seals. The online community of the Penguin Foundation3, an initial financial sponsor of the program, helped trial the prototype in May 2018, providing critical feedback to improve the portal that was officially launched 8-23 June, 2019 (more detail in section 2.4).
Citizen scientists counted the fur seals online for 18 separate surveys and outputs were shared via online newsletters twice per year. The citizen scientists were able to email the expert researchers for discussion and to suggest improvements to the portal, as well as present ideas for research topics, making this a true collaboration. Community engagement targets were to capture sufficient participation for reliable results, provide learning opportunities particularly for youth, and achieve global participation.
SealSpotter was promoted without specific budget, through tourism marketing campaigns, social media, radio and print media and through supportive scientific agencies and schools. Participants accessed the SealSpotter website4 online, were asked to register (more detail in section 2.5) and invited to watch a short tutorial video explaining a brief overview of fur seal biology, the purpose of the research and a demonstration of the task they were being asked to complete. They then clicked an acceptance box to agree that the data they provided would be used for research purposes, that their name and contact information if provided would not be shared with third parties and that if they were under 15 years old they needed adult supervision to participate. Once in the main portal, participants would see an image of fur seals on land and would begin counting using the four designated categories, namely Adults and juveniles, Live pups, Dead pups, and Entangled fur seals (Figure 2). Pups were recognized by their lanugo coat (soft dark brown or black birth pelage) and small size; juveniles were recognized as having the same foraging coat as adults but being typically smaller and non-reproductive; these were in the same category as adults because it can be difficult to discern juvenile males from adult females (Figure 2). Originally, we did not separate live and dead pups because the total number of pups represents an equal number of breeding females since they do not have twins; also, we did not want to burden participants with too many categories. However, the citizen scientists requested this change, and we enacted that change. Participants preferred to count live and dead pups separately because some found it emotionally disturbing to pool them; for other participants the preference was driven by gaining more information, specifically to compare the live and dead pup counts over time and identify potential occurrences of disease or unusual mortality events. The two categories were added during processing to provide the total number of pups, a priority metric. Entangled fur seals were those caught in marine plastic debris; typically netting, rope or fishing line.
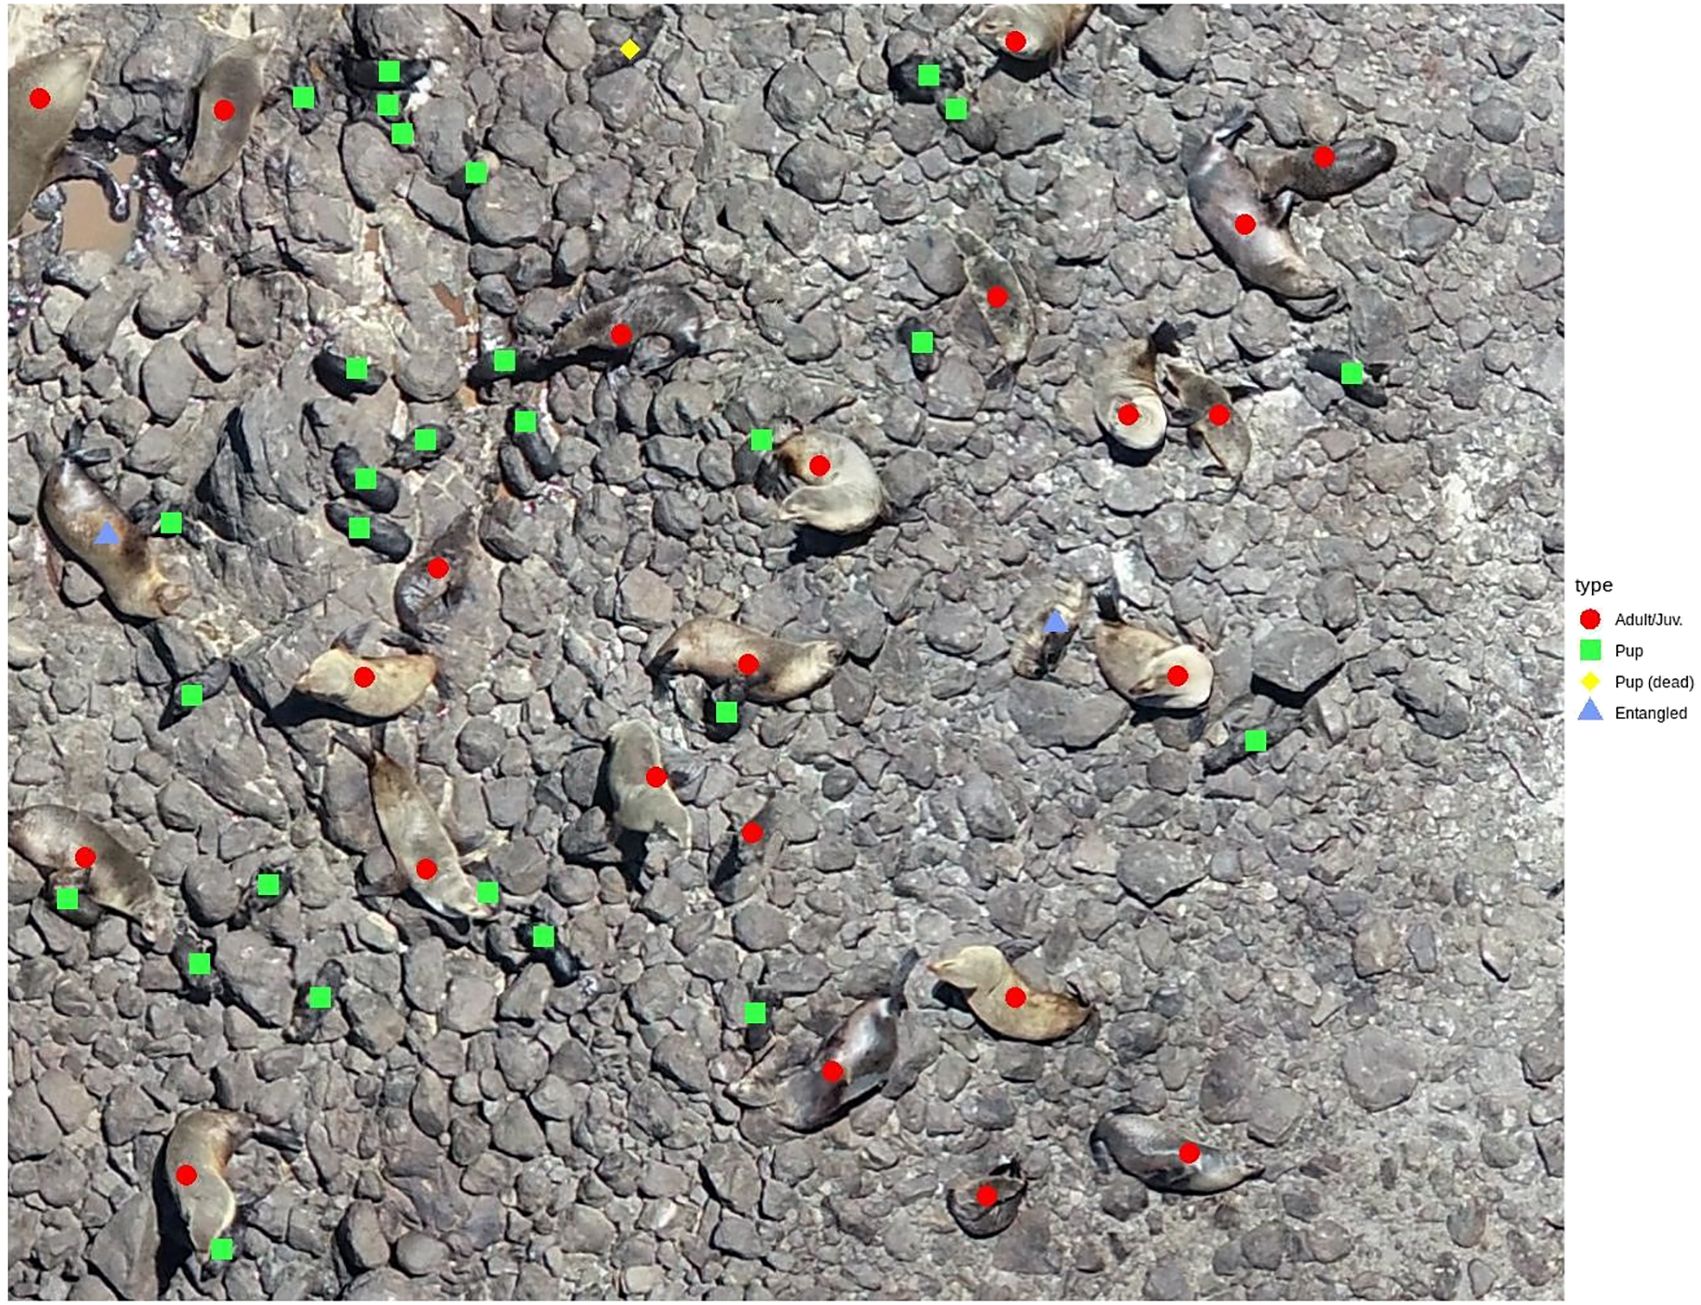
Figure 2. Labelled tiled image from SealSpotter showing the four categories of Australian fur seals counted at Seal Rocks, Victoria by Citizen Scientists around the globe. Color and shapes are used to label the categories of fur seals to include participants with color vison deficiency.
After registration on the SealSpotter portal, each new participant received the same 10 training images which demonstrated the variety of categories and images expected to be counted. These images were not provided in subsequent counting sessions. This also allowed us to recognize whether a computer bot or malware algorithm was attempting to affect the system because nonsense counts could be detected during the analyses workflow and deleted. Once the participants completed the first 10 training images, they progressively received randomly assigned images until they exited the SealSpotter portal or completed the full set. Within the four categories, participants would select the seals they could see and the corresponding colored shape would be placed on the seal (Figure 2). Each unique identification of a seal was assigned an x and y coordinate and a unique time-stamp, providing labelled images for future machine learning development and allowing the data to be mapped (McIntosh et al., 2018; Sorrell et al., 2019).
The lead scientists were able to set the preferred number of replicate image counts for the project, this was set at 10 to maximize participant counts of each image and ensure all images were counted, while balancing the participation of inexperienced and young participants with more skilled participants. This way we balanced inclusion with scientific priorities. Once an image was counted at least 10 times, it was placed at the end of the image library to allow images with fewer counts to be prioritized. If a survey was completed, an uncounted survey was uploaded to maintain participation. Outlier counts of images, classified as greater than 1.5× the standard deviation from the median count (Sorrell et al., 2019), were considered likely unreliable and removed. Remaining counts from each image (3-7 counts per image) were averaged to provide the final count per image, then all images summed to determine the total result per survey and site.
To minimize double counting of seals that partially appear in two images (i.e., on the edges), participants were asked to count the seal when over half of the body was in the image. We considered the common cell biology approach used to avoid double counts of cells when counting through a microscope. In this approach, a hemocytometer overlays the field of view with a lined grid and cell counts are taken separately for each box of the grid (similar to the tiled mosaic of SealSpotter images). To avoid double counting cells that sit on the shared edges of the box, only the cells that touch the upper and left edge of each box are counted. Over the whole grid, all cells are counted without overlap (Chen and Chiang, 2024). However, our goals were to keep the instructions simple as well as limit double counting, which was expected to be minimal particularly given few participants were expected to complete full sets of randomly assigned images, therefore we simply requested participants to count seals if over half the body was in the image.
Cheat sheets were accessible through the portal to help participants perform the tasks and identify the different seal categories accurately. In these images there was a slide bar that moved across the image revealing and hiding labels for seals as determined by an expert (author Rebecca McIntosh - RM). In the main screen, a shading bar was available to lighten or darken images to suit viewer’s preferences for each image and a comment box was provided before the image was submitted to allow people to comment on the image or ask a question. Any questions submitted were answered within two weeks by the lead scientists (RM and Ross Holmberg - RH).
2.3 Expert validation
Expert counts were needed to compare the performance of citizen science counts, and an expert was expected to have an established skill level of high standard. To ensure the expert counts were ‘gold standard’, the counting precision and accuracy of expected expert, RM, was tested. RM participated in all SealSpotter Challenges counting 30,641 image tiles alongside the citizen scientists from 13 complete survey image sets; these counts were identified as ‘regular image counts’. The variability of the ‘expert’s’ image counts was determined from a subset of 105 image tiles, randomly selected from the pool of images that had been counted via the regular method and provided to RM for a second count; identified as ‘randomized image counts’. The randomly selected images were independently assessed by RH for variability in complexity and fur seal density to ensure a representative comparison with typical SealSpotter image tiles. Re-counting a large sub-sample of randomly selected images was considered a better method than counting fewer images more times because it reduced the effect of image recognition, where unique images may be remembered by the counter, which could improve repeat counts.
A linear model was used to plot the randomized image counts against the regular image counts and the prediction intervals were calculated at the 95% confidence level (not the 95% confidence interval of the expected value because it would be too narrow) based on the count comparison to reflect the random effect of the data. Since the line of perfect match (slope = 1 and intercept = 0) sits in the middle of the interval, the expert status was justified if the counting was consistent at each comparison subject to a residual standard error of less than five pups per image.
Finally, counts performed by an expert (RM) were regressed against the average final citizen scientist count (excluding the expert count) for the total pup category (live pups + dead pups) per survey date and site. We then performed a one-way, unpaired t-test of the means of both counts. All statistics were performed using the ‘R’ programming language (version 4.2.3) (R Core Team, 2018). Supplementary Materials are identified by an ‘S’ in front of the figure number.
2.4 The SealSpotter Challenge
To improve engagement in the SealSpotter portal (which can be accessed at any time), and ensure prioritized breeding season surveys were successfully counted, the Annual SealSpotter Challenge was developed. This maximized success by satisfying different preferences of participants via two available experiences – one short term and the other continuous. A SealSpotter Challenge lasts two to three weeks, and typically involves counting seals from three to four surveys taken during the breeding season: one from The Skerries and up to three from Seal Rocks.
We tested the best approach in May 2018 when working with the Penguin Foundation and found that most participants preferred an end date for participation; they didn’t like an indefinite end date because it caused a feeling of burden for participation. In contrast, a short time-window provided a feeling of achievable participation with the positive benefits of contributing to conservation, and the forward focus of having an event to look forward to in the following year. This method was also loosely based upon the Aussie Bird Count by Birdlife Australia5. But the preference for the challenge was primarily driven by the citizen scientists themselves. Citizen science projects in Zooniverse have also identified that a scarcity of data and the release of data subsets has been associated with sustained volunteer engagement (Spiers et al., 2019). Such an approach is suited to SealSpotter because the scientific purpose is to monitor annual breeding events. For the participants who engaged regularly, the portal is open all year and additional surveys are uploaded by the scientists when notified by participants that they have finished an image set. Annual Seal Spotter Challenges occurred in June 2019, April 2020, May 2021 and June 2022, and an additional Challenge was promoted specifically for Melbourne, Australia, in response to the Covid-19 lockdown in Aug 2020.
2.5 Participant summary
When registering to participate, people could volunteer broad personal information including age class (<25, 25-50, >50), location (country, state or city), their wildlife monitoring experience (none, some, lots) and an email address if they wanted to receive annual newsletters reporting the results and project progress. Broad age categories were used to protect young people online and followed best practice guidelines for cyber security based upon social media requirements. This included an agreement for Phillip Island Nature Parks to use the data provided in the portal for scientific purposes, not share personal information with a third party and an agreement to maintain user anonymity unless permission was provided otherwise, in which case the person would be contacted directly to ask for permission.
People may register out of curiosity but not actively participate in the counting (Strasser et al., 2023), therefore registration and active participation at a given time were reported from December 2017 to May 2023. The different registered age classes, self-designated skill level, and country or continent were also collated. De-identified participant image counts and active number of participants were determined per month to explore patterns in participation, and the cumulative unique image count determined. The number of image counts were grouped in bins by year to examine annual effort by participants and a Lorenz curve calculated of cumulative images counted and cumulative unique participants to gauge proportional effort (Strasser et al., 2023). A stratified plot of the number of users that contributed at least one image count was created to visualize the effort over time and multi-year participants.
Counting ability or accuracy, compared to the expert (RM), was tested for the adult and juvenile age-class, total pup counts (live + dead), dead pup count and entanglement count. Because of the difficulties in identifying marine debris entanglements and distinguishing live from dead pups, we expected the dead pup and entanglement counts to be low per image and less reliable as raw data, requiring further quality checks and analyses separate to this research. Using the expert image counts as the reference or “true” count and removing zero counts, a single data point for a reference count (slope = 1 and intercept = 0) was derived from all images with the same reference seal count. Using adult-juvenile data as an example, an initial list was created of all images counted by the expert and the number of adult-juvenile seals in each of them. Then, all images that were inside the list and counted by participants were selected. Lastly, we grouped the images by the reference count; for example, if three images had expert counts of 27 adult-juvenile seals in them, the corresponding participant counts from those three images were used to identify the mean and standard deviation values for the participants as comparisons and a smooth line was plotted through the means using the default “geom_smooth()” function that uses a local polynomial regression with a degree of 2 (y = ax + bx^2 + c) to fit the data.
The effect of individual participant experience, measured by effort over time and age group, was then explored using box plots of their R-squared values. These values were derived by treating the expert seal count in all images as the dependent variable, and participant counts as predictions or a set of random observations (the “model”). In this method we evaluated how well a participant (or “model”) can predict observations using the R-squared value. If a participant makes a perfect prediction, i.e. all counts matched the expert counts, the value is 1. If a user makes random guesses based on the count distribution, the value is 0. If a user makes a random guess based on some arbitrary distributions, the value is negative. We expected that more experience and higher age classes would result in counts more similar to the expert reference.
The SealSpotter Challenge participant that counted the most images was offered an “Adopt a Seal” package from the Penguin Foundation6 as a prize for their effort. In 2018 the lead participant declined physical prizes such as merchandise or soft-toys due to sustainability practices and a lack of interest in consumerism, leading to the symbolic and educational opportunity to adopt a seal.
At the end of each challenge, we provided newsletters to all participants, detailing the results of each challenge in context with previous years, information on the participation and any open-source publications resulting from the project at that time. Participants that counted over 1,000 images each year were highlighted in the newsletter for their achievements if they agreed to be acknowledged.
Finally, emailed feedback from SealSpotter participants was encouraged via the newsletters to capture motivations and experiences of taking part in SealSpotter. Such information was used to help improve the experience and the portal. We collated common terms and words sent in emails received from participants. Using the R programming language with the packages “tm”, “wordcloud” and “worldcloud 2” to remove numbers, punctuation, irrelevant and filler terms. We then counted the frequency of terms and visualized frequent words (appearing more than twice in responses) as a word cloud.
3 Results
3.1 Participant summary
We saw global participation in the annual SealSpotter Challenge, with participants from 15 to 93 countries from every continent. Only Australia was targeted in 2018, then participants from 25, 37, 93 and finally 15 countries were engaged between 2019 and 2021. Over 10 school, university and youth programs were engaged to participate in SealSpotter Challenges or used data from SealSpotter to teach ecology, mathematics or geography.
A total of 3,879 people registered from 2018 – 2022, which included 2,833 individual active participants counting a total of 381,827 images including replicates and 55,614 unique images (Supplementary Figure S1). For each SealSpotter Challenge, participants counted an average total of 13,479 images and 171,137 seals per annual event. Of the registrations that disclosed their experience level, for all years (2018 – 2022), the majority were new to SealSpotter and/or new to counting animals from drone images, having had no previous experience. We observed a spike in registration during 2020, likely caused by multiple SealSpotter Challenges during Covid-19 lockdowns. Registrations assigned 855 people to the under 25 age class, 841 people to 25-50 years and finally 455 people to over 50 years (Figure 3).
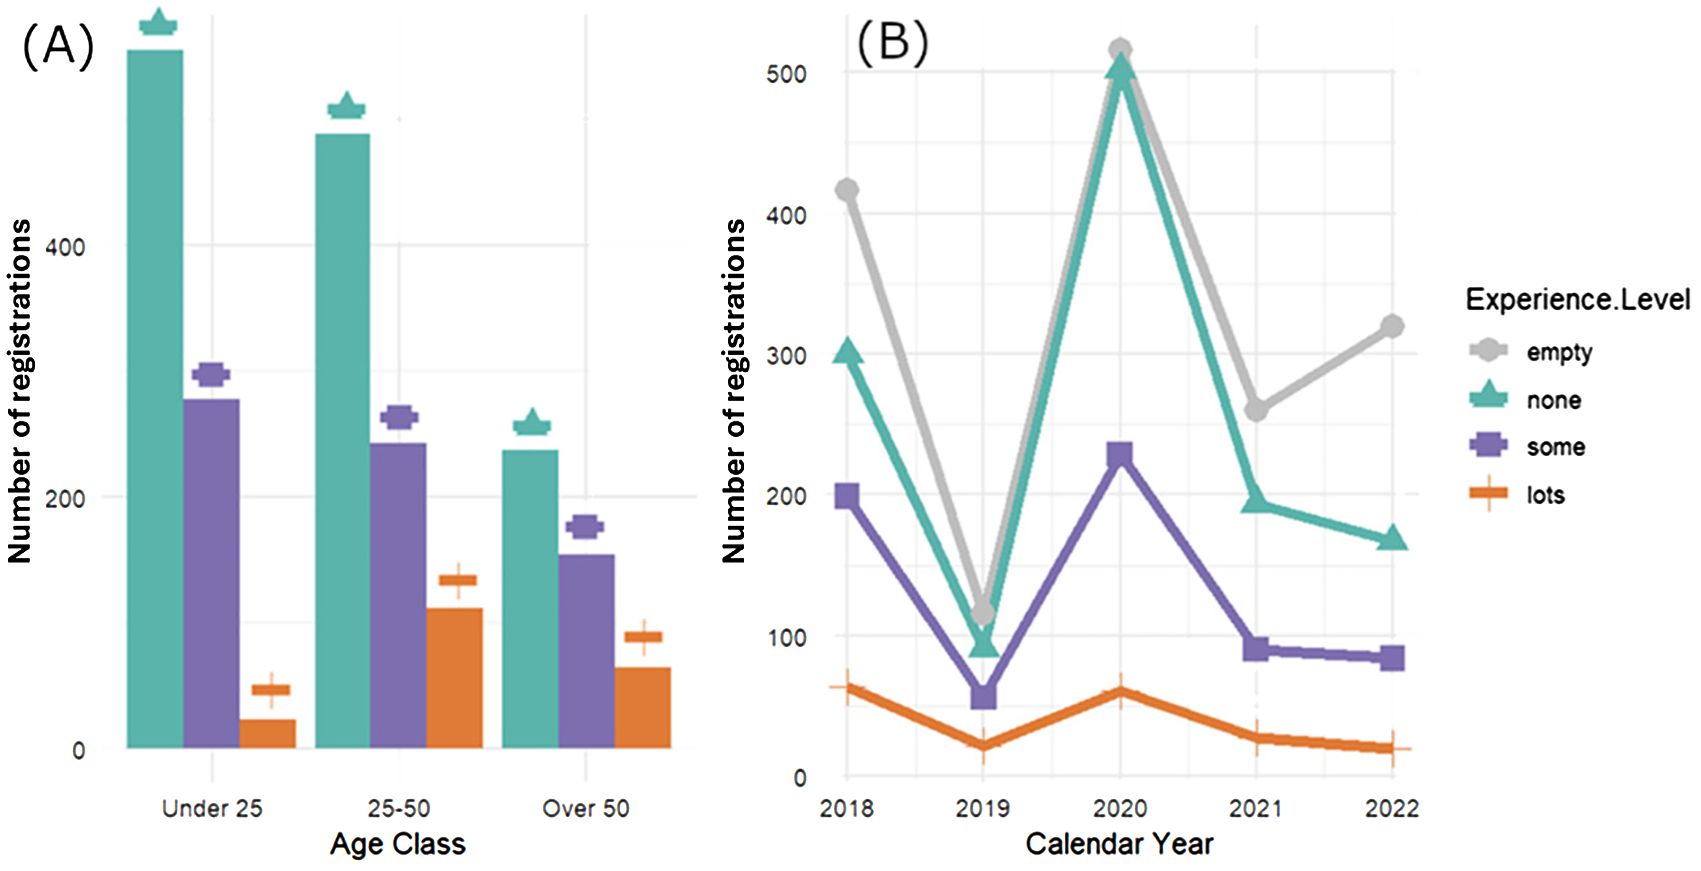
Figure 3. The number of SealSpotter registrations by age group and self-identified level of experience (A), and over time (B). The categories of experience level were: empty or did not disclose (grey + circle), none or no experience (green + triangle), some experience (purple + square), and lots of experience (orange + no symbol). We observed spikes in registrations at the program’s initial inception in 2018 and again during the COVID-19 pandemic lockdown in 2020. Registrations under 50 with no experience were the dominant users of the SealSpotter portal, whereas experienced users show less fluctuation in registration over time.
Assessing individual participant effort, 232 participants counted seals in sequential years and 139 participants rejoined after taking a break for a year or more. Most participants (1,262) counted under 10 images, which indicates that their effort did not provide an authentic contribution to the research and 84% contributed to ~25% of the image counts (Supplementary Figure S2). There was a total of 78 participants who counted more than 1,000 images and four who counted 10,000 images (Supplementary Figure S2). SealSpotter demonstrated a good return rate with 263, 76, 22 and 7 unique participants counting seals in two, three, four, and five years respectively (Figure 4).
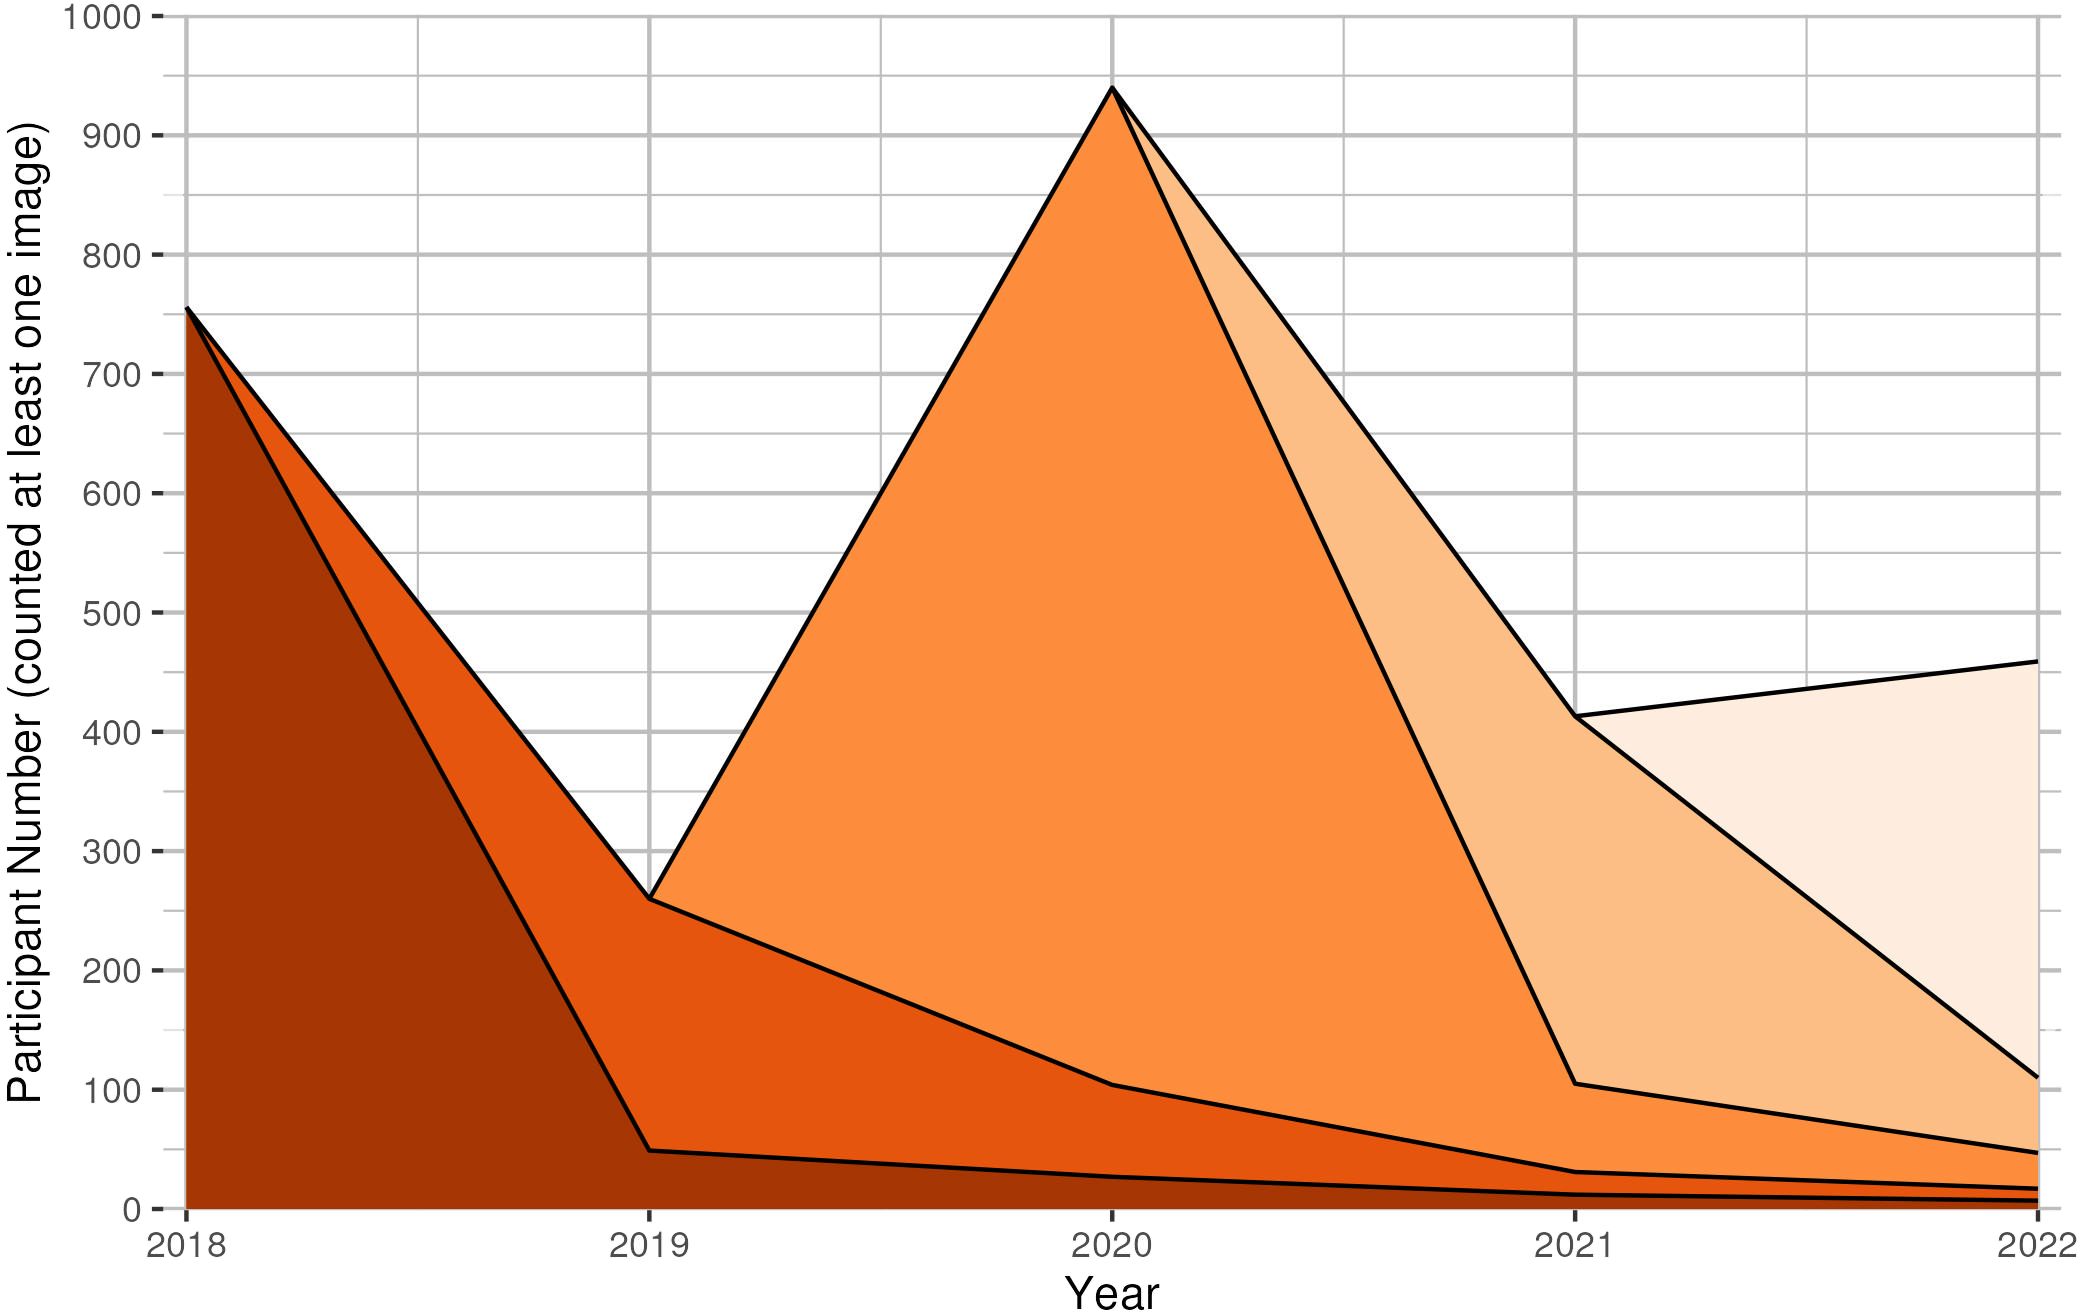
Figure 4. Stratified plot of participant retention from 2018-2022 where included participants counted at least one image in the SealSpotter portal.
Feedback regarding the SealSpotter portal was collated from 16 participants, or ~5% of participants in a single year and revealed frequently recorded words that could be contributed to seal biology, health, and environments (e.g., ‘adults’, ‘seabirds’, ‘sickness’, ‘dead’, ‘populations’); positive feedback (e.g., ‘fascinating’, ‘awesome’); the challenge itself (e.g. ‘challenge’, ‘images’); as well as difficulties experienced using the SealSpotter portal (e.g., ‘hard’, ‘missed’) (Figure 5). Participants included self-care, recreation, and relaxation as part of the benefits obtained from taking part in the SealSpotter program. The SealSpotter program was also recognized as a positive experience for people that are less mobile or prefer to work on a conservation project from the comfort of their own home.
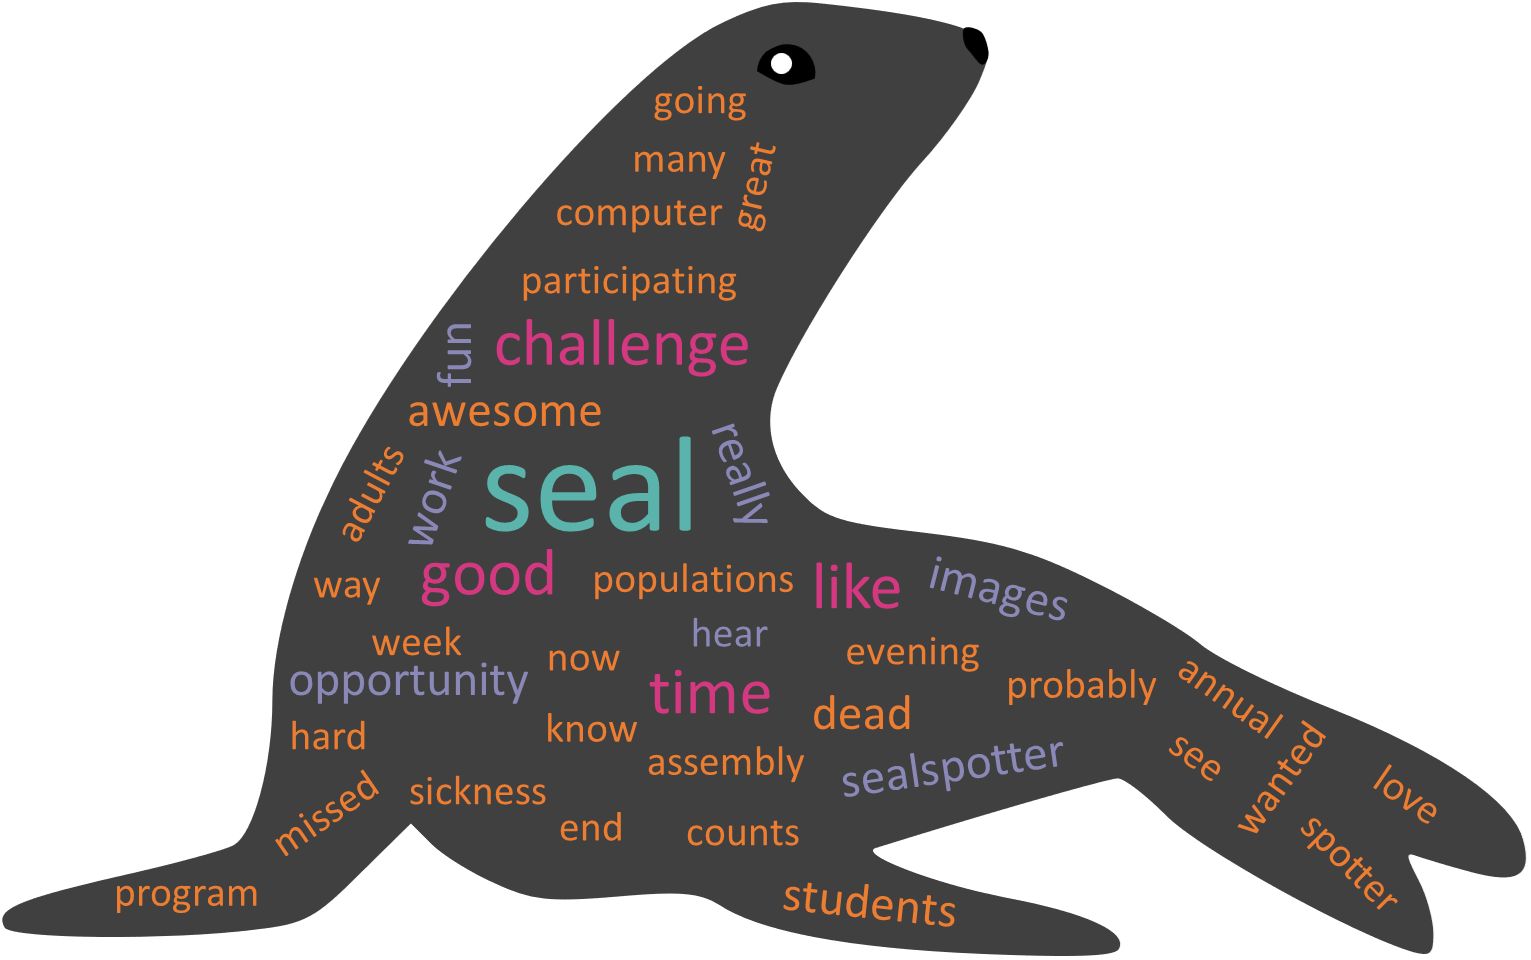
Figure 5. Frequent (appearing two or more times) words or terms that arose from 16 feedback emails shared with scientists. From a total of 207 unique words, the term “Seal” was the most popular word, arising 11 different times. Words in pink arose five times each, purple were mentioned three times each and orange words arose three times each.
3.2 Validation of citizen and expert counts
The nominated expert (RM) counted 30,641 images and was proven an expert because the randomized image counts (n=105) closely matched the regular image counts (Figure 6). The line of perfect match (slope = 1 and intercept = 0) and position of the points close to the line and within the 95% confidence levels justified that the nominated expert counting was consistent at different times subject to a small random error (residual standard error = 2.35 seals per image). Note that the area within the two dashed lines represents the prediction interval at 95% confidence level that reflects the random effect of the data, not the 95% confidence interval that reflects the uncertainty of the average value, which would have been too narrow. Despite appearing constant, the interval grows slightly wider when seal counts are larger, which is consistent with the data – there are less data points of large counts, and they are less concentrated around the fitted line.
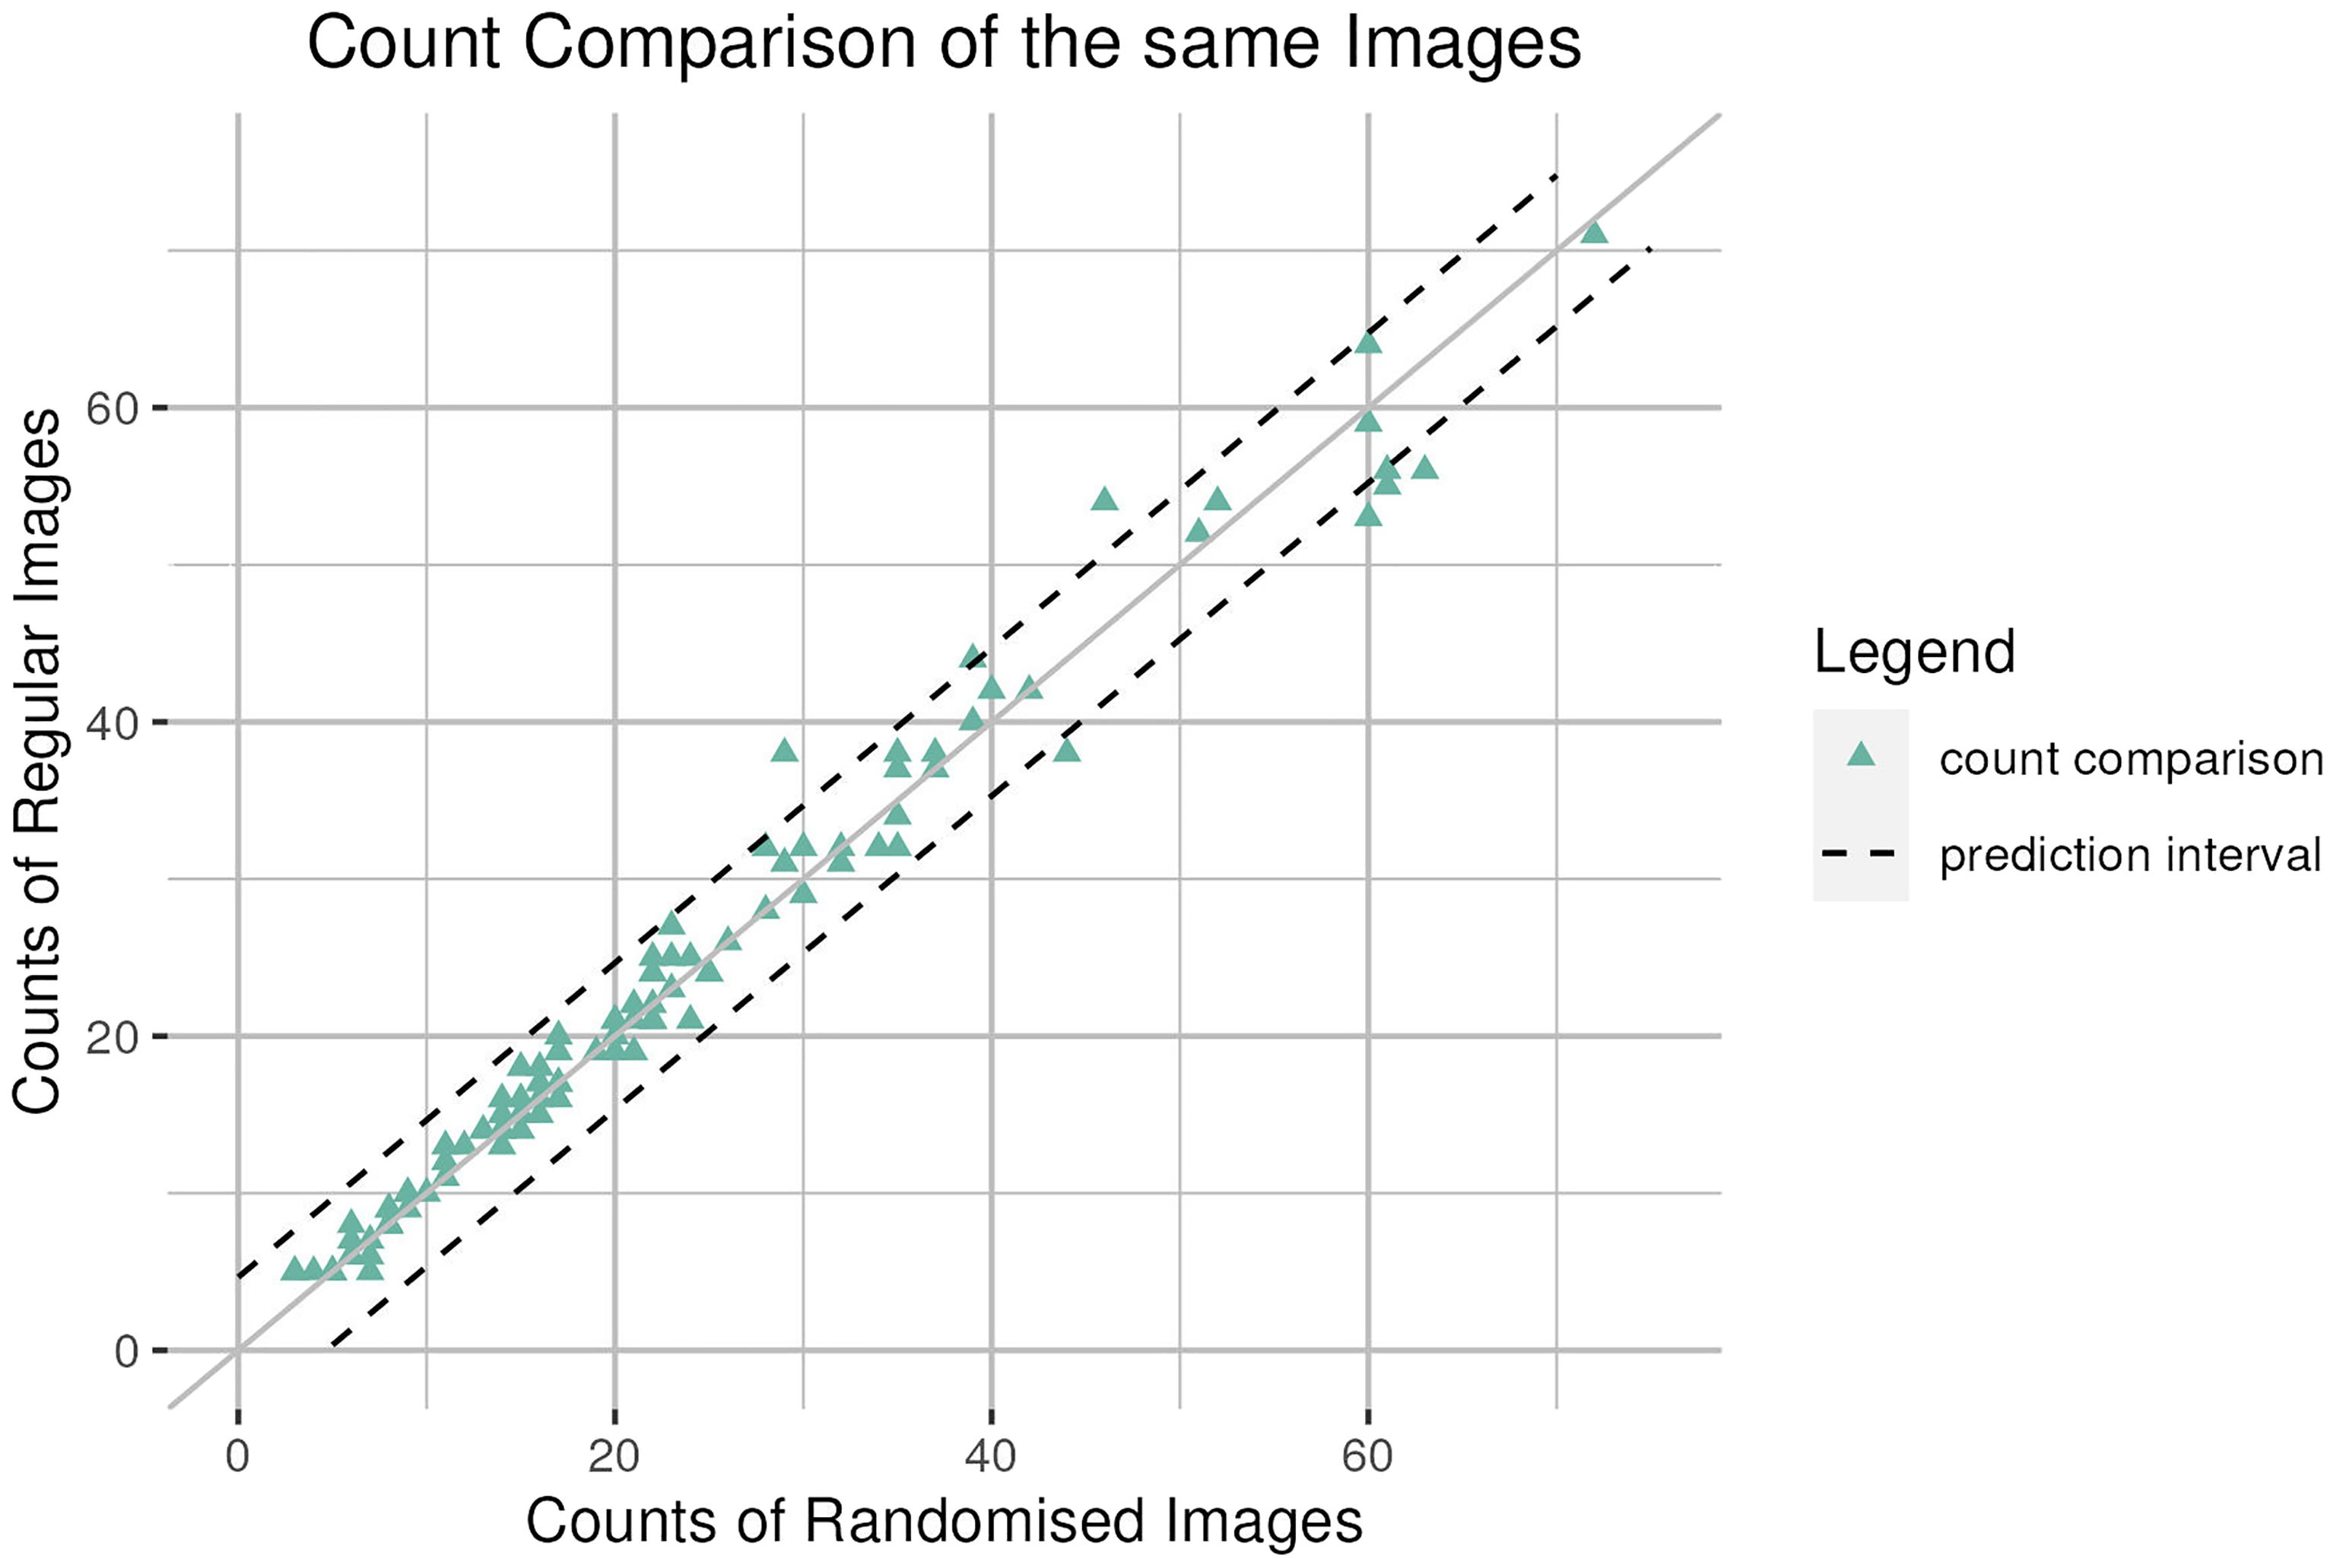
Figure 6. Count comparison of the same images (n=105) to determine expert status of an experienced seal researcher. The solid line provides the perfect match, the triangles the counts and the area within the two dashed lines the prediction interval at 95% confidence level based on the count comparison.
To date, there has been no mass mortality of pups detected at Seal Rocks or The Skerries. For images that contained dead pups, the expert would count a maximum of 15 dead pups. Participants tended to overcount dead pups in images with one expert count (mean 2.3 ± 8.5, n=1,485 participants) and undercount when more pups were present; for example when the expert counted 15 dead pups, 23 participants counted 6.8 ± 4.2 dead pups (Supplementary Figure S3). Using the expert counts as the reference or “true” count, participant classification of dead pups was inconsistent. This supported the decision to combine these categories for a total pup count when comparing abundance and trends.
A maximum of four entangled seals were counted by the expert in a single image, but participants overestimated entangled seals when none were present and underestimated them when they were present (Supplementary Figure S3). Therefore, an expert counter or other method would be required for reliable outputs for this category.
Participant counts of images for the adult-juvenile category were more similar to expert counts than the total pup image counts; however, as the count number increased, so did the variability in the participant counts for both categories (Figure 7). Age-class of participants and the degree of experience (as measured by time engaged rather than self-identified skill level) influenced the similarity between participant and expert counts with older age classes and more years of experience resulting in higher similarity of counts (Figure 8).
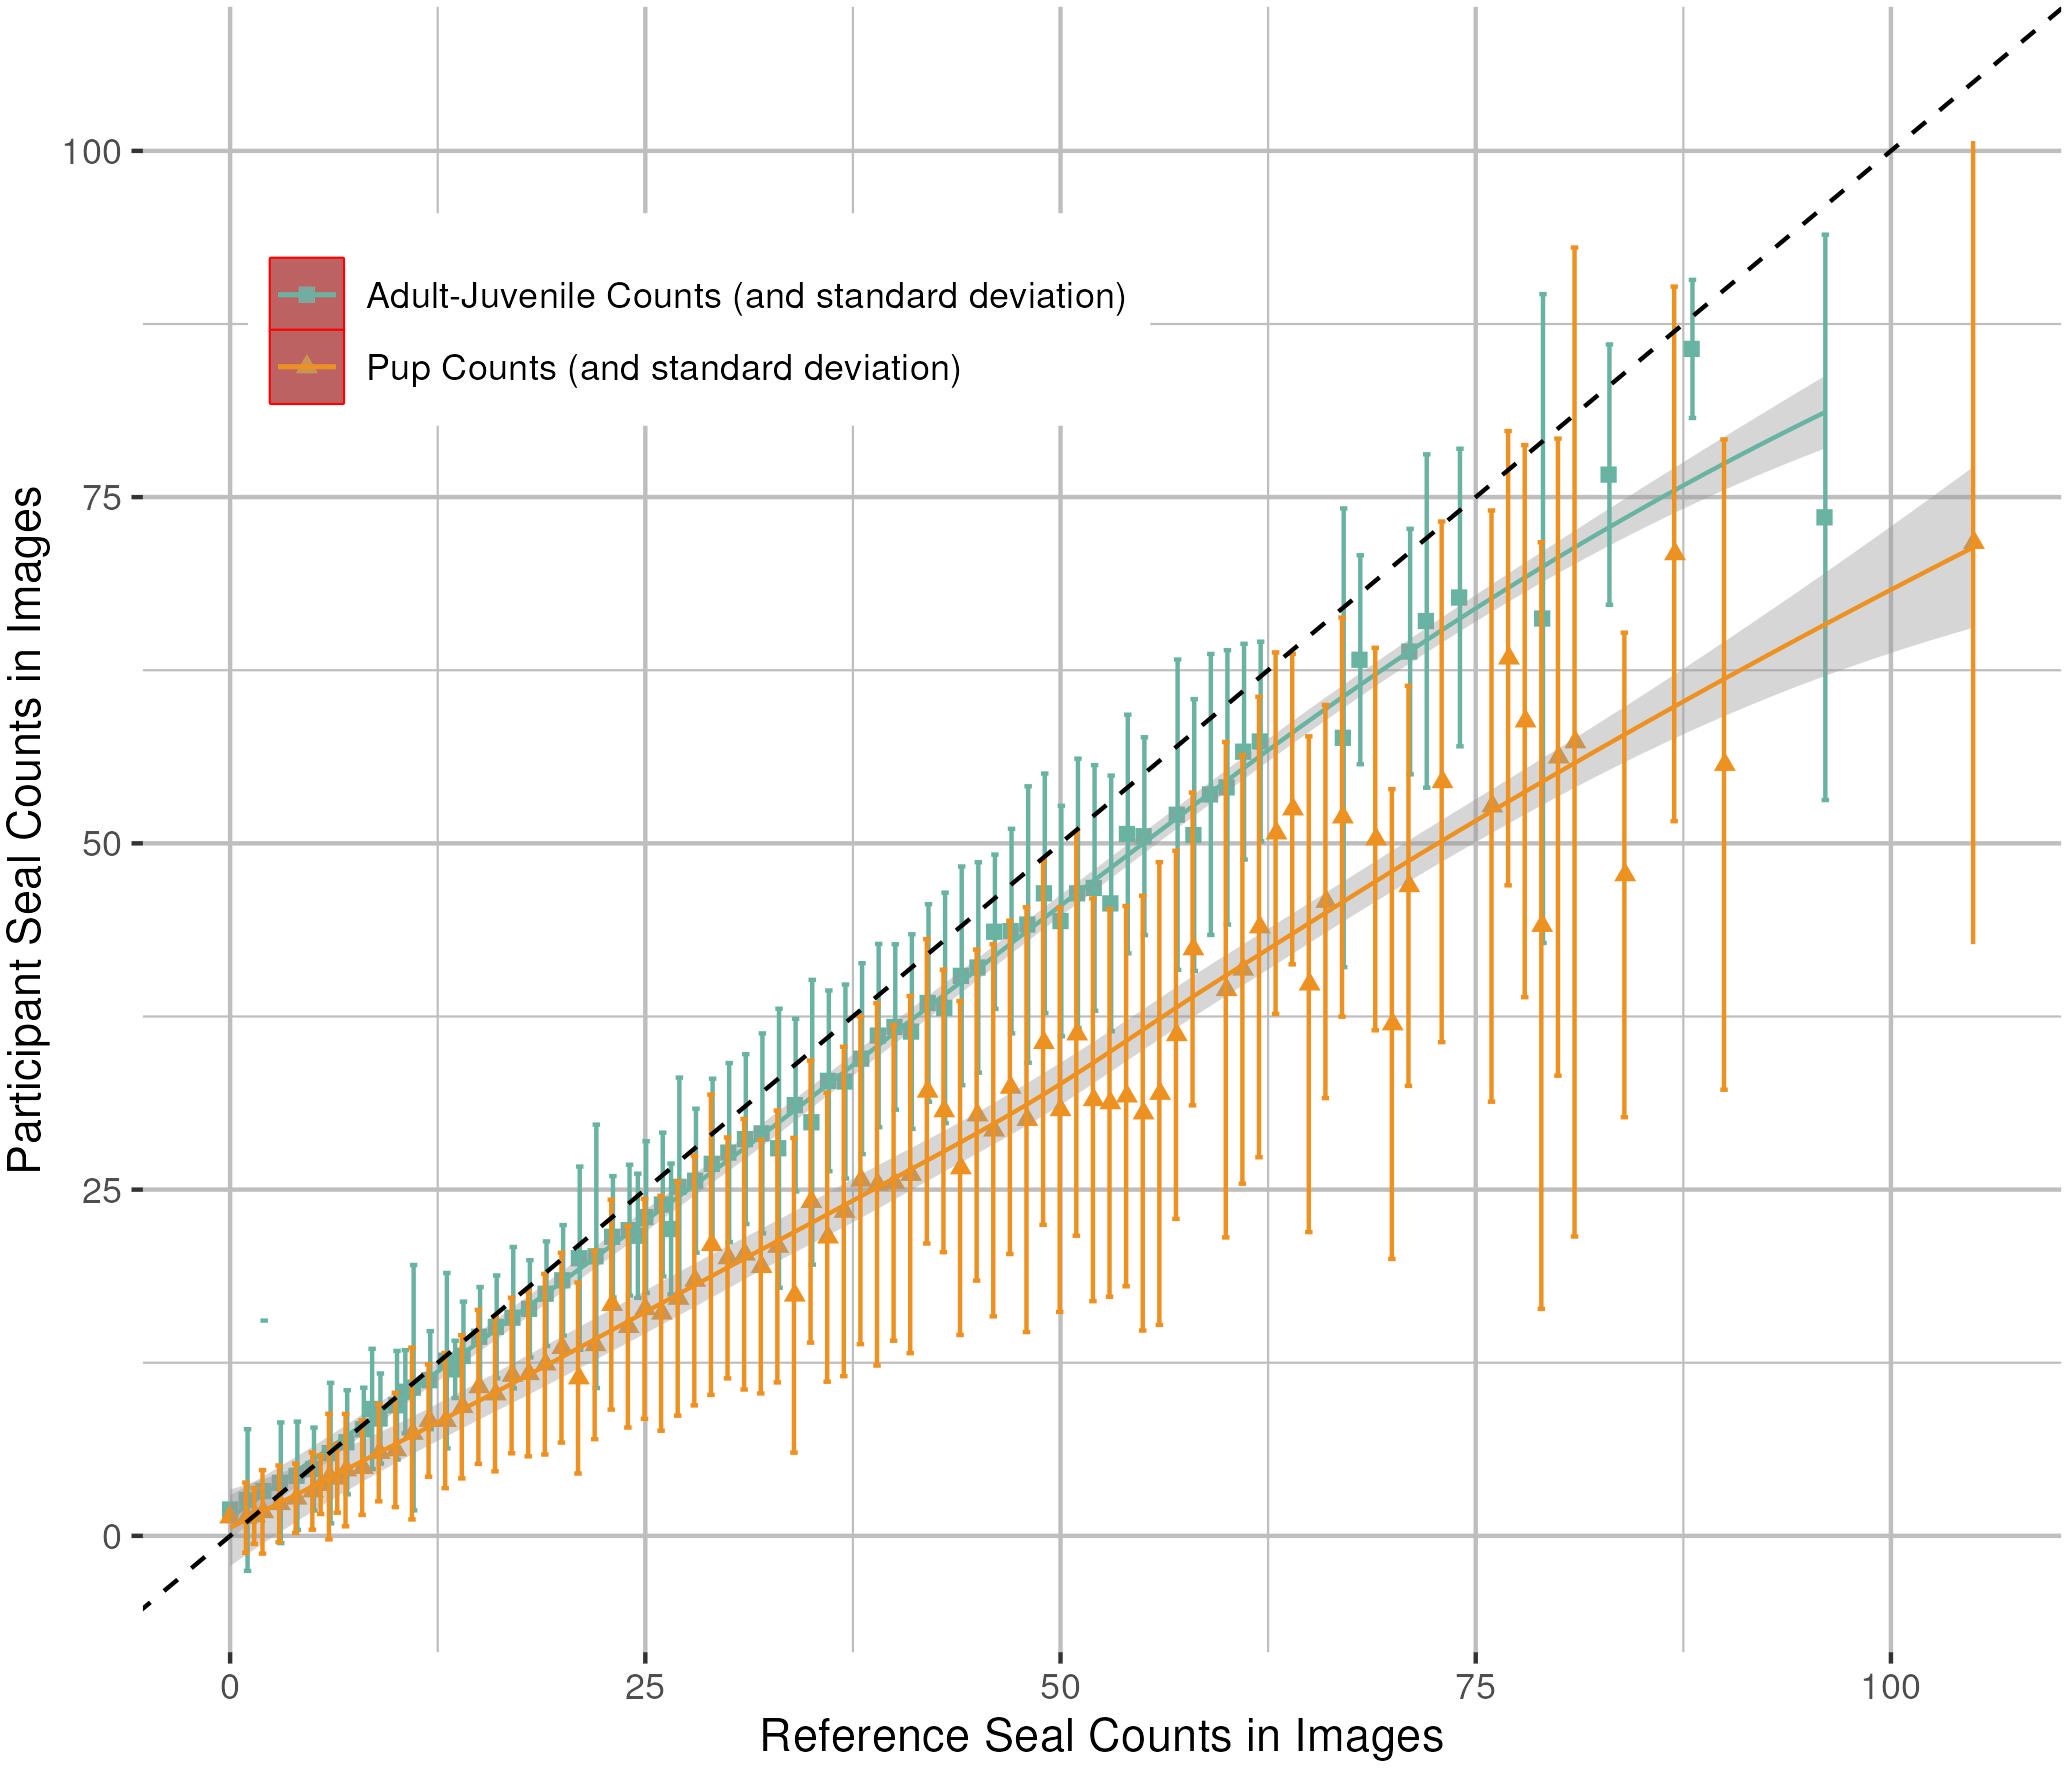
Figure 7. The similarity of unique image counts of fur seals by participants and the reference, as counted by the expert (black dashed line), for the adult-juvenile and total pup (live + dead) categories in SealSpotter. The data points are the mean participant count and the error bars represent the standard deviation of the multiple participant image counts.
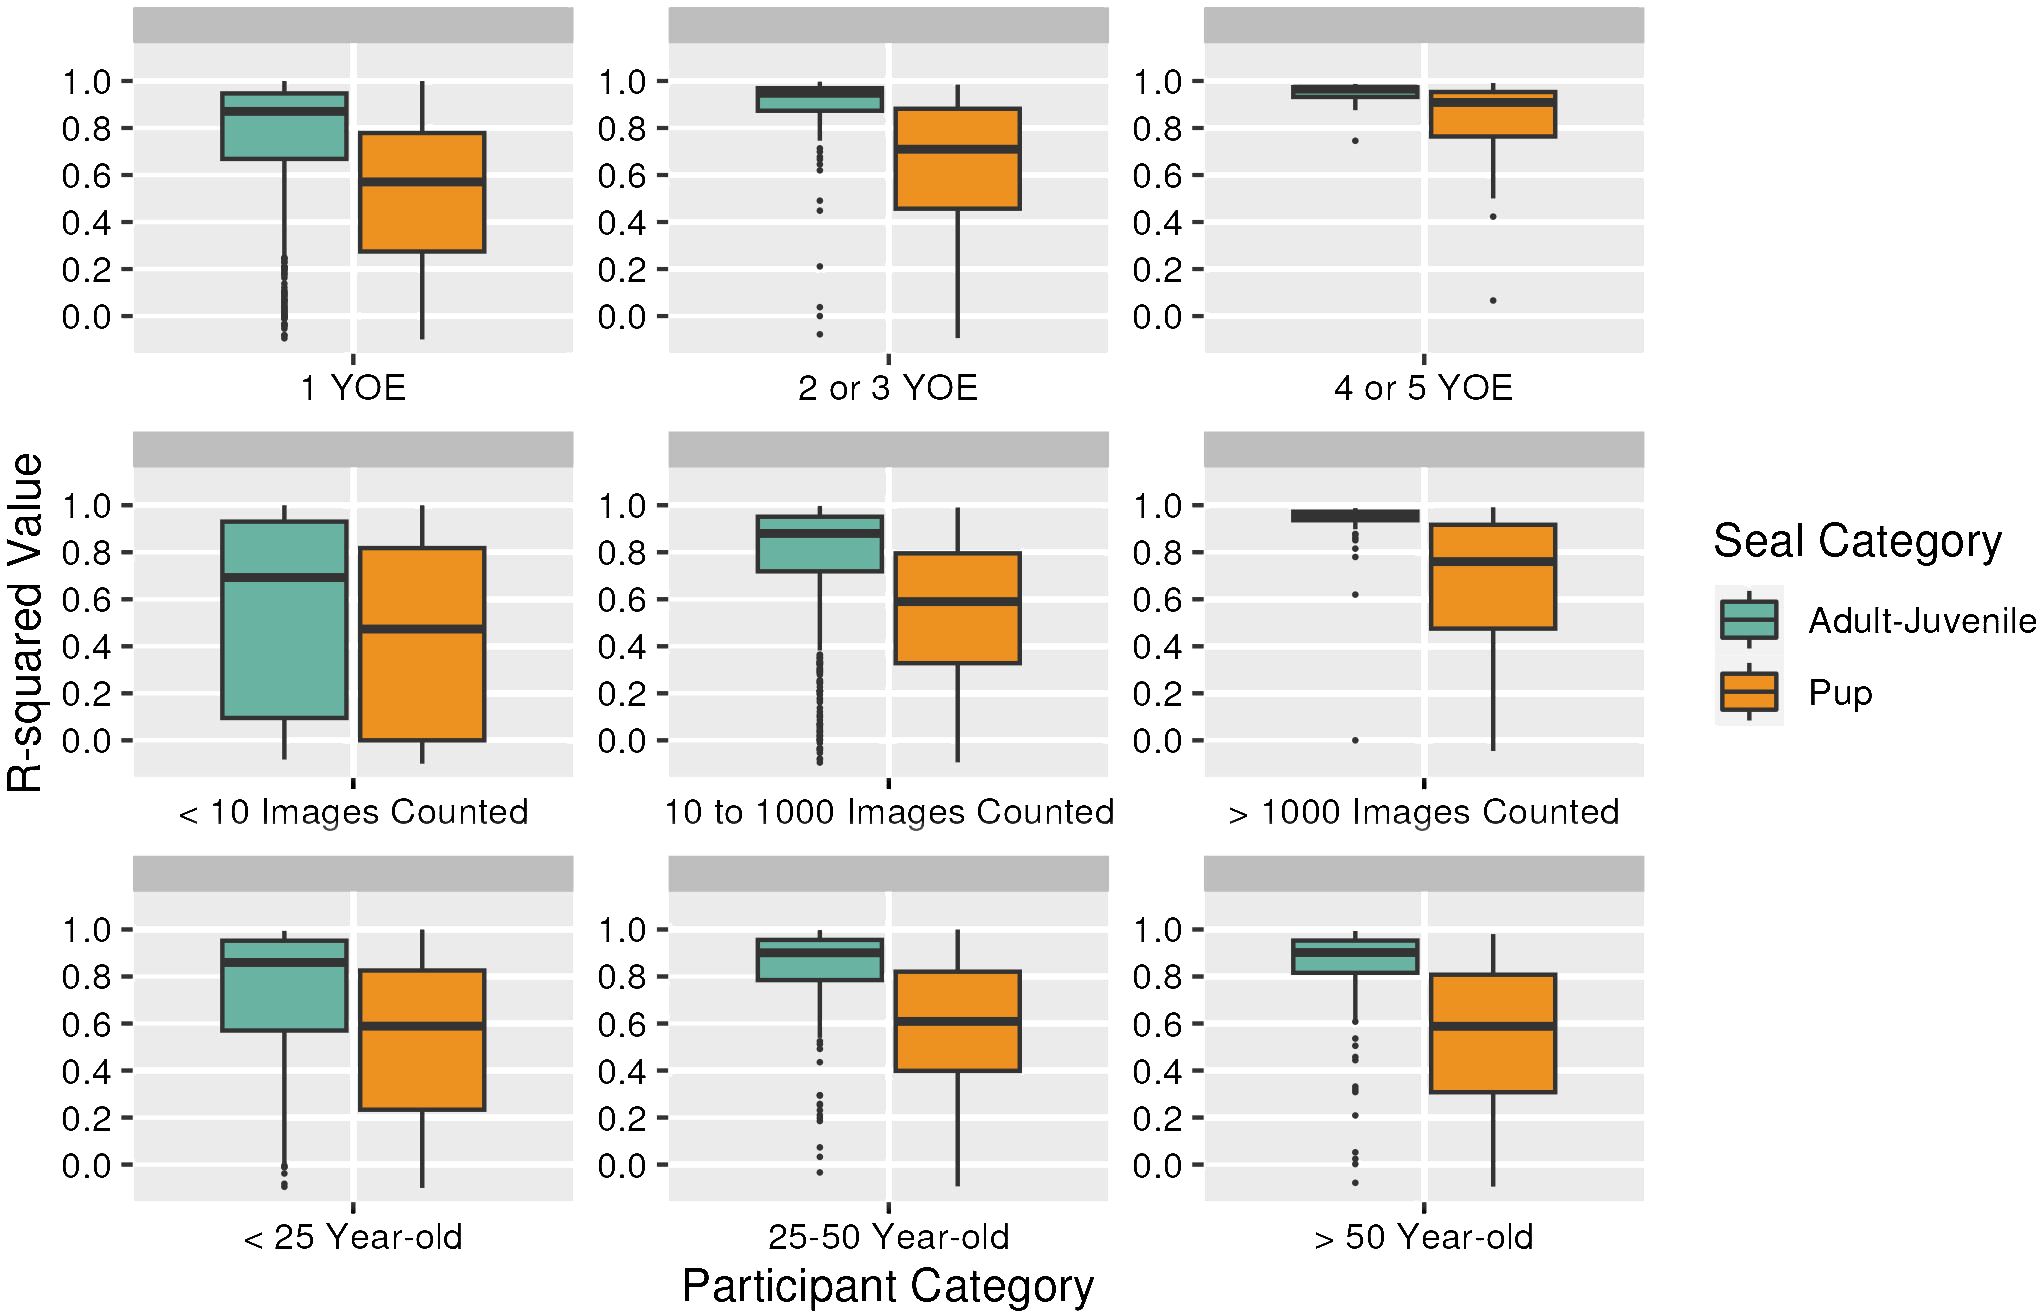
Figure 8. The influence of years of experience (YOE), number of images counted and self-designated age category on the similarity between participant (User) counts and the expert count of unique images in SealSpotter.
3.3 Seal population trends
Generally, participants and expert counts were highly correlated (95% significance level, y = 664 + 1.02 x, R2adj = 0.86, F1,12 = 78.1, P < 0.001, n = 14, Supplementary Figure S4). Results of a Welch Two Sample T-test suggests the expert (RM) consistently counted higher numbers of pups when compared to SealSpotter participants (t = -2.117, df = 24.92, P = 0.044) (Table 1; Supplementary Figure S5). The difference between the citizen science count and the expert count averaged 763 pups ± 230 SD.
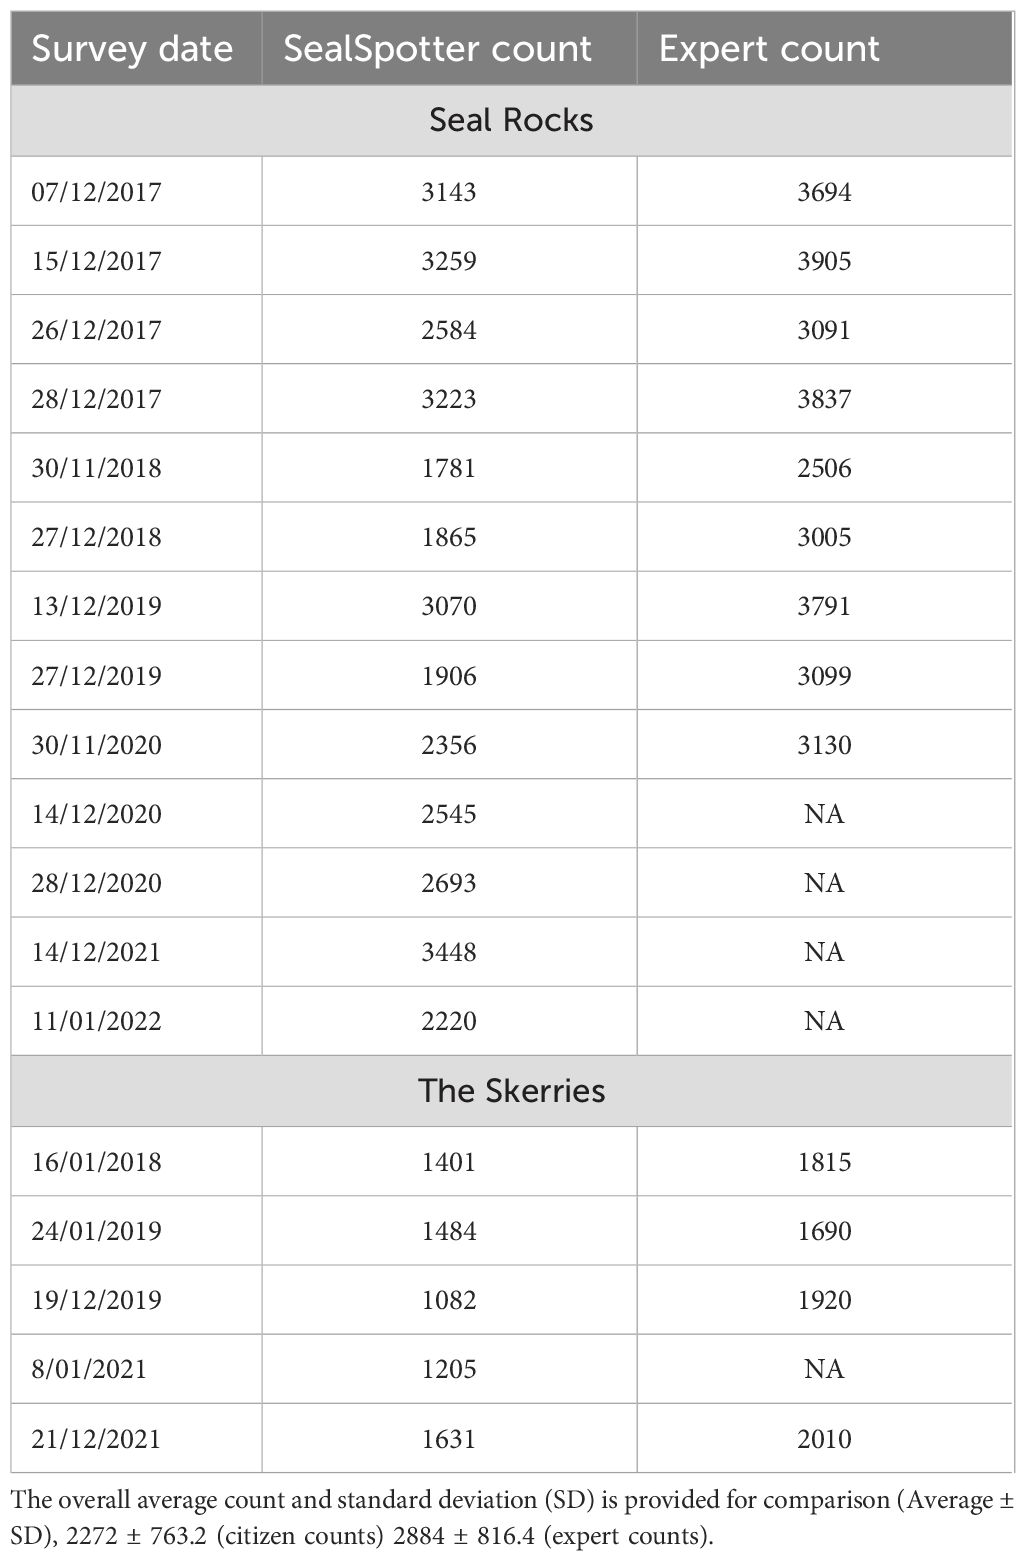
Table 1. Mean pup counts from drone surveys performed by citizen scientists and an expert seal scientist using the SealSpotter portal at two Australian fur seal breeding sites; Seal Rocks and The Skerries.
Citizen and expert counts documented similar trends in fur seal pup abundance at both sites, Seal Rocks and The Skerries (Figure 9). Lower pup numbers at Seal Rocks was observed by both citizen scientist and expert counts on 30/11/2018. This survey was restricted to Seal Rock (i.e., excluding Black Rock and East Reef), due to changed flight conditions (Table 1). Overall, outputs from a regression-based linear model suggest that the populations of Australian fur seal remain stable at both sites (Expert counts: Seal Rocks at 95% significance level, y = 1.01 x10 + 4 – 0.378 x, R2adj <0.01, F1,7 = 0.777, P = 0.407, n = 9; The Skerries, y = 1.35 x10 + 3 + 0.177 x, R2adj 0.42, F1,2 = 3.13, P = 0.219, n = 4. Citizen Counts: Seal Rocks, y = 4.88 x10 + 3 – 0.124 x, R2adj <0.01, F1,11 = 0.165, P = 0.692, n = 13; The Skerries, y = 378 + 0.0538 x, R2adj <0.01, F1,3 = 0.0594, P = 0.823, n = 5).
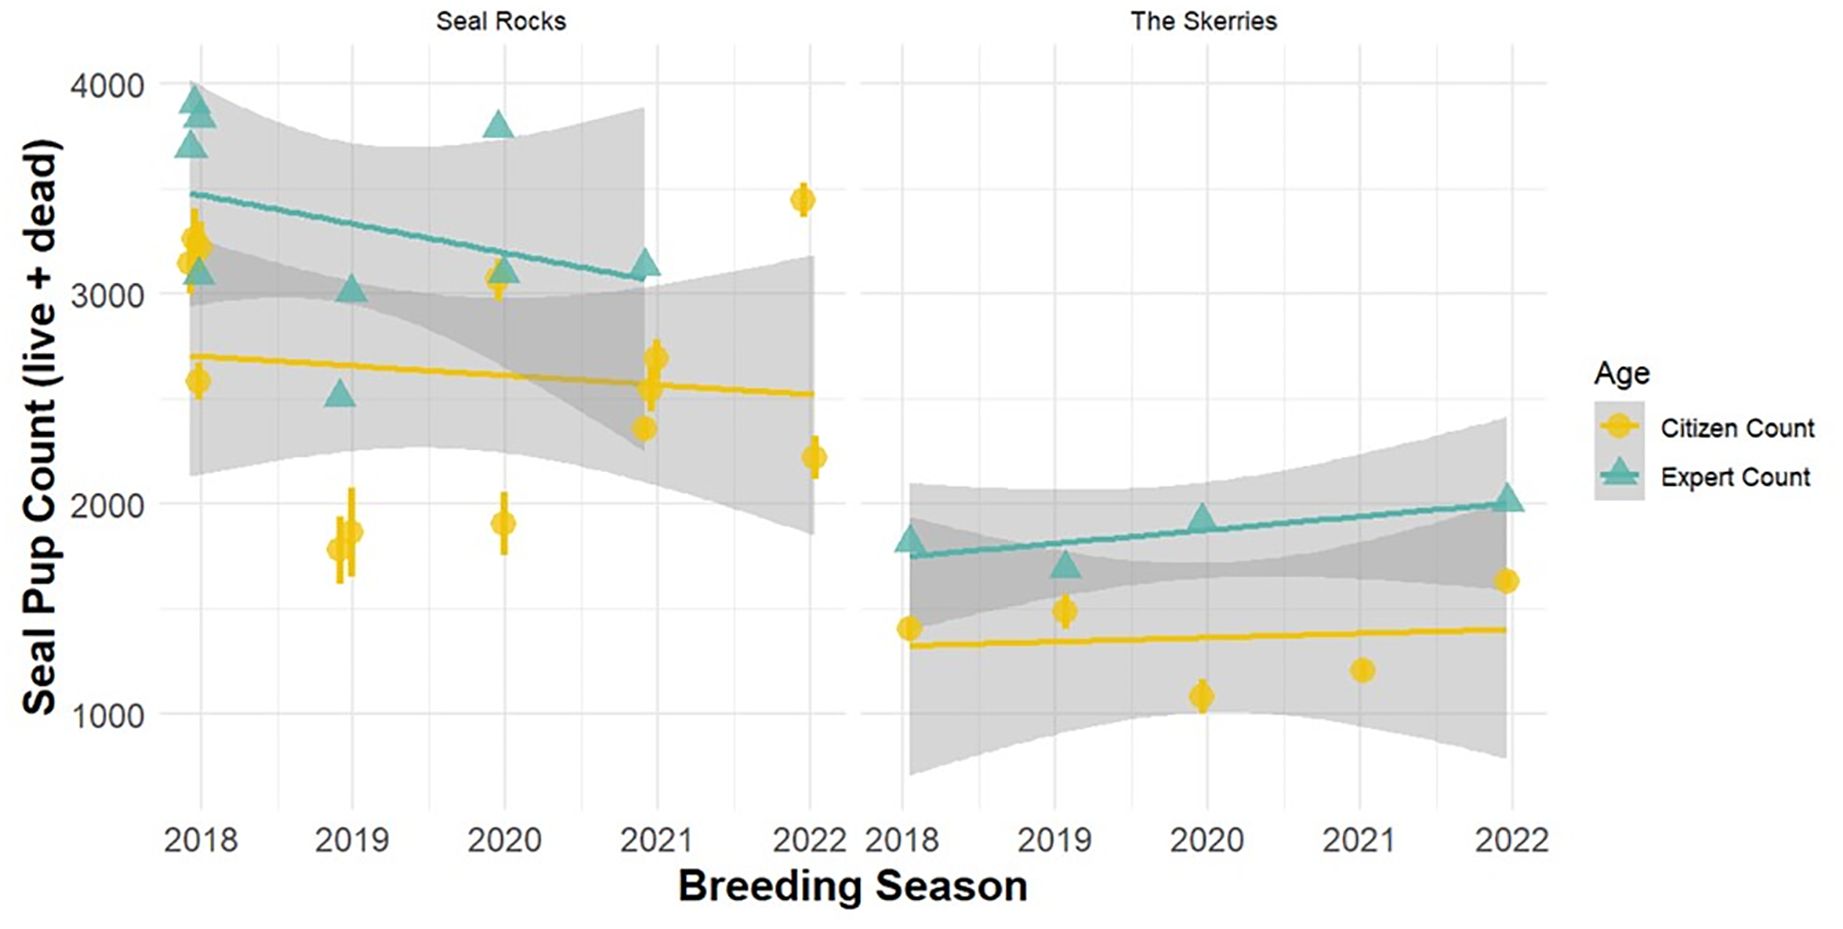
Figure 9. Australian fur seal counts (for live + dead pups) over the last 5 years (2018 - 2022) at Seal Rocks and The Skerries with the linear trend and 95% confidence intervals shown by the grey shaded area. Both expert (green + triangle) and citizen counts (yellow + circle) show similar population trends for Seal Rocks and The Skerries. The expert count is almost always higher suggesting seal spotter participants provide a conservative estimate of true pup numbers. Surveys graphed by date with year provided on the x-axis, therefore 2019 refers to the surveys flown for the December 2018 to January2019 breeding season. For tabulated results see Table 1.
4 Discussion
4.1 Seal Spotter as a tool for monitoring seal populations
In this study we encouraged citizen scientists to generate data on Australian fur seal abundances, greatly reducing the time required by a few research scientists to count images. Although citizen science counts were consistently lower than expert counts across all years and sites and for all categories (adults-juveniles, total pups, dead pups and entangled seals) (Figure 7; Supplementary Figure S3), the citizen scientist counts of total pups provided a reliable index of population, detecting similar trends as expert counts. Adult and juvenile counts will also provide valuable insights for population trends, but were not as reliable as pup counts because they are not all ashore at one time, unlike young pups that have not yet learned to swim.
Typically, population monitoring relies on precision rather than accuracy, as evidenced by a number of similar citizen science projects, because it is more important to have a reliable index over time than to count every individual, which can be impractical especially for high densities of colonial animals (Hodgson et al., 2016; Sorrell et al., 2019; Wood et al., 2021). Thus, when using these counts in the monitoring of Australian fur seal populations, it is important to understand that SealSpotter pup abundance counts will provide a conservative index of pup abundance compared to what is actually present at the site, but that this index is a reliable measure of change over time.
The disparity between expert and non-expert counts aligns with other research that utilizes citizen scientist counts of pinnipeds (Wood et al., 2021). Therefore, similar to other successful citizen science programs, SealSpotter can be used to detect general population trends such as stable, increasing or decreasing abundances. Other useful applications of SealSpotter will be to assess trends in entangled individuals and monitor adults and juveniles. The dead pup count would also allow for the detection of mass mortality events that could be caused by disease or heat waves. Such information is valuable for rapid responses to population changes and improved conservation outcomes. While it would be ideal to improve the similarity between expert and participant counts, it is important to highlight that lower numbers of seals have greater similarity. Therefore, trends will become more reliable under conditions of population decline when action becomes more critical.
From every 10 image counts, 3-7 replicates were useable. When considering authentic engagement in science and contribution, this outcome is the balance of the tension between reliable results and open inclusion. Including younger age classes allows for school programs, teaching opportunities of ecology, statistics and ocean literacy and communication opportunities for species-on-the-move and climate change discussions (Nursey-Bray et al., 2018; Pecl et al., 2023). SealSpotter is predominantly accessed by non-experts, allowing opportunity for engagement, skill development and education. One way we can improve this balance is by finding a different method of training rather than the 10 training images. This is especially important given the large number of participants that count fewer than 10 images after registering.
The difference between expert and citizen scientist pup counts can be explained by experience and level of difficulty. The pups are camouflaged on the rocks in their lanugo coat. The expert has over 20 years of experience counting fur seals and sea lions and has a heightened ability to observe the pups in the images. More experienced and older participants of SealSpotter provided image counts more similar to the expert than less experienced and younger participants. This highlights the value of encouraging loyalty to the SealSpotter program to increase capability and improve data. However, this will not be prioritized over inclusivity and democratization because a balance must be met with participants providing an authentic contribution to science. This gap between participant and expert counts will also improve as new sensors become available and image resolution increases providing clearer images for counting.
A decline in total pup abundance has been detected using 5-year population censuses via capture-mark-resight for the Australian fur seal population after the peak was reached in 2007 (McIntosh et al., 2022). Pup abundance at Seal Rocks declined by -28% between 2007 and 2013 and a further -6% to the 2017 census; at The Skerries the percent change between censuses was -19% between 2007 and 2013 and -28% between 2013 and 2017 censuses (McIntosh et al., 2022). However, these declining trends are based on one data point every 5-years, which reduces the reliability and resolution of the result. The annual drone surveys presented here begin with the 2017 breeding season and suggest that the decline may have stabilized at both Seal Rocks and The Skerries (Figure 9). Seal Rocks is the largest breeding site of Australian fur seal and displays high variability in pup abundance between breeding seasons compared to The Skerries, the fourth largest breeding site for the species that provides more stable pup estimates. The Skerries is situated next to the remote Croajingalong National Park in the southern East Australian current, a global hotspot for ocean warming (Ramírez et al., 2017), while Seal Rocks is in north-central Bass Strait further from productive foraging areas and close to popular tourist locations and the urban city of Melbourne potentially exposing it to higher levels of pollutants and disturbance (McIntosh et al., 2022). Therefore, annual surveys are vital for continued monitoring of the trends at these sites to understand the species’ response to climate change and other anthropogenic pressures (McIntosh et al., 2022; Wall et al., 2023). As high order marine predators, Australian fur seals are sentinel species for change in the marine environment. Obtaining reliable indices of the population allows informed predictions and management decisions to be made.
4.2 Seal Spotter as a tool to increase ocean literacy
The global participation in the SealSpotter program, of 3,879 registrations and 2,558 active participants, demonstrated the large-scale uptake of the program and therefore its outreach success. Principally, ocean literacy initiatives should encourage engagement with the marine environment in ways that shape people’s understanding of and appreciation for the ocean (Worm et al., 2021). Of all SealSpotter participants engaged in the last five years, 855 were under the age of 25 (Figure 3), largely through local schools and university programs that were interested in and education Science, Technology, Engineering and Mathematics (STEM) programs. Successful engagement of youth in ocean literacy programs has the capacity to increase engagement of the broader community and empower the next generation of ocean leaders through shared learning and conversations in the community (Kelly et al., 2022a).
A focal point of the United Nations Ocean Decade is to increase ocean literacy and ocean equity, by ensuring less prominent groups are included in ocean-focused decision making and ocean sciences (Shellock et al., 2022). It is important to recognize when discussing the benefits of citizen science that geography and language are major factors for participation in a wide variety of citizen science projects. In a study of over 14 million online citizen science participants, most were from English speaking OECD countries, The Organization for Economic Cooperation and Development (Strasser et al., 2023). Importantly, access for First Nations peoples may not be prioritized. SealSpotter did reach every continent of the globe, but the English language used for training and presentation of the portal likely targets participants with skills in English language, as demonstrated by the English language email communications examined in the word-cloud results (Figure 5). While conveying both biological learnings and positive recreational benefits of SealSpotter participation, the word-cloud analysis was designed post-hoc and unfortunately not all email correspondence had been saved resulting in the small sample size. Also, most email correspondence was provided by highly engaged participants and may not be representative of all participants.
In 2018 the SealSpotter program partnered with two national educational programs focused on increasing STEM opportunities and engagements for women and girls. Of particular success was the capacity to partner with STEM Sisters7 and the CSIRO Indigenous STEM Education Project8 with 10 and over 20 online participants respectively. In both instances, the organizations partnered with the SealSpotter program to deliver a short course exploring the scientific method through SealSpotter, including a guest lecture from the SealSpotter program leader (RM). Additionally, numerous universities and schools have used subsets of SealSpotter data to build learning programs. These teaching and training partnerships are an excellent way to apply real data from an ongoing conservation research program that can develop participants’ learnings of statistics, conservation, wildlife monitoring and technology. Nature-based opportunities compared to computing, medical or astronomy opportunities, can show higher participation of young people and be less gender biased towards males particularly if designed to include school students (Spiers et al., 2019; Strasser et al., 2023), providing useful demographic information for developing such projects. Nature-based platforms such as SealSpotter may be able to engage pre-existing communities such as bird watchers and wildlife enthusiasts that have been organized for more than a century (Strasser et al., 2023). Understanding that programs such as SealSpotter may be a digitization of existing participation could assist marketing approaches, but certainly democratizes participation for people with diverse abilities and/or limited access to places of interest or like-minded communities.
It is important to also consider what narrative will be communicated with or learned by participants of citizen science projects. The “species-on-the-move” framing (Pecl et al., 2023) encourages citizen scientists to document changes in species distributions caused by ocean warming. Here, species-on-the-move are framed as adapting or shifting due to environmental pressures, thus not always perceived as a negative impact. This adaptive framing approach presents a more positive narrative that could be applied to Australian fur seal trends, should they experience a population decline or shifts in range under climate change scenarios.
4.3 Considerations for building successful community science tools
SealSpotter has been a successful community science program, which has achieved its project goals and community engagement targets that included enough participation for reliable results, learning opportunities, particularly for youth, and global participation. This has been a long-term project and one that will continue to grow and evolve. Already, this application has been extended as ‘Sea lion Spotter’ for the Endangered Australian sea lion (Neophoca cinerea) in South Australia4. We acknowledge that marine citizen science is broad and comprises many different approaches, styles, and project scopes (Ellwood et al., 2017; Kelly et al., 2020). Here we reflect on the many lessons learned throughout SealSpotter’s five-year project life and provide three key recommendations to guide other scientists seeking to develop successful community science tools.
4.3.1 Know your study site and species and choose your platform and audience
Seal Rocks hosts one species of seal, the Australian fur seal. The Skerries also hosts a small population of breeding long-nosed fur seals (Arctocephalus forsteri) that birth approximately one month later than the Australian fur seals. Given how similar the two species look for inexperienced participants, participants cannot be expected to distinguish them. Therefore, the timing of the surveys is important to understand the species contribution of your pup counts. If species differentiation is important for your results; you must perform surveys at the best time of year and/or only use experts for counting. However, this should not deter scientists from developing citizen science projects in complex environments, as passionate community members can often be experts of local wildlife and ecosystems or develop the skills. For example, community bird watchers are celebrated for their rapid and reliable identification of similar seabird species (Viola et al., 2022). In these cases, expert amateurs can collect accurate data with little intervention from scientific partners. Alternatively, the benefits of engaging novices or young people can include education and awareness raising, which may be a priority of the project and worth sacrificing some degree of data integrity that can be managed in the processing stage. An understanding of the audience or users of community science tools is necessary during project inception for success (Ellwood et al., 2017). Indeed, an understanding of organisms at the species level may not matter from a scientific perspective and is dependent on what variables are being monitored and why. For example, if scientists require an index of population change at a given location as an index of general ecosystem health, it might be acceptable to monitor the total number of fur seal pups regardless of species.
The SealSpotter platform was built from the ground up to maintain flexibility and responsiveness with the program (SealSpotter source code provided at https://github.com/Research-coder/sealSpotter). Categories for counting can be easily changed by the research team and portals can be individualized for different projects, taxa and/or participants. This has allowed the provision of targeted portals for specific student requirements such as counting new births or counting females suckling pups compared to the number sucking juveniles, which is another metric of breeding failure or pup mortality.
Data scarcity or competition to interact with a limited dataset can encourage participation, similar to approaches used to create games (Spiers et al., 2019). The two- to three-week SealSpotter Challenge utilizes this behavioral preference of participants. Citizen science games, also known as Games With Purpose are popular for increasing engagement, but require more resources and introduce additional ethical considerations, as well as a need to understand the trade-offs (if any) for data quality and/or biases (Miller et al., 2023). For example, the drive of the player to earn more points may undermine the scientists need for accurate data collection. SealSpotter is a simple platform built by scientists on a budget to be flexible and transferrable to other uses, therefore the added complexity of gamification has not been introduced.
It is important to note that a number of free-to-use platforms exist specifically for citizen science programs including: RedMap9, the Range Extension Database and Mapping Project, an Australia-wide tool for marine users to document new and vagrant marine organisms; eBird10 a tool for birders to log avian sightings; iNaturalist11 that includes a broader range of taxa where specific challenges can be set (Smith and Davis, 2019); DotDotGoose a free open source tool to assist with counting objects defined from within images (Ersts, 2024), and Zooniverse12 that provides a wide scope of citizen science projects beyond recording wildlife sightings. The choice of platform and approach presents a number of trade-offs. One sacrifice of SealSpotter is the loss of access to thousands of highly engaged participants on pre-existing platforms such as Zooniverse and the need to recruit others to promote the portal. However, some projects have higher interactions than others on Zooniverse therefore using such a platform for a citizen science project does not guarantee success or high engagement (Spiers et al., 2019). Crucially, SealSpotter has 371 loyal participants that have been with the program over multiple years. Since the success of SealSpotter relies on identifying highly camouflaged fur seals on complex terrain, experienced and long-term participants are valuable for reliable scientific outputs. While SealSpotter requires minimal resources other than time to develop and maintain it, resources are needed if scientists prefer to engage a web designer and to regularly test the platform to maintain developments in cybersecurity requirements. Scientists seeking to develop successful community science tools must assess the pros and cons of available approaches to reach their target audience and project goals.
4.3.2 Listen to feedback and refine your methods
The SealSpotter program attracted an engaged community of citizen scientists from around the world. We posit that the success of this community engagement may be due to the multiple channels for scientist-participant communication. We recommend citizen scientist programs provide accessible ways for participants to leave feedback and build trust, with the option to remain anonymous. For example, the SealSpotter portal allows multiple channels to submit feedback through the website or by contacting the scientists directly through an organizational email. Such an approach has also proven successful for the Redmap project (Nursey-Bray et al., 2018).
Programs that are adaptive to community needs have been highlighted as a key to building trust and success in community science programs (Chiaravallti et al., 2022). From the feedback provided on the SealSpotter portal, the SealSpotter team adapted the original portal and project structure in response to participant feedback. Comments relating to dead seals arose numerous times in comments and email communication with participants (Figure 5). Though, it is important to note that words in Figure 5 have been listed without context, “dead” can refer to the counting of dead pups and how people found this challenging and sometimes upsetting. In other contexts “dead” could also refer to someone commenting on how many dead pups they have seen compared to other challenges. Because of the high volume of requests, we provided a new category to allow participants to count dead pups separately from live pups. Although these data are combined for a total pup count, the data may be useful in the future to detect large scale mortality in the event of a disease outbreak or anomalous heat wave. One major change resulting from participant feedback was the development of the two to three week-long SealSpotter challenges, an initiative to encourage use of the SealSpotter portal during a brief period of time where users who counted the most seals would be recognized in an annual newsletter (with permission). Participants who requested this believed that a time limit and sense of competition may better motivate them and their peers. Additionally, based on participant requests to have resources more readily available, we designed and included ‘cheat sheets’ within the portal where participants could click on a link to bring up several example images and use a slide bar to move between a counted image and the uncounted image to see how an expert (RM) would perform the count. This provided accessible guides on classifying the fur seals and helped participants improve. These brief examples of participant feedback demonstrate how programs such as SealSpotter can evolve to fit both citizen needs and those of the scientist. Citizen scientist programs work well when communication feedback loops are established and suggested changes are taken onboard. We recommend allowing multiple pathways for communication between scientists and citizen scientists to enable good communication and trust between all parties.
Interestingly, we saw spikes in participation during the 2020 Coronavirus (COVID-19) Pandemic particularly of new participants (those that identified as having no experience in using the seal spotter portal; Figure 3). During 2020, many people remained at home and under lockdown restrictions. As such we promoted the use of the SealSpotter portal through social media campaigns to engage people with the natural world and for education and entertainment. Virtual engagement in citizen science initiatives can lead to tangible effects for conservation (Yammine et al., 2018), and so we recommend the use of social media to promote citizen science projects.
4.3.3 Assess project accessibility and participant effort
SealSpotter is designed to be easy to access and use. There are no intensive tutorials, sign-ups, or hurdles to access the portal. The SealSpotter team adapted the program over its lifetime based on user feedback to increase accessibility. These changes included altering the shape and color of symbols used for the four categories of seal (adult/juvenile, live pup, dead pup, and entangled seal) so that people with color or other vision challenges could more easily participate. We were also requested to include closed caption text for the introductory video to benefit hearing impaired participants. There was a high number of new participants each year, many loyal participants, and some that rejoined the program after a break, therefore we have been working with an engaged citizen scientist community (Figure 4). We also demonstrated that the loyal participants and older age classes provided image counts more similar to the expert. We deliberately made the decision to preference inclusion of participants over reliability of counts by increasing the number of replicate image counts to 10 per image, which typically resulted in three to seven useable image counts for averaging. The SealSpotter program considers both elements to be important; however, individual projects must find a balance between obtaining reliable data and including young, less serious, or inexperienced participants. Such a nuanced approach to social inclusivity and scientific efficiency is common for citizen science programs and therefore ensuring authentic contributions is critical to ensure motivation (Spiers et al., 2019). SealSpotter included 10 compulsory training images after registering. That 1,262 participants counted fewer than 10 images demonstrates that we need to change how we train people so that their contribution is authentic and transparent.
Translating social media views of the promotional material to registration and extended engagement is a challenge for the SealSpotter program, as evidenced through the large proportion of new and inexperienced participants each year compared to the low numbers of regular and experienced participants. The use of partners and collaborations with external organizations improved the attraction and engagement of participants. SealSpotter, in its current form, was projected to have a life span of 10 years, based on expected participant enthusiasm for the project. We are currently halfway through that timeline and beginning to develop an improved portal with a more flexible and interactive platform for easy manipulation and an improved professional and attractive design. We expect this tool to become invaluable for monitoring various wildlife populations and for identifying the health of an ecosystem, therefore we hope that we can evolve SealSpotter to maintain authentic collaboration with citizen scientists and keep the program interesting and relevant. An important lesson from SealSpotter is to set realistic timelines and goals to assess value and success of the program regularly (from scientific and participant perspectives) and adapt as necessary.
4.4 Next steps
Following the success of the SealSpotter program in creating reliable data and limiting the workload of expert scientists, a future goal of the SealSpotter program is to access machine learning and artificial intelligence for more rapid seal counts and estimates of individual animal size (Hodgson et al., 2020; Dujon et al., 2021), but on a population rather than individual scale. These technological advances may allow for rapid basic counts and regular health indices because the fatter the seals, the more food they have accessed in the ecosystem, while the citizen scientists progress to more complex tasks that require human participation. Future questions may include the number of females suckling pups versus juveniles to explore survival and recruitment, or how adult male bull seals position themselves in harems and in response to other bull males, or whether fatter and healthier pups are more likely to congregate and skinnier pups be excluded. We will continue to support the citizen science outputs from SealSpotter and its value for education and ocean literacy and we will trial a language translation process to increase accessibility with non-English speaking countries and participants. We will create an opportunity to access the 10 training images prior to starting the survey image counts. This provides transparency in the activity, self-determination of the participant, and may maximize the number of image counts performed per survey. Drone technologies are continuing to advance (Wiley et al., 2023) and testing the use of thermal imaging is one such application being developed for coastal and marine settings that may enhance our understanding of seal populations, behavior and survival (Hinke et al., 2022) and improve validation of dead pups and entangled seals to reduce the gap between expert and participant counts.
Using AI and deep learning techniques for counting the seals is under development across the globe (Chen et al., 2023; Christin et al., 2019). Images of fur seals are complex for AI processes because seals present multiple shapes and sizes, at times wet and/or dry or a combination, and resting on often complex rocky terrain that camouflages them with rockpools that can appear as seal-like shapes. Despite this, success is anticipated and thermal sensors could prove more capable of providing computer derived counts. However, simultaneous color (RGB) and thermal imagery may be required to identify both dead and live pups. If AI is able to provide simple population counts from images, the role of citizen scientists may shift to answering more complex and specific questions beyond the capabilities of current AI.
We will also examine the role of human research ethics in evaluating citizen science participation and incentives (Groot and Abma, 2022). This may be overlooked in many programs including SealSpotter that have addressed this by de-identifying the participant data. However, participants may prefer greater scrutiny of the use of their data by scientists through the approval of human ethics committees.
5 Conclusion
Conservation efforts for marine species require a global increase in ocean literacy and engagement in the marine sciences. The SealSpotter program is an example of a highly successful citizen science program. Our results show that citizen science programs can be effective and reliable tools for monitoring wildlife populations, when they are designed appropriately and engage in active assessments of their own goals and targets, as well as incorporate feedback from participants as active collaborators. SealSpotter has attracted an engaged global community of all ages and is one of many international citizen science programs working to connect people to the marine environment.
Data availability statement
The original contributions presented in the study are included in the article/Supplementary Material. Further inquiries can be directed to the corresponding author.
Ethics statement
The animal study was approved by Phillip Island Nature Parks Ethics Committee. The study was conducted in accordance with the local legislation and institutional requirements. Research was performed under Australian Civil Aviation Safety Authority legislation, Phillip Island Nature Parks Ethics approvals and Wildlife Research Permits 10007974, 10009034 and 10010309.
Author contributions
PP: Writing – original draft, Writing – review & editing. RH: Writing – original draft, Writing – review & editing. RM: Writing – original draft, Writing – review & editing.
Funding
The author(s) declare financial support was received for the research, authorship, and/or publication of this article. Funded by Phillip Island Nature Parks, Penguin Foundation and Telematics Trust.
Acknowledgments
We acknowledge the Bunurong People, Traditional Owners of Phillip Island (Millowl) where this research was based. We would especially like to thank all the participants of SealSpotter over the years, this project has only been possible because of your involvement and especially those that come back every year to support the program. Thanks to the Penguin Foundation members that trialed the first iteration of SealSpotter and helped to develop the live version for 2017 release (www.penguinfoundation.org.au, accessed 14/12/2023). Thanks to the Victorian Fisheries Authority for providing mother vessel support when needed to perform surveys and all the volunteers that assisted with drone flights. Thank you to Lige Tan for helping with data analyses and Adam Yaney-Keller for reviewing the manuscript draft. Thank you to the Phillip Island Nature Parks media and communications team, and the Australian Citizen Science Association, the Royal Society of Victoria and the Australian Marine Science Association for promoting the Annual SealSpotter Challenge.
Conflict of interest
The authors declare that the research was conducted in the absence of any commercial or financial relationships that could be construed as a potential conflict of interest.
Publisher’s note
All claims expressed in this article are solely those of the authors and do not necessarily represent those of their affiliated organizations, or those of the publisher, the editors and the reviewers. Any product that may be evaluated in this article, or claim that may be made by its manufacturer, is not guaranteed or endorsed by the publisher.
Supplementary material
The Supplementary Material for this article can be found online at: https://www.frontiersin.org/articles/10.3389/fcosc.2024.1412510/full#supplementary-material
Footnotes
- ^ https://www.zooniverse.org/projects [Accessed 22/05/2024].
- ^ https://www.penguins.org.au/conservation/research/seal-research/ [Accessed March 12, 2024].
- ^ https://penguinfoundation.org.au [Accessed 29 March 2024].
- ^ https://www.www.sealionspotter.com/ [Accessed May 20, 2024].
- ^ https://aussiebirdcount.org.au/ [accessed 4 April 2024].
- ^ https://penguinfoundation.org.au/donate/adopt/australian-fur-seal [accessed 28 May 2024].
- ^ https://sgbcllen.org.au/students-engage-in-seal-research/ [Accessed May 20, 2024].
- ^ https://www.csiro.au/en/education/programs/indigenous-stem-education-project [Accessed May 20, 2024].
- ^ https://www.redmap.org.au [Accessed May 20, 2024].
- ^ https://ebird.org [Accessed May 20, 2024].
- ^ https://www.inaturalist.org [Accessed May 20, 2024].
- ^ https://www.zooniverse.org [Accessed May 20, 2024].
References
Apprill A., Miller C. A., Moore M. J., Durban J. W., Fearnbach H., Barrett-Lennard L. G. (2017). Extensive core microbiome in drone-captured whale blow supports a framework for health monitoring. Msystems 2, e00119–e00117. doi: 10.1128/mSystems.00119-17
Berkson J. M., DeMaster D. P. (1985). Use of pup counts in indexing population changes in pinnipeds. Can. J. @ Fish. Aquat. Sci. 42, 873–879. doi: 10.1139/f85-111
Brown E. D., Williams B. K. (2019). The potential for citizen science to produce reliable and useful information in ecology. Conserv. Biol. 33, 561–569. doi: 10.1111/cobi.13223
Chapin F. S., Carpenter S. R., Kofinas G. P., Folke C., Abel N., Clark W. C., et al. (2010). Ecosystem stewardship: sustainability strategies for a rapidly changing planet. Trends. Ecol. Evol. 25, 241–249. doi: 10.1016/j.tree.2009.10.008
Chen Y.-W., Chiang P.-J. (2024). An automated approach for hemocytometer cell counting based on image-processing method. Measurement 234, 114894. doi: 10.1016/j.measurement.2024.114894
Chen R., Ghobakhlou A., Narayanan A., Pérez M., Oyanadel R. O. C., Borras-Chavez R. (2023). “Semi-supervised deep learning for estimating fur seal numbers,” in 38th International Conference on Image and Vision Computing New Zealand (IVCNZ). Eds. Bailey D., Punchihewa A., Paturkar A. (IEEE, Massey University, New Zealand), 1–5.
Chiaravallti R. M., Skarlatidou A., Hoyte S., Badia M. M., Haklay M., Lewis J. (2022). Extreme citizen science: Lessons learned from initiatives around the globe. Conserv. Sci. Pract. 4, e577. doi: 10.1111/csp2.577
Christin S., Hervet É., Lecomte N. (2019). Applications for deep learning in ecology. Methods Ecol. Evol. 10, 1632–1644. doi: 10.1111/2041-210X.13256
Cox J., Oh E. Y., Simmons B., Lintott C., Masters K., Greenhill A., et al. (2015). Defining and measuring success in online citizen science: A case study of Zooniverse projects. Comput. Sci. Eng. 17, 28–41. doi: 10.1109/MCSE.2015.65
Cummings C. R., Lea M. A., Lyle J. M. (2019). Fur seals and fisheries in Tasmania: an integrated case study of human wildlife conflict and coexistence. Biol. Cons. 236, 532–542. doi: 10.1016/j.biocon.2019.01.029
Dujon A. M., Ierodiaconou D., Geeson J. J., Arnould J. P. Y., Allan B. M., Katselidis K. A., et al. (2021). Machine learning to detect marine animals in UAV imagery: effect of morphology, spacing, behavior and habitat. Remote Sens. Ecol. Conserv. 7, 341–354. doi: 10.1002/rse2.205
Ellwood E. R., Crimmins T. M., Miller-Rushing A. J. (2017). Citizen science and conservation: Recommendations for a rapidly moving field. Biol. Cons. 208, 1–4. doi: 10.1016/j.biocon.2016.10.014
Ersts P. J. DotDotGoose (version 1.7.0). American Museum of Natural History, Center for Biodiversity and Conservation. Available online at: https://biodiversityinformatics.amnh.org/open_source/dotdotgoose/ (Accessed 2024-1-18).
Gonzalez L. F., Montes G. A., Puig E., Johnson S., Mengersen K., Gaston K. J. (2016). Unmanned aerial vehicles (UAVs) and artificial intelligence revolutionizing wildlife monitoring and conservation. Sensors 16, 97. doi: 10.3390/s16010097
Groot B., Abma T. (2022). Ethics framework for citizen science and public and patient participation in research. BMC Med. Ethics 23, 23. doi: 10.1186/s12910-022-00761-4
Hinke J. T., Giuseffi L. M., Hermanson V. R., Woodman S. M., Krause D. J. (2022). Evaluating thermal and color sensors for automating detection of penguins and pinnipeds in images collected with an unoccupied aerial system. Drones 6, 255. doi: 10.3390/drones6090255
Hodgson J. C., Baylis S. M., Mott R., Herrod A., Clarke R. H. (2016). Precision wildlife monitoring using unmanned aerial vehicles. Sci. Rep. 6, 22574. doi: 10.1038/srep22574
Hodgson J. C., Holman D., Terauds A., Koh L. P., Goldsworthy S. D. (2020). Rapid condition monitoring of an endangered marine vertebrate using precise, non-invasive morphometrics. Biol. Conserv. 242, 108402. doi: 10.1016/j.biocon.2019.108402
Hodgson J. C., Koh L. P. (2016). Best practice for minimizing unmanned aerial vehicle disturbance to wildlife in biological field research. Curr. Biol. 26, R404–R405. doi: 10.1016/j.cub.2016.04.001
Hodgson J. C., Mott R., Baylis S. M., Pham T. T., Wotherspoon S., Kilpatrick A. D., et al. (2018). Drones count wildlife more accurately and precisely than humans. Methods Ecol. Evol. 9, 1160–1167. doi: 10.1111/2041-210X.12974
Hoegh-Guldberg O., Bruno J. F. (2010). The impact of climate change on the world's marine ecosystems. Science 328, 1523–1528. doi: 10.1126/science.1189930
Howell L. G., Allan B. M., Driscoll D. A., Ierodiaconou D., Doran T. A., Weston M. A. (2023). Attenuation of responses of waterbirds to repeat drone surveys involving a sequence of altitudes and drone yypes: A Case Study. Drones 7, 497. doi: 10.3390/drones7080497
Ierodiaconou D., Kennedy D. M., Pucino N., Allan B. M., McCarroll R. J., Ferns L. W., et al. (2022). Citizen science unoccupied aerial vehicles: A technique for advancing coastal data acquisition for management and research. Cont. Shelf. Res. 244, 104800. doi: 10.1016/j.csr.2022.104800
Kelly R., Beasy K., Lucas C., Mocatta G., Pecl G. T. (2023). Answering Children’s Questions on Climate Change: Curious Climate Schools. In: Beasy K., Smith C., Watson J. (eds) Education and the UN Sustainable Development Goals. Education for Sustainability (Singapore: Springer), 445–458. doi: 10.1007/978-981-99-3802-5_24
Kelly R., Elsler L. G., Polejack A., van der Linden S., Tönnesson K., Schoedinger S. E., et al. (2022a). Empowering young people with climate and ocean science: Five strategies for adults to consider. One Earth. 5, 861–874. doi: 10.1016/j.oneear.2022.07.007
Kelly R., Evans K., Alexander K., Bettiol S., Corney S., Cullen-Knox C., et al. (2022b). Connecting to the oceans: supporting ocean literacy and public engagement. Rev. Fish. Biol. Fish. 32, 123–143. doi: 10.1007/s11160-020-09625-9
Kelly R., Fleming A., Pecl G. T., von Gönner J., Bonn A. (2020). Citizen science and marine conservation: a global review. Phil. Trans. R. Soc B. 375, 20190461. doi: 10.1098/rstb.2019.0461
McIntosh R. R., Holmberg R., Dann P. (2018). Looking without landing—using remote piloted aircraft to monitor fur seal populations without disturbance. Front. Mar. Sci. 5, 2018. doi: 10.3389/fmars.2018.00202
McIntosh R. R., Kirkwood R., Sutherland D. R., Dann P. (2015). Drivers and annual estimates of marine wildlife entanglement rates: A long-term case study with Australian fur seals. Mar. pollut. Bull. 101, 716–725. doi: 10.1016/j.marpolbul.2015.10.007
McIntosh R. R., Sorrell K. J., Thalmann S., Mitchell A., Gray R., SChinagl H., et al. (2022). Sustained reduction in numbers of Australian fur seal pups: Implications for future population monitoring. PloS One 17, e0265610. doi: 10.1371/journal.pone.0265610
McKinley E., Burdon D., Shellock R. (2023). The evolution of ocean literacy: A new framework for the United Nations Ocean Decade and beyond. Mar. pollut. Bull. 186, 114467. doi: 10.1016/j.marpolbul.2022.114467
McLean LJ, George S, Ierodiaconou D, Kirkwood RJ, Arnould JPY. (2018). Impact of rising sea levels on Australian fur seals. PeerJ 6:e5786. doi: 10.7717/peerj.5786
Melbourne-Thomas J., Audzijonyte A., Brasier M. J., Cresswell K. A., Fogarty H. E., Haward M., et al. (2021). Poleward bound: adapting to climate-driven species redistribution. Rev. Fish. Biol. Fish. 32, 231–251. doi: 10.1007/s11160-021-09641-3
Miller J. A., Libuše Hannah V., Deterding S., Cooper S. (2023). Practical recommendations from a multi-perspective needs and challenges assessment of citizen science games. PloS One 18, 1–34. doi: 10.1371/journal.pone.0285367
Nash K. L., Van Putten I., Alexander K. A., Bettiol S., Cvitanovic C., Farmery A. K., et al. (2022). Oceans and society: feedbacks between ocean and human health. Rev. Fish. Biol. Fish. 32, 161–187. doi: 10.1007/s11160-021-09669-5
Nursey-Bray M., Palmer R., Pecl G. (2018). Spot, log, map: Assessing a marine virtual citizen science program against Reed's best practice for stakeholder participation in environmental management. Ocean Coast. Manage. 151, 1–9. doi: 10.1016/j.ocecoaman.2017.10.031
Pecl G. T., Araújo M. B., Bell J. D., Blanchard J., Bonebrake T. C., Chen I.-C., et al. (2017). Biodiversity redistribution under climate change: Impacts on ecosystems and human well-being. Science 355, eaai9214. doi: 10.1126/science.aai9214
Pecl G. T., Kelly R., Lucas C., van Putten I., Badhe R., Champion C., et al. (2023). Climate-driven ‘species-on-the-move’ provide tangible anchors to engage the public on climate change. People Nat. 5, 1384–1402. doi: 10.1002/pan3.10495
Pucino N., Kennedy D. M., Carvalho R. C., Allan B., Ierodiaconou D. (2021). Citizen science for monitoring seasonal-scale beach erosion and behavior with aerial drones. Sci. Rep. 11, 3935. doi: 10.1038/s41598-021-83477-6
Ramírez F., Afán I., Davis L. S., Chiaradia A. (2017). Climate impacts on global hot spots of marine biodiversity. Sci. Adv. 3, e1601198. doi: 10.1126/sciadv.1601198
R Core Team. (2018). R: A language and environment for statistical computing (Vienna, Austria: R Foundation for Statistical Computing).
Ryabinin V., Barbière J., Haugan P., Kullenberg G., Smith N., McLean C., et al. (2019). The UN decade of ocean science for sustainable development. Front. Mar. Sci. 6, 470. doi: 10.3389/fmars.2019.00470
Schoedinger S., Tran L. U., Whitley L. (2010). From the principles to the scope and sequence: A brief history of the ocean literacy campaign. NMEA Spec Rep 3, 3–7. Available at: https://current-journal.com/articles/75/files/submission/proof/75-1-542-1-10-20220314.pdf#page=5.
Shellock R. J., Cvitanovic C., McKinnon M. C., Mackay M., van Putten I., Blythe J., et al. (2022). Building leaders for the UN Ocean Science Decade: a guide to supporting early career women researchers within academic marine research institutions. ICES J. Mar. Sci. 80, 56–75. doi: 10.1093/icesjms/fsac214
Smith S. D., Davis T. R. (2019). Slugging it out for science: Volunteers provide valuable data on the diversity and distribution of heterobranch sea slugs. Molluscan Res. 39, 214–223. doi: 10.1080/13235818.2019.1594600
Sorrell K. J., Clarke R. H., Holmberg R., McIntosh R. R. (2019). Remotely piloted aircraft improve precision of capture–mark–resight population estimates of Australian fur seals. Ecosphere 10, e02812. doi: 10.1002/ecs2.2812
Sorrell K. J., Dawlings F. M., Mackay C. E., Clarke R. H. (2023). Routine and safe operation of remotely piloted aircraft systems in areas with high densities of flying birds. Drones 7, 510. doi: 10.3390/drones7080510
Spiers H., Swanson A., Fortson L., Simmons B., Trouille L., Blickhan S., et al. (2019). Everyone counts? Design considerations in online citizen science. J. Sci. Commun. 18. doi: 10.22323/2.18010204
Strasser B. J., Baudry J., Mahr D., Sanchez G., Tancoigne E. (2019) “‘Citizen Science’? Rethinking Science and Public Participation”, Science & Technology Studies, 32(2), pp. 52–76. doi: 10.23987/sts.60425
Strasser B. J., Tancoigne E., Baudry J., Piguet S., Spiers H., Luis-Fernandez Marquez J., et al. (2023). Quantifying online citizen science: Dynamics and demographics of public participation in science. PloS One 18, e0293289. doi: 10.1371/journal.pone.0293289
Sutherland W. J., Newton I., Green R. (2004). Bird ecology and conservation: a handbook of techniques. 1st ed. (New York, New York, USA: Oxford University Press).
Taylor S., Terkildsen M., Stevenson G., de Araujo J., Yu C., Yates A., et al. (2021). Per and polyfluoroalkyl substances (PFAS) at high concentrations in neonatal Australian pinnipeds. Sci. Tot. Environ. 786, 147446. doi: 10.1016/j.scitotenv.2021.147446
The State of Victoria Department of Environment, Land, Water and Planning. (2020). Marine and Coast Policy, Melbourne: Finsbury Green 93. pp.
Viola B. M., Sorrell K. J., Clarke R. H., Corney S. P., Vaughan P. M. (2022). Amateurs can be experts: A new perspective on collaborations with citizen scientists. Biol. Conserv. 274, 109739. doi: 10.1016/j.biocon.2022.109739
Wall D., Thalmann S., Wotherspoon S., Lea M.-A. (2023). Is regional variability in environmental conditions driving differences in the early body condition of endemic Australian fur seal pups? Wild. Res. 50, 993–1007. doi: 10.1071/WR22113
Weimerskirch H., Prudor A., Schull Q. (2018). Flights of drones over sub-Antarctic seabirds show species-and status-specific behavioral and physiological responses. Polar. Biol. 41, 259–266. doi: 10.1007/s00300-017-2187-z
Weiser E. L., Diffendorfer J. E., Lopez-Hoffman L., Semmens D., Thogmartin W. E. (2020). Challenges for leveraging citizen science to support statistically robust monitoring programs. Biol. Cons. 242, 108411. doi: 10.1016/j.biocon.2020.108411
Wiley D. N., Zadra C. J., Friedlaender A. S., Parks S. E., Pensarosa A., Rogan A., et al. (2023). Deployment of biologging tags on free swimming large whales using uncrewed aerial systems. R. Soc Open Sci. 10, 221376. doi: 10.1098/rsos.221376
Wood S. A., Robinson P. W., Costa D. P., Beltran R. S. (2021). Accuracy and precision of citizen scientist animal counts from drone imagery. PLoS One 16, e0244040. doi: 10.1371/journal.pone.0244040
Worm B., Elliff C., Fonseca J. G., Gell F. R., Serra-Gonçalves C., Helder N. K., et al. (2021). Making ocean literacy inclusive and accessible. Ethics. Sci. Environ. Polit. 21, 1–9. doi: 10.3354/esep00196
Yammine S. Z., Liu C., Jarreau P. B., Coe I. R. (2018). Social media for social change in science. Science 360, 162–163. doi: 10.1126/science.aat7303
Keywords: Arctocephalus pusillus doriferus, citizen science, drones, marine mammal, monitoring, ocean literacy, population trends, remote piloted aircraft
Citation: Puskic PS, Holmberg R and McIntosh RR (2024) Successful citizen science tools to monitor animal populations require innovation and communication: SealSpotter as a case study. Front. Conserv. Sci. 5:1412510. doi: 10.3389/fcosc.2024.1412510
Received: 05 April 2024; Accepted: 09 August 2024;
Published: 06 September 2024.
Edited by:
Andrea Bogomolni, University of Massachusetts Boston, United StatesReviewed by:
Ted Cheeseman, Southern Cross University, AustraliaKrista K. Ingram, Colgate University, United States
Copyright © 2024 Puskic, Holmberg and McIntosh. This is an open-access article distributed under the terms of the Creative Commons Attribution License (CC BY). The use, distribution or reproduction in other forums is permitted, provided the original author(s) and the copyright owner(s) are credited and that the original publication in this journal is cited, in accordance with accepted academic practice. No use, distribution or reproduction is permitted which does not comply with these terms.
*Correspondence: Rebecca R. McIntosh, cm1jaW50b3NoQHBlbmd1aW5zLm9yZy5hdQ==