 Shelley L. Nelson1*
 D. Joanne Saher1John Huang1
 Donald T. McKinnon2
 Amelia Coleing2Ilsa A. Griebel2Troy I. Wellicome3Axel Moehrenschlager2,4
 Julie A. Heinrichs1
- 1Computational Ecology Group Inc., Canmore, AB, Canada
- 2Wilder Institute/Calgary Zoo, Calgary, AB, Canada
- 3Department of Biological Sciences, University of Alberta, Edmonton, AB, Canada
- 4Conservation Translocation Specialist Group International Union for Conservation of Nature Species Survival Commission, Calgary, AB, Canada
Translocation of captive-bred animals is a widely used conservation strategy to support the recovery of imperiled wild populations. Identifying which factors enhance or limit survival after release can be important in adapting translocation strategies, particularly for species with low survival rates after release from captivity. Many translocation programs track post-translocation survival, but few complete spatial-statistical assessments of mortality risk associated with release environments. Typically, few animals are released from captive breeding programs, limiting the sample size available for analyses. We aimed to create a workflow that used limited datasets to evaluate the influence of spatial conditions and other factors on mortality risk. Greater sage-grouse (Centrocercus urophasianus) are endangered in Canada and of conservation concern throughout their range in the United States. After the species declined precipitously in Canada, a captive breeding program was initiated with subsequent releases in Alberta and Saskatchewan. Despite success in captive breeding, mortality rates of released sage-grouse were high. We used GPS- and VHF-based locations of released sage-grouse to determine how spatial features influence mortality risk of sage-grouse after release from captivity. We implemented a multistep approach to quantify and map risk relative to the environmental features associated with mortality. We also assessed whether the movement behaviors of sage-grouse correspond with environmental risk factors by using a combination of survival models and integrated step-selection functions. Mortality of sage-grouse in Alberta was hastened in areas close to anthropogenic disturbance. Although birds in Alberta avoided areas of higher mortality risk, those in Saskatchewan did not, perhaps due to environmental and selection constraints. This multistep approach allowed us to utilize small sample sizes to assess key risk factors in the landscape. This process supports the adaptive modification of translocation plans and can similarly support other data-limited scientists and managers in assessing environmental mortality risk and defining conservation actions for endangered species.
1 Introduction
Wild environments are dynamic and complex. As natural environments change, conservation practitioners increasingly need to make high-stakes decisions with available environmental and population information, and analyses that make use of limited data (Armstrong and Seddon, 2008). Conservation translocation programs often operate within this decision and information space. Translocation planners make decisions on where to release animals and how to modify the release environment at the onset of the program with the information available, which is often uncertain. Plans can be modified as information on outcomes are collected, but the adaptive feedback loop can be slowed or stalled by the challenges of using small datasets.
Conservation translocations are often used to relocate animals and bolster populations on the brink of extirpation (Snyder et al., 1996; Berger-Tal et al., 2020) and have helped conserve many threatened species (Seddon et al., 2014). Conservation translocations (hereafter, translocations) benefit species at imminent risk of decline and extinction by moving organisms from one location to another, and include reintroductions (e.g., into the historical range from which a species has been extirpated) and (or) as reinforcements (e.g., to augment extant populations, IUCN/SSC, 2013; Seddon et al., 2014). Translocations generally require a high degree of conservation effort (e.g., time and resources, Fischer and Lindenmayer, 2000), involve a high degree of uncertainty, and result in varying degrees of success (Griffith et al., 1989; Fischer and Lindenmayer, 2000). Translocation program success is often difficult to measure because this assessment requires long-term data and standardized criteria success, both of which are often lacking (Morris et al., 2021; Marino et al., 2024). Success of translocations is frequently gauged based on environmental (e.g., habitat quality, improvement, or range; predation; competition), species-specific (e.g., reproductive potential, migratory tendency, diet, survival, genetic diversity), methodological (e.g., origin and number of released individuals, program duration, release method, age at release), and other factors (e.g., public perception and support, stakeholder relationships, program management, and long-term commitment to the project) (Rummel et al., 2016; Marino et al., 2024). Evidence of translocation success has been seen in a variety of species including the Arabian oryx (Oryx leucoryx; Al Jahdhami et al., 2011), California condor (Gymnogyps californianus; Parish and Hunt, 2016), Lord Howe Island woodhen (Hypotaenidia sylvetris; Frith, 2013), Mallorcan midwife toad (Alytes muletensis; Bloxam and Tonge, 1995; IUCN, 2018), natterjack toad (Bufo calamita; Denton et al., 1997), duskytail darter (Etheostoma percnurum; Shute et al., 2005), American burying beetle (Nicrophorus americanus; Amaral et al., 1997), and swift fox (Vulpes velox; Moehrenschlager and Moehrenschlager, 2001; Cullingham and Moehrenschlager, 2013). However, translocation success rates have not generally increased, despite significant advances in translocation research (Bubac et al., 2019). Captive breeding and release exemplifies a high-risk, high-cost strategy and this approach is used when few other conservation options remain (Ferrer et al., 2018; Berger-Tal et al., 2020).
Captive breeding and release programs often aim to create and sustain a captive assurance population by adding animals that can survive and reproduce to wild populations (McCarthy et al., 2012; Seddon et al., 2012). These programs have successfully restored several imperiled populations to pre-endangered numbers (e.g., peregrine falcon, Falco peregrinus, Tordoff and Redig, 2001; Mauritius kestrel, Falco punctatus Temmink, Nicoll et al., 2004). Yet, many programs, have difficulty producing animals that survive long enough to reproduce in wild populations. Among other reasons, survival can be low because translocated animals are introduced to an unfamiliar landscape and lack knowledge of locally-relevant mortality risks (Bell, 2016). They may select poor-quality or sink habitats (Le Gouar et al., 2012), move through areas of high predation risk, and make poor dietary choices (Berger-Tal et al., 2020).
The release environment can greatly influence survival and the success of translocations to wild populations (Osborne and Seddon, 2012). Release environments are heterogeneous and present mortality risks such as spatially varying predator abundance, sources of collision and disturbance, and movement, food, and cover constraints (Le Gouar et al., 2012). An understanding of the mortality risks associated with the release environment can be integral to the success of translocation programs (IUCN/SSC, 2013), by leading managers to optimize potential release locations or other environmental conditions (Moehrenschlager and Lloyd, 2016). However, quantifying which environmental factors present mortality risk can be challenging.
In the absence of more complete information, characterizations of habitat are often expected to represent places that support the survival of released animals (Osborne and Seddon, 2012). Managers may also use informal or formal expert-driven approaches to assess environmental risk in the release area by evaluating the ability of the environment to support the species’ life history and resource needs (e.g., habitat maps or other proxy information), and local knowledge of predators and threats (Nichols and Armstrong, 2012). By weighing and mapping these factors, managers can select release areas and sites to minimize mortality risk. These assumptions or hypotheses of mortality risk factors and locations facilitate timely action. However, translocation and release plans could be adapted over time with survival data collected from the first few years of release programs, and spatial-statistical analyses that test habitat-risk assumptions and expert hypotheses.
Quantitative risk analyses for translocated animals are difficult to do with small sample sizes of released animals and a myriad of potential sources of environmental risk, dissuading translocation practitioners from pursuing spatial-statistical analyses (Armstrong and Seddon, 2008). Generally, a small number of animals are released and most die soon after (Teixeira et al., 2007), leaving few records to evaluate factors associated with longer-term survival. Prior to death, animals experience a range of risks as they traverse the landscape (Nichols and Armstrong, 2012). Evaluating the risk factors associated with the journey, rather than simply the location of death or the site of transmitter recovery, presents another challenge.
In this paper, we provide an example of a multistep workflow that leverages limited animal location data to characterize the risk landscape. We developed this workflow using a Galliform listed as endangered by the Canadian Species at Risk Act (SARA), the Greater sage-grouse (Centrocercus urophasianus). We first constrained the list of potential environmental factors by conducting univariate analyses on all hypothesized environmental risk factors, then built multivariate models with all key or significant variables to understand the factors most influencing time to mortality. We included the species’ habitat map as a potential covariate to test the expectation that habitat areas with higher selection values confer lower mortality risk. We used a spatial survival model that assesses risk using the location history of each animal and mapped the resulting multivariate model to visualize the risk landscape. Subsequently, we used a step-selection function to assess the congruence of movement behavior with mapped mortality risk by evaluating movement speeds, turn angles, and movement-selection decisions by animals relative to the risk map. This workflow yielded an understanding of which environmental features are associated with shorter and longer survival times, the locations of key risk areas, and how released animals behaved in response to those features. We discuss how these analytical results could lead to new spatial strategies to improve post-release survival in terms of release sites and changes to environmental conditions. We also discuss whether environmental changes that reduce mortality risks are likely to be perceived by an animal and result in different movement behavior.
2 Materials and methods
2.1 Study species and area
Galliformes are challenging to keep alive and breed in captivity (Lance et al., 1970; Flieg, 1971; Johnsguard, 1983; Hancock, 1993), and their post-release survival and integration into wild populations has proved to be even more difficult (Parker et al., 2012; Carrlson et al., 2014; Mathews et al., 2016). Translocations of captive-bred Galliformes to wild environments generally result in few individuals surviving to reproduce the subsequent year (Sokos et al., 2008; Wiechman et al., 2011; Collar, 2020). Most die within a few weeks post release, primarily from predation (Parish and Sotherton, 2007; Merta et al., 2016), partly as a result of poor predator avoidance behaviors of inexperienced birds (Rantanen et al., 2010). High post-release mortality may also be due to suboptimal habitat selection and lower fitness (Rantanen et al., 2010), physiological stress during both pre- and post-release periods (Dickens et al., 2009), and exposure to weather, malnutrition and (or) starvation (Thompson et al., 2015). When captive-bred Galliformes do survive to reproduce, they can produce fewer offspring relative to their wild counterparts (e.g., 0.05 hatched chicks per released female vs. 2.09 hatched chicks per wild female, Putaala and Hissa, 1998) due to hen and egg predation (Putaala and Hissa, 1998; Parish and Sotherton, 2007) and suboptimal habitat selection and higher nest abandonment (Sage et al., 2003).
Galliformes, especially Greater sage-grouse; hereafter, sage-grouse), are known to reside in suboptimal locations where they may not perceive risk and modify their movements to optimize their fitness (Aldridge and Boyce, 2007; Heinrichs et al., 2018; Pratt and Beck, 2021). Hence, knowledge of how sage-grouse navigate through the risk landscape could reveal mismatches in perceived and actual risk (Pratt and Beck, 2021). This information may be useful in avoiding the assumption that translocated sage-grouse perceive risk as mapped or confirming they are responding to risk in a novel wild environment (Parker et al., 2012). This information would also inform and direct recovery planning and decision-making regarding habitat management that would optimize resources and maximize conservation gain (i.e., focus improvements where most valuable).
Like other Galliformes, sage-grouse were historically abundant throughout North America, but declined precipitously during the 20th century due to habitat conversion, degradation, fragmentation, and reduction of sagebrush (Artemisia spp.) (Knick et al., 2003; Connelly et al., 2004; Aldridge et al., 2008). In Canada, only two small isolated populations remain in Alberta and Saskatchewan, and sage-grouse have declined by up to 92% in the last ~30 years (Environment Canada, 2014). As such, sage-grouse are considered endangered in Canada under the Canadian SARA (Environment Canada, 2014), prompting an urgent response including a captive breeding and release program to augment wild populations. Adaptive improvements to both the program and release environment are ongoing to support the recovery of sage-grouse in Canada. Habitat restoration, reclamation, infrastructure removal, beneficial grazing, and a multitude of other practices have been identified in recovery plans and implemented on the ground (AESRD, 2013; Parks Canada Agency, 2021).
Sage-grouse are sagebrush-obligate species and use sagebrush throughout much of their life cycle for food and cover. Although the species once flourished in Canada, human-induced changes to the environment (e.g., vegetation, predator guild, disturbance) have contributed to sage-grouse population declines. Sage-grouse currently exist in a mosaic of public and private lands in Canada, and their survival across the species' range is affected by a range of environmental factors and stressors including anthropogenic features (e.g., energy infrastructure, roads, buildings; Aldridge and Boyce, 2007), agricultural development and activities (Beck et al., 2006), predators (Tack, 2009), and insufficient habitat (e.g., inadequate sagebrush, shrub and grass cover; Connelly et al., 2004; Gregg and Crawford, 2010; rugged terrain, Beers and Frey, 2022). Large portions of the species’ habitat and current range are protected, and critical habitat has been identified and mapped using a resource selection function (Environment Canada, 2014). In Canada, sage-grouse critical habitat includes areas with large patches of moderate and spatially-dispersed shrub cover (e.g., silver sagebrush), minimal bare ground, moderately moist habitats with some amount of lush green vegetative cover, adequate availability of forage forbs, as well as areas with lower intensity of anthropogenic disturbance (e.g., human settlements, roads, fences, annual cropland, artificial structures for avian predators (Environment Canada, 2014).
We assessed mortality risk using animal location and known fate data from captive-bred sage-grouse that were released at two release sites (near Manyberries, Alberta; and west block of Grasslands National Park near Val Marie, Saskatchewan; Figure 1). Both study sites are within the mixed-grass prairie ecoregion (Alberta Parks, 2015; Parks Canada, 2022), where silver sagebrush (A. cana) is the dominant shrub species (see Supplementary Materials for further details).
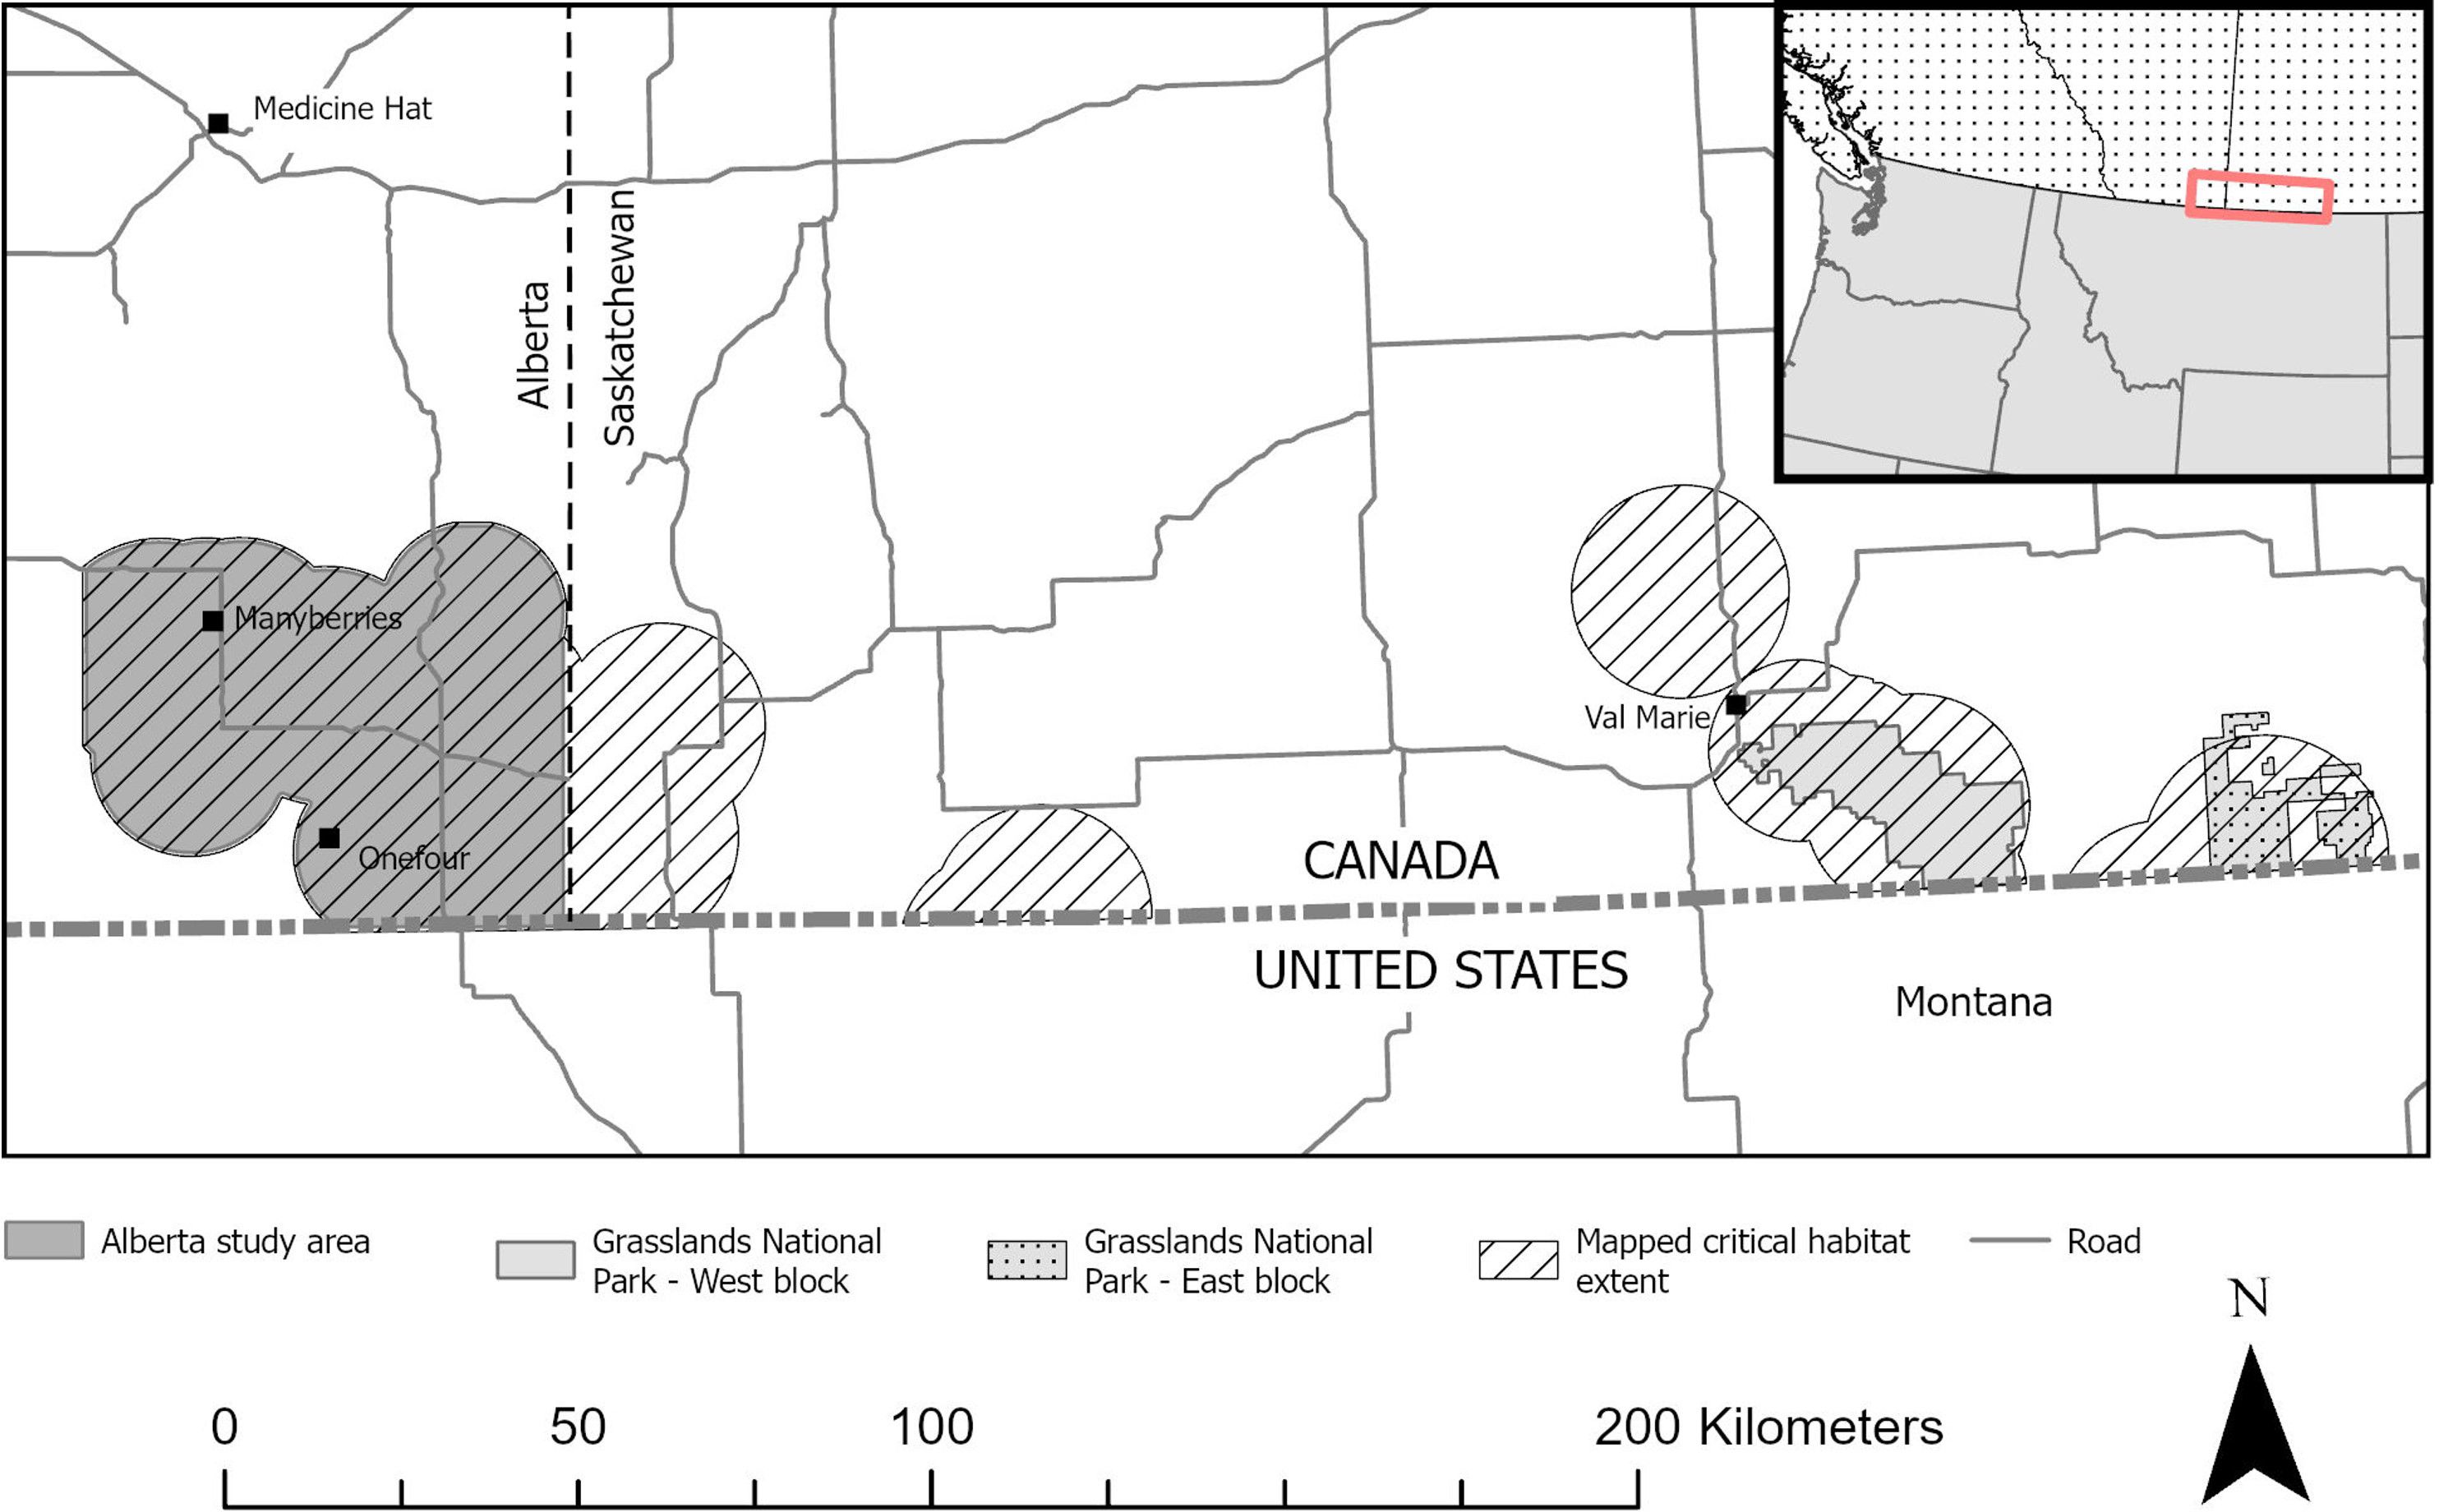
Figure 1. Two study sites where captive-bred Greater Sage-grouse (Centrocercus urophasianus) were released from 2018 to 2022 in Alberta and Saskatchewan, Canada, and where mortality risk, habitat selection, and movement were evaluated post release.
2.2 Threats
In Alberta and Saskatchewan, sage-grouse habitat includes several potential stressors or risks including avian predator perches (e.g., trees, powerlines, fence posts), habitat loss (e.g., lack of shrub cover), and environmental disturbance (e.g., energy infrastructure, increased vehicle traffic) (Environment Canada, 2014). Cattle grazing occurs across much of the sage-grouse range on private lands, provincially designated grazing leases, and federally designated grazing areas. The Alberta and Saskatchewan study areas differ in the composition and spatial distribution of risk factors. For instance, much of the sage-grouse habitat in Alberta has been affected by oil and gas extraction activities, whereas anthropogenic infrastructure is relatively limited in Grasslands National Park in Saskatchewan (Government of Saskatchewan, 2023). In Grasslands National Park, habitat is concentrated in the valley bottom, and limited in the West block of the park where sage-grouse were released (Thorpe and Stephens, 2017), with escarpments separating lowland and flat upland habitats. By contrast, sage-grouse habitat occurs across a larger area with varied topography in Alberta.
2.3 Captive rearing and release
Juvenile sage-grouse were released in Canada from 2018 to 2022 (n = 228), in Alberta (n = 119) and in Saskatchewan (n = 109). Sage-grouse were weighed, sexed, and tagged with transmitters before release and tracked until death or signal loss. Many sage-grouse mortalities occurred soon after release and proximate to the release site. These individuals had little opportunity to move away from the release site and select landscape features in the risk landscape. As our aim was to spatially understand the environmental covariates contributing to longer survival, we restricted analyses to individuals that survived at least 10 days after release. This also minimized the noise associated with the post-release ‘settling down’ period (Musil et al., 1993).
We categorized mortality as early (e.g., survived ≤ 10 days post release) and late (e.g., survived > 10 days post release), based on median survival days. We used the median survival as a threshold for including individuals (and all associated movement records) in the analysis, and exclusion of individuals that died too early to experience much of the post-release landscape. We used the median rather than average survival, because most sage-grouse died shortly after release, resulting in a right-skewed distribution. When carcasses were found, a cause of death was determined with either high or low confidence by biologists at the Wilder Institute at the Calgary Zoo (Supplementary Table 1). We analyzed bird location data separately for each province of release and built models with both spring and fall release seasons combined, and only fall releases (i.e., in September and October).
2.4 Environmental covariates
To assess survival risk relative to environmental features, we developed a range of spatial data layers to use as covariates in our models. We selected similar types of covariates for each study site (Supplementary Tables 2–4) and developed layers to describe each family of covariate (e.g., anthropogenic disturbance, cover of shrubs and sagebrush, critical habitat, release site, roads, terrain, vegetation, vertical features, water). We included a map of critical habitat (Environment Canada, 2014), derived from a sage-grouse nest occurrence model for Alberta (Aldridge and Boyce, 2007), that was extrapolated to Saskatchewan. The resource selection function included covariates describing mean shrub cover within 1 km2, proportion of patchily distributed shrub cover within 1 km2, greenness and wetness indices, and relationships to roads and other built-features.
For each spatial variable, we derived proportion, proximity, or cover layers, summarized at various spatial scales to evaluate the scale of influence of each variables. For example, we summarized proportional data using two moving window sizes that are biologically relevant to sage-grouse. In Alberta, we tested survival responses to proportional covariates using windows sizes of 0.55 km, the median daily distance traveled by birds released in Alberta between 2018 and 2022, and a 1-km survival-infrastructure responses from previous research (e.g., Aldridge and Boyce, 2007). In Saskatchewan, we similarly evaluated the median daily distance traveled by birds released in Saskatchewan (2.3 km), and tested responses using a 0.56 km window used in other sage-grouse studies (e.g., Aldridge and Boyce, 2007; Fedy et al., 2014; Kirol et al., 2015; Parsons et al., 2022). We evaluated the predictive ability of each scale in univariate mortality risk analyses and retained the scale of the covariate that had the lowest Akaike Information Criteria corrected for small sample size (AICc, Burnham and Anderson, 2002).
Our primary focus was assessing spatial features influencing sage-grouse mortality risk; however, species traits (e.g., sex) and release features (e.g., timing, age at release) can also influence mortality (Swenson, 1986; Beck et al., 2006; Maness and Anderson, 2013). We included the following aspatial covariates in statistical analyses: acclimation period (e.g., > or < 14 days), age at release, body mass, raising method (e.g., hen- and hand-raised), release period (e.g., early release before October 17, and late release after October 17), release type (e.g., hard, modified soft, and soft), and sex (see Supplementary Materials for hypotheses).
2.5 Statistical analyses
We implemented a four-step approach to assess sage-grouse movements and mortality risks associated with environmental covariates (Figure 2). In step one, we conducted a univariate screening between covariates and mortality risk, to reduce the number of covariates entering multivariate models to accommodate sample size constraints. Prior to fitting models, we assessed correlation among covariates (Pearson’s r ≥ |0.70|). We standardized covariates by subtracting the covariate mean from the individual value and dividing it by the standard deviation. In step two, we built multivariate models of remaining covariates to assess time to mortality. In step three, we selected the top performing models and applied the multivariate equation to spatially referenced covariates to create a risk surface map. In step four, we fit a step-selection function using the sage-grouse GPS location data, risk surfaces (from step three), and existing critical habitat maps.
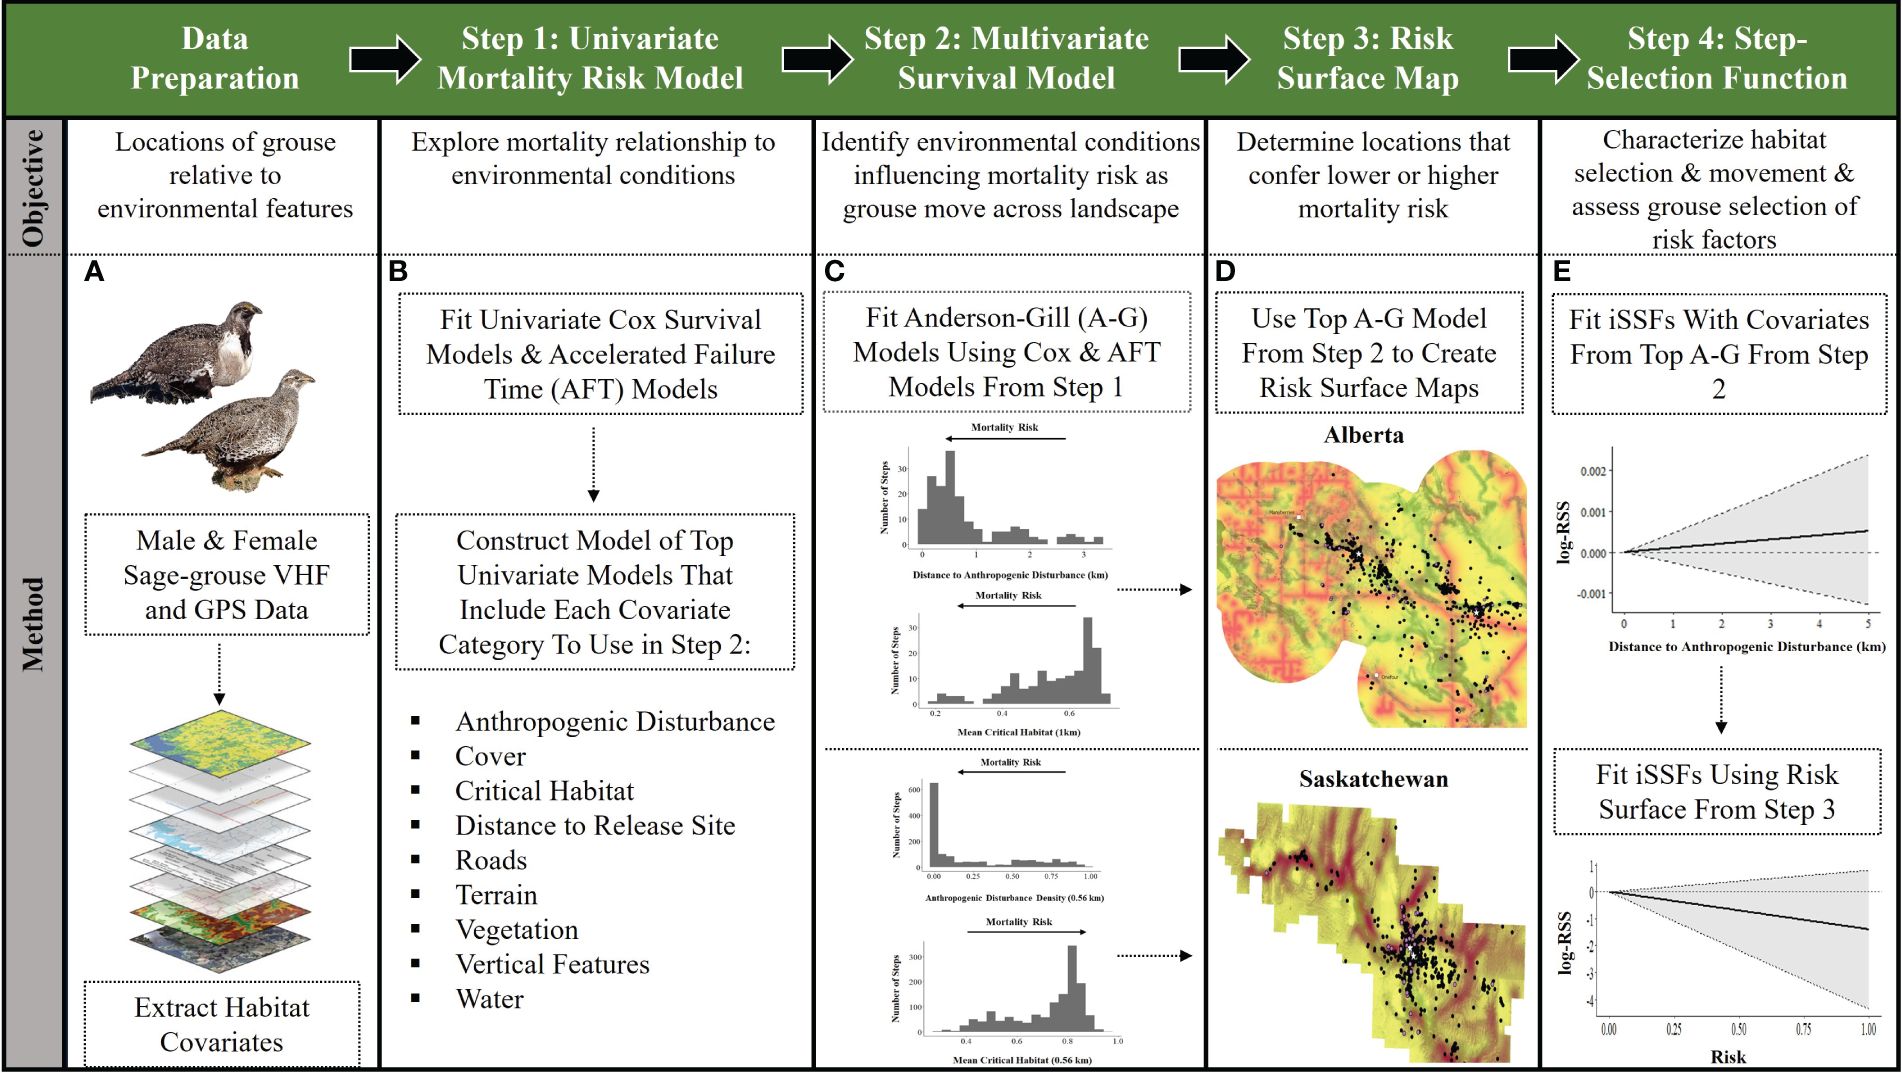
Figure 2. Steps taken to assess mortality risk, movement, and selection of mortality risk factors, for captive-bred and released Greater sage-grouse (Centrocercus urophasianus) in Alberta and Saskatchewan, Canada (2018–2022). Panel (A), VHF and GPS data from male and female sage-grouse are prepared by extracting habitat covariates at each location, including mortality locations. Panel (B), the data are then analyzed using univariate Cox Proportional Hazards and Accelerated Failure Time (AFT) models to explore relationships among environmental features and mortality locations (Step 1). Then, top univariate models (e.g., covariate 95% confidence bounds did not overlap zero) of the main covariate categories (e.g., anthropogenic disturbance, cover, critical habitat, distance to release site, release site, roads, terrain, vegetation, vertical features, water) were used to construct multivariate models due to sample size constraints. Panel (C), multivariate models were then fit with Andersen-Gill (A-G) models to identify which environmental conditions contribute to mortality risk as sage-grouse move across the landscape (Step 2). Plots depicted in Step 2 show the relationship between number of steps (locations) in relation to covariates in top A-G models for each Canadian province. Panel (D), top A-G models (from Step 2) are used to create risk surface maps from unstandardized β-coefficients applied to a logistic equation in ArcGIS Pro (Step 3). Panel (E), integrated step-selection functions (iSSFs) were fit with covariates from top A-G models (from Step 2) to characterize habitat selection and movement (Step 4). The first plot in Step 4 indicates a step is less likely to end in areas relative to distance to anthropogenic disturbance. Finally, iSSFs were fit using the risk surface from Step 3 to assess if grouse are selecting habitat based on perceived risk (Step 4). The second plot in Step 4 demonstrates sage-grouse are more likely to avoid risky habitat compared to what is available. Photos of Greater sage-grouse © Cornell Lab of Ornithology.
2.5.1 Univariate mortality risk model
In step one, we fit univariate Cox proportional hazards models (hereafter, Cox models; Figure 2) to assess which spatial covariates had the strongest independent influences on mortality risk, using the coxph function within the survival package in R (Therneau, 2023). This variable reduction step was necessary because we were constrained by a limited sample size of location and mortality data and needed to reduce the number of covariates entering multivariate models. We right-censored data from sage-grouse with unknown fates at the last known date alive and used midpoint-interval censoring to estimate the date of mortality for sage-grouse that did not have a known mortality date (Kalbfleisch and Prentice, 1980). We tested the proportional hazards assumption in Cox models by plotting the scaled Schoenfeld residuals for each variable against time (e.g., Johnson et al., 2004) using the cox.zph function within the survival package in R (Therneau, 2023). For models that violated the proportional hazards assumption, we stratified models by time (e.g., year, Therneau and Grambsch, 2000). We also assessed deviance residuals to identify potential outliers using the ggcoxdiagnostics function, along with evaluating Martingale residual plots to assess nonlinearity in covariates (Fox and Weisberg, 2018). For continuous covariates that violated the assumptions of linear effects on the logarithm of the hazard, we fit Cox models with smoothing splines, and assessed if there were significant differences (e.g., p-value > 0.05) among linear and spline Cox models using a likelihood ratio test (Mahboubi et al., 2011). If there were no significant differences between linear and spline Cox models, we proceeded with the linear Cox model. If spline-based Cox models outcompeted the linear Cox model but did not pass the proportional hazards test, we used the recommended alternative modeling approach of Accelerated Failure Time models (hereafter, AFT models; Saikia and Barman, 2017), using the flexsurspline function in the survival package in R (Jackson, 2016). Because AFT models require an assigned distribution of survival times, we compared several distributions (e.g., Weibull, lognormal, log-logistic) and selected the best fit distribution based on the lowest AICc (Burnham and Anderson, 2002; Saikia and Barman, 2017). We fit Cox and AFT univariate models to determine the covariates that strongly influenced mortality risk (e.g., 95% confidence bounds did not overlap zero), and compared models to their respective null model without covariates. We retained covariates within our nine main covariate categories (e.g., anthropogenic disturbance, cover of shrubs and sagebrush, critical habitat, release site, roads, terrain, vegetation, vertical features, water) that were strong predictors and (or) that outcompeted other covariates within the same covariate category (e.g., anthropogenic disturbance density within 1 km, proportion of development within 1 km). We combined the best-performing covariate (e.g., based on covariate 95% confidence bounds not overlapping zero or if not significant, based on lowest AICc of univariate models) in each of the nine covariate categories to create multivariate survival models.
2.5.2 Multivariate survival model
In step two, we used Andersen-Gill survival models (hereafter, survival models) to assess how covariates contribute to sage-grouse mortality risk as grouse move throughout the landscape (Figure 2). Andersen-Gill models explain how survival rates change with a given covariate (Johnson et al., 2004). These survival models are an extension of Cox models, that model entry date (i.e., starting time step), exit date (i.e., end time step), and an event for each encounter of an individual, where sample size is based on the number of events (i.e., encounter locations, Andersen and Gill, 1982). Andersen-Gill models can accommodate right-censored data (i.e., individuals with unknown fates, Johnson et al., 2004). Each event was coded as 1 for mortality or 0 for unknown or alive (i.e., right-censored data), using the coxph function within the survival package in R (Therneau, 2023). We treated each time interval between sequential locations as a distinct risk interval that accounts for continuous time, but with differing intervals. We also stratified models by bird band number. Spatial covariates were extracted at the end of each time interval (e.g., end time step, Johnson et al., 2004; Therneau, 2023). We used Cox and AFT models that included at least one variable from each covariate family, then modeled all combinations of these covariates in multivariate survival models using the dredge function in the MuMIn package in R (Barton, 2018). We identified the best multivariate survival model as the model with the lowest AICc (Burnham and Anderson, 2002).
We evaluated goodness of fit of top survival models via likelihood ratio tests χ2 (Johnson et al., 2004). We also assessed top survival model predictability with Concordance statistics for which values > 0.5 indicate predictive power greater than by chance alone, and values closer to 1.0 indicate good model fit and predictive power (Therneau, 2023). Resulting positive β-coefficients from survival models were associated with increased hazard (i.e., hastened mortality), and negative β-coefficients indicated decreased hazard (i.e., delayed mortality). We reported risk ratios, or exponentiated β-coefficients from top survival models, which indicate the influence of a covariate on sage-grouse mortality (Johnson et al., 2004), where values >1 suggest increased risk. In step three, we created risk surface maps from our top survival models using the unstandardized β-coefficients (applied to a logistic equation in ArcGIS Pro) to calculate the predicted relative probability of sage-grouse mortality in each 30 x 30 m pixel, for both Canadian provinces. In each risk surface, we restricted all continuous spatial covariates to the maximum values where sage-grouse were observed, to ensure we were not predicting beyond the scope of survival models that were used to estimate β-coefficients.
2.5.3 Step-selection function
In step four, we assessed the degree to which sage-grouse demonstrate movement and selection patterns that are consistent with mortality risk maps (Figure 2). We characterized movement relative to the risk landscape using an integrated step-selection function (hereafter, iSSF; Avgar et al., 2016). Following existing iSSF methods that assess habitat selection and mortality risk, we used the amt package in R (Signer et al., 2019), to use movement location records to jointly assess habitat selection and movement direction and step length (Avgar et al., 2016). ISSFs utilize conditional logistic regression (Thurfjell et al., 2014; Panzacchi et al., 2016) to compare the habitat characteristics between two successive locations (i.e., a ‘step’; Turchin, 1998); locations are defined as used (by birds; coded as 1) and available (could be used; coded as 0). Each step taken by the bird is scored by the iSSF, with the higher score indicating a higher probability of being selected (Fortin et al., 2005). We generated 100 random available steps per observed step, with random step lengths drawn from a recommended gamma distribution (Avgar et al., 2016) and random turn angles drawn from a von Mises distribution (Duchesne et al., 2015). To meet the assumption of relatively constant time intervals (Signer et al., 2019) we resampled the data to form regular bursts using the function track_resample function in the amt package (Signer et al., 2019), which allowed us to partition the steps into groups of observations with a sample rate of one day. The choice of the one-day sampling rate was based on limitations from the GPS and VHF data collection (i.e., daily location data). Based on early assessment of Used-Habitat Calibration (UHC) plots (Fieberg et al., 2018), we only retained individual datasets that included >30 locations. We also stratified the conditional logistic regression model by the bird band number to ensure used and available locations for each bird were properly aligned (Fieberg et al., 2021).
We first used covariates in our top survival models in our iSSF analyses to characterize movement, and then fit iSSFs to the risk surface we created in step three (Figure 2) to evaluate the degree of correspondence in movement behavior and mapped mortality risk. We evaluated selection of key environmental covariates, and included step length, the logarithm of step length, and the cosine of the turning angle as covariates in the model to account for underlying movement processes (Avgar et al., 2016). We used inverse-variance weighted regression to summarize inference from individual models at the population level by calculating mean parameter estimates and 95% confidence intervals around them. Each parameter value expresses relative selection strength on the log scale (log-RSS, Avgar et al., 2017) for a one-unit increase of the corresponding covariate, where positive values express selection and negative values express avoidance. The log-RSS indicates how many times more likely a step is to end in risky habitat (along the x-axis) versus the mean risk value. We also used empirical bootstrapping to estimate 95% confidence intervals around mean parameter values. Under a presence-background study design, available points are not necessarily unused, rather, their status is unknown; for this reason, standard metrics, such as area under the curve (AUC, Brown and Davis, 2006) are also not appropriate for this situation (Fieberg et al., 2018). Thus, we used calibration plots designed for use-availability data (Boyce et al., 2002; Fieberg et al., 2018) to further evaluate model performance. Given we extracted separate spatial information pertaining to each province, we did not pool the data across Alberta and Saskatchewan, and thus provide the following results by province.
3 Results
3.1 Sage-grouse mortalities
Female sage-grouse generally had a higher number of confirmed mortalities than males, likely due to females being easier to track (e.g., had larger, more powerful transmitters than males), but typically lived longer than males (Supplementary Tables 5, 6). Time to mortality for females varied between provinces. With few exceptions, sage-grouse died within 20 days of release in Alberta and within 26 days in Saskatchewan (Figures 3A, C). Only 30% of males and ~58% of females survived past 10 days after release in Alberta; and a greater proportion of the released population survived past 10 days in Saskatchewan (50% of males, ~78% of females; Supplementary Tables 5, 6, respectively). Only two hens survived more than one year in our study sites (e.g., Alberta hens = 873, and 1,185 days – dropped transmitter). These outliers were omitted from analyses, but we found both hens primarily used less risky habitat (mean risk = 0.10, SD = 0.07, maximum risk value = 0.36, n = 152 locations; mean risk = 0.13, SD = 0.06, maximum risk value = 0.34, n = 207 locations; respectively) compared to other sage-grouse that survived at least 10 days (mean risk = 0.23; SD = 0.15; maximum risk value = 0.75; n = 1,220 locations). Most individuals had known fates (Supplementary Tables 5, 6). Unknown survival status resulted from transmitter failure or dropped devices. Location data were used in analyses until the time the signal was lost (see Multivariate Survival Model methods above).
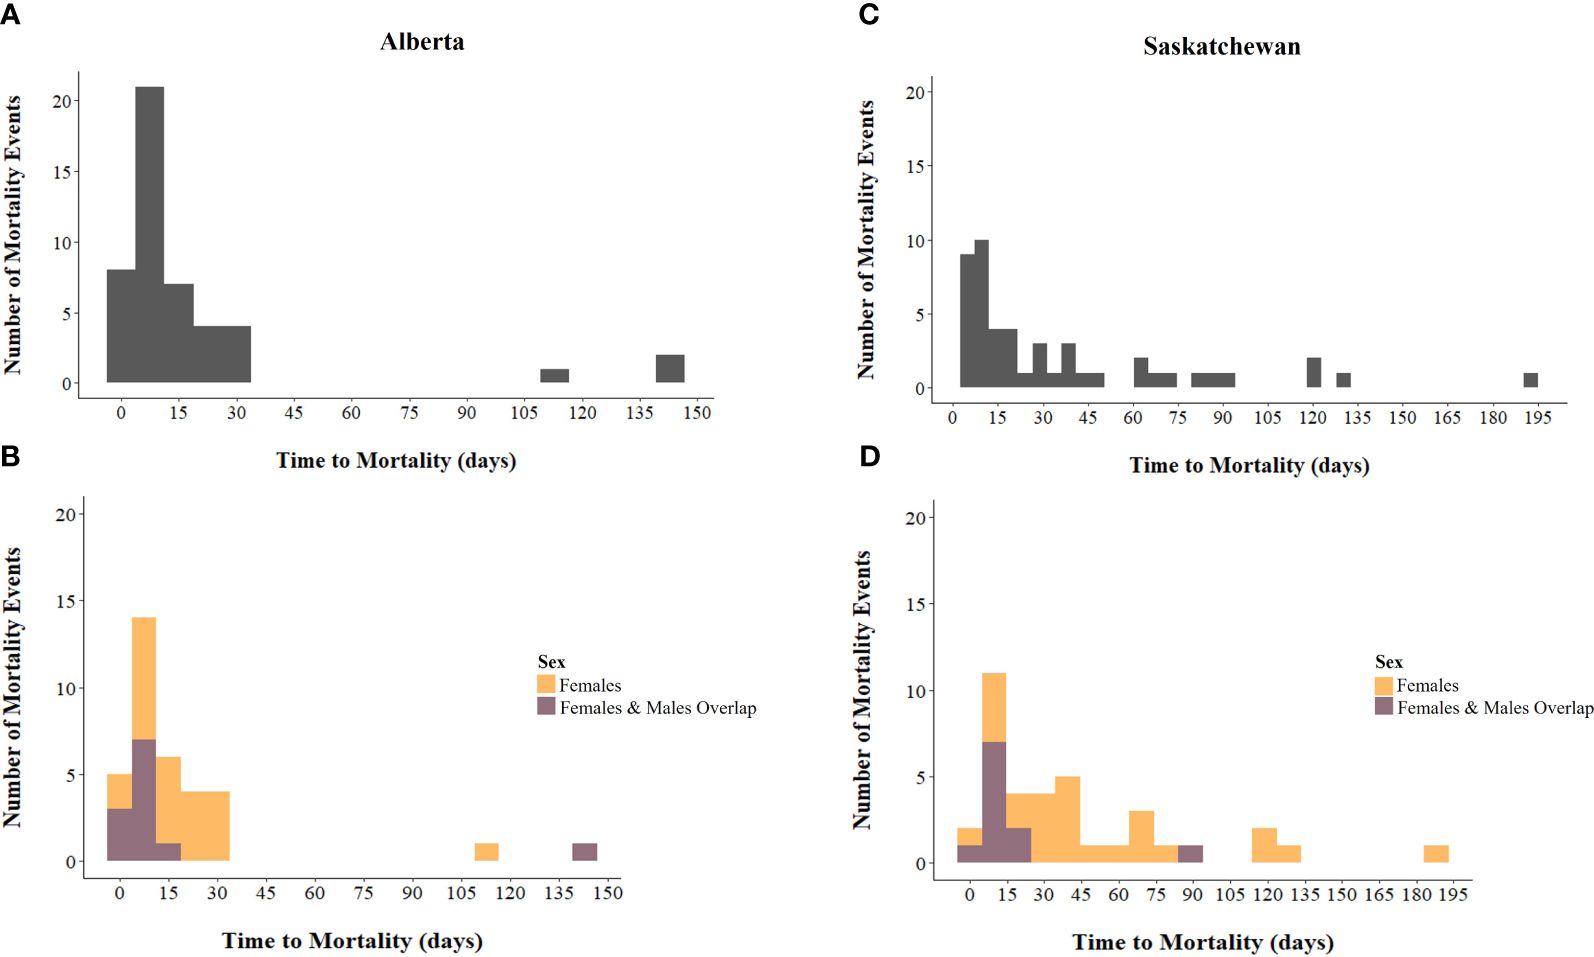
Figure 3. Number of mortality events of male (light purple) and female (orange) released, captive bred Greater sage-grouse (Centrocercus urophasianus) during spring and fall combined in: (A, B) Alberta (n = 47; male, n = 12, female, n = 35), and (C, D) Saskatchewan (n = 48; male, n = 11; female, n = 37), Canada, 2018 – 2022, by time to mortality (days). Mortality events where sexes overlap (B, D), are shown in deep purple, and time to mortality (days) is grouped into 15-day bins.
Predation accounted for most confirmed deaths in both study sites (Figures 3, 4; Supplementary Table 2). Carcasses were examined by biologists and the predators associated with mortalities were identified as mammal (e.g., canids such as coyotes, Canis latrans) and avian species (e.g., raptors such as great horned owls, Bubo virginianus) in both study sites (Figure 4). Confirmed mortalities were also caused by weather (exposure) in both provinces. There was a notable snowstorm in Alberta in November 2020, which resulted in the accumulation of ~45 cm of snow. The extreme, extended temperatures (e.g., -20°C on ~90% of nights during a 2-week period in December 2021 and January 2022) and predation contributed to sage-grouse deaths in Alberta. Mortalities were also caused by collisions with vehicles and fences in Alberta only (Figure 4; Supplementary Table 2).
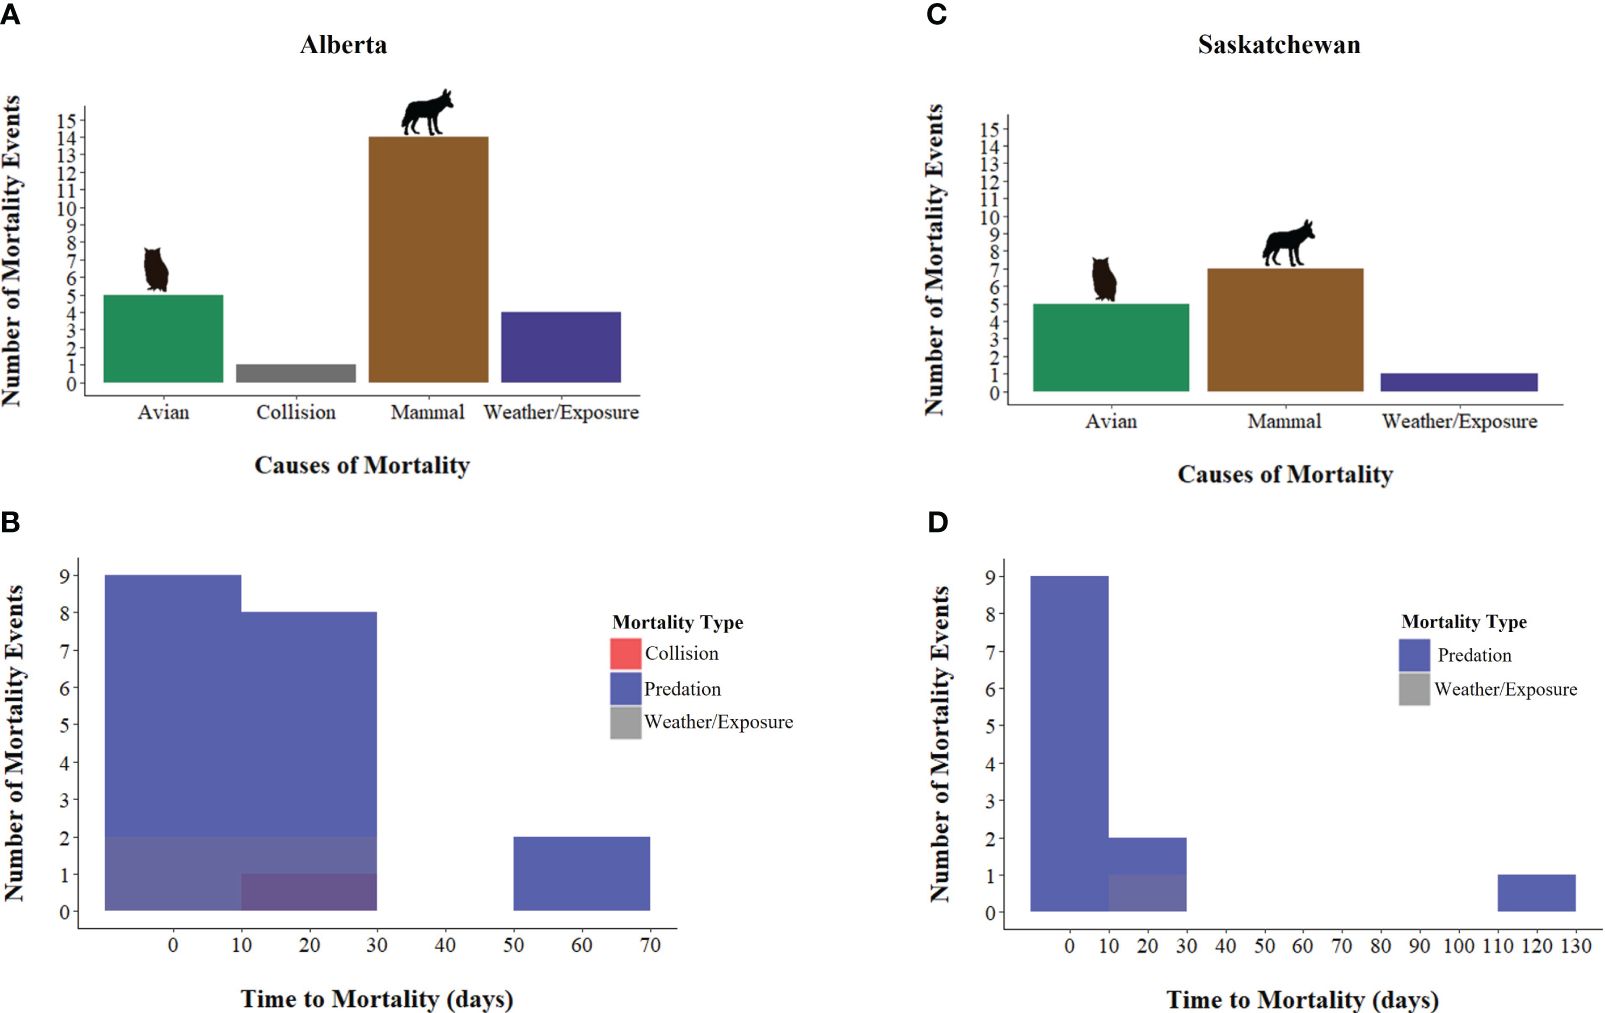
Figure 4. Known causes of mortality of released, captive bred Greater sage-grouse (Centrocercus urophasianus) in: (A) Alberta (n = 25), and (C) Saskatchewan (n = 13), Canada, 2018 – 2022, and number of mortality events through time in (grouped into 10-day bins): (B) Alberta, and (D) Saskatchewan.
3.2 Univariate mortality risk model
We fit 83 univariate Cox proportional hazards and Accelerated Failure Time models for Alberta (Supplementary Table 9), which resulted in nine covariates that moved into multivariate survival models (see Table 1 for subset of candidate models). Of those nine covariates, distance to gravel roads and streams strongly influenced mortality in Alberta (Table 1 and Supplementary Table 9). For Saskatchewan, we fit 61 univariate Cox proportional hazards and Accelerated Failure Time models (Supplementary Table 13), which resulted in 10 covariates that moved into multivariate survival models (see Table 1 for candidate models only). Of those 10 covariates, anthropogenic disturbance density within 0.56 km, proportion of meadow and other shrubs within a median daily distance travelled (2.35 km), elevation, and distance to roads and tall features strongly influenced mortality in Saskatchewan (Table 1 and Supplementary Table 13). In univariate tests, acclimation period and raising method had weak predictive ability and were not retained in multivariate survival models (Supplementary Tables 7–19; Figures 1, 2). Later release dates (e.g., after October 17), influenced mortality risk, but only in Saskatchewan (Supplementary Table 13).
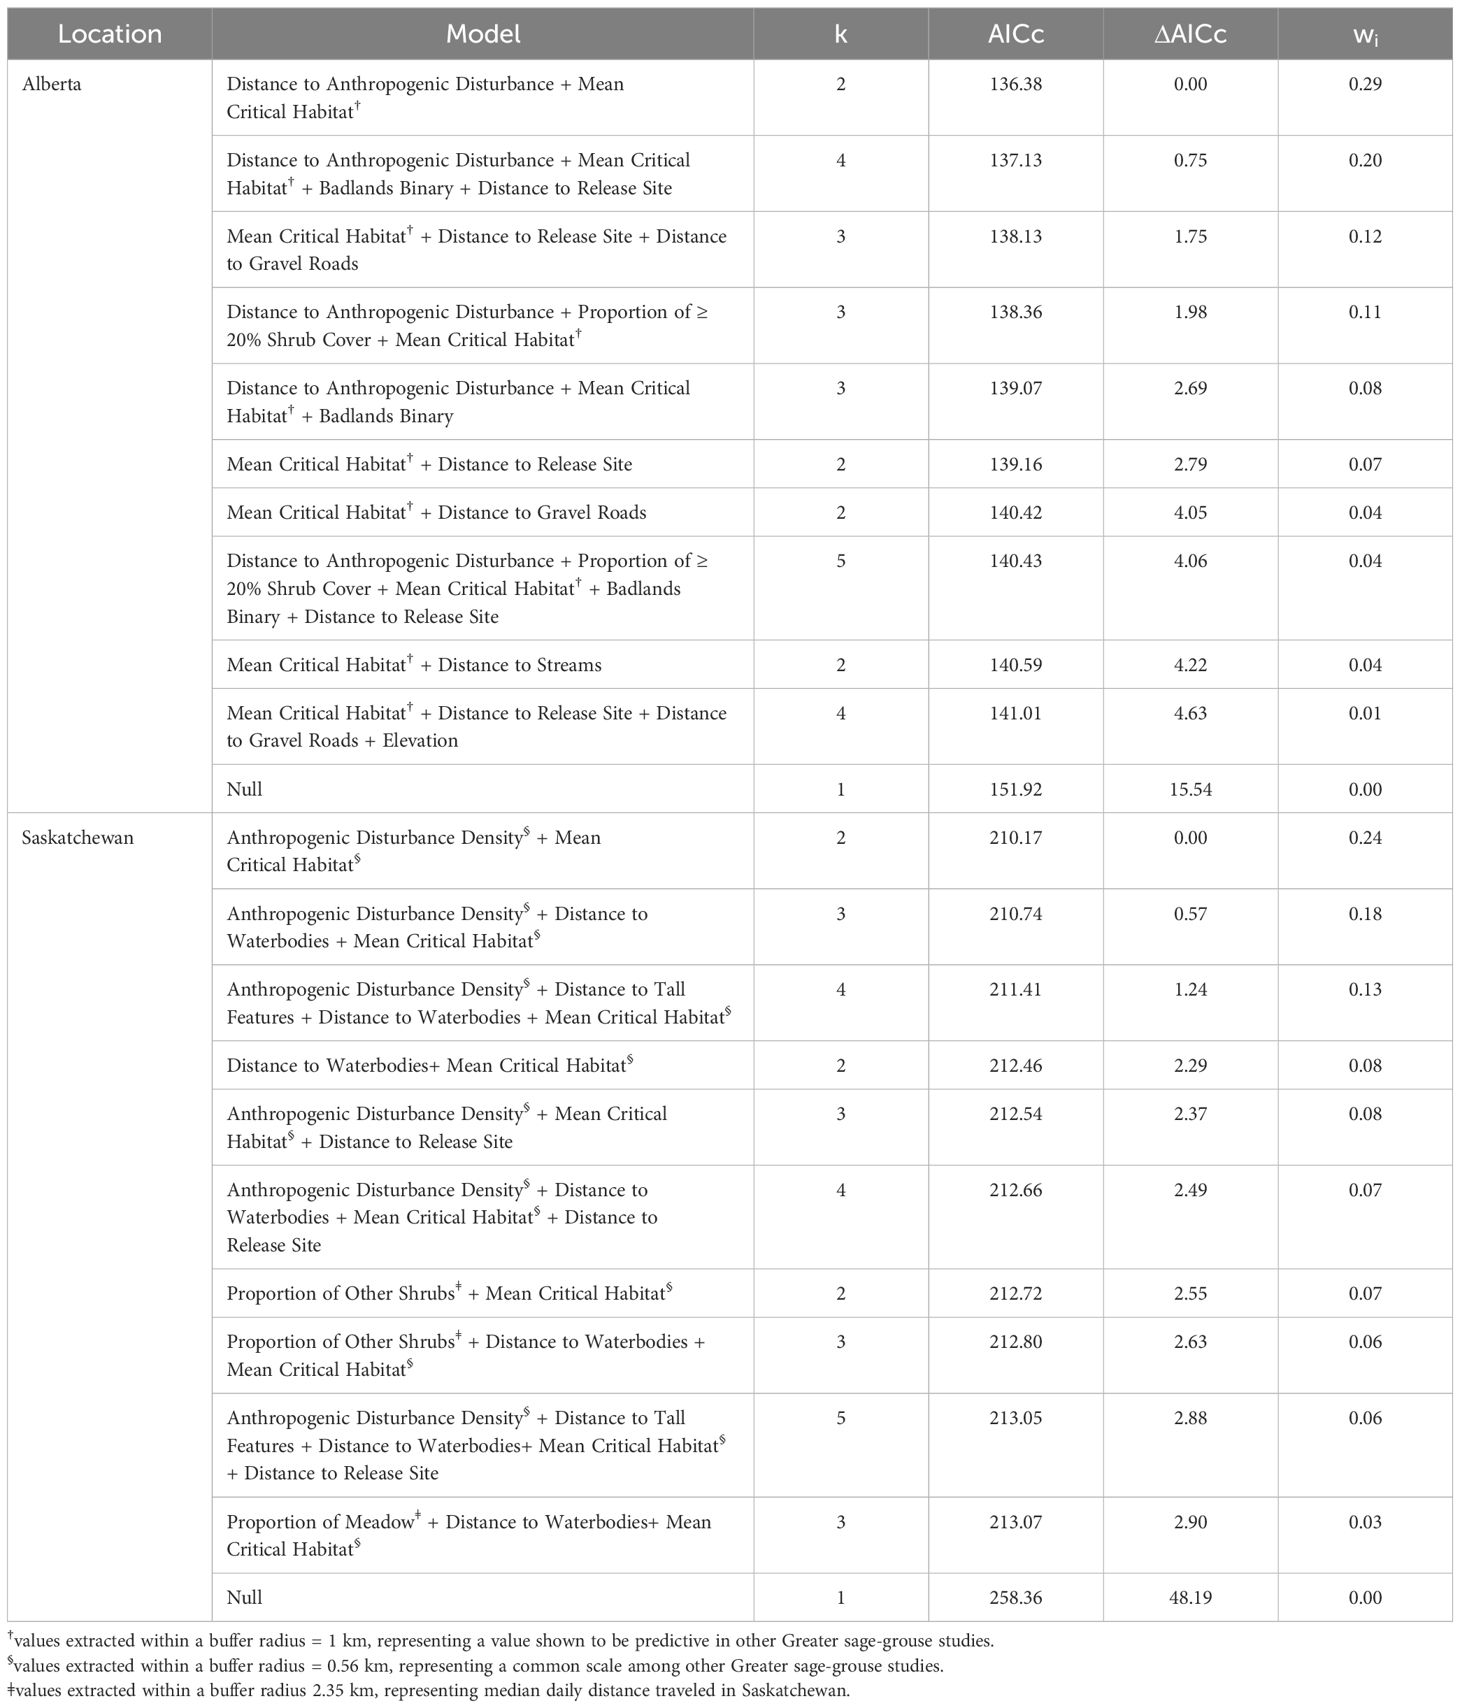
Table 1. Subset of candidate Anderson-Gill survival models of late mortality risk (e.g., died > 10 days post release), number of parameters (k), Akaike’s Information Criterion (AICc) scores, differences among AICc scores (Δ), and AICc weights (wi) for released, captive bred Greater sage-grouse (Centrocercus urophasianus) in Alberta and Saskatchewan, Canada, 2018 – 2022.
3.3 Multivariate survival model
We initially started with a list of spatial and aspatial covariates in our multivariate survival models, but spatial factors outcompeted non-spatial covariates (Supplementary Tables 7–19; Figures 1, 2). In the Alberta multivariate survival model, we included 46 sage-grouse (10 males and 36 females, n = 878 total locations) (Table 1). The top multivariate survival model included distance to anthropogenic disturbance, which strongly influenced sage-grouse mortality risk (Table 1). We found mortality risk strongly decreased by 62% per 1-km increase in distance to anthropogenic disturbance (risk ratio: 1.00 – exp(β) = 0.38, SE = 0.44, 95% CI = 0.17, 0.88, Table 2). The proportion of critical habitat (within a median daily distance travelled; 0.55 km) had a weak effect (Tables 1, 2). Mortality risk was weakly influenced by lower mean critical habitat values within 1 km and was reduced by 18% per 1-unit increase in mean critical habitat (risk ratio: 1.00 – exp(β) = 0.82, SE = 0.21, 95% CI = 0.57, 1.18, Table 2, Figure 5 and Supplementary Figure 3). The top survival model fit reasonably well (Concordance statistic = 0.64; Likelihood Ratio Test: χ2 = 7.05, df = 2, p-value = 0.03).
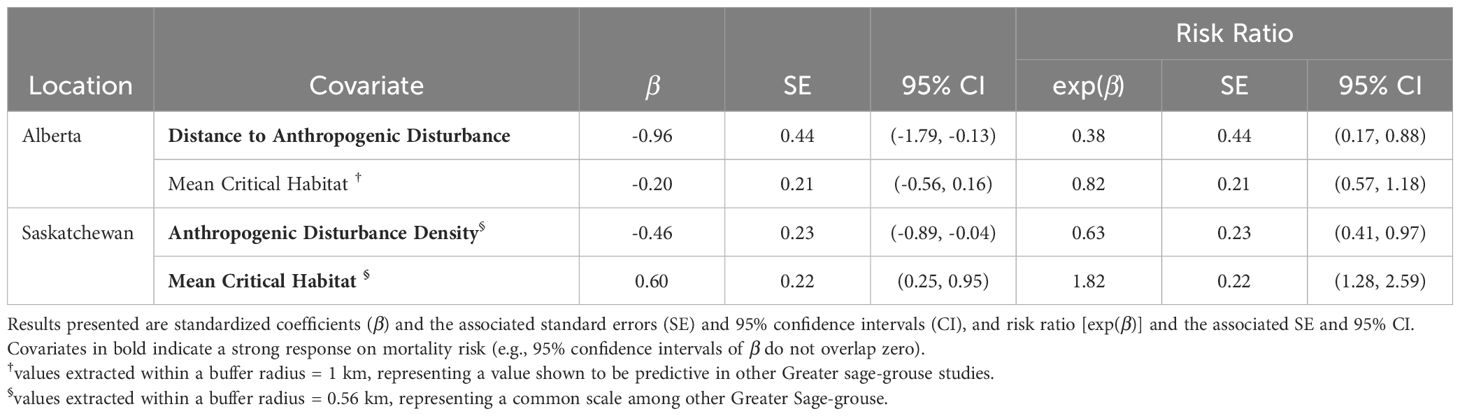
Table 2. Environmental covariates of Greater sage-grouse (Centrocercus urophasianus) mortality, after release from captivity into Alberta or Saskatchewan, Canada (2018 – 2022), estimated from top Andersen-Gill survival models using location records of birds that survived at least 10 days.
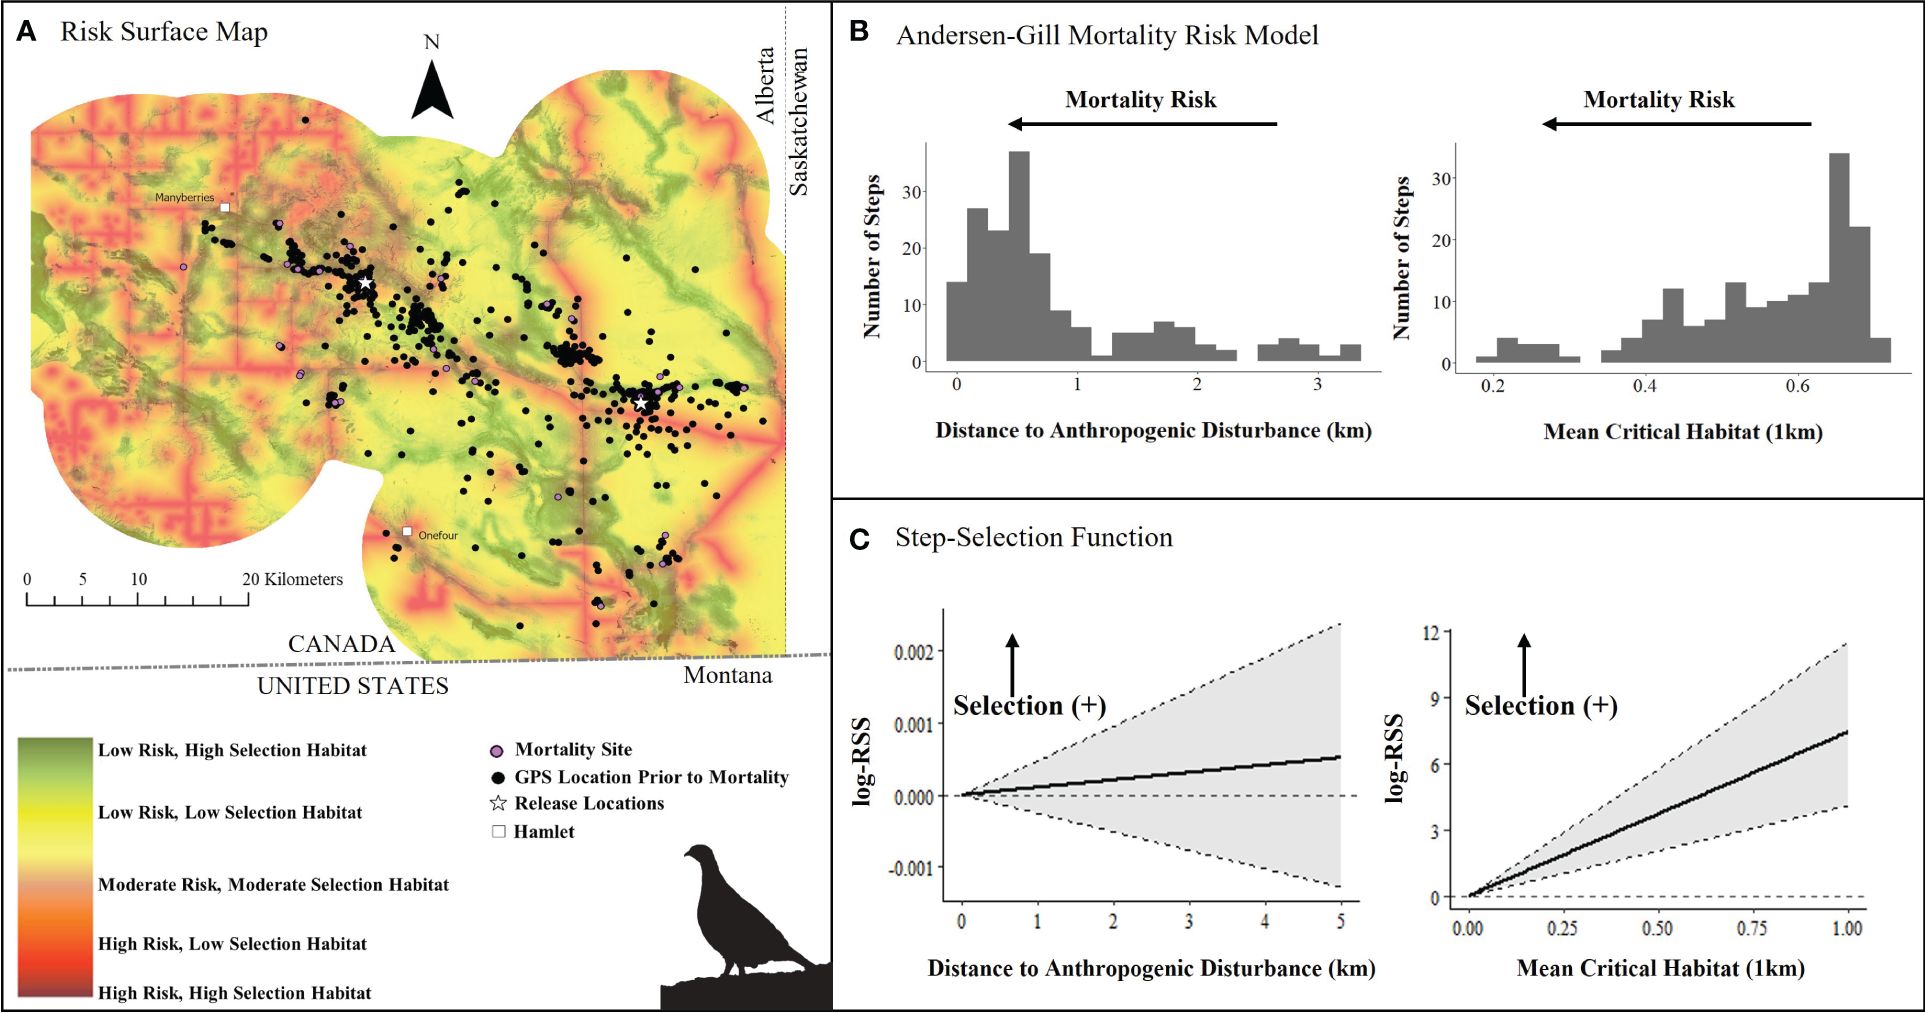
Figure 5. (A) Mortality risk surface map of captive bred Greater sage-grouse (Centrocercus urophasianus) released in southeastern Alberta during spring 2021 and 2022 and fall 2018 – 2021, layered on critical habitat probability (Environment Canada, 2014), (B) number of steps (locations) associated with each covariate in top Andersen-Gill model, and (C) quantified resource selection strength estimated by an integrated step-selection function. Silhouette of Greater sage-grouse © Cornell Lab of Ornithology.
In the Saskatchewan multivariate survival model, we included 52 sage-grouse (12 males and 40 females, n = 1,508 total locations; Table 1). Our top survival model (Tables 1, 2) indicated that mortality risk was strongly influenced by both mean critical habitat and anthropogenic disturbance density within 0.56 km. Mortality risk decreased by 37% per 1-unit increase in anthropogenic disturbance density (risk ratio: 1.00 – exp(β) = 0.63, SE = 0.23, 95% CI = 0.41, 0.97, Table 2) and increased by 82% per 1-unit increase in mean critical habitat (risk ratio: exp(β) = 1.82, SE = 0.22, 95% CI = 1.28, 2.59, Table 2). The model exhibited good model fit (Concordance statistic = 0.70; Likelihood Ratio Test: χ2 = 9.53, df = 2, p-value = 0.01). The survival model and associated risk surface mapped higher risk of mortality in areas with lower densities of anthropogenic disturbance and higher mean critical habitat densities within 0.56 km (Figure 6 and Supplementary Figure 4).
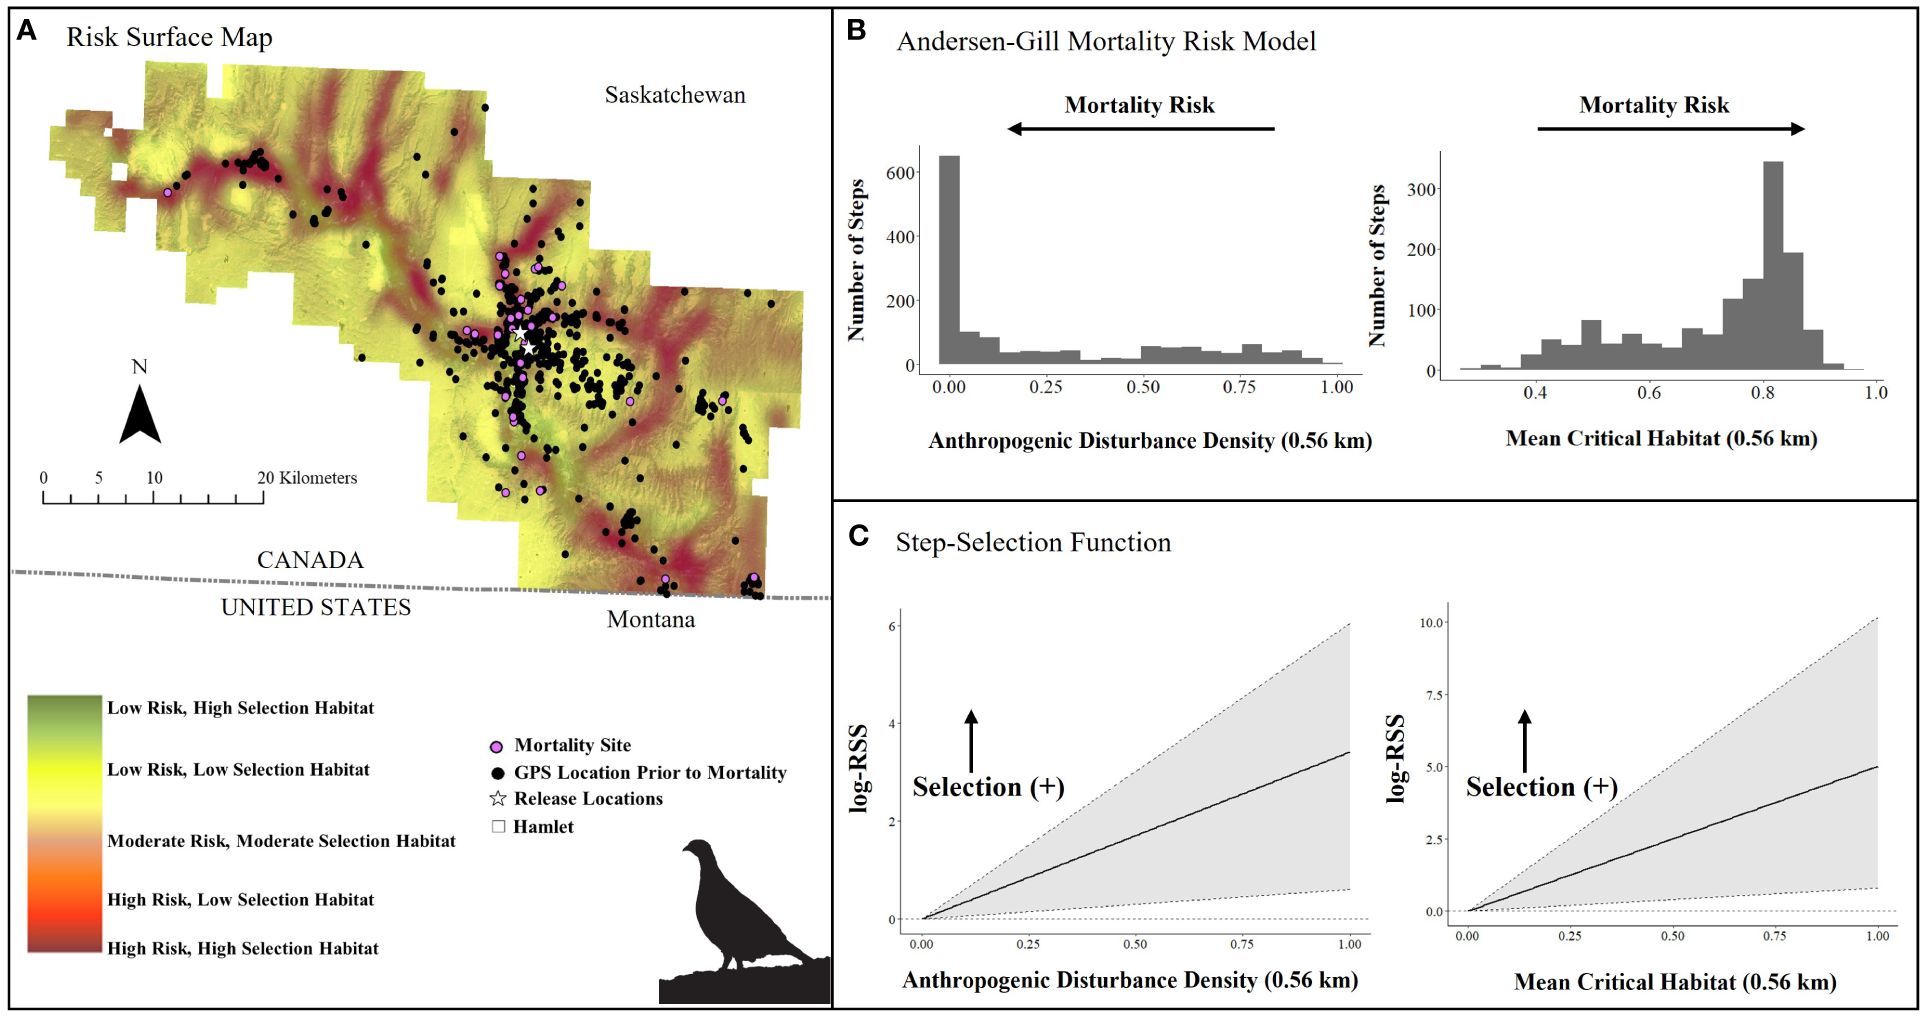
Figure 6. (A) Mortality risk surface map of captive bred Greater sage-grouse (Centrocercus urophasianus) released in southwestern Saskatchewan during spring 2021 and 2022 and fall 2018 – 2021, layered on critical habitat probability (Environment Canada, 2014), (B) number of steps (locations) associated with each covariate in top Andersen-Gill model, and (C) quantified resource selection strength estimated by an integrated step-selection function. Silhouette of Greater sage-grouse © Cornell Lab of Ornithology.
3.4 Step-selection functions
We examined iSSF calibration plots and determined we could fit iSSFs to seven individuals (n = 900 locations) in Alberta and 20 individuals (n = 406 locations) in Saskatchewan. In both provinces, nearly all birds maintained a relatively straight path or made only slight changes in direction when step lengths represented daily steps (negative turn angle; Alberta: β = −0.49 ± 0.31; Saskatchewan: β = −0.53 ± 0.19). In the Alberta iSSF, the selection coefficient for distance to anthropogenic disturbance remained around zero, denoting that at a mean step length (3.23 km), anthropogenic disturbance was neither selected nor avoided by sage-grouse in general (Figure 5C). In Alberta, numerous birds selected areas with higher proportions of habitat (mean critical habitat within 1 km; β = 3.93 ± 2.69; Figure 5C). We also found evidence that sage-grouse made movement decisions that minimize exposure to risky areas compared to what is available to them (β = −8.34 ± 4.08, Figure 7A). By contrast, in Saskatchewan, a step was more likely to end in greater anthropogenic disturbance density (β = 1.54 ± 0.81) and in greater mean critical habitat both within 0.56 km (β = 2.41 ± 2.49), compared to average values (mean step length = 1.18 km) (Figure 6C). Additionally, the population in Saskatchewan appears to be more likely to select for risky habitat compared to what is available (β = 1.08 ± 1.14, Figure 7B).
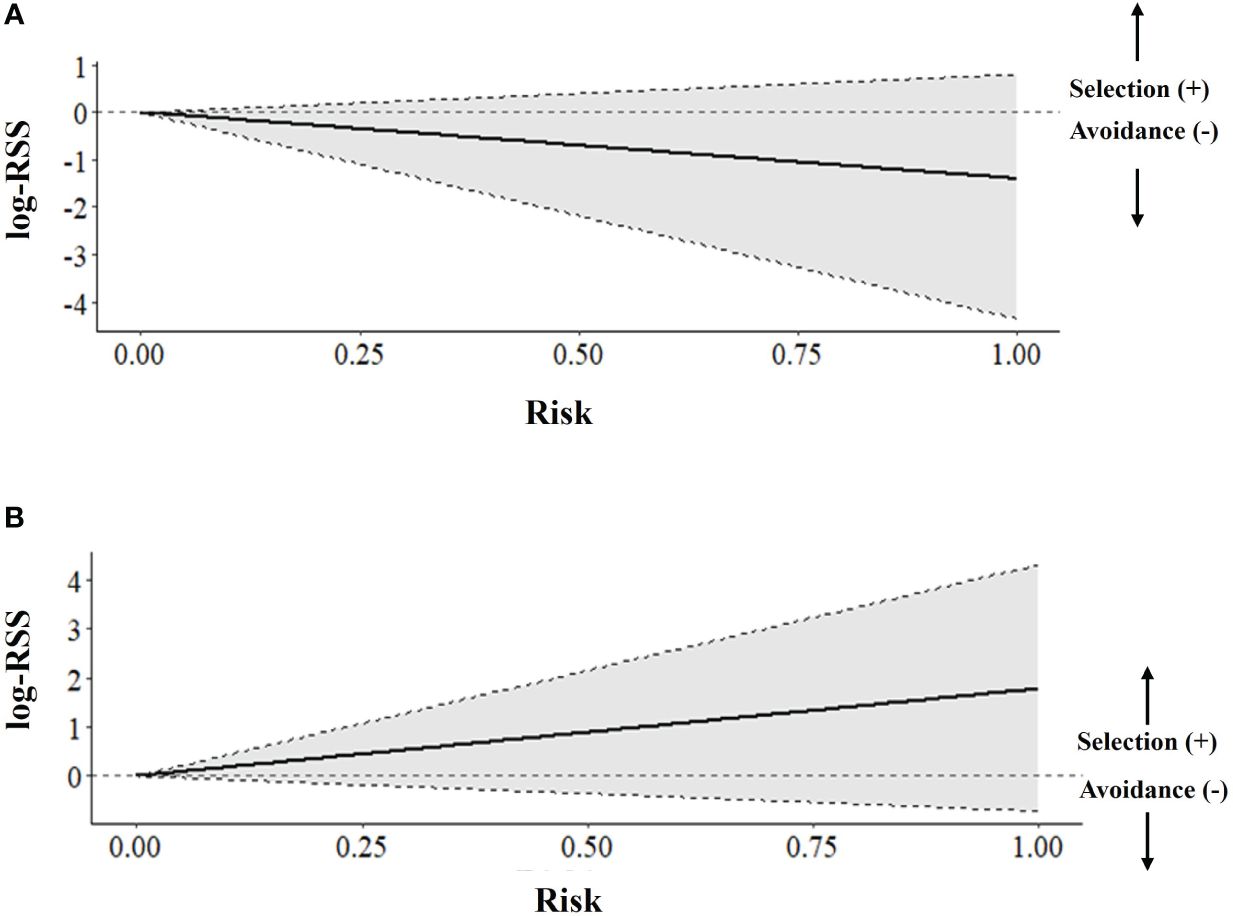
Figure 7. Selection and avoidance of areas at higher risk of mortality for Greater sage-grouse (Centrocercus urophasianus) that were captively bred and released in (A) Alberta and (B) Saskatchewan, Canada (2018 -2022), as assessed by an integrated step-selection function analysis. Plots depict population-level estimates of log-relative selection strength (log-RSS) obtained via inverse-variance-weighted regression on individual models, using the risk surface layer.
3.5 Mortality around release sites
Release sites and surrounding areas differed in terms of their proximate mortality risks (Figure 8). The release sites (30-m pixels) were generally located in sage-grouse habitat with higher pixel scores in the critical habitat layer and were in locations associated with lower mortality risk (i.e., northwest release site in Alberta, Figure 8A; both release sites in Saskatchewan, Figure 8C). The southeast release site in Alberta was in a location with lower-scored habitat, with lower mortality risk (Figure 8B). However, the areas surrounding release sites included areas of high mortality risk, with patterns and risk levels that differed among sites. For example, the two Alberta release sites had very different mapped risks (Figures 8A, B), suggesting that post-release survival could be different between these places. Although we did not have the sample size to compare survival between these two locations, future studies may amass enough data to do so.
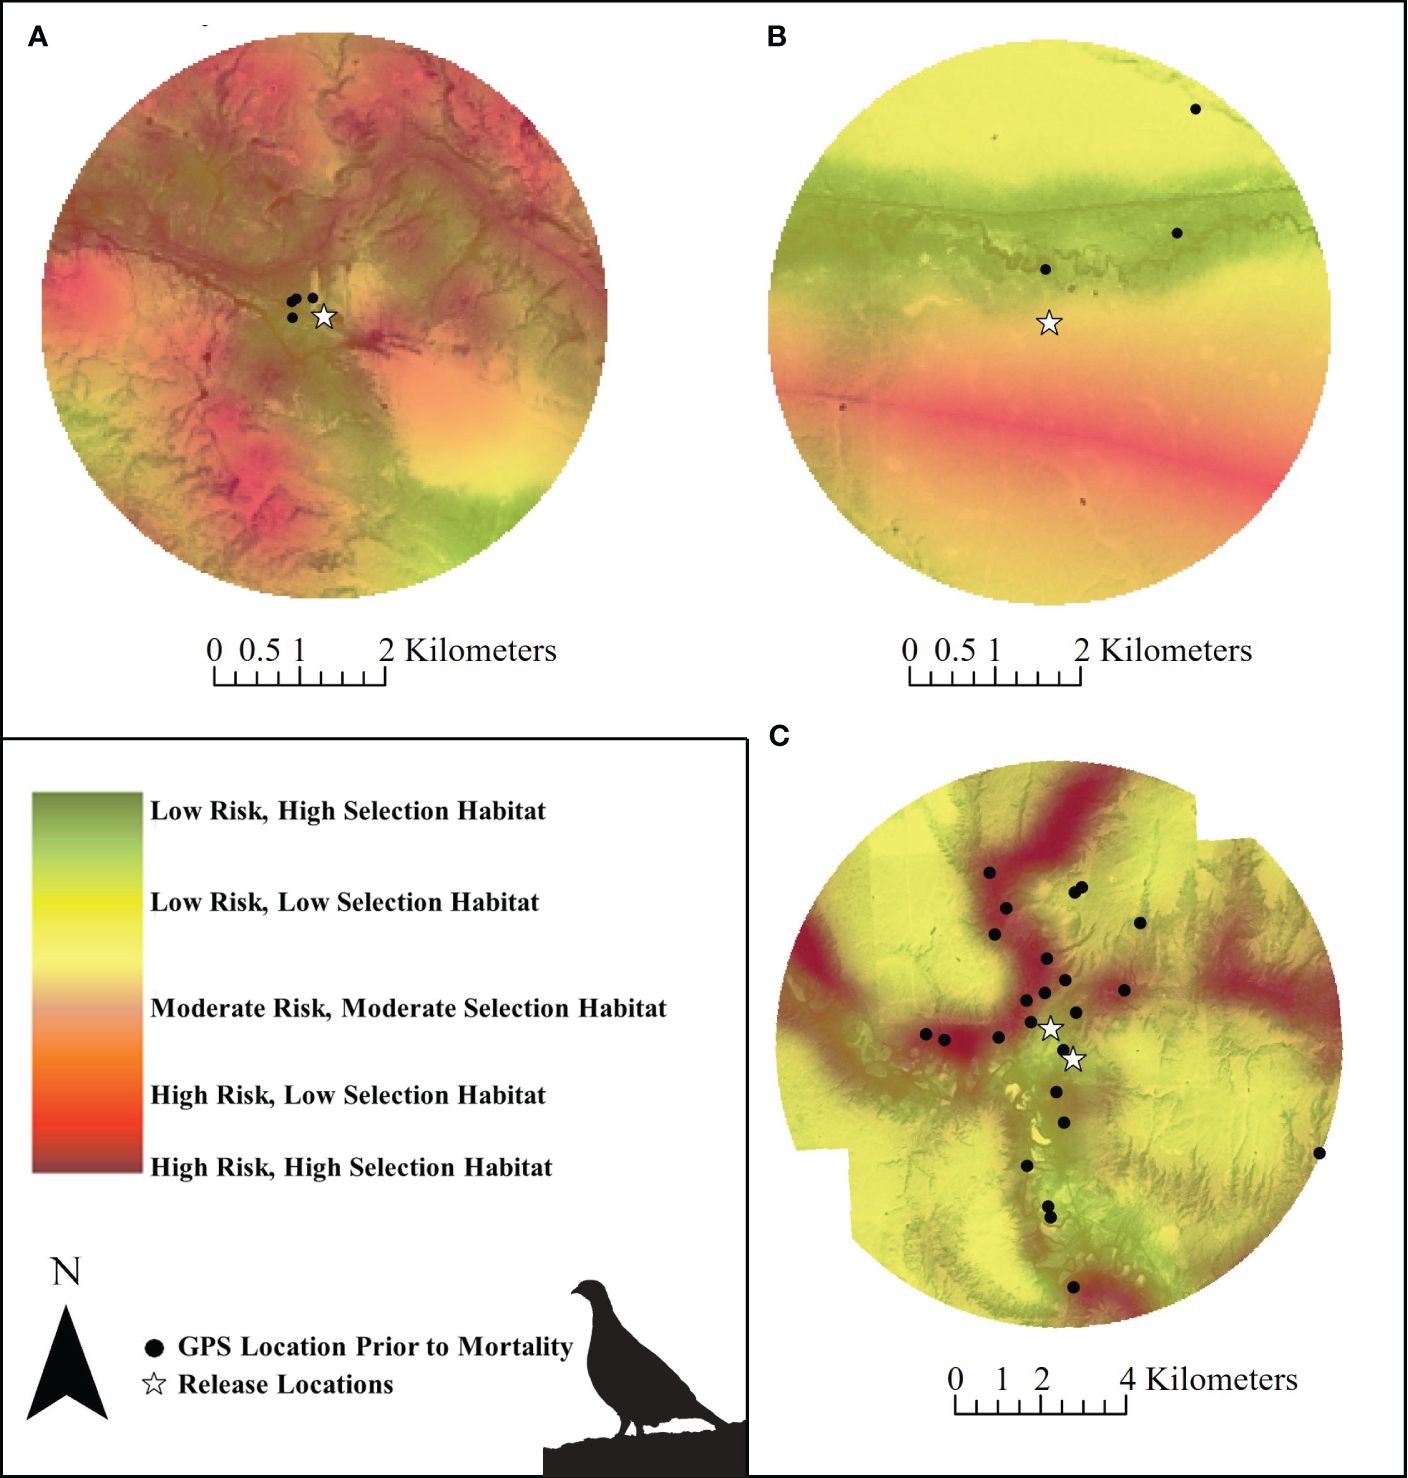
Figure 8. Mortality risk associated with different levels (e.g., low, high) of habitat selection near Greater sage-grouse release sites in Alberta and Saskatchewan, Canada (2018 – 2022). Mortality risk was influenced by anthropogenic features as well as habitat (continuous critical habitat; Environment Canada, 2014) and displayed on the critical habitat map to highlight areas where habitat selection and mortality risk (mis)align at release sites in Alberta (A) northwest, (B) southeast, and (C) Saskatchewan release sites. Silhouette of Greater sage-grouse © Cornell Lab of Ornithology.
4 Discussion
4.1 Mortality risk
We assessed how environmental factors can influence the mortality risk of captive-bred sage-grouse that were released into the wild. Mortality risk of birds that survived longer than 10 days was influenced by anthropogenic disturbance and habitat factors in both Alberta and Saskatchewan, although responses were somewhat nuanced and different between these places. In Alberta, anthropogenic disturbance was the most influential factor influencing mortality risk. Increased exposure to areas proximate to anthropogenic disturbance substantively hastened sage-grouse mortality (Table 2), as demonstrated by elevated risk ratios. As predators often use anthropogenic infrastructure for perching, hunting, or movement (Connelly et al., 2000; Hagen et al., 2011; Baxter et al., 2013), higher mortality in these areas was expected and observed in other studies (Lammers and Collopy, 2007; Prather and Messmer, 2010; Slater and Smith, 2010; Dinkins et al., 2014; Howe et al., 2014; Dinkins et al., 2016). Anthropogenic disturbance can mask approaching predators (e.g., noise from disturbance, Hovick et al., 2014), and can also cause avoidance of areas by sage-grouse, which has been previously documented in southeastern Alberta (e.g., Aldridge and Boyce, 2007). For example, translocated sage-grouse are known to select habitats further from anthropogenic disturbance, up to 10 and 15 km from buildings and settlements, respectively, and up to 2.5 km from roads (Balderson, 2017). Wild sage-grouse in Alberta also avoided oil and gas infrastructure up to 1.9 km from energy development during winter (Carpenter et al., 2010), but did not consistently select habitats that increase survival (Aldridge and Boyce, 2007; Heinrichs et al., 2018). In Alberta, the mortality of wild sage-grouse chicks increased in areas with a higher visible well density within 1 km (Aldridge and Boyce, 2007). We observed a similar mortality response for adult birds released from captivity at the 1-km scale but did not have the sample size to include individual anthropogenic features in the multivariate model. We combined anthropogenic features (i.e., paved and gravel roads, residences, industrial developments, and active wells; Supplementary Table 2); hence, our results did not identify the specific built features that most impact sage-grouse survival. However, univariate models indicated distance to gravel roads were more influential than other anthropogenic features (Supplementary Table 9). Future analyses could assess and compare singular anthropogenic features (e.g., only roads) to help managers understand which features have the greatest influence on mortality.
In Saskatchewan, anthropogenic features and habitat were key variables but their relationships to mortality differed from those in Alberta. Contrary to expectation, sage-grouse that used areas with lower densities of anthropogenic disturbance (within 0.56 km) and higher-scored habitat (proportion of mean critical habitat in 0.56 km moving window) were associated with hastened times to mortality (Table 2). This result may be a consequence of the unique environmental context in Saskatchewan. Areas occupied by released, captive-bred sage-grouse tended to be located in the valley bottoms where there is a low density of development, a high proportion of high-selection habitat, and near water resources and higher densities of shrub cover. Predators may be attracted to these productive areas and predation may be high despite the lower availability of anthropogenic features. Thus, mortality may be high in low disturbance areas with high selection habitats because of predators making similar resource choices.
Although environmental risk factors were comparable among release provinces, the differences in mortality risk for sage-grouse underscores that mortality risk can be context dependent. The risk factors were different in each region of release, and these risks were heterogeneously distributed across the landscape, resulting in local and regional maps that could be used as decision criteria in subsequent plans for selecting release sites and regions. Although habitat should be expected to contribute to sage-grouse survival (as observed in Alberta), habitat and associated maps can be an insufficient indicator of mortality risk or of the quality of a release site and its local environment. Habitat maps can provide an initial guess of where to release captively-bred animals; however, these guesses may be misleading when other environmental factors that influence survival are not included and mapped in habitat analyses. We included environmental variables that represent opportunities for predation, including anthropogenic and tall features, topography, and restricted cover, but lacked spatial information that described predator abundance and distribution. When available, this information could be used to augment spatial risk analyses and help further identify the potential causes of mismatches in habitat and survival conditions (e.g., O’Neil et al., 2020).
4.2 Risk responses and movement
We found mixed evidence that released sage-grouse respond to environmental conditions in a way that minimizes mortality risk. The step-selection function results for sage-grouse released in Alberta suggest they generally moved and selected locations that were in less risky habitat compared to what is available to them (Figure 7A). They selected for higher-scored habitats (greater mean critical habitat; Figure 5C), further away from anthropogenic disturbance (although not significant; Figure 5C) and these choices resulted in a slower or decelerated time to mortality (Table 2; Figure 5). Avoidance of anthropogenic features is consistent with how wild sage-grouse select habitats within various critical life history stages (e.g., nesting, brood-rearing, Aldridge and Boyce, 2007) and seasons (e.g., breeding, summer, winter, Gelling, 2022). However, sage-grouse do not always optimize fitness with habitat selection (e.g., maladaptive selection; Aldridge and Boyce, 2007; Cutting et al., 2019; Lazenby et al., 2020; Pratt and Beck, 2021). Wild birds can select familiar places (e.g., nesting sites) that have lower nest or chick survival (Aldridge and Boyce, 2007), resulting in population sources and sinks (Heinrichs et al., 2018). Accordingly, the movement selection results for Saskatchewan indicated that released grouse selected risky areas. Their preferences for resource-rich sites may have outweighed their perceived risk of predation. This inconsistency in released birds’ movement and selection behaviors among release areas emphasizes the value of building models for unique environmental contexts. When sufficient data becomes available to assess mortality risks in specific areas, we recommend updating model extrapolations from other areas with site-specific models.
We lacked sufficient data to fully assess mortality risk using step selection functions. However, we found this multistep approach to be a useful coupling of methods to assess congruence of survival with movement selection and avoidance; ultimately, resulting in evidence that released individuals are making at least some choices that optimize their fitness, and some that are not. We used daily sage-grouse locations, but with increased temporal resolution of the data, this analysis could be expanded to assess finer-scale movement behavior that may further illuminate risks and movement responses associated with specific environmental features.
4.3 Predation and environmental factors
Coyotes and raptors, such as the great horned owls, are the apex predators of this ecosystem (Ritchie and Johnson, 2009) and use anthropogenic infrastructure to move and hunt. We lacked data on predator abundance and distribution and were unable to directly assess risk factors associated with predation; however, as most sage-grouse deaths were caused by predation, we infer mortality risk is primarily driven by predation and factors that facilitate predation. High mortalities in the presence and absence of anthropogenic infrastructure (in Alberta and Saskatchewan, respectively) indicate there is more to learn about the causes of mortalities in each place, including predator communities and the environments that facilitate predation. This risk assessment could be augmented with maps that describe predation pressure and predator abundance and distribution results from long-term systematic surveys. Mortality risk maps (e.g., Figures 5A, 6A; Supplementary Figures 3, 4) could be used to support the design of predator surveys and utilization maps to spatially target areas in which to deter predator use (e.g., through removal of attractants; Parks Canada Agency, 2021). This may be particularly useful for canid predators, such as coyotes, that are opportunistic feeders and able to exploit a variety of environments and resources (Bartel and Knowlton, 2005).
Further analyses of predator data can be strengthened with molecular analyses to improve predator determination (Peelle et al., 2019); however, preliminary analyses suggest that canids, corvids (e.g., American crows, Corvus brachyrynchos; common raven, Corvus corax) and owls (e.g., great horned owl) (Quinlan, 2013) are key consumers of released sage-grouse. The expansion of corvid surveys in Alberta to include a broader range of predators would help researchers and managers better understand sage-grouse mortality risk. Future analyses could also consider how the landscape facilitates and protects sage-grouse from weather exposure during extreme weather situations, as well as incorporate additional risk factors as data become available (e.g., smaller built features such as power poles, transmission lines, fences).
4.4 Non-spatial risk factors
Beyond environmental associations of mortality risk, we also examined the factors associated with release including age and weight at release, acclimation period, raising method, release period (e.g., release before October 17, or release after October 17), and release type (e.g., hard, soft, and modified-soft release). Our results suggest the spatial-environmental factors that we measured were generally more influential than factors related to the release protocol in affecting overall mortality risk. However, we did find that some of these protocol-related factors were explanatory, depending on how the data were analyzed, for which we sought alternative ways to analyze the data (see Supplementary Material for alternative models). For example, if we looked at mortality outcomes by season, the model fit was not as strong, but we occasionally found a signal of age and weight at release (only in Saskatchewan during the fall; Supplementary Figure 2B).
Although the influence of animal traits and release protocol factors were minor relative to the release environment, there could be other unquantified conditions that influence mortality including animal health (e.g., stress), predator avoidance conditioning, and diet adaptation. For example, some birds can die earlier due to health or disease-related issues and (or) because of lack of environmental conditioning (e.g., diet is the ultimate cause, and predation is the proximate cause). Captive breeding and translocation programs can impose stress on animals during captivity, handling, transportation, and release experiences (Dickens et al., 2010). Stress can influence behavior (e.g., risk taking; May et al., 2016) including movement and habitat selection (Osborne and Seddon, 2012), and reduce survival of reintroduced individuals (Bremner-Harrison et al., 2004). Stress and disorientation induced by the release can lead individuals to select less suitable areas outside of strategically chosen release sites with suitable habitat. Individuals may have further difficulties in transitioning between supplementary feed and natural diets due to their reliance on supplementary feeding (Draycott et al., 1998). Survival times are generally longer for wild-to-wild sage-grouse translocations in Alberta, with average hen survival (n = 77 with known fates) of close to a year (296 days, and some survived >1 year; unpublished data), suggesting that there are likely to be some unquantified factors beyond environmental features that are important to the survival of released sage-grouse. As these factors are quantified, they can be used to enrich this analysis.
4.5 Conservation implications
The results of this analysis can support adaptive planning and management of the release program and environment. The success of captive breeding and translocation programs depends not only on the quantity and quality of animals released, but also on identifying and managing the factors that contribute to their survival in the wild (Berger-Tal et al., 2020). Some of the elements associated with post-release mortality can be managed, reduced, or mitigated. Beyond optimizing captive and release protocols, the environment into which the animals are released should also be managed to reduce mortality risk (IUCN/SSC, 2013). For example, mortality risks for Galliformes can be partially mitigated by selecting release locations and surrounding areas that minimize opportunities for predation or predation pressure (Warren and Baines, 2018), and maximize food and cover resources. Future release sites and surrounding areas in Alberta and Saskatchewan can be screened using the risk map or associated spatial data layers to further optimize site selection. Sage-grouse release areas differed in their habitat characteristics and mortality risks. Thus, future release sites could be chosen to balance the risk profile of existing sites by releasing animals into areas with lower overall risk and a different balance of risk factors. This cycle of adaptive management can benefit from strong collaborations among translocation professionals and data scientists that can make use of small datasets, as well as species and land managers and stewards that can put results into action.
Actions are being taken by a range of government, conservation, and industry groups to reduce anthropogenic infrastructure in Canada and benefit sage-grouse. Results suggest the removal of oil and gas infrastructure, and predator perches including trees, buildings, and other vertical features (Whiklo and Nicholson, 2015) will change the spatial distribution of mortality risk, and these actions have the potential to reduce mortality risk for released sage-grouse. However, it is unclear whether infrastructure removal by itself would be sufficient to sustain released sage-grouse. As wild populations have been declining for decades in Canada, it is likely that several factors are contributing to high mortality rates, and several kinds of population recovery and habitat restoration actions are needed to stabilize the population trajectory. Although some threats sage-grouse face cannot be directly managed (e.g., climate patterns, severe weather events), a number of threats can be mitigated indirectly through habitat improvement such as encouraging natural hydrology in mesic areas (e.g., constructing ditch or dam) to augment sage-grouse forage (Alberta Environment and Sustainable Resource Devlopment, 2013; Environment Canada, 2014). Models that link spatial mortality risk to landscape projections could be used to scope the population gains associated with complementary actions that benefit both wild and released sage-grouse (Heinrichs et al., 2018, Heinrichs et al., 2019).
4.6 Doing more with less data
We used a multiphase approach to assess the environmental factors influencing mortality risk, whether existing habitat maps are likely to predict where released animals are likely to survive, and the degree to which animals’ movements corresponded to risk correlates. We implemented a workflow that addresses the challenge of having few surviving animals and small location datasets, a situation common in captive breeding and release programs. We suggest this linkage of analyses is helpful for several reasons. First, it yielded a simple yet actionable risk map that complements existing information on habitat, populations, and landscape features. Viewing habitat and mortality risk in the same map highlighted locations where the conditions are appropriate for both habitat selection and mortality, and locations where landscape improvement actions may yield high returns on ecological investments. Second, this workflow was also useful in evaluating the assumption that ‘good’ habitat in habitat selection maps represent optimal places in which to release translocated animals. We found several locations where highly selected habitat is associated with a high risk of mortality. Mortality risk maps can complement existing habitat maps by including additional factors that were excluded from the habitat map that may not have a strong signal of selection but influence survival. Our mortality model included anthropogenic and other features that facilitate predation that were not included in the habitat model. Mortality models could additionally include predator locations, densities, preferences, or locations that lack resources to enable animals to withstand extreme weather. Lastly, this workflow evaluated movement behavior relative to the risk landscape and provided a means to assess whether animals are responding to risk features. Movement and selection responses were different between release areas (Alberta and Saskatchewan), indicating that release success, and the prescriptions to enhance post-release survival, may differ among locations. Actions that address high mortality in high selection areas may be more influential than those in low selection areas (e.g., Heinrichs et al., 2018).
Although we found a path to mapping post-release mortality risk that led to key management insights, this approach had limitations. For instance, we used a small dataset where seasons, sexes, and ages were combined, and environmental covariates were combined in composite layers. Consequently, we may have missed relationships that could be found in larger datasets, including those related to release protocols and interacting environmental conditions. A larger dataset would have streamlined the workflow by allowing us to jointly evaluate several environmental covariates in a single model, as well as investigate differences among individuals (e.g., traits, status), differences in release protocol, and differences among behavioral and movement states (e.g., encamped, exploring, travelling, relocating; Harju et al., 2013; Picardi et al., 2021). Despite these limitations, we found empirical patterns that can be used to support near-term conservation actions while additional data are collected and used to develop the next generation of risk models. We used concepts and tools that most wildlife researchers are familiar with, using free and accessible software packages. As such, we suggest this workflow may be useful for other wildlife researchers facing similar constraints and may be particularly useful in cases where mismatches in habitat selection and survival are likely to occur.
5 Conclusion
As the biodiversity crisis intensifies (Butchart et al., 2010), conservation practitioners will increasingly need to make high-stakes decisions with analyses that make adaptive use of available information (Berger-Tal et al., 2020). Captive breeding and release programs exemplify this situation. Translocation planners need to make decisions on where to release animals and how to modify the release environment at the onset of the program with information that is on-hand. Data from extant wild populations and associated habitat maps can provide insight into the environmental factors that are generally associated with a species’ needs or preferences; however, they can paint an incomplete picture of the movements, behaviors, and survival of captively-bred and released animals. This Galliform case study highlights the potential for habitat to be a partially misleading indicator of optimal release sites and post-release survival. This underscores the value of assessing the mortality risks associated with the release environment. As many factors shape survival in the post-release landscape, it can be challenging to identify the factors that are most important to understand and manage. Spatial risk analyses can help direct attention to key environmental factors that may be limiting translocation success, structure adaptive changes to both release protocols and the release environment, and support conservation teams to overcome disruptions in the adaptive management cycle.
Data availability statement
Data cannot be openly shared due to sensitive location information. However, further inquiries regarding data accessibility can be directed to the Wilder Institute/Calgary Zoo. Requests to access these datasets should be directed to TWlsbGllQ0BjYWxnYXJ5em9vLmNvbQ==.
Ethics statement
The animal study was approved by Animal Welfare, Ethics and Research Committee (AWERC). The study was conducted in accordance with the local legislation and institutional requirements.
Author contributions
SN: Writing – review & editing, Writing – original draft, Visualization, Validation, Methodology, Investigation, Formal analysis, Conceptualization. JS: Writing – review & editing, Visualization, Software, Investigation. JH: Writing – review & editing, Visualization, Validation, Methodology, Investigation, Formal analysis. DM: Writing – review & editing, Supervision, Project administration, Methodology, Data curation, Conceptualization. AC: Writing – review & editing, Supervision, Project administration, Methodology, Data curation, Conceptualization. IG: Writing – review & editing, Supervision, Project administration, Methodology, Data curation. TW: Writing – review & editing, Methodology, Conceptualization. AM: Writing – review & editing, Supervision, Project administration, Funding acquisition, Data curation, Conceptualization. JAH: Writing – review & editing, Writing – original draft, Supervision, Methodology, Investigation, Conceptualization.
Funding
The author(s) declare financial support was received for the research, authorship, and/or publication of this article. Funding for the captive breeding and release program and this modeling project was provided by Alberta Environment and Protected Areas, Environment and Climate Change Canada, and the Wilder Institute/Calgary Zoo.
Acknowledgments
We thank collaborators who provided geospatial data for this analysis, including Parks Canada and Grasslands National Park. This paper was improved with comments and feedback provided by Stefano Liccioli (Alberta Environment and Protected Areas), and Rebecca Smith (Government of Saskatchewan). Animal Care, Health and Welfare staff (Colleen Baird, Mike Teller, Michelle Benzen, Mark Imfeld, Kristina Stephens, Matthew Pelehos, Emily Walton, Jessica Craig, Caitlin Slade, Kristina King, Martyna Chomiuk, James Neuman, Glenda Misurelli, Vince Capuano, Natasha Zinke, Katie Widmeyer and Tamara Snukuts) cared for grouse prior to release. Veterinarians (Sandie Black, Doug Whiteside, Adriana Pastor, Emma Vaasjo, Annie Li, and Shannon Toy) provided veterinary care to the flock. Data were collected in the field by Janine Jaffrey, Emma Struivig DeGroot, Llewellyn Haines, Lacey Hebert, Marcus Sommers, Johnathan Rich, Amanda Zee, Austin Zeller, Birch Gano, Amber Kapchinske, Colin McKay, Jordan Cormack, Fiona Le Taro, Alison MacPherson and Jordin Parder. Help with logistics in the field was provided by Alberta Environment and Protected Areas (Mecah Klem, Joel Nicholson, Eric Spilker, and Todd Whiklo), Grasslands National Park (Stefano Liccioli), The Nature Conservancy of Canada (Mike Burak, Craig Harding, Megan Jensen and Morganne Wall), and Saskatchewan Ministry of Environment (Todd Whiklo). Grasslands National Park and The Nature Conservancy of Canada allowed the construction of acclimation pens on their property. Identification of predators based on remains collected at predation sites was conducted by Alberta Environment and Protected Areas (Gordon Court) and Wilder Institute/Calgary Zoo (Dario Fernandez-Bellon).
Conflict of interest
Authors SN, JS, JH, and JAH were employed by the company Computational Ecology Group Inc.
The remaining authors declare that the research was conducted in the absence of any commercial or financial relationships that could be construed as a potential conflict of interest.
Publisher’s note
All claims expressed in this article are solely those of the authors and do not necessarily represent those of their affiliated organizations, or those of the publisher, the editors and the reviewers. Any product that may be evaluated in this article, or claim that may be made by its manufacturer, is not guaranteed or endorsed by the publisher.
Supplementary material
The Supplementary Material for this article can be found online at: https://www.frontiersin.org/articles/10.3389/fcosc.2024.1393264/full#supplementary-material
References
AESRD (2013). “(Alberta environmental and sustainable resource development). Alberta greater sage-grouse recovery plan 2013-2018,” in Alberta Environmental and Sustainable Resource Development, Alberta Species at Risk Recovery Plan No. 30(Edmonton, AB). https://open.alberta.ca/dataset/f0f4cc27-408d-4130-b6eb-12bc6d99a482/resource/13e7632e-f357-4ce0-80f3-211919a92d43/download/2013-sar-albertagreatersagegrouserecoveryplan-2013-2018.pdf.
Alberta Environment and Sustainable Resource Devlopment (2013). “Alberta greater sage-grouse recovery plan 2013-2018,” in Alberta Environment and Sustainable Resource Development, Alberta Species at Risk Recovery Plan No. 30(Edmonton, AB).
Alberta Parks (2015). Natural Regions and Subregions of Alberta: A Framework for Alberta’s Parks (Edmonton, Alberta: Alberta Tourism, Parks, and Recreation).
Aldridge C. L., Boyce M. S. (2007). Linking occurrence and fitness to persistence: Habitat-based approach for endangered Greater Sage-Grouse. Ecol. Appl. 17, 508–526. doi: 10.1890/05-1871
Aldridge C. L., Nielsen S. E., Beyer H. L., Boyce M. S., Connelly J. W., Knick S. T., et al. (2008). Range-wide patterns of greater sage-grouse persistence. Divers. Distrib. 14, 983–994. doi: 10.1111/j.1472-4642.2008.00502.x
Al Jahdhami M., Al-Mahdhoury S., Al Amri H. (2011). “The Reintroduction of Arabian Oryx to the Al Wusta Wildlife Reserve in Oman: 30 years on,” in Global Re-introduction Perspectives: 2011. More case studies from around the globe, vol. xiv. (IUCN/SSC Re-introduction Specialist Group and Abu Dhabi, UAE: Environment Agency-Abu Dhabi, Gland, Switzerland), 250.
Amaral M., Kozol A., French T. (1997). Conservation status and reintroduction of the endangered American burying beetle. Northeast. Nat. 4, 121–132. doi: 10.2307/3858707
Andersen P. G., Gill R. D. (1982). Cox’s regression model for counting processes: a large sample study. Ann. Stat. 10, 1100–1120. doi: 10.1214/aos/1176345976
Armstrong D. P., Seddon P. J. (2008). Directions in reintroduction biology. Trends Ecol. Evol. 23, 20–25. doi: 10.1016/j.tree.2007.10.003
Avgar T., Lele S. R., Keim J. L., Boyce M. S. (2017). Relative Selection Strength: Quantifying effect size in habitat- and step-selection inference. Ecol. Evol. 7, 5322–5330. doi: 10.1002/ece3.3122
Avgar T., Potts J. R., Lewis M. A., Boyce M. S. (2016). Integrated step selection analysis: Bridging the gap between resource selection and animal movement. Methods Ecol. Evol. 7, 619–631. doi: 10.1111/2041-210X.12528
Balderson K. L. (2017). Habitat selection and nesting ecology of translocated Greater Sage-grouse. (University of Regina, Regina, Saskatchewan).
Bartel R. A., Knowlton F. F. (2005). Functional feeding response of Coyotes, Canis latrans, to fluctuating prey abundance in the Curley Valley, Utah 1977-1993. J. Zool. 83, 569–578. doi: 10.1139/Z05-039
Barton K. (2018). MuMIn: multi-model inference. R package version 1.42.1. Available online at: https://cran.r-project.org/package=MuMIn.
Baxter R. J., Larsen R. T., Flinders J. T. (2013). Survival of resident and translocated Greater sage-grouse in Strawberry Valley, Utah: a 13-year study. J. Wildl. Manage. 77, 802–811. doi: 10.1002/jwmg.520
Beck J. L., Reese K. P., Connelly J. W., Lucia M. B. (2006). Movements and survival of juvenile greater sage-grouse in Southeastern Idaho. Wildl. Soc Bull. 34, 1070–1078. doi: 10.2193/0091-7648(2006)34[1070:MASOJG]2.0.CO;2
Beers A. T., Frey S. N. (2022). Greater sage-grouse habitat selection varies across marginal habitat of its lagging range margin. Ecosphere 13, e4146. doi: 10.1002/ecs2.4146
Bell B. (2016). “Behavior-based management: Conservation translocations,” in Conservation Behavior: Applying Behavioral Ecology to Wildlife Conservation and Management. Eds. Berger-Tal O., Saltz D. (Cambridge, England: Cambridge University Press), 212–246.
Berger-Tal O., Blumstein D. T., Swaisgood R. R. (2020). Conservation translocations: a review of common difficulties and promising directions. Anim. Conserv. 23, 121–131. doi: 10.1111/acv.12534
Bloxam Q. C., Tonge S. J. (1995). Amphibians: suitable candidates for breeding-release programmes. Biodivers. Conserv. 4, 636–644. doi: 10.1007/BF00222519
Boyce M. S., Vernier P. R., Nielsen S. E., Schmiegelow F. K. A. (2002). Evaluating resource selection functions. Ecol. Modell. 157, 281–300. doi: 10.1016/S0304-3800(02)00200-4
Bremner-Harrison S., Prodohl P. A., Elwood R. W. (2004). Behavioural trait assessment as a release criterion: boldness predicts early death in a reintroduction programme of captive-bred swift fox (Vulpes velox). Anim. Conserv. 7, 313–320. doi: 10.1017/S1367943004001490
Brown C. D., Davis H. T. (2006). Receiver operating characteristic curves and related decision measures: A tutorial. Chemom. Intell. Lab. Syst. 80, 24–38. doi: 10.1016/j.chemolab.2005.05.004
Bubac C. M., Johnson A. C., Fox J. A., Cullingham C. I. (2019). Conservation translocations and post-release monitoring: Identifying trends in failures, biases, and challenges from around the world. Biol. Conserv. 238, 108239. doi: 10.1016/j.biocon.2019.108239
Burnham K. P., Anderson D. R. (2002). Model Selection and Multimodel Inference: A Practical Information Theoretic Approach (New York, New York, USA: Springer).
Butchart S. H. M., Walpole M., Collen B., Van Strien A., Scharlemann J. P. W., Almond R. E. A., et al. (2010). Global biodiversity: Indicators of recent declines. Sci. (80-.). 328, 1164–1168. doi: 10.1126/science.1187512
Carpenter J., Aldridge C., Boyce M. S. (2010). Sage-grouse habitat selection during winter in Alberta. J. Wildl. Manage. 74, 1806–1814. doi: 10.2193/2009-368
Carrlson K., Kessler D. C., Thompson T. R. (2014). Survival and habitat use in translocated and resident Greater Prairie-Chickens. J. Nat. Conserv. 22, 405–412. doi: 10.1016/j.jnc.2014.03.008
Collar N. J. (2020). Preparing captive-bred birds for reintroduction: the case of the Vietnam Pheasant Lophura edwardsi. Bird Conserv. Int. 30, 559–579. doi: 10.1017/S0959270920000039
Connelly J. W., Knick S. T., Schroeder M., Stiver S. J. (2004). Conservation Assessment of Greater Sage-Grouse and Sagebrush Habitats (Cheyenne, Wyoming: Proc. West. Assoc. Fish Wildl. Agencies), 610. Available at: http://sagemap.wr.usgs.gov/docs/Greater_Sage-grouse_Conservation_Assessment_060404.pdf.
Connelly J. W., Schroeder M. A., Sands A. R., Braun C. E. (2000). Guidelines to manage sage-grouse populations and their habitats. Wildl. Soc Bull. 28, 967–985.
Cullingham C. I., Moehrenschlager A. (2013). A. Temporal analysis of genetic structure to assess population dynamics of reintroduced swift foxes. Conserv. Biol. 27, 1389–1398. doi: 10.1111/cobi.12122
Cutting K. A., Rotella J. J., Schroff S. R., Frisina M. R., Waxe J. A., Nunlist E., et al. (2019). Maladaptive nest-site selection by a sagebrush dependent species in a grazing-modified landscape. J. Environ. Manage. 236, 622–630. doi: 10.1016/j.jenvman.2019.01.085
Denton J. S., Hitchings S. P., Beebee T. J. C., Gent A. (1997). Recovery program for the natterjack toad (Bufo calamita) in Britain. Conserv. Biol. 11, 1329–1338. doi: 10.1046/j.1523-1739.1997.96318.x
Dickens M. J., Delehanty D. J., Michael Romero L., Sesnie S. E., Mueller J. M., Lehnen S. E., et al. (2010). Effects of prescribed fire on fuels, vegetation, and Golden-cheeked Warbler (Setophaga chrysoparia) demographics in Texas juniper-oak woodlands. Wildl. Soc Bull. 143, 473–479. doi: 10.1016/j.foreco.2016.06.005
Dickens M. J., Delehanty D. J., Romero L. M. (2009). Stress and translocation: Alterations in the stress physiology of translocated birds. Proc. R. Soc B Biol. Sci. 276, 2051–2056. doi: 10.1098/rspb.2008.1778
Dinkins J. B., Conovery M. R., Kirol C. P., Beck J. L., Frey S. N. (2014). Greater Sage-Grouse (Centrocercus urophasianus) select habitat based on avian predators, landscape composition, and anthropogenic features. Condor Ornithol. Appl. 116, 629–642. doi: 10.1650/CONDOR-13-163.1
Dinkins J. B., Smith K. T., Beck J. L., Kirol C. P., Pratt A. C., Conover M. R. (2016). Microhabitat conditions in Wyoming’s sage-grouse core areas: Effects on nest site selection and success. PloS One 11, 1–17. doi: 10.1371/journal.pone.0150798
Draycott R. A., Hoodless A. N., Ludiman M. N., Robertson P. A. (1998). Effects of spring feeding on body condition of captive-reared ring-necked pheasants in Great Britain. J. Wildl. Manage. 11, 557–563. doi: 10.2307/3802329
Duchesne T., Fortin D., Rivest L. P. (2015). Equivalence between step selection functions and biased correlated random walks for statistical inference on animal movement. PloS One 10, e0122947. doi: 10.1371/journal.pone.0122947
Environment Canada (2014). “Amended recovery strategy for the Greater Sage-grouse (Centrocercus urophasianus) in Canada,” in Species at Risk Act Recovery Strategy Series (Environment Canada, Ottawa).
Fedy B. C., Doherty K. E., Aldridge C. L., O’Donnell M., Beck J. L., Bedrosian B., et al. (2014). Habitat prioritization across large landscapes, multiple seasons, and novel areas: An example using greater sage-grouse in Wyoming. Wildl. Monogr. 190, 1–39. doi: 10.1002/wmon.1014
Ferrer M., Morandini V., Baguena G., Newton I. (2018). Reintroducing endangered raptors: A case study of supplementary feeding and removal of nestlings from wild populations. J. Appl. Ecol. 55, 1360–1367. doi: 10.1111/1365-2664.13014
Fieberg J., Forester J. D., Street G. M., Johnson D. H., ArchMiller A. A., Matthiopoulos J. (2018). Used-habitat calibration plots: A new procedure for validating species distribution, resource selection, and step-selection models. Ecography (Cop.). 41, 737–752. doi: 10.1111/ecog.03123
Fieberg J., Signer J., Smith B., Avgar T. (2021). A ‘How to’ guide for interpreting parameters in habitat-selection analyses. J. Anim. Ecol. 90, 1027–1043. doi: 10.1111/1365-2656.13441
Fischer J., Lindenmayer D. B. (2000). An assessment of the published results of animal relocations. Biol. Conserv. 96, 1–11. doi: 10.1016/S0006-3207(00)00048-3
Flieg G. M. (1971). North American grouse Tetraonidae as zoo exhibits. Int. Zoo Yearb. 11, 219–220. doi: 10.1111/j.1748-1090.1971.tb01910.x
Fortin D., Byer H. L., Boyce M. S., Smith M. S., Duchesne T., Mao J. S. (2005). Wolves influence elk movements: behavior shapes a trophic cascade in Yellowstone National park. Ecology 86, 1320–1330. doi: 10.1890/04-0953
Fox J., Weisberg S. (2018). An R Companion to Applied Regression. 3rd ed (Los Angeles, California: SAGE Publications, Inc).
Frith C. (2013). The Woodhen: A flightless island bird defying extinction (Melbourne: CSIRO Publishing). doi: 10.1071/9780643108714
Gelling E. L. (2022). Seasonal habitat selection and breeding ecology of Greater sage-grouse in Carbon County, Montana. (Wyoming: University of Wyoming, Laramie).
Government of Saskatchewan (2023). Vertical Wells. Available online at: https://geohub.saskatchewan.ca/maps/saskatchewan::petroleum-1/about.
Gregg M. A., Crawford J. A. (2010). Survival of greater sage-grouse chicks and broods in the Northern Great Basin. J. Wildl. Manage. 73, 904–913. doi: 10.2193/2007-410
Griffith B., Scott J. M., Carpenter J. W. (1989). Translocation as a species conservation tool: status and strategy. Sci. (80). 245, 477–480. doi: 10.1126/science.245.4917.477
Hagen C. A., Willis M. J., Glenn E. M., Anthony R. G. (2011). Habitat selection by Greater Sage-Grouse during winter in southeastern Oregon. West. North Am. Nat. 71, 529–538. doi: 10.3398/064.071.0411
Hancock D. (1993). “The Grouse family: A review of their captive status and practical aviculture,” in World Pheasant Association Captive Breeding Symposium (Antwerp, Belgium: Zoo Antwep), 44–53.
Harju S. M., Olson C. V., Dzialak M. R., Mudd J. P., Winstead J. B. (2013). A flexible approach for assessing functional landscape connectivity, with application to greater sage-grouse (Centrocercus urophasianus). PloS One 8, e82271. doi: 10.1371/journal.pone.0082271
Heinrichs J. A., Aldridge C. L., Gummer D. L., Monroe A. P., Schumaker N. H. (2018). Prioritizing actions for the recovery of endangered species: Emergent insights from Greater Sage-grouse simulation modeling. Biol. Conserv. 218, 134–143. doi: 10.1016/j.biocon.2017.11.022
Heinrichs J. A., McKinnon D. T., Aldridge C. L., Moehrenschlager A. (2019). Optimizing the use of endangered species in multi-population collection, captive breeding and release programs. Glob. Ecol. Conserv. 17, e00558. doi: 10.1016/j.gecco.2019.e00558
Hovick T. J., Elmore R. D., Dahlgren D. K., Fuhlendorf S. D., Engle D. M. (2014). Evidence of negative effects of anthropogenic structures on wildlife: a review of grouse survival and behavior. J. Appl. Ecol. 51, 1680–1689. doi: 10.1111/1365-2664.12331
Howe K. B., Coates P. S., Delehanty D. J. (2014). Selection of anthropogenic features and vegetation characteristics by nesting Common Ravens in the sagebrush ecosystem. Condor Ornithol. Appl. 116, 35–29. doi: 10.1650/CONDOR-13-115-R2.1
IUCN (2018). The IUCN red list of threatened species. Version 2018-1. Accessed on [January 3, 2023].
IUCN/SSC (2013). Guidelines for Reintroductions and Other Conservation Translocations. Version 1.0. Available online at: www.iucnsscrsg.org.
Jackson C. H. (2016). Flexsurv: A platform for parametric survival modeling in R. J. Stat. Software 70, 1–33. doi: 10.18637/jss.v070.i08
Johnson C. J., Boyce M. S., Schwartz C. C., Haroldson M. A. (2004). Modeling survival: application of the andersen-gill model to yellowstone grizzly bears. J. Wildl. Manage. 68, 966–978. doi: 10.2193/0022-541X(2004)068[0966:MSAOTA]2.0.CO;2
Kalbfleisch J. D., Prentice R. L. (1980). The statistical analysis of failure time data (New York, New York, USA: John Wiley and Sons).
Kirol C. P., Beck J. L., Huzurbazar S. V., Holloran M. J., Miller S. N. (2015). Identifying Greater Sage-Grouse source and sink habitats for conservation planning in an energy development landscape. Ecol. Appl. 25, 968–990. doi: 10.1890/13-1152.1
Knick S. T., Dobkin D. S., Rotenberry J. T., Schroeder M. A., Vander Haegen W. M., Van Riper C. (2003). Teetering on the edge or too late? Conservation and research issues for avifauna of sagebrush habitats. Condor 105, 611–634. doi: 10.1093/condor/105.4.611
Lammers W. M., Collopy M. W. (2007). Effectiveness of avian predator perch deterrents on electric transmission lines. J. Wildl. Manage. 71, 2752–2758. doi: 10.2193/2005-752
Lance A. N., Zwickel F. C., Gornall F. A., Bendell J. F. (1970). Diet and mortality of young blue grouse raised in captivity. J. Wildl. Manage. 34, 653–655. doi: 10.2307/3798880
Lazenby K. D., Coates P. S., O’Neil S. T., Kohl M. T., Dahlgren D. K. (2020). Nesting, brood rearing, and summer habitat selection by greater sage-grouse in North Dakota, USA. Ecol. Evol. 11, 2741–2760. doi: 10.1002/ece3.7228
Le Gouar P., Mihoub J.-B., Sarrazin F. (2012). “Dispersal and habitat selection: behavioural and spatial constraints for animal translocations,” in Reintroduction Biology: Integrating Science and Management. Eds. Ewen J. G., Armstrong D. P., Parker K. A., Seddon P. J. (Hoboken, New Jersey: Blackwell Publishing Ltd), 139–164.
Mahboubi A., Abrahamowicz M., Giorgi R., Binquet C., Nonithon-Kopp C., Quantin C. (2011). Flexible modeling of the effects of continuous prognostic factors in relative survival. Stat. Med. 30, 1351–1365. doi: 10.1002/sim.4208
Maness T. J., Anderson D. J. (2013). Predictors of juvenile survival in birds. Ornithol. Monogr. 78, 1–55. doi: 10.1525/om.2013.78.1.1
Marino F., McDonald R. A., Crowley S. L., Hodgson D. J. (2024). Rethinking the evaluation of animal translocations. Biol. Conserv. 292, 110523. doi: 10.1016/j.biocon.2024.110523
Mathews S. R., Coates P. S., Delehanty D. J. (2016). Survival of translocated Sharp-tailed Grouse: temporal threshold and age effects. Wildl. Res. 43, 220–227. doi: 10.1071/WR15158
May T. M., Page M. J., Fleming P. A. (2016). Predicting survivors: animal temperament and translocation. Behav. Ecol. 27, 969–977. doi: 10.1093/beheco/arv242
McCarthy M. A., Armstrong D. P., Runge M. C. (2012). “Adaptive management and reintroduction,” in Reintroduction Biology: Integrating Science and Management. Eds. Ewen J. G., Armstrong D. P., Parker K. A., Seddon P. J. (Oxford, United Kingdom: Blackwell Publishing Ltd), 256–289.
Merta D., Kobielski J., Theuerkauf J., Gula R. (2016). Towards a successful reintroduction of Capercaillies - activity, movements and diet of young released to the Lower Silesia Forest, Poland. Wildlife Biol. 22, 130–135. doi: 10.2981/wlb.00208
Moehrenschlager A., Lloyd N. (2016). “Release considerations and techniques to improve conservation translocation success,” in Reintroduction of Fish and Wildlife Populations. Eds. Jachowski D. S., Millspaugh J. J., Angermeier P., Slotow R. (Oakland, California: University of California Press). https://open.alberta.ca/dataset/a31c158f-4b95-4c25-baea-d45032ac451b/resource/95ebd752-2137-4650-8684-a840cde0a873/download/sar024-censusswiftfoxcanadanorthernmontana-aug2001.pdf.
Moehrenschlager A., Moehrenschlager C. (2001). “Census of swift fox (Vulpes velox) in Canada and northern Montana: 2001-2001,” in Alberta Sustainable Resource Development, Fish and Wildlife Division, Alberta Species At Risk Report No. 24(Edmonton, AB).
Morris S. D., Brook B. W., Moseby K. E., Johnson C. N. (2021). Factors affecting success of conservation translocations of terrestrial vertebrates: A global systematic review. Glob. Ecol. Conserv. 28, e01630. doi: 10.1016/j.gecco.2021.e01630
Musil D., Connelly J. W., Reese K. P. (1993). Movements, survival, and reproduction of sage grouse translocated into Central Idaho. J. Wildl. Manage. 57, 85–91. doi: 10.2307/3809004
Nichols J. D., Armstrong D. P. (2012). “Monitoring for reintroductions,” in Reintroduction Biology: Integrating Science and Management. Eds. Ewen J. G., Armstrong D. P., Parker K. A., Seddon P. J. (West Sussex, United Kingdom: Blackwell Publishing Ltd), 223–255.
Nicoll M. A. C., Jones C. G., Norris K. (2004). Comparison of survival rates of captivereared and wild-bred Mauritius kestrels (Falco punctatus) in a re-introduced population. Biol. Conserv. 118, 539–548. doi: 10.1016/j.biocon.2003.09.028
O’Neil S. T., Coates P. S., Brussee B. E., Ricca M. A., Espinosa S. P., Gardner S. C., et al. (2020). Wildfire and the ecological niche: Diminishing habitat suitability for an indicator species within semi-arid ecosystems. Glob. Change Biol. 26, 6296–6312. doi: 10.1111/gcb.15300
Osborne P. E., Seddon P. J. (2012). “Selecting suitable habitats for reintroductions: variation, change and the role of species distribution modelling,” in Reintroduction Biology: Integrating Science and Management. Eds. Ewen J. G., Armstrong D. P., Parker K. A., Seddon P. J. (Hoboken, New Jersey: Blackwell Publishing Ltd), 73–104.
Panzacchi M., Van Moorter B., Strand O., Saerens M., St. Clair C. C., Herfindal I., et al. (2016). Predicting the continuum between corridors and barriers to animal movements using step selection functions and randomized shortest paths. J. Anim. Ecol. 85, 32–42. doi: 10.1111/1365-2656.12386
Parish C., Hunt W. G. (2016). “The peregrine fund’s California condor recovery program, Northern Arizona and Southern Utah, USA,” in Global Re-introduction Perspectives: 2016. Case-Studies From Around the Globe, vol. xiv . Ed. Soorae P. S. (IUCN/SSC Reintroduction Specialist Group and Abu Dhabi, UAE: Environment Agency- Abu Dhabi, Gland, Switzerland), 276.
Parish D. M. B., Sotherton N. W. (2007). The fate of released captive-reared grey partridges Perdix perdix: implications for reintroduction programmes. Wildlife Biol. 13, 140–149. doi: 10.2981/0909-6396(2007)13[140:TFORCG]2.0.CO;2
Parker K. A., Dickens M. J., Clarke R. H., Lovegrove T. G. (2012). “The theory and practice of holding, moving, and releasing animals,” in Reintroduction biology: integrating science and management. Eds. Ewen J. G., Armstrong D. P., Parker K. A., Seddon P. J. (West Sussex, United Kingdom: Blackwell Publishing Ltd), 105–137.
Parks Canada (2022). Grasslands National Park of Canada Management Plan (Val Marie, Saskatchewan). Available at: https://parks.Canada.ca/pn-np/sk/grasslands/info/plan/plan-2022.
Parks Canada Agency (2021). “Implementation report: multi-species action plan for Grasslands National Park of Canada, (2016 – 2021),” in Species at Risk Act Action Plan Report Series (Parks Canada Agency, Ottawa).
Parsons L., Jenks J., Runia T., Gregory A. (2022). Comparing methods of defining priority reas for greater sage-grouse. Front. Ecol. Evol. 10, 896023. doi: 10.3389/fevo.2022.896023
Peelle L. E., Wirsing A. J., Pilgrim K. L., Schwartz M. K. (2019). Identifying predators from saliva at kill sites with limited remains. Wildl. Soc Bull. 43, 546–557. doi: 10.1002/wsb.992
Picardi S., Coates P., Kolar J., O’Neil S., Mathews S., Dahlgren D. (2021). Behavioral state-dependent habitat selection and implications for animal translocations. J. Appl. Ecol. 59, 624–635. doi: 10.1111/1365-2664.14080
Prather P. R., Messmer T. A. (2010). Raptor and corvid response to power distribution line perch deterrens in Utah. J. Wildl. Manage. 74, 796–800. doi: 10.2193/2009-204
Pratt A. C., Beck J. L. (2021). Do greater sage-grouse exhibit maladaptive habitat selection? Ecosphere 12, e03354. doi: 10.1002/ecs2.3354
Putaala A., Hissa R. (1998). Breeding dispersal and demography of wild and hand-reared grey partridges (Perdix perdix) in Finland. Wildlife Biol. 4, 137–145. doi: 10.2981/wlb.1998.016
Quinlan R. W. (2013). Alberta Greater Sage-grouse Avian Predator Survey. Alberta Species at Risk Report No. 149 (Edmonton, Alberta). https://open.alberta.ca/dataset/925e6bc2-17af-4e83-a6dc-0c6dd6c2d2db/resource/829bcd20-505c-4aad-8b9b-c0740641f531/download/2013-SAR149-SageGrouseAvianPredatorSurvey-Jul2013.pdf.
Rantanen E. M., Buner F., Riordan P., Sotherton N., Macdonald D. W. (2010). Habitat preferences and survival in wildlife reintroductions: an ecological trap in reintroduced grey partridges. J. Appl. Ecol. 47, 1357–1364. doi: 10.1111/j.1365-2664.2010.01867.x
Ritchie E. G., Johnson C. N. (2009). Predator interactions, mesopredator release and biodiversity conservation. Ecol. Lett. 12, 982–998. doi: 10.1111/j.1461-0248.2009.01347.x
Rummel L., Martínez–Abraín A., Mayol J., Ruiz-Olmo J., Mañas F., Jiménez J., et al. (2016). Use of wild-caught individuals as a key factor for success in vertebrate translocations. Anim. Biodivers. Conserv. 39.2, 207–219. doi: 10.32800/abc
Sage R. B., Putaala A., Pradell-Ruiz V., Greenall T. L., Woodburn M. I. A., Draycott R. A. H. (2003). Incubation success of released hand-reared pheasants Phasianus colchicus compared with wild ones. Wildlife Biol. 9, 179–184. doi: 10.2981/wlb.2003.048
Saikia R., Barman M. P. (2017). A review on accelerated failure time models. Int. J. Stat. Syst. 12, 311–322.
Seddon P. J., Griffiths C. J., Soorae P. S., Armstrong D. P. (2014). Reversing defaunation: restoring species in a changing world. Sci. (80). 345, 406–412. doi: 10.1126/science.1251818
Seddon P. J., Strauss W. M., Innes J. (2012). “Animal translocations: what are they and why we do them?,” in Reintroduction Biology: Integrating Science and Management. Eds. Ewen J. D., Armstrong D. P., Parker K. A., Seddon P. J. (Oxford, United Kingdom: Blackwell Publishing Ltd), 1–32.
Shute J. R., Rakes P. L., Shute P. W. (2005). Reintroduction of four imperiled fishes in Abrams Creek, Tennessee. Southeast. Nat. 4, 93–110. doi: 10.1656/1528-7092(2005)004[0093:ROFIFI]2.0.CO;2
Signer J., Fiebery J., Avgar T. (2019). Animal movement tools (amt): R package for managing tracking data and conduing habitat selection analyses. Ecol. Evol. 9, 880–890. doi: 10.1002/ece3.4823
Slater S. J., Smith J. P. (2010). Effectiveness of raptor perch deterrents on an electrical transmission line in southwestern Wyoming. J. Wildl. Manage. 74, 1080–1088. doi: 10.2193/2008-525
Snyder N. F. R., Derrickson S. R., Beissinger S. R., Wiley J. W., Smith S. B., Toone W. D., et al. (1996). Limitations of captive breeding in endangered species recovery. Conserv. Biol. 10, 338–348. doi: 10.1046/j.1523-1739.1996.10020338.x
Sokos C. K., Birtsas P. K., Tsachalidis E. P. (2008). The aims of galliforms release and choice of techniques. Wildlife Biol. 14, 412–422. doi: 10.2981/0909-6396-14.4.412
Swenson J. E. (1986). Differential survival by sex in juvenile sage grouse and gray partridge. Ornis Scand. 17, 14–17. doi: 10.2307/3676747
Tack J. D. (2009). Sage-grouse and the human footprint: implications for conservation of small and declining populations. University of Montana, Missoula, Montana.
Teixeira C. P., de Azevedo C. S., Mendl M., Cipreste C. F., Young R. J. (2007). Revisiting translocation and reintroduction programmes: the importance of considering stress. Anim. Behav. 73, 1–13. doi: 10.1016/j.anbehav.2006.06.002
Therneau T. M. (2023). A Package for Survival Analysis in R. (Springer, Berlin, Germany). Available online at: https://cran.r-project.org/package=survival.
Thompson T. R., Apa A. D., Reese K. P., Tadvick K. M. (2015). Captive rearing sage-grouse for augmentation of surrogate wild broods: Evidence for success. J. Wildl. Manage. 79, 998–1013. doi: 10.1002/jwmg.905
Thorpe J., Stephens T. (2017). Development of Habitat Mapping and Decision Support Tool for Greater Sage-grouse and Black-tailed Prairie Dog (Saskatchewan Resource Council).
Thurfjell H., Ciuti S., Boyce M. S. (2014). Applications of step-selection functions in ecology and conservation. Mov. Ecol. 2, 4. doi: 10.1186/2051-3933-2-4
Tordoff H. B., Redig P. T. (2001). Role of genetic background in the success of reintroduced peregrine falcons. Conserv. Biol. 15, 528–532. doi: 10.1046/j.1523-1739.2001.015002528.x
Turchin P. (1998). Quantitative analyses of movements: measuring and modeling population redistribution in animals and plants (Sunderland: Sinauer Associates, Inc).
Warren P., Baines D. (2018). Expanding the range of black grouse Lyrurus tetrix in northern England - Can wild females be successfully translocated? Wildlife Biol. 2018, 1–7. doi: 10.2981/wlb.00435
Whiklo T., Nicholson J. (2015). Translocation of Greater Sage-grouse from Montana to Alberta: 2011 - 2013 progress report. (Alberta Environment and Parks, Alberta, Canada), 1–28.
Keywords: accelerated failure time model, Anderson-Gill model, conservation translocation, Cox proportional hazards model, captive breeding, greater sage-grouse, integrated step-selection function, risk surface
Citation: Nelson SL, Saher DJ, Huang J, McKinnon DT, Coleing A, Griebel IA, Wellicome TI, Moehrenschlager A and Heinrichs JA (2024) Visualizing the risk landscape to adaptively increase post-release survival of translocated Galliformes. Front. Conserv. Sci. 5:1393264. doi: 10.3389/fcosc.2024.1393264
Received: 28 February 2024; Accepted: 21 June 2024;
Published: 13 August 2024.
Edited by:
Eliana Pintus, Czech University of Life Sciences Prague, CzechiaReviewed by:
Filippo Marino, University of Leeds, United KingdomAli T. Qashqaei, Borderless Wildlife Conservation Society, Iran
Copyright © 2024 Nelson, Saher, Huang, McKinnon, Coleing, Griebel, Wellicome, Moehrenschlager and Heinrichs. This is an open-access article distributed under the terms of the Creative Commons Attribution License (CC BY). The use, distribution or reproduction in other forums is permitted, provided the original author(s) and the copyright owner(s) are credited and that the original publication in this journal is cited, in accordance with accepted academic practice. No use, distribution or reproduction is permitted which does not comply with these terms.
*Correspondence: Shelley L. Nelson, c25lbHNvbkBjZWcuZ3JvdXA=