 Adolfo Donoso
 Basilio Carrasco
 Carolina Araya3
 Erika Salazar
- 1Horticultural Crops, La Platina, Instituto de Investigaciones Agropecuarias, Santiago, Chile
- 2Centro de Estudios en Alimentos Procesados, Universidad de Talca, Talca, Chile
- 3Genetic Resources Unit and Germplasm Bank, La Platina, Instituto de Investigaciones Agropecuarias, Santiago, Chile
Landraces constitute a valuable genetic pool of increased diversity that can be exploited for agriculture sustainability, food security, food quality, and future yield increments. It also contributes to understanding a species’ origin, domestication, population dynamics, and diversity. Chilean tomato germplasm characterization and documentation are scarce. To elucidate its potential and distinctiveness, we assessed the genetic variability between and within accessions of tomato landraces grown in Chile between 1938 and 2016, determining the relationships between them and with some European and US heirloom varieties. For this purpose, the tomato plants were characterized using 72 descriptors for vegetative and reproductive morphology. In addition, molecular diversity and the determination of genetic patterns between tomato accessions were made using highly informative SSR markers. Our results indicate that the genetic structure among evaluated accessions is associated with differences between the Chilean landraces grown to 1938 and cultivars grown in Europe and USA. The Chilean cluster presented a high variability. The Limachino tomato landrace is close to Marmande but distinguishable on phenotype and the molecular basis for its private alleles, being grown in the territory of Limache before 1960 until the present day. Accessions of pink beefsteak tomato grown in Chile to 2015 are distant to the rest of the tomato accessions on morphotype and close in SSR genotype to the materials grown in Chile in 1938, supporting the hypothesis of a pre-green revolution tomato diversification in Chilean territory. Chilean tomato populations may impact breeding programs due to higher variability in yield components. Our results are consistent with other researchers that have proposed Mesoamerica and the Andes Region as tomatoes’ primary center of diversity.
1 Introduction
At the beginning of the 20th century, breeding programs developed genetically uniform varieties. The adoption of these varieties allowed an increment in yield by the displacement of the landraces (Mazzucato et al., 2008; Ceccarelli, 2011), which are distinctive and genetically heterogeneous varieties, developed and managed by peasants in different ecogeographical areas and, therefore, adapted to the edaphic and climatic conditions and to its traditional management and uses (Zeven, 1998; Casañas et al., 2017). Nowadays, breeding programs continue to work towards yield increments, pursuing novel improved varieties with higher yields when grown using irrigation, fertilization, and pesticides. This is achieved by novel combinations of 30–60,000 genetic loci (The Tomato Genome Consortium, 2012). The success of a breeding program is facilitated by the introduction of a wild relative or a landrace. In tomatoes, Gur and Zamir (2004) reported a yield increment of over 50% using as parental material the wild relative Solanum pennelli (Correll) D’Arcyi, while the importance of landraces lies in their resilience to specific environments and the distinctive organoleptic, nutritional, nutraceutical, historical, and cultural traits (Hawkes, 1983; Fowler and Mooney, 1990; Ramirez-Villegas et al., 2022).
In the second half of the 20th century, the massive relegation of landraces generated a loss of collective cultivation history (Farinon et al., 2022). Urgent efforts to collect landraces for genebank conservation were initiated in the 1960s, achieving a 63% ex situ conservation of major staple landraces from their historically recognized centers of diversity. Larger conservation gaps exist for crops that did not receive international priority (Salazar et al., 2006; Ramirez-Villegas et al., 2022). A similar assessment applies to in situ–ex situ conservation of crop wild relatives, which are potential gene donors to a crop (Maxted and Kell, 2009). One case is the tomato (Solanum lycopersicum L.) and its wild relatives, which, more than a half-century ago, Rick (1958) remarked on the lack of international priority.
The reconstruction of the tomato domestication history reveals complexities in a non-linear process of multiple human northward spreading. The small-fruited S. lycopersicum var cerasiforme, distributed in Mexico, Central America, and South America, is proposed as the semidomesticated intermediate in a two-stage transition from the wild Solanum pimpinellifolium to the domesticated forms of S. lycopersicum var. lycopersicum (2n = 24), which originated in central South America. Evidence of common tomato cultivation in pre-Columbian America (Patiño, 2002) continued in the post-Columbian period (Cobo, 1653), supporting the hypothesis of Mesoamerica and the Andes region as tomato primary centers of diversity and centers of origin of S. lycopersicum var. lycopersicum (Rodríguez et al., 2011; Bauchet and Causse, 2012; Razifard et al., 2020), with a wide diversity of landraces being preserved by peasant agriculture (Chávez-Servia et al., 2018). These regions were recently identified by Ramirez-Villegas et al. (2022) among the geographic hotspots with high levels of conservation gaps, where addressing the state of in situ conservation is needed.
Historically, north-central Chile has been recently recognized as part of the pre-Columbian Andes agriculture (Stehberg and Sotomayor, 2012), subsisting to the 20th century a richness of tomato landraces, which was hypothesized by Rick (1958) as naturally occurring introgressions of modern varieties with the local materials, probably taking place in post-Columbian times. The Valparaiso region became the main tomato producer before 1950, which currently ranks third. The small valley of Limache, a commune of the Valparaiso region, produced 11% of the Chilean tomato growing surface in 1965 (Donoso et al., 2022). Among the local tomato diversity, a tomato landrace denominated Limachino is recognized and grown for its precocity as an option to Marglobe and Marmande introduced from USA and France, respectively (Universidad Cato lica de Chile and CORFO, 1986). Nevertheless, because of its short shelf-life and brief harvest period, the Limachino tomato was displaced by other foreign varieties in the 1960s (Merino, 1968). In 2015, an in situ tomato collection made in Valparaiso’s region Marga valley, composed of the communes of Limache, Olmué, Quilpué, and Villa Alemana, revealed that only four growers conserved tomato landrace seeds, evidencing precarious in situ conservation of the Limachino landraces (Martinez et al., 2021). These landraces were identified by the growers as Limachino-type, differentiating them from European and US heirlooms varieties, such as Marmande and Marglobe, which were the commercial alternatives in the territory to the 1960s. Because of the recent interest in recovering this local variety, which may represent an interesting typical product of the Marga valley, and to promote its commercialization, the in situ and ex situ existing landraces needed to be distinguished from foreign similar types. Therefore, the objective of the present work was to evaluate the genetic diversity between and within tomato accessions and determine the relationships between several Chilean tomato landraces, defining distinctiveness criteria for the landrace named Limachino, by using a morphological and molecular approach.
2 Materials and methods
2.1 Plant material
A total of 32 accessions were selected from the tomato collection of La Platina Germplasm Bank, Instituto de Investigaciones Agropecuarias (INIA) – Chile. These accessions represented a wide diversity in fruit morphology, year of collection, and collection territory inside Chile (Table 1; Supplementary Figure 1). The 11 accessions assigned with the local name Limachino in the tomato collection were among the selected. The accession SLY74, collected in 1960 with the vernacular name Limachino, is taken as the Limachino reference sample because it was the oldest accession with the name assigned. Three commercial hybrids (Patrón, Carmelo, and Hybrid DRW 7742), widely cultivated commercial varieties in the Marga valley, were also included in the study (Table 1).

Table 1 Information on the accessions evaluated in this study.
2.2 Field evaluations
Twenty-four tomato accessions were used in the morphological characterization (Table 1). An open field essay was established during the season 2016–2017 at La Platina Regional Research Center of the Instituto de Investigaciones Agropecuarias, Santiago, Region Metropolitana, Chile (33°34’20.20”S, 70°37’31.22”O, 620 m.a.s.l.). The environmental conditions and the soil characteristics of the evaluation site are shown in Supplementary Table 1. The experimental design was completely randomized with three blocks and a subsampling of six plants per accession per block. The seeds were sown in August, and seedlings were transplanted in the field in October 2016. The planting distance was 0.5 m within and 0.7 m between rows. The plants were individually tutored and conducted on one axis. Lateral shoots were removed regularly. Black polyethylene mulch was used for weed control. The essay was weekly fertirrigated following commercial guidelines, 0.75 kg of N and 1.3 kg of K2O were applied after transplant, continuing later with 0.52 kg of N and 1.3 kg of K2O at the flowering stage. On December 22, one preventive application of Karate Zeon_200 cc ha−1 and Neres 50% SP_1.0 kg ha−1 was made against aphids (Aulacorthum solani, Aphis craccivora, Aphis gossypii, and Myzus persicae) and tomato moth (Tuta absoluta), respectively.
Fruit harvest was made continuously throughout the season, until the end of February, 144 days after transplant, with a time between harvests of the same plant at most 10 days, reaching 16 harvest events during the season. Each cluster per plant was identified independently at harvest, measuring the number of fruits (cluster−1, plant−1, and harvest event−1) and fresh weight of the fruits (g cluster−1, g plant−1, and g harvest event−1). For the phenotypical analysis, only the total sum of these traits was considered.
2.3 Yield and phenology
At the end of the season, six traits related to yield and phenology (Supplementary Table 2) were evaluated: fresh fruit yield (Y, g/m2), the total number of fruits harvested (NFM, fruits/m2), the average fresh fruit weight (FFW, g/fruit), the number of harvested clusters per plant expressed in clusters (CLU, clusters/plant/m2), and the average number of fruits per cluster (FRU, fruit/cluster). Growing degree days were estimated with a base temperature of 10°C (Scholberg et al., 2000), being registered as the date of the harvesting of each cluster’s first fruit. The growing degree days to the first tomato harvested on the last cluster of each plant were divided by the total number of clusters to estimate the thermic requirement for a cluster to develop (CGDD).
2.4 Morphological traits
Sixty-five morphological traits were evaluated (Supplementary Table 2). The vegetative traits were taken on leaves above the third cluster with the red fruit stage, following the guidelines of IPGRI (1996). In the case of flower and inflorescence descriptors, both were taken on the third or in the fourth cluster of each plant. One fruit from the third or fourth cluster was taken from each plant for high-resolution scanning of one-half. The images were analyzed using the software Tomato Analyzer (Rodríguez et al., 2010) for the quantitative characterization of the fruit. The fruit color was measured using a CR-400 Croma Meter colorimeter (Konica Minolta Inc, Tokyo, Japan), utilizing the L, a, b color space. Descriptions and codes of the morphological traits evaluated are in Supplementary Table 2.
2.5 DNA extraction and SSR genotyping
To expand the genotype panel, eight additional accessions (*) were added, increasing the molecular characterization to 32 tomato accessions (Table 1). The total genomic DNA was extracted from the young leaves of each plant. Four to 24 individuals per accession and commercial hybrids were analyzed (Table 1). The DNA was extracted following a modified CTAB protocol as described by Barra et al. (2012). DNA integrity was seen by electrophoresis in an agarose 1% gel. The purity and concentration of the DNA were calculated using a Nano-Drop (ACT Gene ASP-3700) spectrophotometer, for a posterior dilution for each sample to a final concentration of 10 ng μl. A set of 15 simple sequence repeat (SSR) markers widely used in tomato (Suliman-Pollatschek et al., 2002; He et al., 2003; Benor et al., 2008; Caramante et al., 2009; Albrecht et al., 2010) was selected according to the following criteria: (i) one marker per chromosome; (ii) amplification conditions, and (iii) a high level of polymorphism. Amplifications were performed using two methods: direct labeling and M13(-21) tailed protocol (Schuelke, 2000). In the first method, forward primers were labeled with any of the following fluorochromes: 6-FAM (Macrogen Inc., Seoul, Korea), NED, PET, or VIC (Applied Biosystems™, Foster City, USA). Polymerase chain reaction conditions were 20 ng of the DNA template, 200 μM of each dNTP, 0.1 μM of each primer, 1X Taq polymerase buffer, 1.5 to 3.5 mM MgCl2, and 0.25 U of DNA Taq polymerase (5 U μl−1, GoTaq® G2 Flexi, Promega, Madison, USA). In the second method, the forward primer was modified with an M13 (-21) tail at its 5´ end and a third fluorescent labeled M13 primer was used in the PCR reaction. PCR mix contained the following: 30 ng of the DNA template, 150 μM of each dNTP, 0.025 μM of M13-forward primer, 0.1 μM of reverse primer, 0.1 μM of fluorescent-labeled M13 (-21) primer, 1X Taq polymerase buffer, 2.0 mM MgCl2, and 0.25 U of DNA Taq polymerase (5 U μl−1, GoTaq® G2 Flexi, Promega, Madison, USA). The reaction was carried out in a Veriti Applied Biosystems Thermocycler (Thermofisher Scientific®). The SSR characteristics and PCR amplification conditions are shown in Table 2.
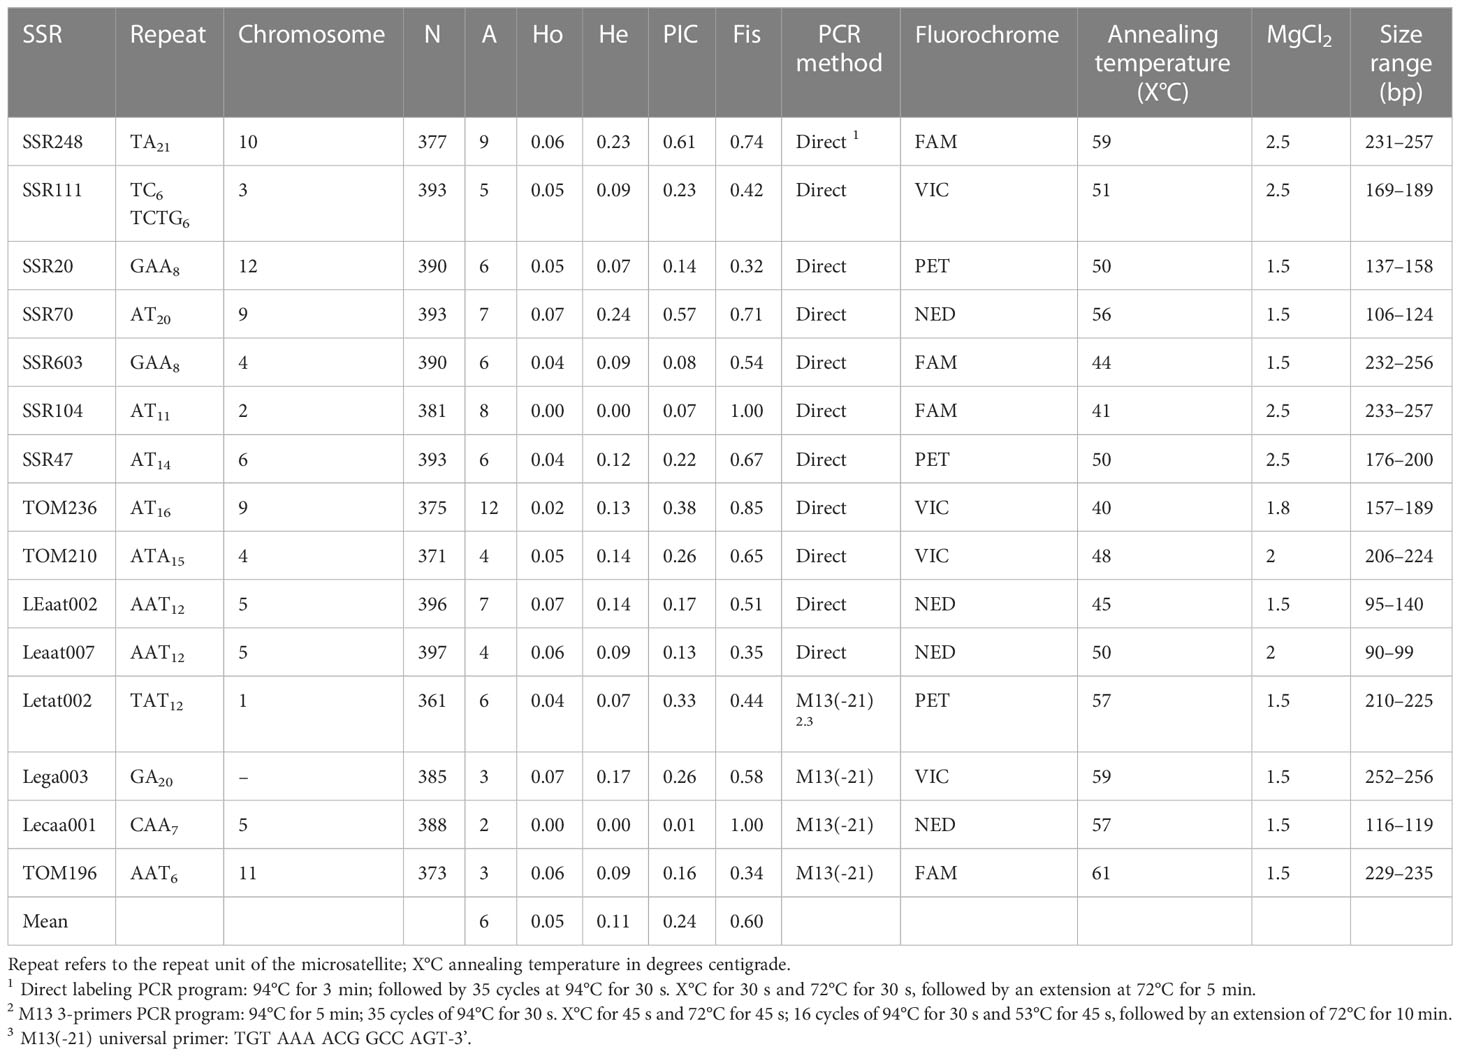
Table 2 Characteristics and amplification conditions of the microsatellites used in this study.
Visualization was done by capillary electrophoresis on an ABI 3130xl Prism Genetic Analyzer with NimaPOP TM-7 polymer (Nimagen, Nijmegen, The Netherlands), as follows: 2 μl of a pool plex of five PCR products was mixed with 10 μl of HiDi formamide (Applied Biosystems™, Foster City, USA) and 0.2 μl of GeneScan 500LIZ size standard (Applied Biosystems™, Foster City, USA). Allele calling was performed using ABI Prism GeneMapper software v4.0 and reviewed manually. Allele binning was done automatically with the TANDEM program, which transforms allele sizes before rounding to compensate for allelic drift and compression at large fragment sizes (Matschiner and Salzburger, 2009). To detect allele dropout errors, biological and/or technical replicates were performed at DNA extraction, PCR product amplification, and allele calling levels.
2.6 Statistical analysis
2.6.1 Morphological variability
Generalized linear mixed models were estimated for the 72 variables of agronomic importance. Following the guidelines of Bolker et al. (2009), the variables were evaluated for a design of three blocks with a subsampling of 6. The blocking effect and the subsampling effect of each plot nested in the block were taken as aleatory effects, while the accession effect was taken as a fixed effect. The linear mixed models were based on the form:
where y is the vector of observations; β and u are vectors of fixed and random effects, respectively; X and Z are the associated design matrices; and ϵ is a vector of random residual errors. The random effects are assumed to be independently distributed as u ~ MVN(0,B) and ϵ ~ MVN(0,R), where MVN(µ,V) denotes the multivariate normal distribution with mean vector µ and variance–covariance matrix V. According to Bolker et al. (2009), a distribution and a link function were selected, evaluating a Gamma and a Gaussian distribution for continuous variables and a Poisson distribution for discrete variables. The residuals were evaluated graphically for normality. The models were estimated using the R package lme4 (Bates et al., 2018) using a Laplace approximation, selecting the model with the most positive maximum likelihood, with residuals normally distributed and with variance homoscedasticity. A Wald chi-square test was made a posteriori in the selected models using the R package car (Fox et al., 2012) to evaluate the significance of the accession as a fixed effect. For those variables in which the accession has a significant effect, Tukey multiple comparison tests were carried out over the generalized mixed linear models using the R package lsmeans (Lenth and Lenth, 2018). The morphological data were scaled and analyzed using PAST3 software (Hammer et al., 2001). Cluster analyses were made with different combinations of clustering methods and distances, selecting the Euclidean distance with UPGMA clustering due to its higher cophenetic correlation. Statistical significance of the obtained clusters and subclusters was validated with a bootstrap of 10,000. The clusters sustained by nodes with a high bootstrap (≥70) were reclassified for validation using a discriminant analysis, which was made with the software Infogen (Balzarini et al., 2006).
2.6.2 Molecular diversity
Observed heterozygosity (Ho), polymorphic information content (PIC), the number of alleles (A), and expected heterozygosity (He) were estimated. The genetic parameters were calculated by the software Cervus (Kalinowski et al., 2007). The F statistics (Wright, 1949) as fixation index (FST), endogamy coefficient (FIS), and selfing rate (s), were calculated as:
Given the calculated FIS for the general population, the selfing rate (s) was estimated by:
The FST was calculated to assess a possible genetic structure to analyze using Arlequin (Excoffier and Lischer, 2010), and the p-values were estimated with a bootstrap of 99,999. Nei’s genetic distance and allelic frequency by accessions were estimated using GenAlex (Peakall and Smouse, 2006).
While most of the species of genus Lycopersicon are allogamous, the cultivated tomato flower’s structure promotes self-pollination, which can be obligate or facultative depending on the variety (Chen and Tanksley, 2004). Because stigma exertion variation was observed in the evaluated accessions, the cross-pollination was evaluated by a Spearman correlation between FIS, He, and Ho with the stigma exertion using the Python package Scipy (Oliphant, 2007). The accessions with expected heterozygosity close to 0 (≤0.005) were eliminated.
The genetic structure was evaluated using Structure 2.3.4 (Pritchard et al., 2000). The cluster numbers were inferred for a K of 1 to 32 with 10 replications by K, with a burning period of 10,000 and 100,000 Márkov chain Monte Carlo. Optimal K was estimated following the Evanno’s ΔK methodology (Evanno et al., 2005). The results were analyzed via STRUCTURE HARVESTER (Earl and vonHoldt, 2012) and plotted using STRUCTURE PLOT 2.0 (Ramasamy et al., 2014).
Three analyses of molecular variance (AMOVAs) were carried out to quantify the relative weights of the genetic variance components. The first AMOVA was done in GenAlex with 9,999 permutations. Arlequin was then run to analyze the classification in clusters made via the structure for the optimal K of 2 and 4. The membership of the accessions was considered with over 50% of belonging to the classified cluster. The F statistics of the AMOVAs for K = 2 and K = 4, and the corresponding p-values were calculated utilizing Arlequin with 99,999 permutations.
3 Results
3.1 Phenotype
A phenotypic dendrogram made with the totality of the morphological descriptors is presented in Figure 1, with a high cophenetic correlation (0.91). Three main clusters were observed, with most of the accessions grouped in cluster I. This cluster presents four subdivisions: (SLY49), (a) clustering with 4 accessions, (b) clustering with 14 accessions, and (SLY152). Accession SLY49, collected in 1938, is the most diverse among the phenotyped accessions. It has high variability in the number of leaflets (Figures 2F, G) and fruit morphotypes, all of them morphologically characterized by a high number of clusters (CLU), high number of fruits (NFM), and low fresh fruit weight (FFW). Subcluster a has well-sustained nodes, grouping materials grown in 1938 from the far north of Chile (Antofagasta, Chile and Tacna, Peru) and the south of Chile (Temuco, Chile), although the accession collected in Temuco (SLY47) was reported at the time of collection as grown in Talca. Inside the b subdivision, two well-sustained nodes give rise to further subdivisions, 1 and 2. Subcluster b1 clustered the accessions grown to 1938 in Limache (SLY30) and Arica (SLY39). SLY50 appears closer to this subcluster, collected in 1938 along with SLY30 from a garden in Limache. A distinguishable leaf morphotype of a reduced number of leaflets and a large terminal leaflet is a common phenotype for all the plants in subcluster b1. On the other subdivision of b, subcluster b2 is composed of the two Marmande tomatoes (SLY129 and SLY83), plus the totality of the denominated Limachino tomatoes collected between 1960 and 2015. The morphotypes of Limachino and Marmande appear close but distinguishable among them by flower morphology. The Marmande type has the most inserted stigmas and significantly differs from the Limachino type SLY74 (Figure 2C).
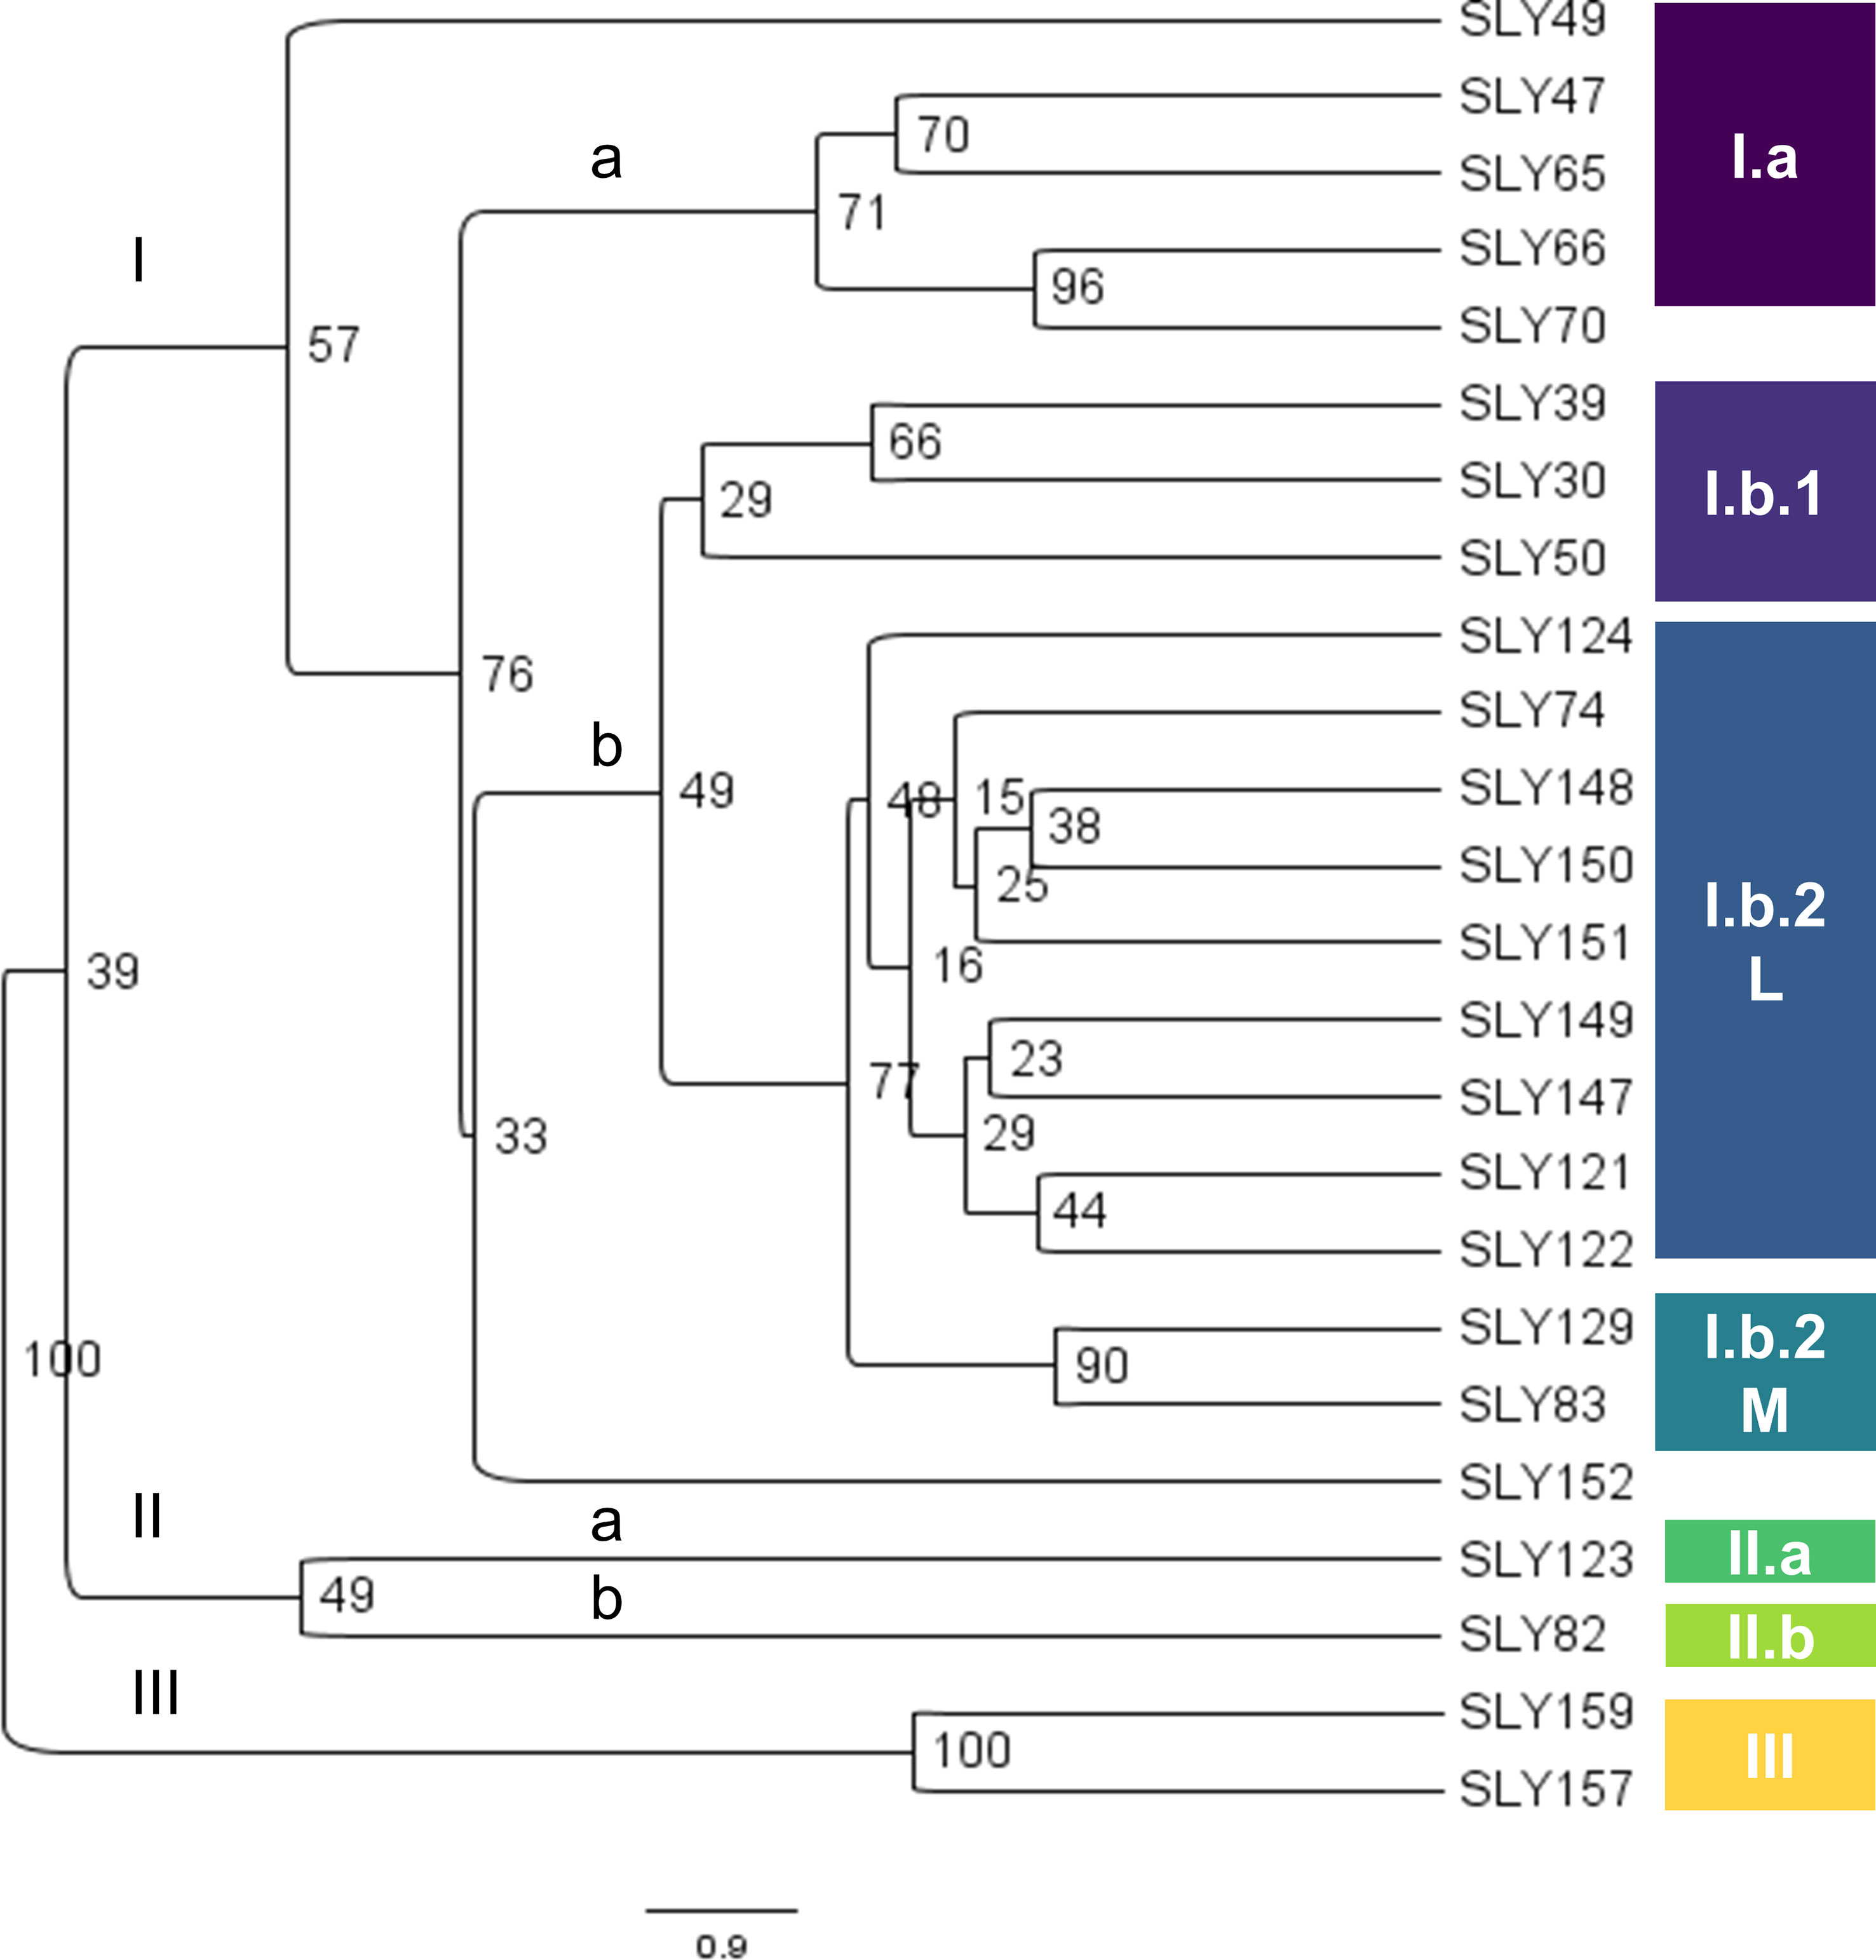
Figure 1 Phenotypic dendrogram of evaluated tomato accessions by Euclidean distance and the UPGMA grouping method.
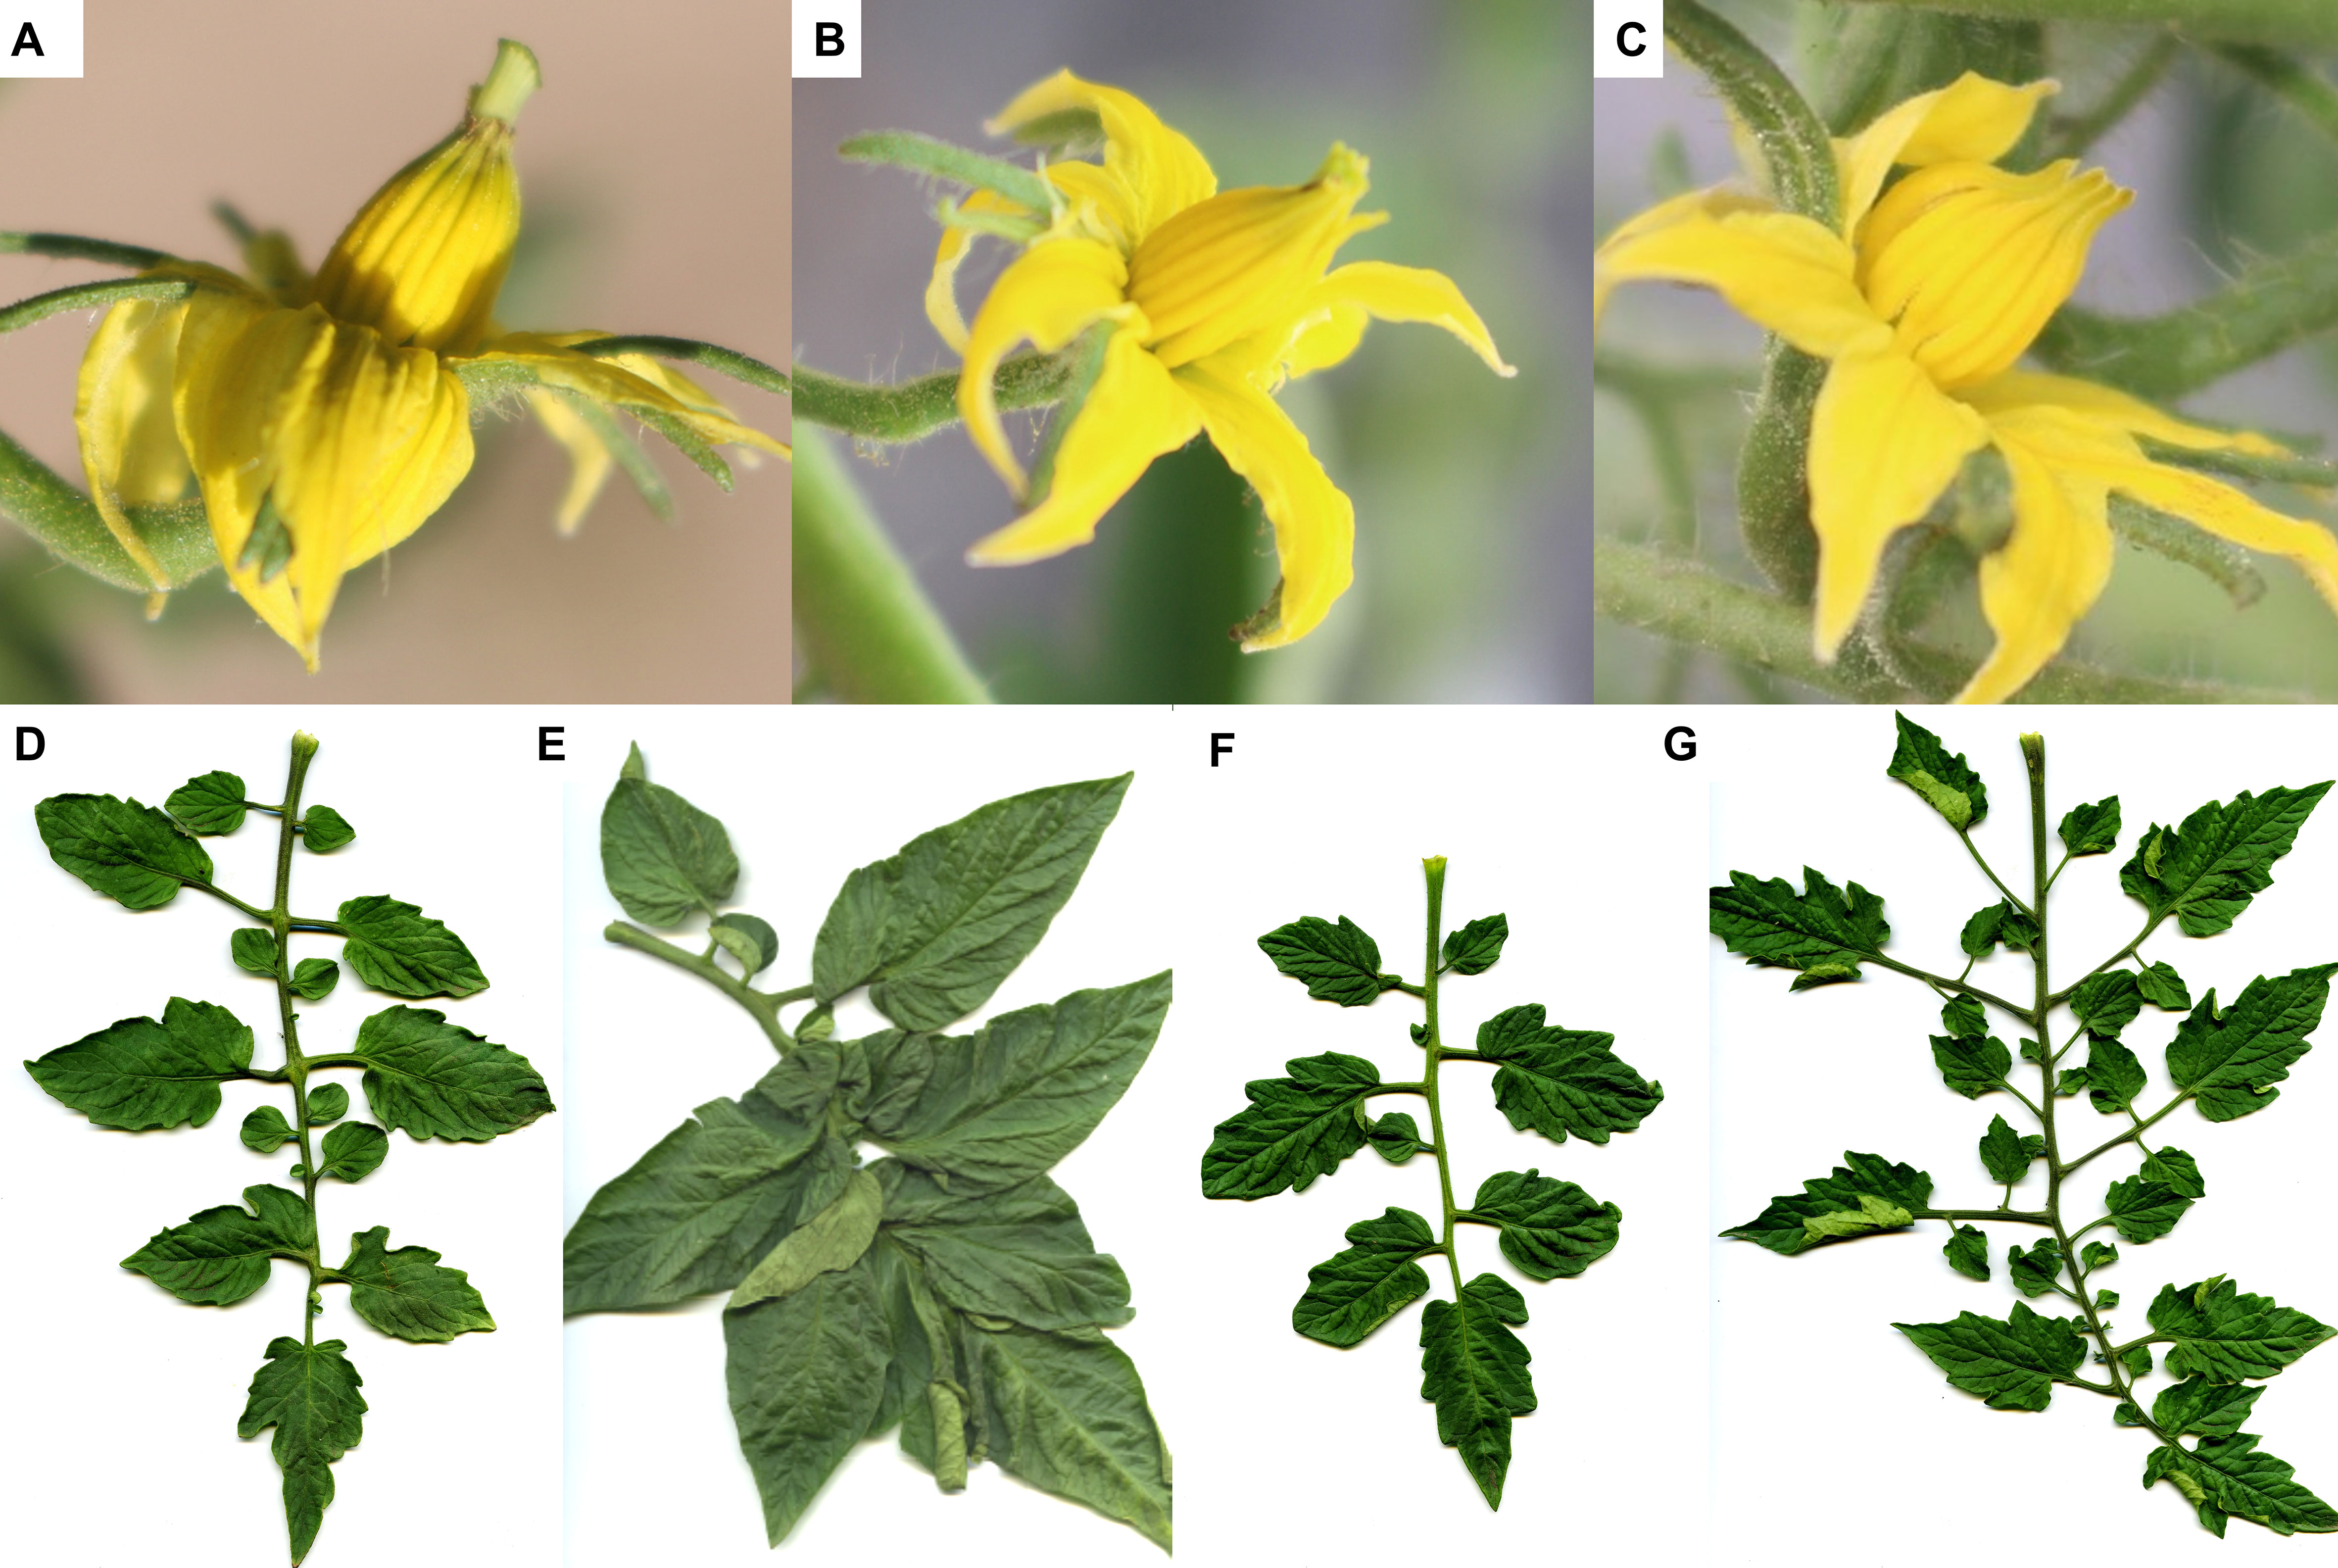
Figure 2 Morphological stigma and leaf diversity. Levels of flower stigma exertion are shown from A to C (A) SLY159 with a highly exerted stigma (0.4 mm); (B) SLY123 with an exerted stigma (0.1 mm); (C) SLY74 without an exerted stigma (−0.8 mm). Leaf morphotypes are shown from D to G (D) SLY66 plant with a normal leaf phenotype (seven leaflets); (E) SLY66 plant with a reduced number of leaflet phenotype (five leaflets); (F) SLY49 plant with a reduced number of secondary leaflet phenotype; (G) SLY49 plant with a high number of secondary leaflet phenotype.
Cluster II grouped two distant genetic accessions: (a) the American type Marglobe (SLY82) and (b) Limachino Italiano (SLY123). The morphology of the fruits supports the lack of node consistency: Marglobe is a uniform commercial type with red, round, smooth tomatoes, while Limachino Italiano is a mixed population of beefsteak pear-shaped tomatoes and medium caliber Marmande-type tomatoes (Supplementary Figure 2). Cluster III included SLY157 and SLY159, two accessions of pink beefsteak tomatoes collected in south-central Chile (Talca and Chillan), characterized by fruits of more than 500 g but with a low number of fruits per plant (Supplementary Figure 2).
The dendrogram nodes (Figure 1) were validated using a linear discriminant analysis (Supplementary Table 3), yielding a high classification score (92.7%) inside the defined clusters. The accession SLY123 had the most significant error (27.3%), which was expected as the accession seems to be composed of a seed mixture. Limachino (Ib2L) and Marmande (Ib2M) were evaluated for distinctiveness, resulting in a high accuracy rate when distinguishing between the two clusters (Supplementary Table 3). The classification error was 3.8% for the Limachino (L) cluster and 10% for the Marmande (M) cluster. Individual accessions were also distinguishable among the accessions panel, with classification errors of 0% for SLY152 and Marglobe (IIb).
The PCA allowed identifying the descriptors that discriminate between the accessions (Figure 3), with 45% of the observed variability explained by the two main components. The variables with higher correlation with principal component 1 (Supplementary Table 4) were the fruit ellipse area relations (EAI), fruit ellipse relation to height (ECD), internal versus external fruit rectangle relation (RET), the relation between fruit dimensions (STR), fruit perimeter (PER), fruit width at mid-height (WMH), maximum height in curvature (MXW), and the length of the internode (LEN). In contrast, the phenology of the plant (CGDD) correlated negatively with principal component 1. Principal component 2 correlated positively to yield components WG and FFW, and negatively to NFM, FRU, NSF, ECC, and RFC. At the same time, the fruit eccentricity descriptors (EAI, ECD, and ECC) presented a relevant weight in both principal components. The accessions with a more distinctive phenotype were the pink beefsteak tomatoes collected in 2015 (SLY157 and SLY159) (Figure 3). The accessions more closely related to the reference Limachino (SLY74) were the ones grown in Limache from different years: 2015 (SLY121), 1980 (SLY150), and 1930 (SLY30). Most of the seeds collected from Limache in 2015 (SLY122 and SLY123) are close to SLY124 and they are distant from the tomatoes collected in 1938.
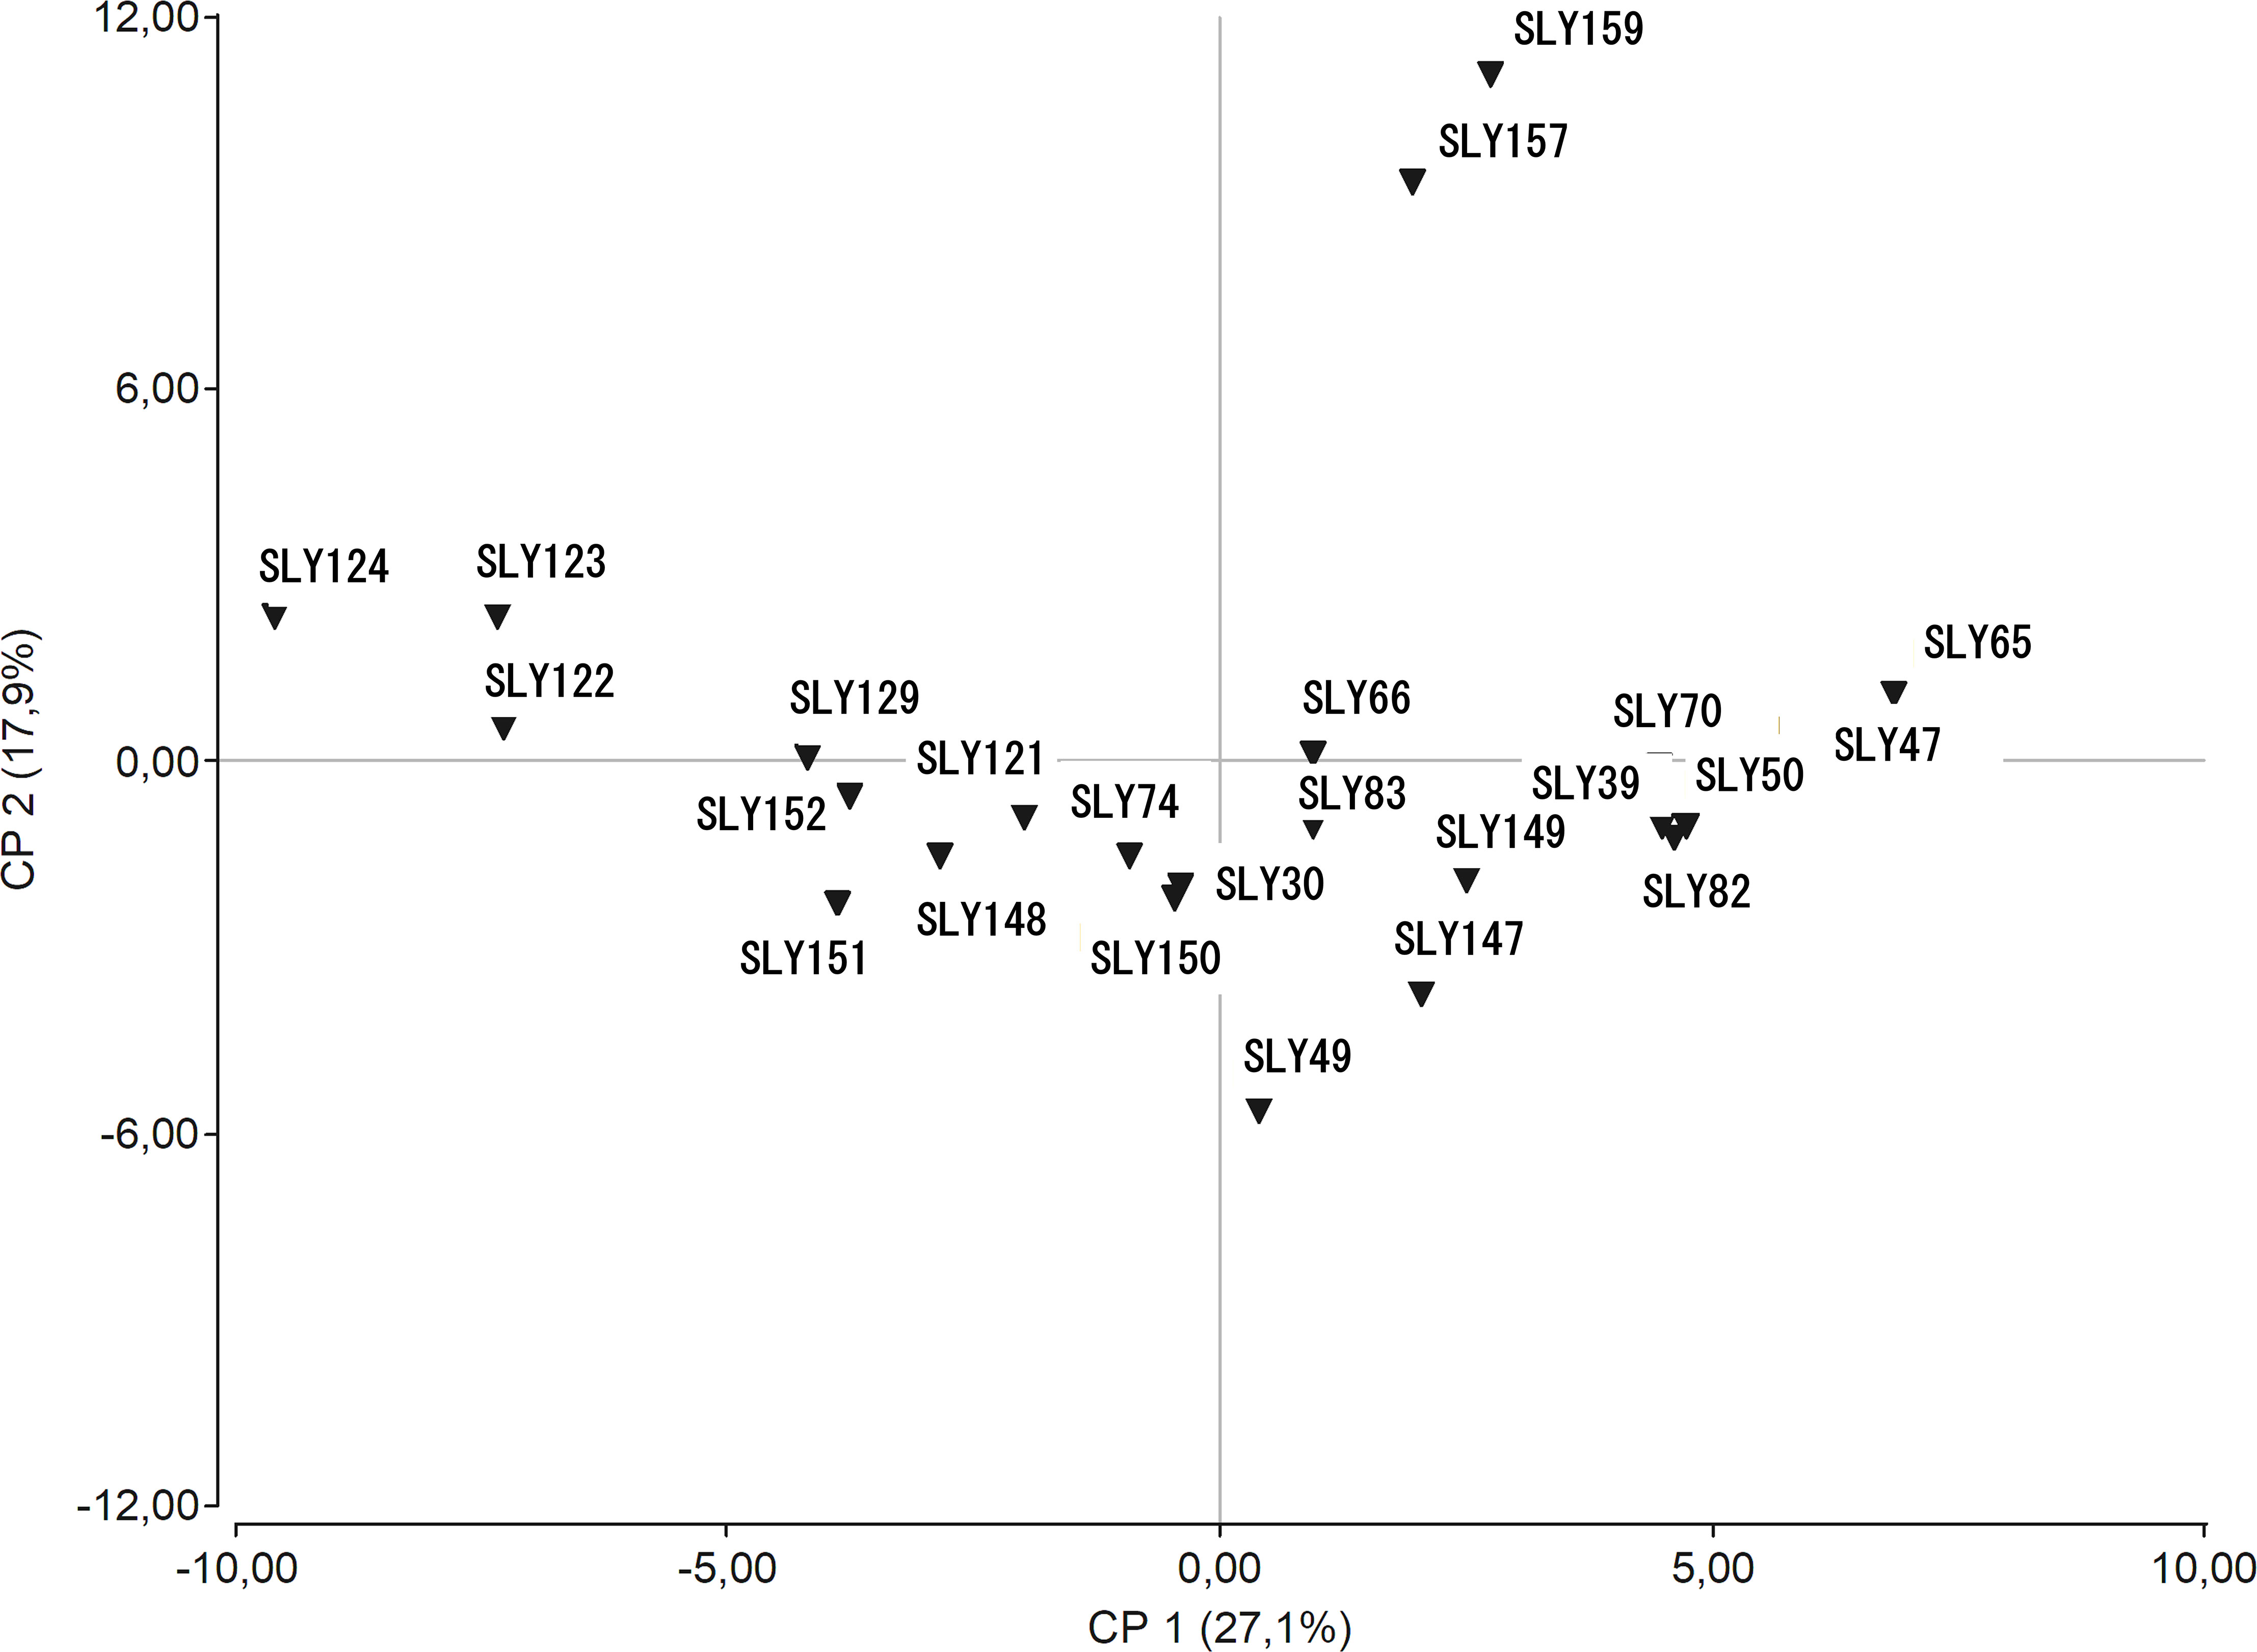
Figure 3 Principal components analysis for the tomato accessions panel.
3.2 Genotype
Fifteen SSRs were used to screen a set of 397 individuals, representing 32 diverse tomato cultivars (29 landraces and three commercial hybrids). All markers were polymorphic, and 88 alleles were detected (Table 2). Mean PIC for all the alleles was 0.24. The loci SSR70 (PIC = 0.57) and SSR248 (PIC = 0.61) presented a higher diversity, while LEcaa001 showed the lowest diversity in terms of allele number (2) with a PIC of 0.01. Markers with a locus on chromosome 9 had differential PICs, independently of the number of alleles observed (A). An association pattern was observed between He, Ho, FIS, and flower morphology (stigma-height dimorphism; Figure 4). Plants with more exerted stigmas or longistila (Figure 2A) have higher Ho (r = 0.61; p-value = 0.0030) and He (r = 0.52; p-value = 0.0154), and a negative FIS (r = −0.46; p-value = 0.0340), indicating excess heterozygosity. This association between exerted stigmas and heterozygosity is attributable to higher rates of cross-pollination. However, in accessions with slight or without stigma exposure or brevistila, the components of the endogamy coefficient of Wright showed a high value of FIS (0.76) and a low value of FST (0.39), thus being associated mainly with autogamous reproduction in tomatoes (Figures 2B, C), supported by an endogamy coefficient (FIT) of 0.86 (Table 3).
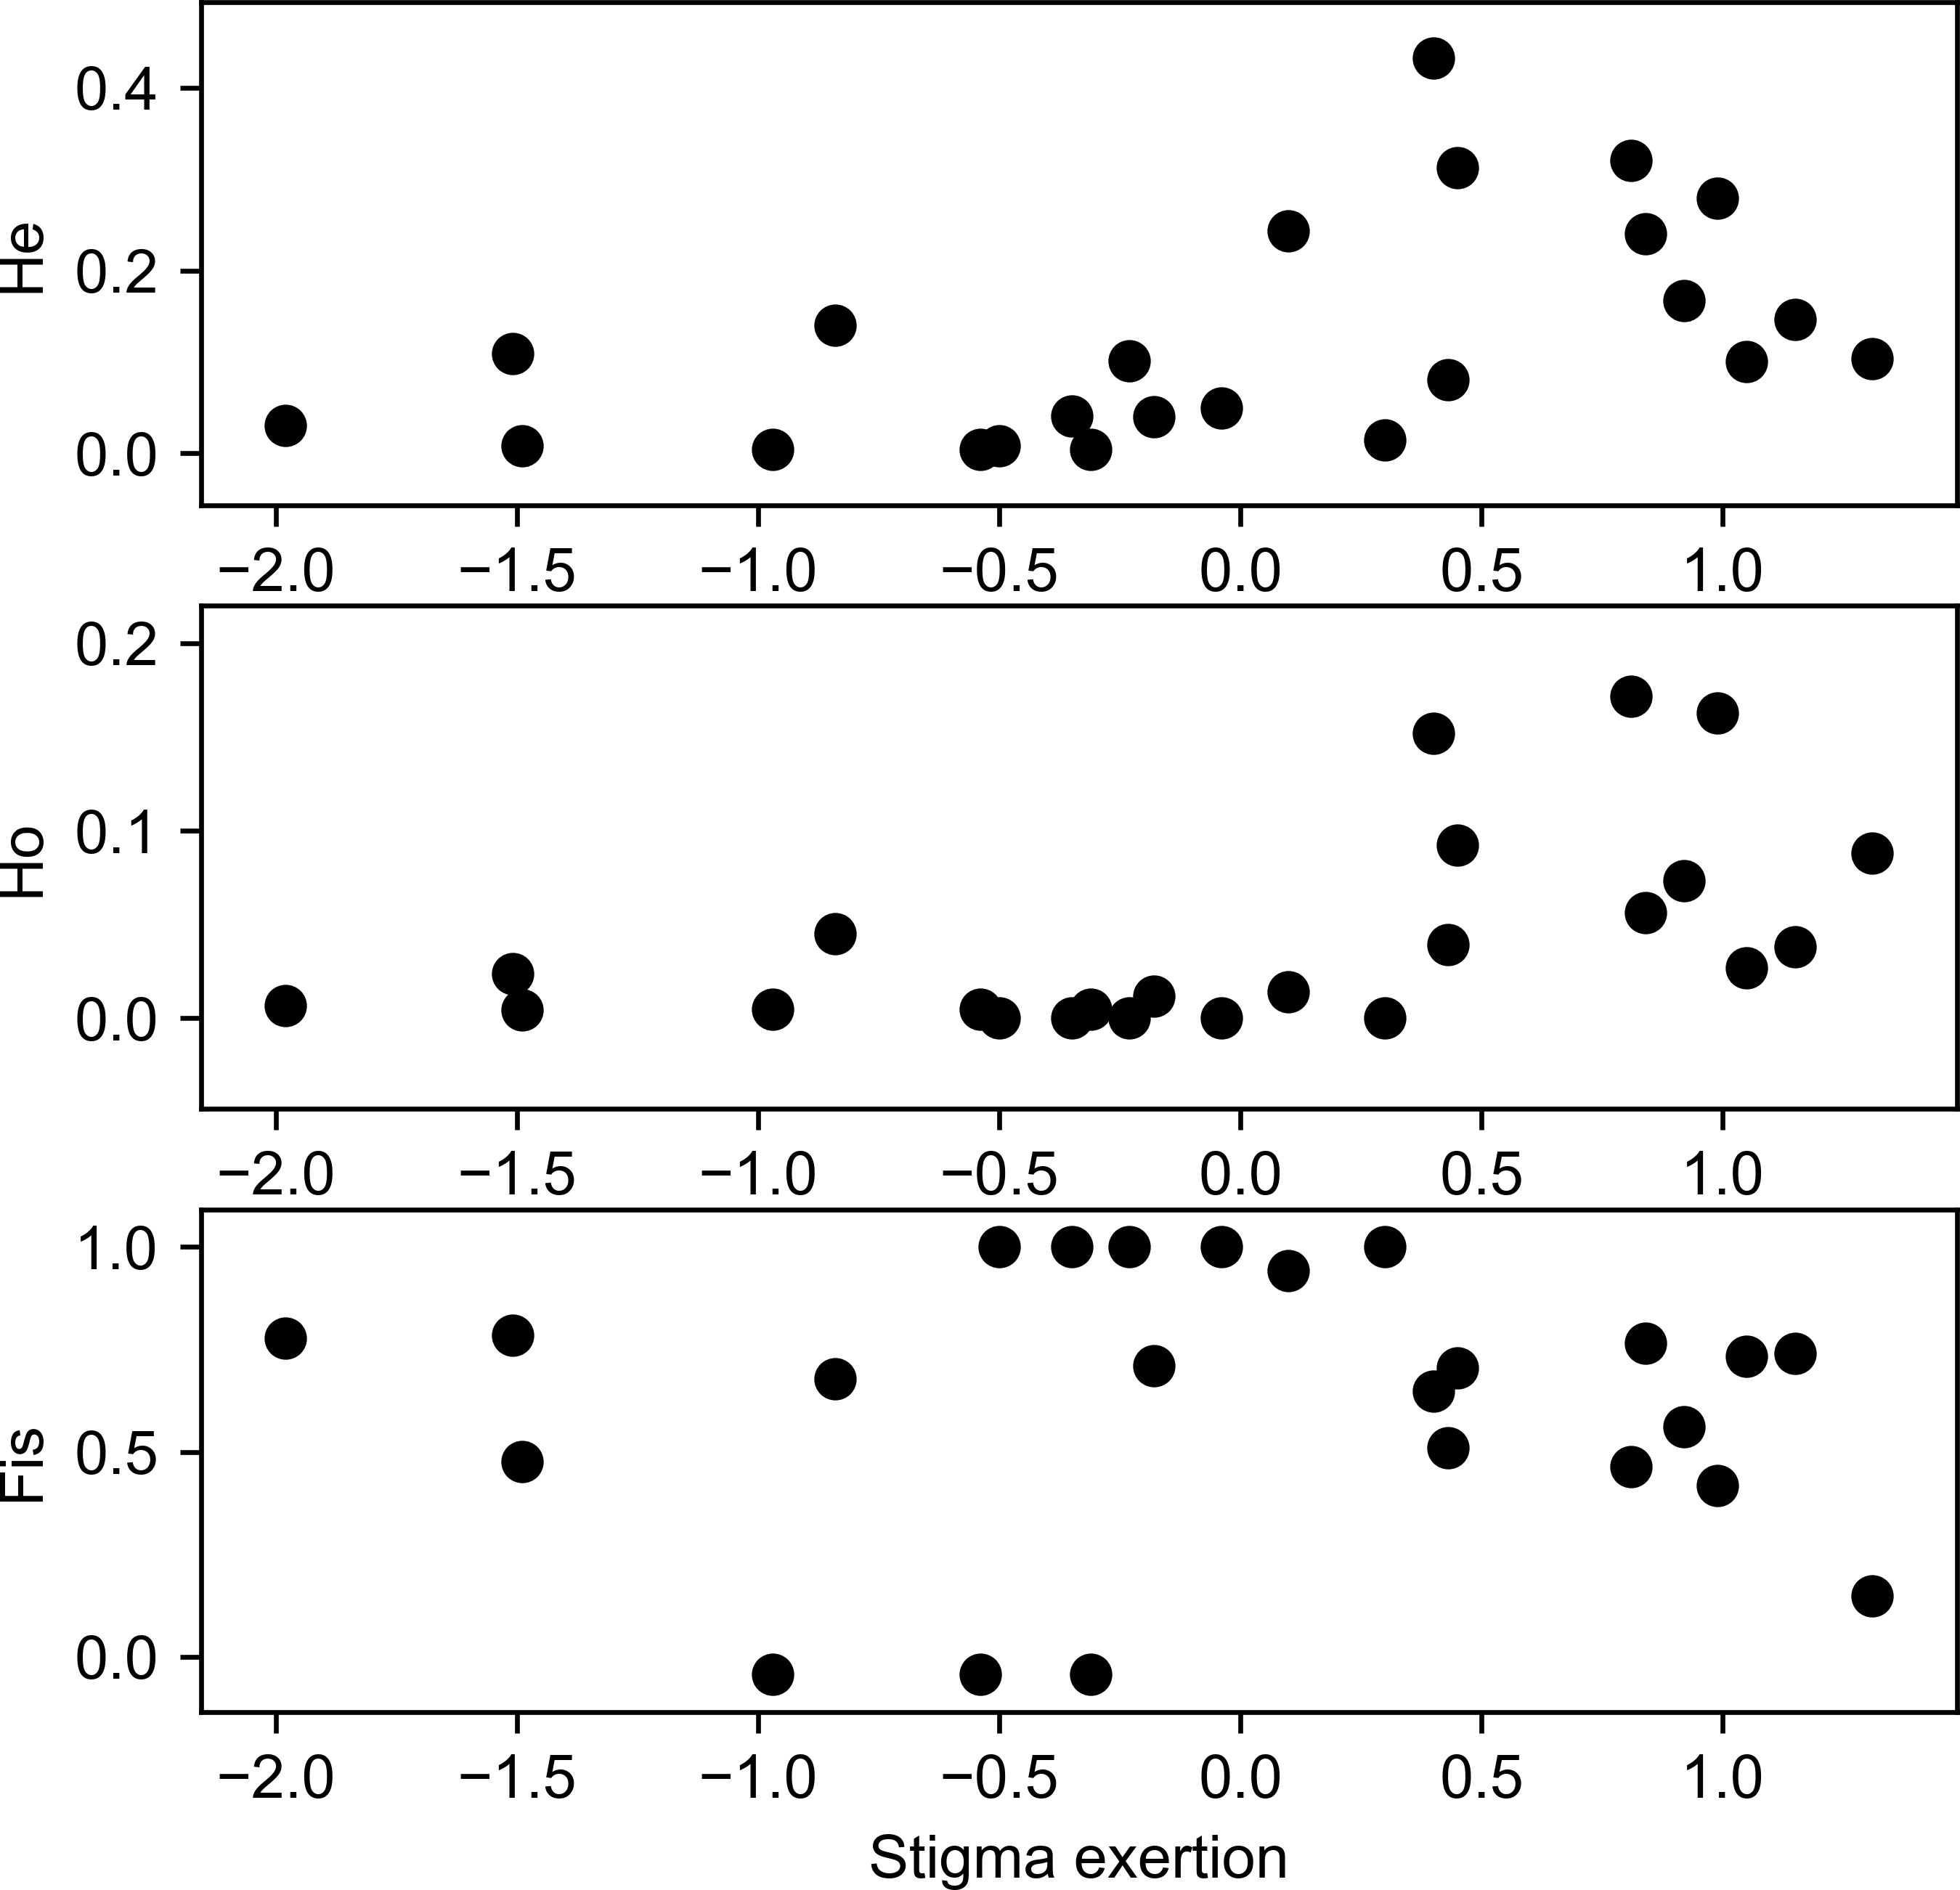
Figure 4 Association of the stigma exertion with molecular diversity indexes.
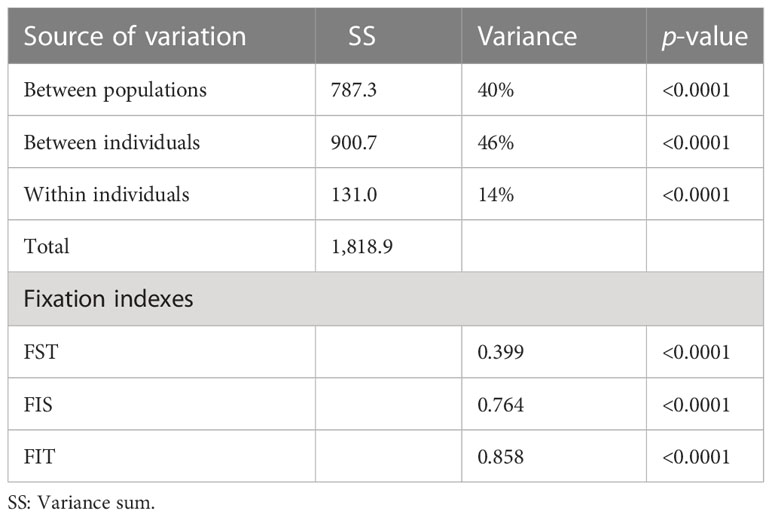
Table 3 Molecular analysis of variance and endogamy coefficients for a divided population.
The decomposition of the genetic variance (Table 3) indicates a high genetic differentiation between accessions (40%) and within individuals inside the populations (46%), which is high for a population of endogamous species. This is consistent with a mainly endogamic reproduction with variable rates of cross-pollination and further evidenced by the low percentage of molecular variance within individuals (14%).
The private alleles in some accession (Table 4) occur in almost all the genetic loci evaluated, existing alleles that are underscored because of their high frequency. The high-frequency private alleles distinguished SLY147, Hybrid DRW 7742 (H), SLY159, SLY157, SLY129, SLY49, and SLY74. The microsatellite SSR70 presented two private alleles for the reference Limachino (SLY74), allowing fingerprinting accession. The accession SLY49 had the highest number of private alleles and the highest frequencies for those alleles.
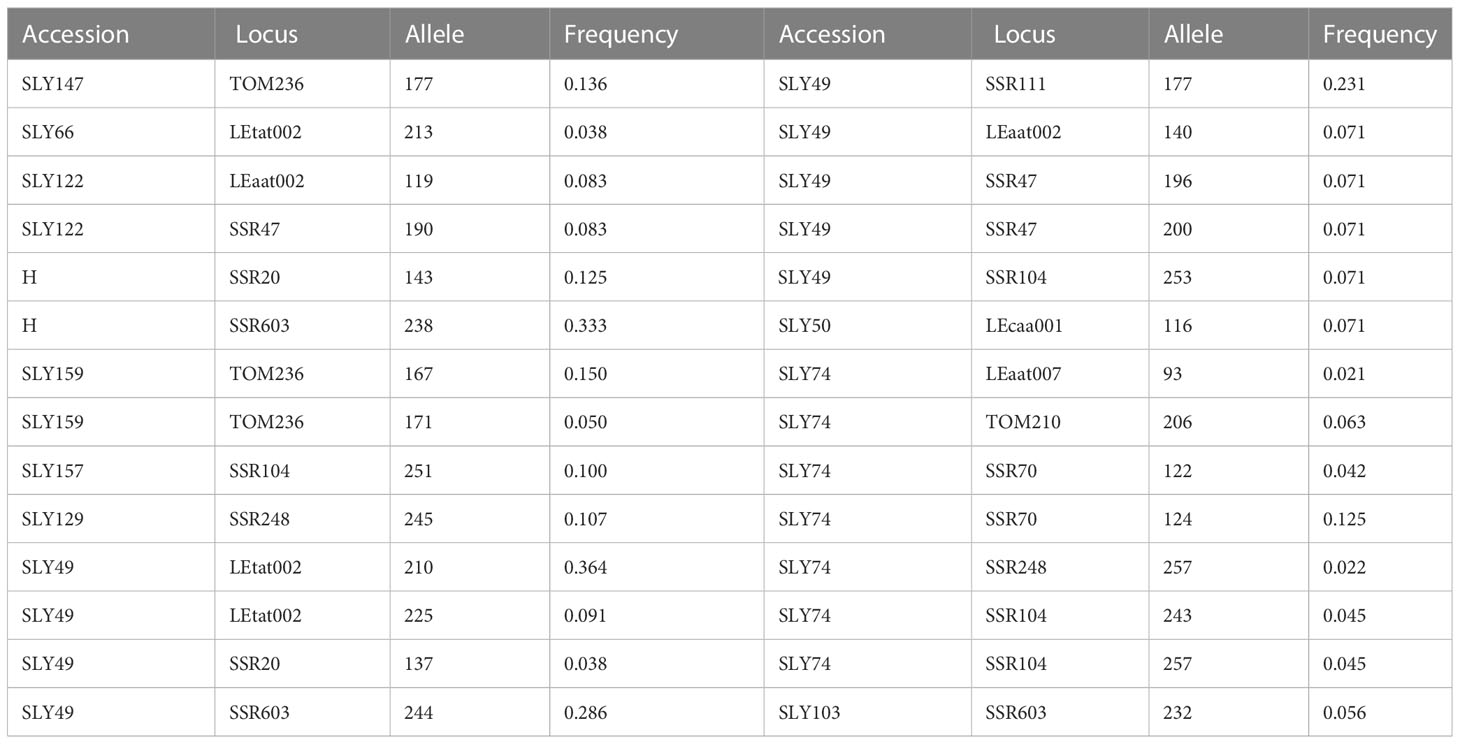
Table 4 Private alleles per accession.
The FST by pairs of populations showed groups with a significant degree of differentiation (Figure 5; p-value ≤ 0.05). The accessions SLY147, SLY148, SLY149, SLY150, and SLY151, collected in Limache in 1980, had no differentiation between them, but also with SLY122 and Marmande accessions (SLY83 and SLY129). All these accessions shared a genetic pattern (Supplementary Figure 3). The San Marzano landraces showed diverse degrees of genetic differentiation between them, with the accession collected in Argentina (SLY103) being closer to the San Marzano collected in Italy (SLY104) than the San Marzano collected in Spain (SLY102). Pink tomato accessions from the south of Chile (SLY157 and SLY159) had a low FST between them, but both have high FST, with the third pink tomato from the central valley (SLY158) indicating differences between them. Among the Limachino accessions collected in 2015, two (SLY121 and SLY122) showed little differentiation from the Limachino type collected in 1960 (SLY74). Supplementary Figure 3 shows that the reference Limachino is a population with individuals from two predominate genotypes; when comparing the genetic patterns of each population, SLY121 is observed as similar to Marmande, but some individuals share the Limachino (SLY74) genetic pattern. SLY121 is the closest accession to the reference Limachino (Figure 5).
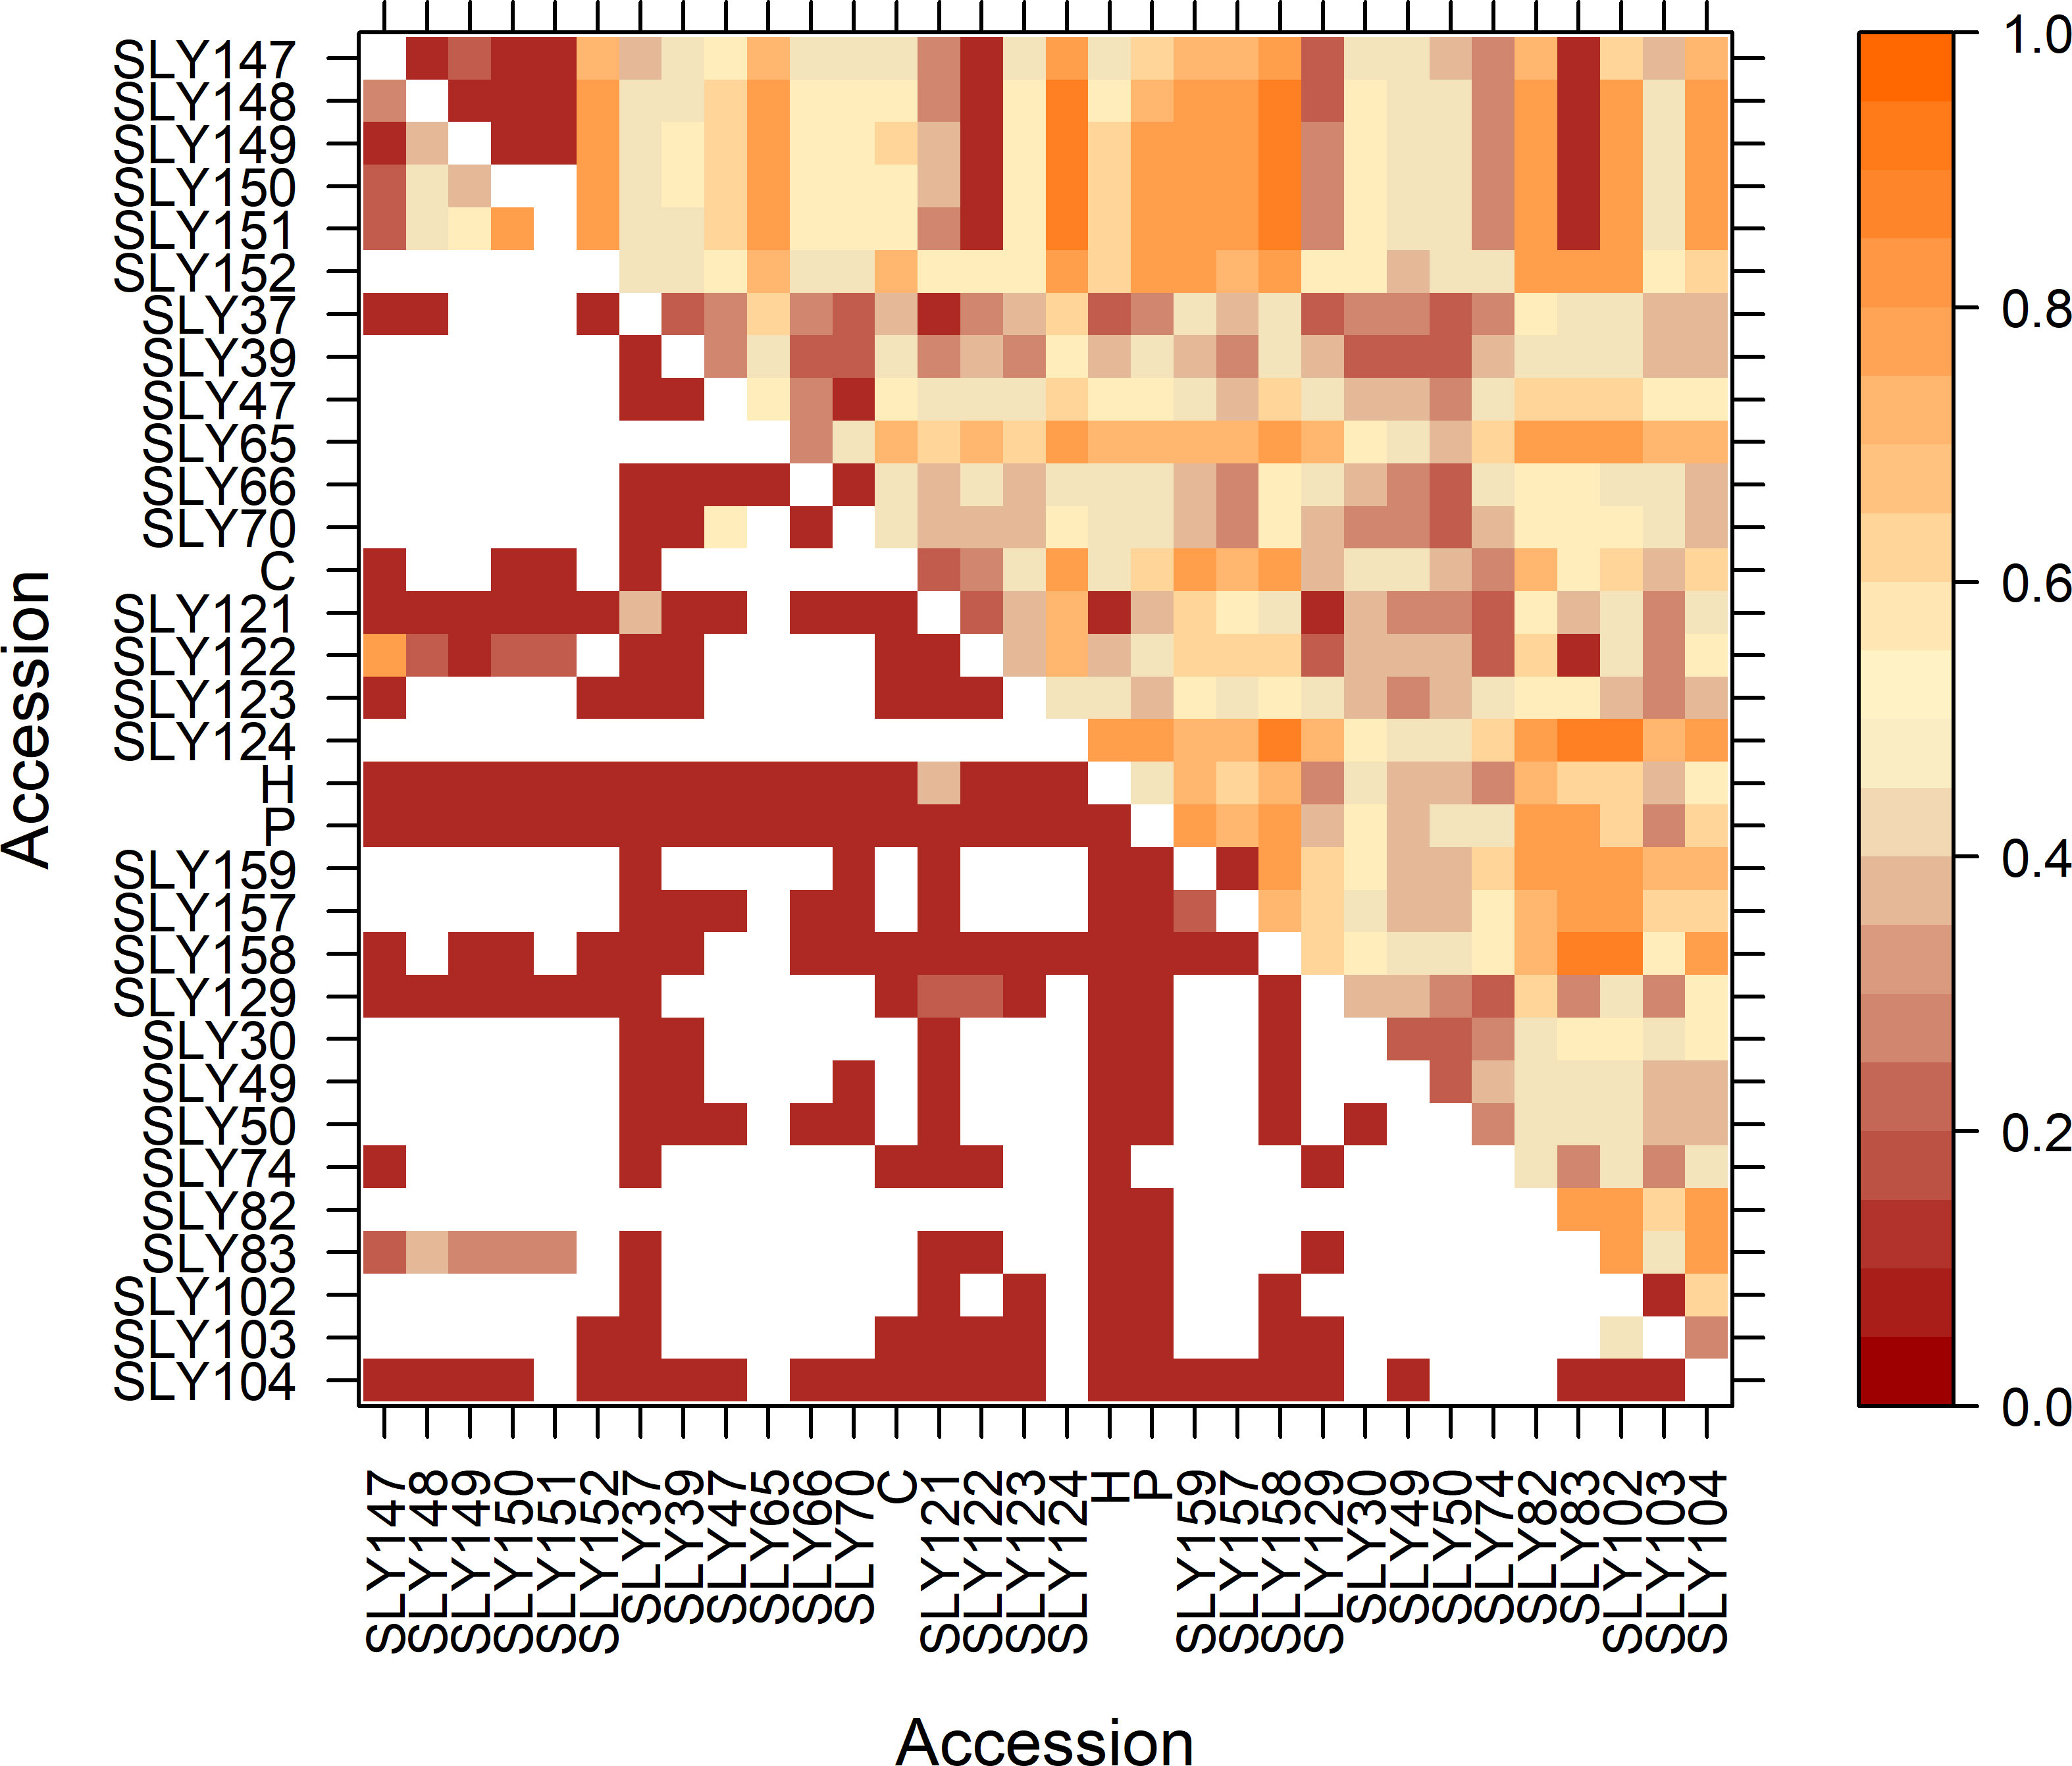
Figure 5 FST between pairs in the upper half triangle and p-value in the lower half for the evaluated accessions via 15 SSR. In white p-values ≤ 0.0001.
The UPGMA clustering using Nei’s genetic distance (Figure 6) reflects the genetic structure observed in the FST by pairs of accessions. The highest genetic distance was between SLY65 and the commercial variety Patrón (P), with a value of 0.643. The dendrogram allows us to infer the hypothesis posed in this work, as three clusters are generated: cluster I, composed of European materials Marmande (French) and San Marzano (Italian), the USA type Marglobe, commercial materials such as Patrón (Syngenta), Hybrid DRW 7742 (Seminis), Carmelo (French), Limachinos collected in 1980, the reference Limachino (SLY74), and accessions SLY122 (Marmande-type) and SLY121 (Limachino-type), both collected in 2015; cluster II, which clusters the Chilean landraces grown from Tacna to Talca to 1938 (except SLY37), with two tomatoes grown in Limache to 2015 (SLY123 and SLY124), plus two pink tomatoes grown to 2015 in San Clemente, Talca (SLY157) and San Carlos, Chillán (SLY159); and cluster III, which is represented by one accession (SLY65) grown in Antofagasta to 1938. Clusters II and III clustered accessions collected in Chile in 1938, indicating that, in Chile, tomatoes different from commercial types have been cultivated from at least 1938 to the present, differentiated on phenotype and genotype.
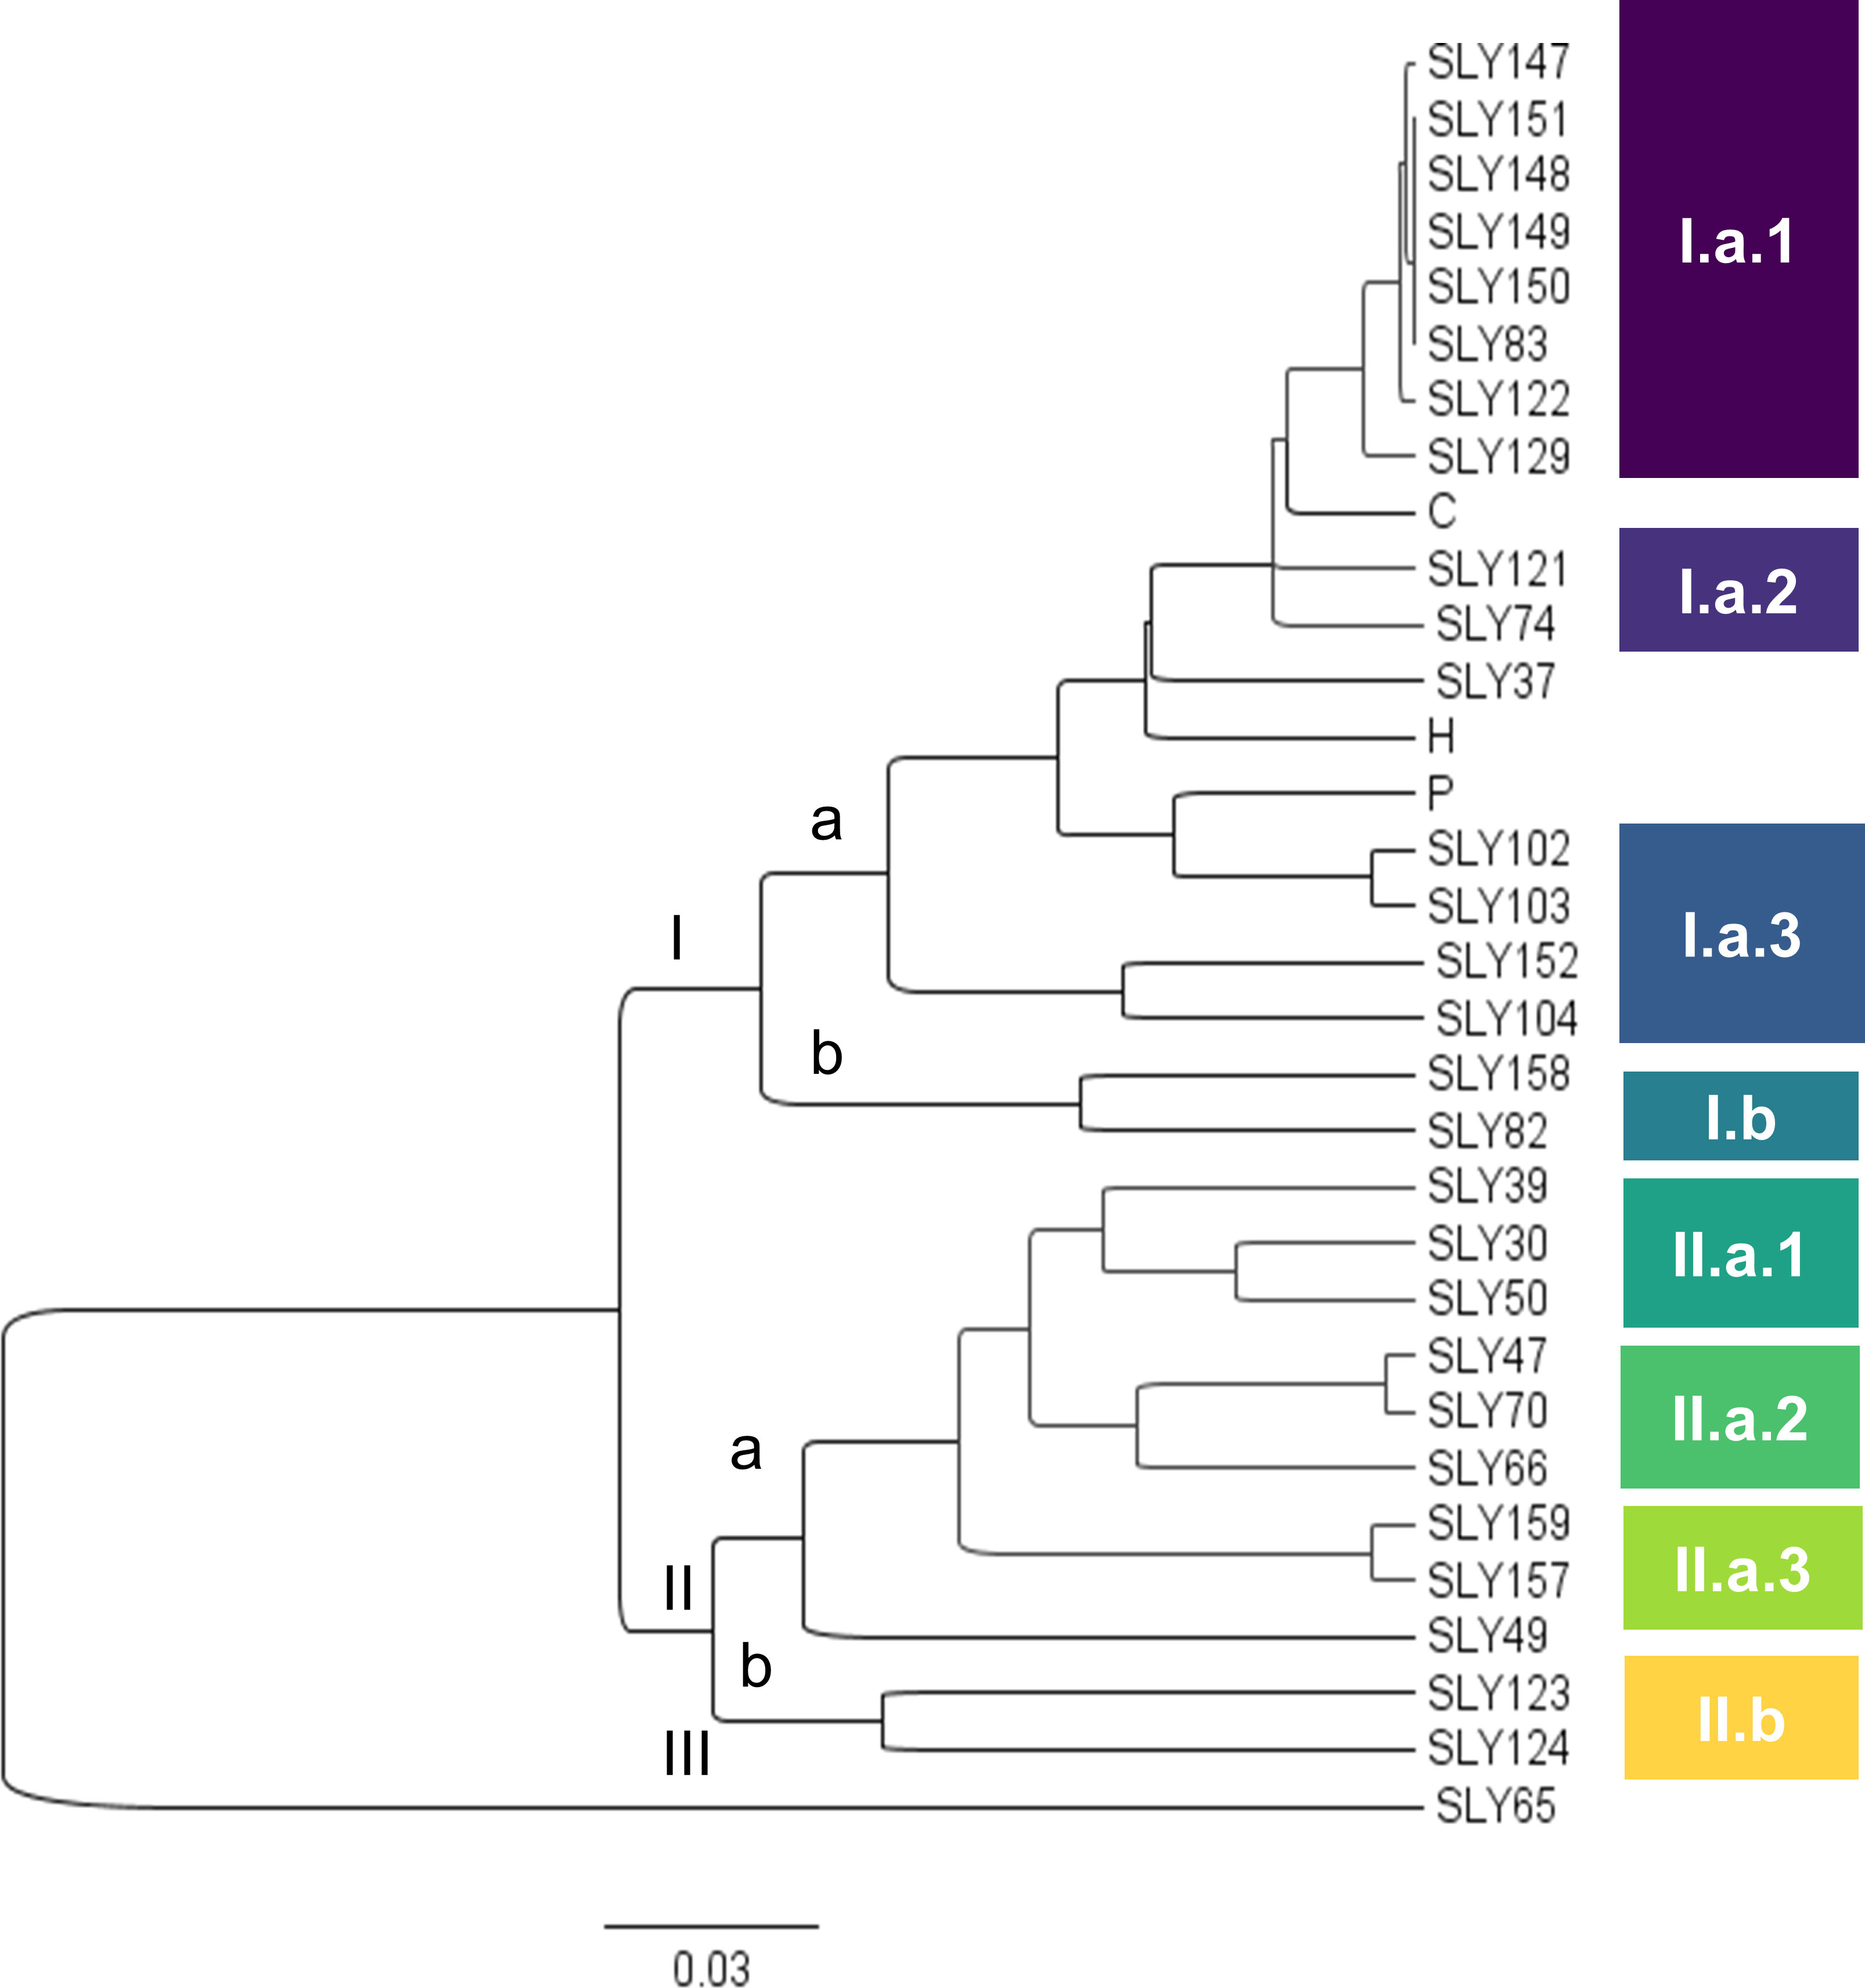
Figure 6 Nei’s distance genotypic dendrogram with UPGMA clustering.
The classification made by structure for the optimal K was analyzed for the first peak of ΔK with K = 2, showing a division between Chilean accessions (Blue) and the accessions from Europe (Yellow) (Figure 7). Marglobe (SLY82) showed Q values of 0.471 (blue) and 0.529 (yellow). Similarly, SLY123 showed Q values of 0.372 (blue) and 0.628 (yellow). Both accessions were collected in the territory of Limache in 2015, representing an admixtured group of individuals.
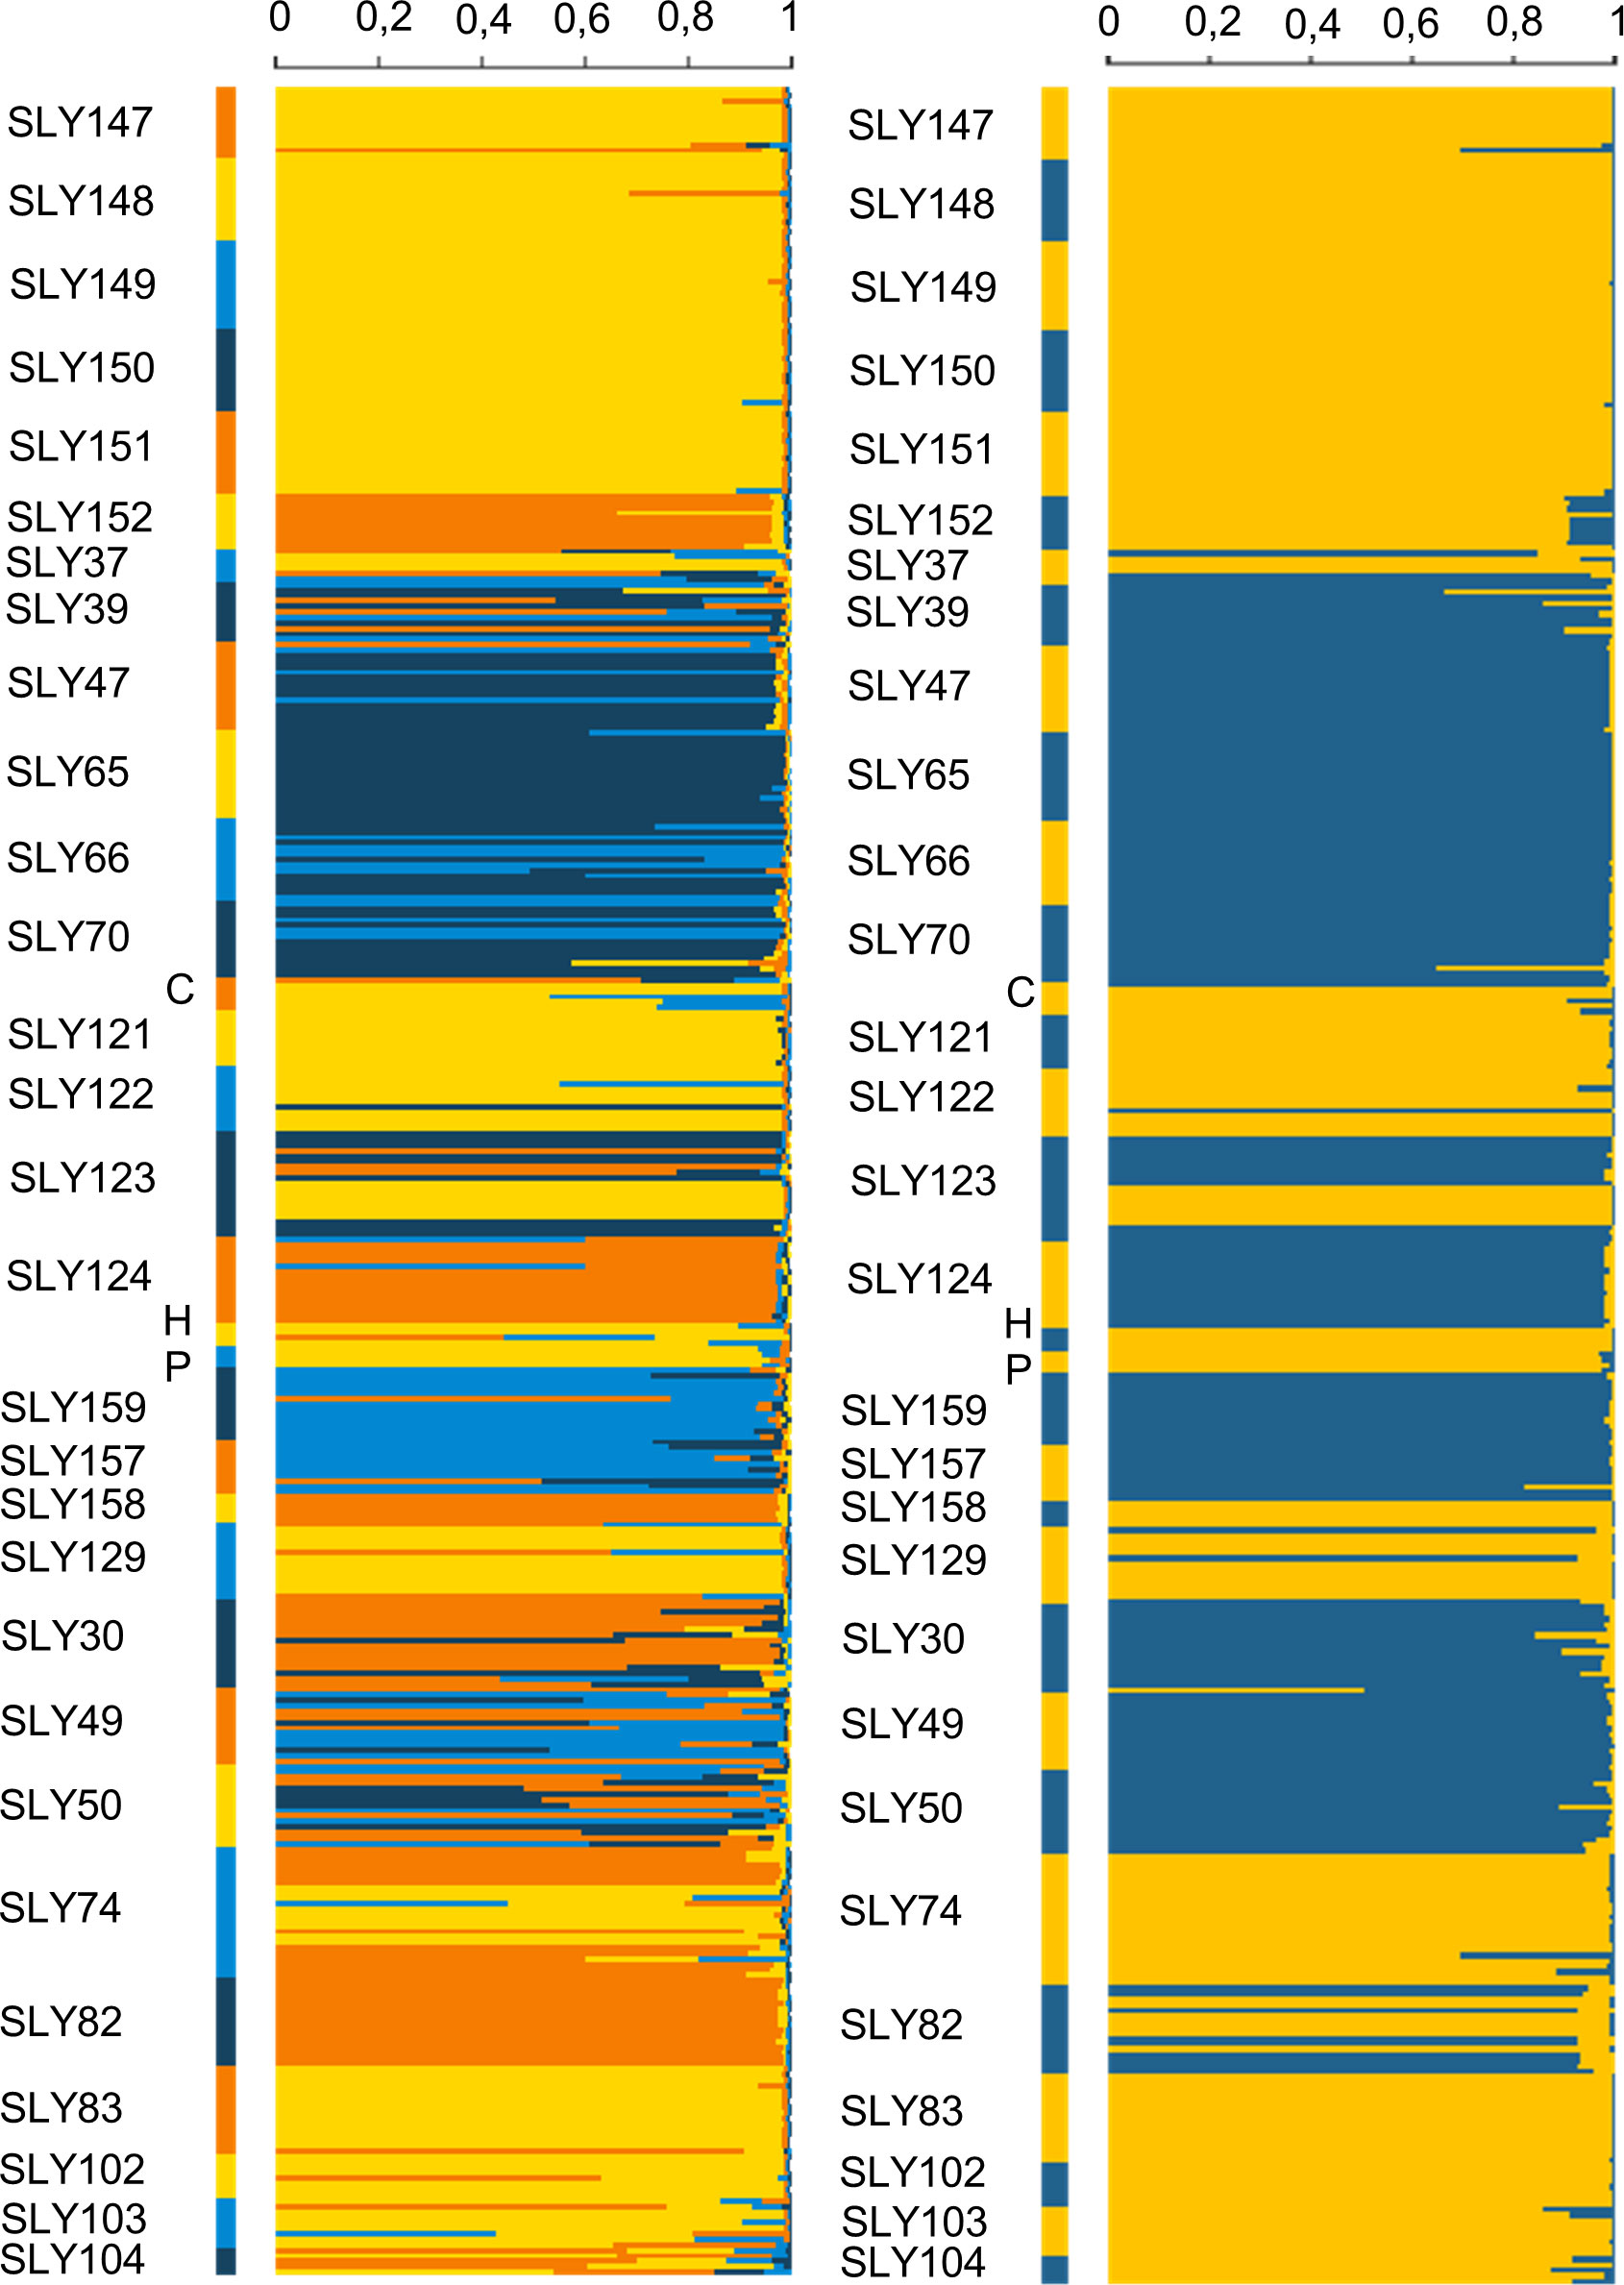
Figure 7 Classification of individuals using Structure 2.3.4 in two clusters (K = 2, left) and four clusters (K = 4, right).
The second peak of ΔK, with K = 4, was also evaluated (Figure 7). Under the classification of four clusters, the Marglobe admixture condition is lost but is increased in the accessions collected in Chile in 1938, where the individuals of the same accession showed high variability. When subdivided into four clusters the within groups explained variability increased by 5% respect to the subdivision into two clusters (Table 5). In both classifications, the main variance element of the observed molecular variance is due to individuals within populations, consistent with the results in Table 3.
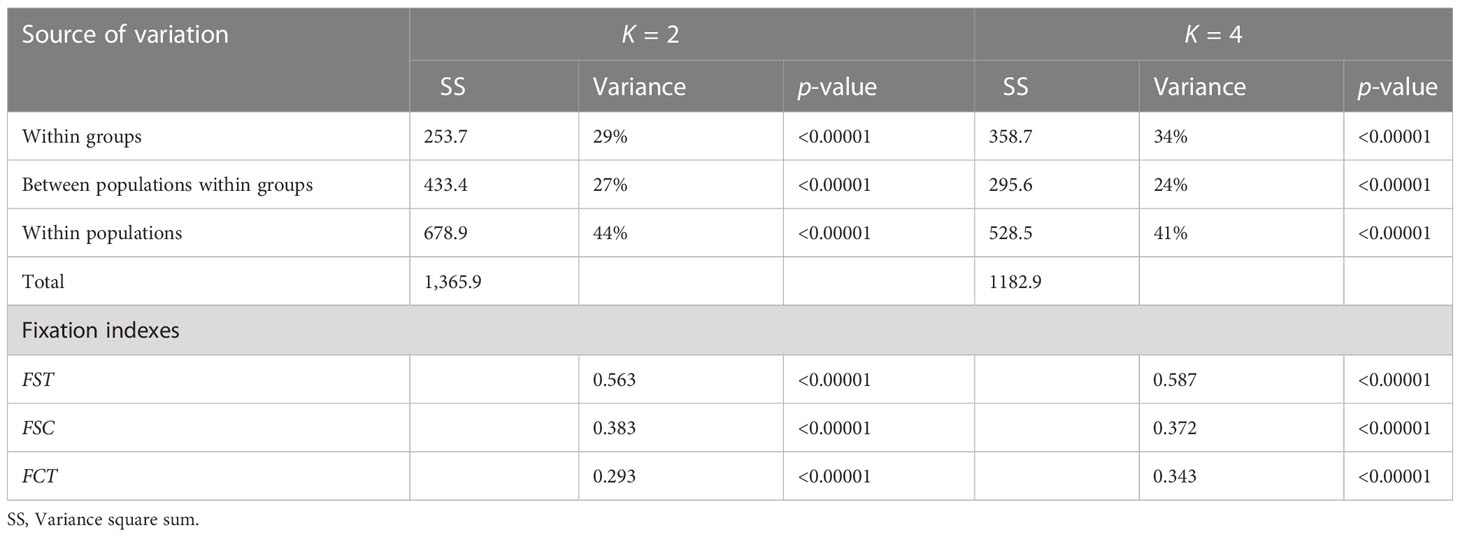
Table 5 AMOVA and fixation indexes for the analysis of SSR diversity among tomato accessions.
The clusters in the dendrogram based on Nei’s genetic distance (Figure 6) are consistent with the clusters observed in the phenotypic distance dendrogram (Figure 1) and the classification of individuals made by Structure (Figure 7). In the Structure classification with K = 4, clusters A (light blue), B (blue), C (orange), and D (yellow) were observed, having consistent admixture levels inside the clusters identified along the phenotypic dendrogram. Phenotypic clusters are supported by genotypic classification in the following: (i) cluster I.a, which corresponds to the genotypic dendrogram cluster II.a.6, composed of the accessions with a reduced number of leaflets (Figure 2E), a larger terminal leaflet (SLY47, SLY70, and SLY66) (Figure 2D), and the Structure classification related to A and B; associated with this cluster in terms of phenotypic leaf morphology and Structure classification is SLY65; (ii) the phenotypic cluster I.b.1 that groups the landraces SLY39, SLY50, and SLY30, having complete correspondence with the genotypic node (II.a.6) and classified by structure as an admixture for K = 4; and (iii) the phenotypic cluster III characterized by pink tomatoes that can weigh over 500 g, corresponding to cluster II.a.7 from the genotypic dendrogram, which was classified as light blue (A) by Structure (K = 4).
One of the cultivated tomatoes collected in Limache in 1938 (SLY49) is an exception that does not cluster on a phenotypic and genotypic basis with the rest of the accessions; the Structure classification supports this as an admixture. This is confirmed by the high diversity of phenotypes observed among plants of the SLY49 accession (Figures 2F, G). Marglobe accession, a US commercial round, red, and smooth-type tomato, was classified as C grouping distant in genotype and phenotype to the rest of the accessions. A relatively close accession to Marglobe was one of the pink tomatoes (SLY158), which, despite being described as a close phenotype to accessions SLY157 and SLY159, was observed as a commercial variety due to its molecular and phenotypic uniformity. This is in accordance with the information given by the seed donor. Limachino accessions SLY152 and SLY124 collected in 1980 and 2015, respectively, are also observed as populations close to Marglobe.
The European materials were classified as D by Structure, including the San Marzano accessions with different levels of mixture with the C group. Most of the Limachinos collected in 1980 and the other two accessions collected in 2015 appear as populations closest to European materials, with different levels of introgression. The reference Limachino SLY74 is classified as a mixture of individuals close to European or US accessions (Figure 7).
4 Discussion
4.1 Phenotypic variability and value as a genetic resource
The morphological variability was evaluated in 24 tomato accessions, with 46% corresponding to Limachino type, 42% to other Chilean landraces, and 12% being commercial varieties grown in Chile in the 1980s and in 2015. The potential of the local tomato genetic resources is seen in the broad diversity of phenotypes and existing significant differences for multiple traits of importance for agriculture (Supplementary Table 5), mainly traits associated with phenology, fruit morphology, and yield components. Identified morphological groups correspond to the scenario of four genetic groups proposed via Bayesian modeling. The yield components fresh fruit weight (FFW) and the number of fruits (NFM) showed higher CV in the genetic classification groups of structure associated with Chilean materials (A and B); thus, the utilization of this germplasm could present a potential impact on breeding programs (Supplementary Table 6).
The distinctiveness of the landraces is associated with the discrimination among tomato accessions. Figàs et al. (2015), using Tomato Analyzer, defined the shape indexes (SI and SII) as the descriptors with a higher discrimination capacity, unlike our work in which the eccentricity indexes (EAI, ECD, and ECC) had the highest discrimination capacity, associated with consistent distinctive fruit shapes. Figàs et al. (2015) also found no strong correlations ( ± 0.2) between descriptors and principal components, explaining 34% of the variability observed in the first two components, while morphological descriptors in the first two principal components of the present work, mainly associated with fruit, yield, and phenology, explained 45% of the total observed variability (Figure 3, Supplementary Table 4). In both cases, fruit descriptors presented the highest discrimination capacity among accessions. Bota et al. (2014) had similar results utilizing Tomato Analyzer; the first two principal components explained 47% of the variability observed. The shape indexes showed the highest correlation to the first component, and the fruit size descriptors (ARE, PER, and MXW), in conjunction with postharvest traits and fruit number, correlated to the second component. Principal component analysis has had a similar result in the present work, with PER, MXW, and NFM correlating with the second principal component. The low correlation of shape indexes with the principal components is probably associated with a lack of landraces with distinctive shapes such as cylindric, heart, or piriform.
The definition of tomato landraces based on cultivars with distinctive fruit shapes grown in the same or different territory has shown no correlation between the genotype and phenotype of the landraces (Cebolla-Cornejo et al., 2013). In contrast, in this study, the genetic groups of cultivars shared specific morphological traits. The observed diversity in morphological traits associated with yield (FFW, NFM, CGDD) is highly important for agriculture for sustainable intensification of agriculture (Khoury et al., 2016). Cortés-Olmos et al. (2015) found similar groups to the ones presented in this work by using SNPs, identifying at a molecular and phenotypical level: Rosa accession, characterized for being large pink tomatoes; and the Centenares accession, a cherry-type tomato. In our study, the pink beefsteak tomatoes (SLY157 and SLY159) and the cherry-like accession SLY49, which can be classified as a high-weight cherry tomato, were clearly differentiated, although SLY49 is highly diverse at a molecular level and at a morphological level, presenting a wide range of leaves, fruits, and plant architecture (Figures 2F, G). Cortés-Olmos et al. (2015) studied SNP and SSR variability, establishing that it is possible to define an association between molecular diversity and agro-morphological diversity in contraposition to evaluations of landraces from Spain (Cebolla-Cornejo et al., 2013), Greece (Terzopoulos and Bebeli, 2008), and Italy (Mazzucato et al., 2010). In contradistinction to García-Martínez et al. (2013), who found no differences between landraces from Spain and Italy, the genetic structure of the Chilean germplasm can be associated with its provenance. Further phylogeographic studies of the materials are needed to explore the history of the genetic structure.
4.2 Molecular diversity of the Chilean germplasm
4.2.1 Allelic diversity
Tomato SSR panels used to evaluate the genetic diversity in tomato accessions have yielded between 21% and 49% of monomorphic SSRs (Ruiz et al., 2005; Mohamed et al., 2012; Todorovska et al., 2014; Amraoui et al., 2017). In contrast, the 15 SSRs used in this research presented multiple alleles, except for LEcaa001, which was practically monomorphic, with the allele 119 having a frequency of 0.997. The results validate the selection criteria for the 15 SSRs.
The average number of alleles per locus was 5.8, higher than the 3.9 alleles per locus reported by Mazzucato et al. (2010), but lower than the 6.5 reported by Mazzucato et al. (2008). However, it was similar to the results of Ruiz et al. (2005), who reported five alleles per locus. A total of eight loci presented a PIC higher than 0.2, highlighting the markers SSR70 (0.57) and SSR248 (0.61). These PIC values are higher than those reported using the oligonucleotide (GATA)4 with allele scoring by electrophoresis in agarose gel, which yielded PICs not higher than 0.25 (García-Martínez et al., 2013). Our results show an interesting level of genetic diversity of the Chilean germplasm, considering that it represents 18% of the INIA’s tomato germplasm collection.
4.2.2 Diversity and genetic relations
The diversity observed in the Chilean local accessions is high. One possible cause is the larger number of plants per accession evaluated compared to other works. García-Martínez et al. (2013) genotyped three to five plants per accession, Cortés-Olmos et al. (2015) genotyped one plant per accession, Ruiz et al. (2005) genotyped four plants in one bulk per accession, and Mazzucato et al. (2010) genotyped one plant per accession. The results observed are consistent with Villand et al. (1998) and Chávez-Servia et al. (2018) that found a higher diversity in the accessions from South America and Mexico in comparison to accessions from USA and Europe. This division is appreciated in the Structure classification (K = 2), which sustains the division in one cluster associated with Chilean accessions and another one associated with Europe and USA (Figure 7).
Willis (1922) denominated the primary centers of domestication as the principal place of diversity. Moreover, the territories post-domestication events occurred as secondary centers of diversity. Under that definition, Villand et al. (1998) and Rick (1958) defined Chile, Perú, and Ecuador (Southwest Andes) as primary centers of diversity and as secondary centers to Europe and other places of the world. They were making a special consideration towards countries adjacent to the primary centers of diversity, comprising the territories of Argentina, Bolivia, Brazil, Colombia, Costa Rica, Guatemala, México, Nicaragua, Panamá, and Venezuela. Patiño (2002) mentions that tomatoes were grown already during pre-Columbian times in Argentina, Bolivia, and Colombia. Historical data that sustain the differentiation on a molecular level in two clusters by Bayesian modeling are found in this study, one corresponding to Latin American tomatoes and the second one grouping tomatoes from USA and Europe. In the same direction, Cobo (1653) had already described a distinction between wild and grown tomatoes in the 17th century in Peru. Later, Rick (1958) proposed a mixed origin of current landraces grown in the Southwest of the Andes (Perú, Ecuador, and Chile), given by a late introduction of San Marzano and Marmande type in the 19th century. Our results support the idea that Chilean tomato landraces, which can be differentiated to a molecular and morphological level, are different from the ones cultivated in other regions, e.g., USA and Europe, with the Chilean landraces expressing a high diversity of fruit size, leaflet number, and stigma exertion. This is in agreement with the recent studies that reveal a complex non-linear domestication process of tomato, with the involvement of a high diversity with no clear trends in the selection pressure over genomic regions, suggesting multiple domestication spreadings involving Mexico and South America (Razifard et al., 2020).
4.3 The distinctiveness of the Limachino tomato
From 1999 to date, only the Italian tomato landrace San Marzano (Rao et al., 2006; Mazzucato et al., 2010), the Vesuvian Pomodorino del Piennolo (Manzo et al., 2018), and the Greek tomato Santorini (Koutsika-Sotiriou et al., 2016) have received a Protected Denomination of Origin, becoming the standard on which the distinctiveness of tomato landraces has been proved. The molecular fingerprint of San Marzano has been developed utilizing the oligonucleotide (GATA)4 and microsatellites (Rao et al., 2006; Caramante et al., 2009). In the case of the utilization of SSR, Caramante et al. (2009) found all alleles to be monomorphic for the evaluated accessions of San Marzano, which is not the case for the reference Limachino, supporting its classification as a landrace. The Limachino-type tomatoes (Supplementary Figure 4) are observed as close to Marmande and distant to old Chilean landraces, probably associated with an origin in the hybridization of Marmande-type tomatoes with local tomatoes as proposed by Rick (1958). However, a total of nine private alleles (Table 4) in the reference Limachino (SLY74) allows us to distinguish it at a molecular level from the Chilean accessions evaluated and the foreign accessions, such as San Marzano, Marmande, and commercial cultivars. The high number of low-frequency alleles and, in this case, private ones might be associated with a foundation and posterior population expansion scenario. This hypothesis needs to be tested but is consistent with the historical records of tomato cultivated surface and the 163 smallholder tomato growers registered in Limache to 1955 (Donoso et al., 2022). The selection of growers has generated genetic differences within the Limachino type, as landraces are dynamic populations, having still a Limachino-type phenotype according to Figure 1, and have been grown in the territory of Limache from at least 1960 (SLY74) to 2015 (SLY121). The same pattern was observed in San Marzano accessions (SLY102, SLY103, and SLY104) collected in different countries (Figure 6).
Considering our results, there is the background to support the hypothesis of this work, existing tomato landraces that have been cultivated (SLY39, SLY30, SLY50, SLY65, SLY47, SLY70, SLY66, and SLY49) and that are being cultivated (SLY159, SLY157, SLY123, and SLY124) in Chile continuously before 1938 until 2015. These landraces are different from the European and US varieties, demonstrating the existence of an in situ conservation of tomato landraces with novel alleles.
High molecular and morphological diversity was observed, with an association of phenotypes to differentiated genotypes. Accessions of Chilean tomato landraces could have the potential to generate yield increments in breeding programs by having a higher variability in yield components (Donoso and Salazar, 2023). Our results are consistent with those obtained by other researchers that had proposed Mesoamerica and the Andes Region as a center of diversity for tomatoes.
Data availability statement
The original contributions presented in the study are included in the article/Supplementary Materials Further inquiries can be directed to the corresponding author.
Author contributions
Conceptualization, ES. Methodology, ES, CA and AD. Validation, BC and ES. Formal analysis, AD. Investigation, AD. Resources, ES and BC. Data curation, CA and AD. Writing—original draft preparation, AD. Writing—review and editing, ES and BC. Visualization, ES. Supervision, ES. Project administration, ES. Funding acquisition, ES and BC. All authors contributed to the article and approved the submitted version.
Funding
This work was partially funded by the CONICYT scholarship N° 22170045 from the Programa Nacional de Becas de Postgrado—Magister 2017, the FONTAGRO Project (Code FTG/RF-15460-RG), the INIA/MINAGRI Conservation of Genetic Resources Program (Code 501453-70), FIA project N° PYT- 2014-0227, and Fortalecimiento y Desarrollo de Centro Regionales ANID projects R19A10001 and R22A0001.
Conflict of interest
The authors declare that the research was conducted in the absence of any commercial or financial relationships that could be construed as a potential conflict of interest.
Publisher’s note
All claims expressed in this article are solely those of the authors and do not necessarily represent those of their affiliated organizations, or those of the publisher, the editors and the reviewers. Any product that may be evaluated in this article, or claim that may be made by its manufacturer, is not guaranteed or endorsed by the publisher.
Supplementary material
The Supplementary Material for this article can be found online at: https://www.frontiersin.org/articles/10.3389/fcosc.2023.1156786/full#supplementary-material
References
Albrecht E., Escobar M., Chetelat R. T. (2010). Genetic diversity and population structure in the tomato-like nightshades Solanum lycopersicoides and S. sitiens. Ann. Bot. 105, 535–554. doi: 10.1093/aob/mcq009
Amraoui R., Mingeot D., Addi M., Elamrani A., Caid Serghini H., Mihamou A., et al. (2017). Genetic assessment of Moroccan tomato (Solanum lycopersicum l.) genotypes by RAPD and SSR markers. Atlas J. Biol., 384–391. doi: 10.5147/ajb.v0i0.136
Balzarini M., Arroyo A., Bruno C., di Renzo J. (2006). “Análisis de datos de marcadores con info-gen,” in XXXV congreso argentino de genética, San Luis Argentina.
Barra M., Salazar E. R., Beltrán M., Sagredo B. (2012). Simple and robust DNA extraction method for the large-scale analysis of genotypes containing high polyphenolic content, such as landracesof solanum tuberosum and zea mays. Ciencia e investigación agraria: Rev. latinoamericana Cienc. la agricultura 39, 593–601. doi: 10.4067/S0718-16202012000300019
Bates D., Maechler M., Bolker B., Walker S., Bojesen R. H., Singmann H., et al. (2018). lme4: linear mixed-effects models using eigen and S4 (R package version 1.1-18-1). RCRAN. Available at: http://CRAN.R-project.org/package=lme4http://CRAN.R-project.org/package=lme4.
Bauchet G., Causse M. (2012). “Genetic diversity in tomato (Solanum lycopersicum) and its wild relatives,” in Genetic diversity in plants. Ed. Caliskan M. (Rijeka, Croatia: InTech), 133–162. doi: 10.5772/33073
Benor S., Zhang M., Wang Z., Zhang H. (2008). Assessment of genetic variation in tomato (Solanum lycopersicum l.) inbred lines using SSR molecular markers. J. Genet. Genomics 35, 373–379. doi: 10.1016/S1673-8527(08)60054-5
Bolker B. M., Brooks M. E., Clark C. J., Geange S. W., Poulsen J. R., Stevens M. H. H., et al. (2009). Generalized linear mixed models: a practical guide for ecology and evolution. Trends Ecol. Evol. 24, 127–135. doi: 10.1016/j.tree.2008.10.008
Bota J., Conesa M.À., Ochogavia J. M., Medrano H., Francis D. M., Cifre J. (2014). Characterization of a landrace collection for tomàtiga de ramellet (Solanum lycopersicum l.) from the Balearic islands. Genet. Resour Crop Evol. 61, 1131–1146. doi: 10.1007/s10722-014-0096-3
Caramante M., Rao R., Monti L. M., Corrado G. (2009). Discrimination of ‘San marzano’ accessions: a comparison of minisatellite, CAPS and SSR markers in relation to morphological traits. Sci. Hortic. 120, 560–564. doi: 10.1016/j.scienta.2008.12.004
Casañas F., Simó J., Casals J., Prohens J. (2017). Toward an evolved concept of landrace. Front. Plant Sci. 8. doi: 10.3389/fpls.2017.00145
Cebolla-Cornejo J., Roselló S., Nuez F. (2013). Phenotypic and genetic diversity of Spanish tomato landraces. Sci. Hortic. 162, 150–164. doi: 10.1016/j.scienta.2013.07.044
Ceccarelli S. (2011). “Landraces: importance and use in breeding and environmentally friendly agronomic systems,” in Agrodiversity conservation securing the diversity of crop wild relatives and landraces. Eds. Maxted N., Ehsan Dullo M., Ford-Lloyd B. V., Frese L., Iriondo J., Pinheiro de Carvhalo A. A. (Wallingford, England: CABI), 103–117.
Chávez-Servia J., Vera-Guzmán A., Linares-Menéndez L., Carrillo-Rodríguez J., Aquino-Bolaños E. (2018). Agromorphological traits and mineral content in tomato accessions from El Salvador, central America. Agronomy 8, 32. doi: 10.3390/agronomy8030032
Chen K. Y., Tanksley S. D. (2004). High-resolution mapping and functional analysis of se2. 1: a major stigma exsertion quantitative trait locus associated with the evolution from allogamy to autogamy in the genus Lycopersicon. Genetics 168, 1563–1573. doi: 10.1534/genetics.103.022558
Cobo B.De l. t. (1653) Historia del nuevo mundo libro 4. capítulo 26.568 Available at: http://www.cervantesvirtual.com/obra/historia-del-nuevo-mundo-por-el-padre-bernabe-cobo-de-la-compania-de-jesus-primera-parte-0.
Cortés-Olmos C., Vilanova S., Pascual L., Roselló J., Cebolla-Cornejo J. (2015). SNP markers applied to the characterization of Spanish tomato (Solanum lycopersicum l.) landraces. Sci. Hortic. 194, 100–110. doi: 10.1016/j.scienta.2015.07.036
Donoso A., Martínez J. P., Salazar E. (2022). History of tomato cultivation in Chile: the limachino tomato case. RIVAR 9, 185–201. doi: 10.35588/rivar.v9i27.5673
Donoso A., Salazar E. (2023). Yield components and development in indeterminate tomato landraces: an agromorphological approach to promoting their utilization. Agronomy 13, 434. doi: 10.3390/agronomy13020434
Earl D. A., vonHoldt B. M. (2012). STRUCTURE HARVESTER: a website and program for visualizing STRUCTURE output and implementing the evanno method. Conserv. Genet. Resour 4, 359–361. doi: 10.1007/s12686-011-9548-7
Evanno G., Regnaut S., Goudet J. (2005). Detecting the number of clusters of individuals using the software structure: a simulation study. Mol. Ecol. 14, 2611–2620. doi: 10.1111/j.1365-294X.2005.02553.x
Excoffier L., Lischer H. E. L. (2010). Arlequin suite ver 3.5: a new series of programs to perform population genetics analyses under Linux and windows. Mol. Ecol. Resour 10, 564–567. doi: 10.1111/j.1755-0998.2010.02847.x
Farinon B., Picarella M. E., Siligato F., Rea R., Taviani P., Mazzucato A. (2022). Phenotypic and genotypic diversity of the tomato germplasm from the Lazio region in central Italy, with a focus on landrace distinctiveness. Front. Plant Sci. 13. doi: 10.3389/fpls.2022.931233
Figàs M. R., Prohens J., Raigón M. D., Fernández-de-Córdova P., Fita A., Soler S. (2015). Characterization of a collection of local varieties of tomato (Solanum lycopersicum l.) using conventional descriptors and the high-throughput phenomics tool tomato analyzer. Genet. Resour Crop Evol. 62, 189–204. doi: 10.1007/s10722-014-0142-1
Fowler C., Mooney P. (1990). Shattering: food, politics, and the loss of genetic diversity (Tucson: The University of Arizona Press), 278.
Fox J., Weisberg S., Adler D., Bates D., Baud-Bovy G., Ellison S., et al. (2012). Package ‘car.’ (Vienna: R Foundation for Statistical Computing), 16.
García-Martínez S., Corrado G., Ruiz J. J., Rao R. (2013). Diversity and structure of a sample of traditional Italian and Spanish tomato accessions. Genet. Resour Crop Evol. 60, 789–798. doi: 10.1007/s10722-012-9876-9
Gur A., Zamir D. (2004). Unused natural variation can lift yield barriers in plant breeding. PloS Biol. 2, e245. doi: 10.1371/journal.pbio.0020245
Hammer Ø., Harper D. A. T., Ryan P. D. (2001). PAST: paleontological statistics software package for education and data analysis. Palaeontologia electronica 4, 9.
He C., Poysa V., Yu K. (2003). Development and characterization of simple sequence repeat (SSR) markers and their use in determining relationships among Lycopersicon esculentum cultivars. Theor. Appl. Genet. 106, 363–373. doi: 10.1007/s00122-002-1076-0
IPGRI (1996). Descriptors for tomato (Lycopersicon spp.) (Rome (Italy: International Plant Genetic Resources Instit., (IPGRI), 44.
Kalinowski S. T., Taper M. L., Marshall T. C. (2007). Revising how the computer program cervus accommodates genotyping error increases success in paternity assignment. Mol. Ecol. 16, 1099–1106. doi: 10.1111/j.1365-294X.2007.03089.x
Khoury C. K., Achicanoy H. A., Bjorkman A. D., Navarro-Racines C., Guarino L., Flores-Palacios X., et al. (2016). Origins of food crops connect countries worldwide. Proc. R. Soc. B: Biol. Sci. 283, 20160792. doi: 10.1098/rspb.2016.0792
Koutsika-Sotiriou M., Mylonas I., Tsivelikas A., Traka-Mavrona E. (2016). Compensation studies on the tomato landrace ‘Tomataki santorinis.’. Sci. Hortic. 198, 78–85. doi: 10.1016/j.scienta.2015.11.006
Manzo N., Pizzolongo F., Meca G., Aiello A., Marchetti N., Romano R. (2018). Comparative chemical compositions of fresh and stored vesuvian PDO “Pomodorino del piennolo” tomato and the ciliegino variety. Molecules 23, 2871. doi: 10.3390/molecules23112871
Martinez J. P., Jana C., Muena V., Salazar E., Rico J. J., Calabrese N., et al. (2021). “The recovery of the old limachino tomato: history, findings, lessons, challenges and perspectives,” in Agriculture value chain-challenges and trends in academia and industry: RUC-APS. Verlag, Springer International Publishing, 93–108. doi: 10.1007/978-3-030-51047-3_7
Matschiner M., Salzburger W. (2009). TANDEM: integrating automated allele binning into genetics and genomics workflows. Bioinformatics 25, 1982–1983. doi: 10.1093/bioinformatics/btp303
Maxted N., Kell S. P. (2009). Establishment of a global network for the in situ conservation of crop wild relatives: status and needs (Rome, Italy: FAO Commission on Genetic Resources for Food and Agriculture), 266.
Mazzucato A., Ficcadenti N., Caioni M., Mosconi P., Piccinini E., Reddy Sanampudi V. R., et al. (2010). Genetic diversity and distinctiveness in tomato (Solanum lycopersicum l.) landraces: the Italian case study of ‘A pera abruzzese.’. Sci. Hortic. 125, 55–62. doi: 10.1016/j.scienta.2010.02.021
Mazzucato A., Papa R., Bitocchi E., Mosconi P., Nanni L., Negri V., et al. (2008). Genetic diversity, structure and marker-trait associations in a collection of Italian tomato (Solanum lycopersicum l.) landraces. Theor. Appl. Genet. 116, 657–669. doi: 10.1007/s00122-007-0699-6
Merino J. (1968). Estudio de la conservación por frío de la especie tomate, variedades Es-24 y limachino en distintos estados de madurez. Thesis. Pontificia Universidad Cato lica de Valparaiso.
Mohamed A. M. E. A., Adel A. E. E. T., Mohamed M. H. (2012). Genetic diversity and DNA fingerprint study in tomato (Solanum lycopersicum l) cultivars grown in Egypt using simple sequence repeats (SSR) markers. Afr J. Biotechnol. 11, 16233–16240. doi: 10.5897/AJB12.2477
Oliphant T. E. (2007). Python For scientific computing. Comput. Sci. Eng. 9, 10–20. doi: 10.1109/MCSE.2007.58
Patiño V. M. (2002). Historia y dispersión de los frutales nativos del neotrópico (Cali, Colombia: Centro Internacional de Agricultura Tropical).
Peakall R., Smouse P. E. (2006). Genalex 6: genetic analysis in excel. population genetic software for teaching and research. Mol. Ecol. Notes 6, 288–295. doi: 10.1111/j.1471-8286.2005.01155.x
Pritchard J. K., Stephens M., Donnelly P. (2000). Inference of population structure using multilocus genotype data. Genetics 155, 945–959. doi: 10.1093/genetics/155.2.945
Ramasamy R. K., Ramasamy S., Bindroo B. B., Naik V. G. (2014). STRUCTURE PLOT: a program for drawing elegant STRUCTURE bar plots in user friendly interface. Springerplus 3, 431. doi: 10.1186/2193-1801-3-431
Ramirez-Villegas J., Khoury C. K., Achicanoy H. A., Diaz M. V., Mendez A. C., Sosa C. C., et al. (2022). State of ex situ conservation of landrace groups of 25 major crops. Nat. Plants 8, 491–499. doi: 10.1038/s41477-022-01144-8
Rao R., Corrado G., Bianchi M., di Mauro A. (2006). (GATA)4 DNA fingerprinting identifies morphologically characterized “San marzano” tomato plants. Plant Breed. 125, 173–176. doi: 10.1111/j.1439-0523.2006.01183.x
Razifard H., Ramos A., Della Valle A. L., Bodary C., Goetz E., Manser E. J., et al. (2020). Genomic evidence for complex domestication history of the cultivated tomato in Latin America. Mol. Biol. Evol. 37, 1118–1132. doi: 10.1093/molbev/msz297
Rick C. M. (1958). The role of natural hybridization in the derivation of cultivated tomatoes of western south America. Econ Bot. 12, 346–367. doi: 10.1007/BF02860023
Rodríguez G. R., Moyseenko J. B., Robbins M. D., Huarachi Morejón N., Francis D. M., van der Knaap E. (2010). Tomato analyzer: a useful software application to collect accurate and detailed morphological and colorimetric data from two-dimensional objects. J. Vis. Exp. 16, e1856. doi: 10.3791/1856
Rodríguez G. R., Muños S., Anderson C., Sim S.-C., Michel A., Causse M., et al. (2011). Distribution of SUN, OVATE, LC , and FAS in the tomato germplasm and the relationship to fruit shape diversity. Plant Physiol. 156, 275–285. doi: 10.1104/pp.110.167577
Ruiz J. J., García-Martínez S., Picó B., Gao M., Quiros C. F. (2005). Genetic variability and relationship of closely related Spanish traditional cultivars of tomato as detected by SRAP and SSR markers. J. Am. Soc. Hortic. Sci. 130, 88–94. doi: 10.21273/JASHS.130.1.88
Salazar E., León-Lobos P., Rosas M., Muñoz C. (2006). Estado de la conservación ex situ de los recursos fitogenéticos cultivados y silvestres en Chile (Santiago, Chile: Boletín INIA N°156).
Scholberg J., Mcneal B. L., Jones J. W., Boote K. J., Stanley C. D., Obreza T. A. (2000). Growth and canopy characteristics of field-grown tomato. Agron. J. 92, 152. doi: 10.1007/s100870050017
Schuelke M. (2000). An economic method for the fluorescent labeling of PCR fragments. Nat. Biotechnol. 18, 233–234. doi: 10.1038/72708
Stehberg R., Sotomayor G. (2012). Mapocho incaico. Boletín del Museo Nacional Hist. Natural Chile 61, 85–149. doi: 10.54830/bmnhn.v61.2012.164
Suliman-Pollatschek S., Kashkush K., Shats H., Hillel J., Lavi U. (2002). Generation and mapping of AFLP, SSRs and SNPs in Lycopersicon esculentum. Cell Mol. Biol. Lett. 7, 583–597.
Terzopoulos P. J., Bebeli P. J. (2008). DNA And morphological diversity of selected Greek tomato (Solanum lycopersicum l.) landraces. Sci. Hortic. 116, 354–361. doi: 10.1016/j.scienta.2008.02.010
The Tomato Genome Consortium (2012). The tomato genome sequence provides insights into fleshy fruit evolution. Nature 485, 635–641. doi: 10.1038/nature11119
Todorovska E., Ivanova A., Ganeva D., Pevicharova G., Molle E., Bojinov B., et al. (2014). Assessment of genetic variation in Bulgarian tomato ( Solanum lycopersicum l.) genotypes, using fluorescent SSR genotyping platform. Biotechnol. Biotechnol. Equip. 28, 68–76. doi: 10.1080/13102818.2014.901683
Universidad Cato lica de Chile and CORFO (1986). Monografí as hortí colas. Tomate, arveja, broccoli, zanahoria. Santiago de Chile: CORFO, 99
Villand J., Skroch P. W., Lai T., Hanson P., Kuo C. G., Nienhuis J. (1998). Genetic variation among tomato accessions from primary and secondary centers of diversity. Crop Sci. 38, 1339–1347. doi: 10.2135/cropsci1998.0011183X003800050032x
Willis J. C. (1922). Age and area; a study in geographical distribution and origin of species (Cambridge UK [Eng.]: The University Press). doi: 10.5962/bhl.title.30741
Wright S. (1949). The genetical structure of populations. Ann. Eugen 15, 323–354. doi: 10.1111/j.1469-1809.1949.tb02451.x
Keywords: landrace, Solanum lycopersicum, SSR, genetic diversity, morphological characterization, ex situ-in situ conservation
Citation: Donoso A, Carrasco B, Araya C and Salazar E (2023) Genetic diversity and distinctiveness of Chilean Limachino tomato (Solanum lycopersicum L.) reveal an in situ conservation during the 20th century. Front. Conserv. Sci. 4:1156786. doi: 10.3389/fcosc.2023.1156786
Received: 01 February 2023; Accepted: 14 April 2023;
Published: 02 May 2023.
Edited by:
Jesus V. Jorrin Novo, University of Cordoba, SpainCopyright © 2023 Donoso, Carrasco, Araya and Salazar. This is an open-access article distributed under the terms of the Creative Commons Attribution License (CC BY). The use, distribution or reproduction in other forums is permitted, provided the original author(s) and the copyright owner(s) are credited and that the original publication in this journal is cited, in accordance with accepted academic practice. No use, distribution or reproduction is permitted which does not comply with these terms.
*Correspondence: Erika Salazar, ZXNhbGF6YXJAaW5pYS5jbA==