 Jun Zhang
 Yuyan Gong1
 Yancong Cai
 Zuozhi Chen
- 1Key Laboratory for Sustainable Utilization of Open-Sea Fishery Ministry of Agriculture and Rural Affairs, South China Sea Fisheries Research Institute Chinese Academy of Fishery Sciences, Guangzhou, China
- 2Southern Marine Science and Engineering Guangdong Laboratory (Guangzhou), Guangzhou, China
Fishes play significant ecological functions though many ways in coral reef, and feeding process is one of the most important. To understand responses of reef fish communities to external disturbances, we studied variations in trophic groups of fishes in the lagoon of Meiji Reef in the South China Sea based on fish specimens collected by hand-line and gillnet in 1998—2018, databases and literatures. Differences in species richness, abundance, weight and size of fish in different trophic groups among years were analysed, especially herbivorous and high-economy fish. The results indicated that the percentages of species number and weight of herbivores, piscivores and detritivores decreased significantly from 1998—1999/2016—2018. Herbivorous fishes saw the biggest decline. In the gillnet surveys, the percentages of species number and weight of herbivorous fishes in 1999 were 33.33% and 56.14%, respectively, while the percentages in 2016—2018 were all zero. The species number percentage of large-sized fishes (maximum total length ≥ 65 cm) in 1998—1999 was significantly larger than that in 2016—2018. Thirty-two fish species being found in the lagoon of Meiji Reef during 1998—1999 were not discovered during 2012—2018. Contingency table analysis showed that the disappearance of fish was not significantly related to the vulnerability or resilience of fish rather than economic value. The mean body weight of very high & high-value fish in 1998—1999 was significantly larger than that in 2016—2018. Simple linear regression showed that coral cover had the greater effect on the species number and weight of herbivorous fishes as compare to fishing power. Both fishing power and coral cover had significant effects on the mean body weight. To protect fish on Meiji Reef, we propose to strengthen the conservation initiatives (e.g., creating protected areas, prohibiting fishing, and reconstructing habitat).
Introduction
Coral reefs are among the most productive and diverse marine ecosystems, and provide a multitude of ecosystem services and support a myriad of fishes (Moberg and Folke, 1999; Bellwood et al., 2004; Smith, 1978). However, over the past few decades, coral reefs and associated fishes have sharply degraded because of multiple threats (e.g. rising ocean temperature and unsustainable fishing (Allgeier et al., 2016; Hughes et al., 2017; Munday et al., 2008). The South China Sea (SCS) is a globally significant area because of its shallow coral reefs and high biodiversity (Chen and Li, 2005; Arai, 2015; Li et al., 2021; Lu et al., 2021; Dai et al., 2022; Li et al., 2022). Under multiple stressors of human activities and climate change, the coral cover in the SCS has severely declined within the past few decades, and coral reef fish populations have receded (Hughes et al., 2013; Zhao et al., 2013; Zhao et al., 2016; Hughes et al., 2017; Zhang et al., 2021a; Zhang et al., 2021b).
Fish are important components of coral reefs, play significant ecological functions though many ways in coral reef, and feeding process is one of the most important (Berumen et al., 2005; Munday et al., 2008; Cole et al., 2010; Roberts, 1995). Therefore, the knowledge of reef fish feeding is of great significance for protecting fishery resources and diagnosing health status of coral reefs (Letourneur et al., 2013; Hempson et al., 2017; Morillo-Velarde et al., 2018). Dividing reef fish into different trophic groups according to their prey is helpful to study their ecological roles and how fishing and climate alter the structure of reef fish (Gao et al., 2014; Wilson et al., 2021; Dai et al., 2022). For example, herbivorous fishes in coral reef can inhibit algal overgrowth and promote coral growth, which is important for the recovery of bleached coral (Cramer et al., 2017; Rempel et al., 2020; Wilson et al., 2021). Piscivorous fish are probably the most significant consumers of fish biomass and in most reef systems will consume considerably more fish biomass than is removed by fishing (Grigg et al., 1984). The removal of piscivorous fish may have repercussions throughout the ecosystem (Jennings et al., 1995). In the SCS, Although some studies have focused on feeding and trophic levels of reef fish (Zhang et al., 2006; Yang et al., 2012; Gao et al., 2014; Zhang et al., 2022), little research has revealed the long-term variations in the structure of their trophic groups.
Meiji Reef (9°55′N, 115°32′E) is located in the SCS near the western border of the Coral Triangle, and is a typical atoll (Figure 1). The reef is a semi-closed and oval-shaped shallow tropical atoll, which is 9 km long (east-west) and 6 km wide (north-south) and covers a total area of 56.6 km2. This reef is characterized by a large lagoon with a maximum water depth of 30 m, which is surrounded by a ring of reef flat, which is typically 0—3 m below the low tide level (Zhao et al., 2013). Three channels connect the lagoon to the open ocean. The reef flat in the northwest is about 3 km long and 0.8 km wide, and the reef flat in the southeast is more than 4 km long and 0.3 km wide. Meiji Reef was rich in fish, although fishing activity was frequent (Li et al., 2007). Regular surveys of fish in the lagoon of Meiji Reef conducted by South China Sea Fisheries Research Institute since the 1990s provided the foundation for studying long-term variations in reef fish communities.
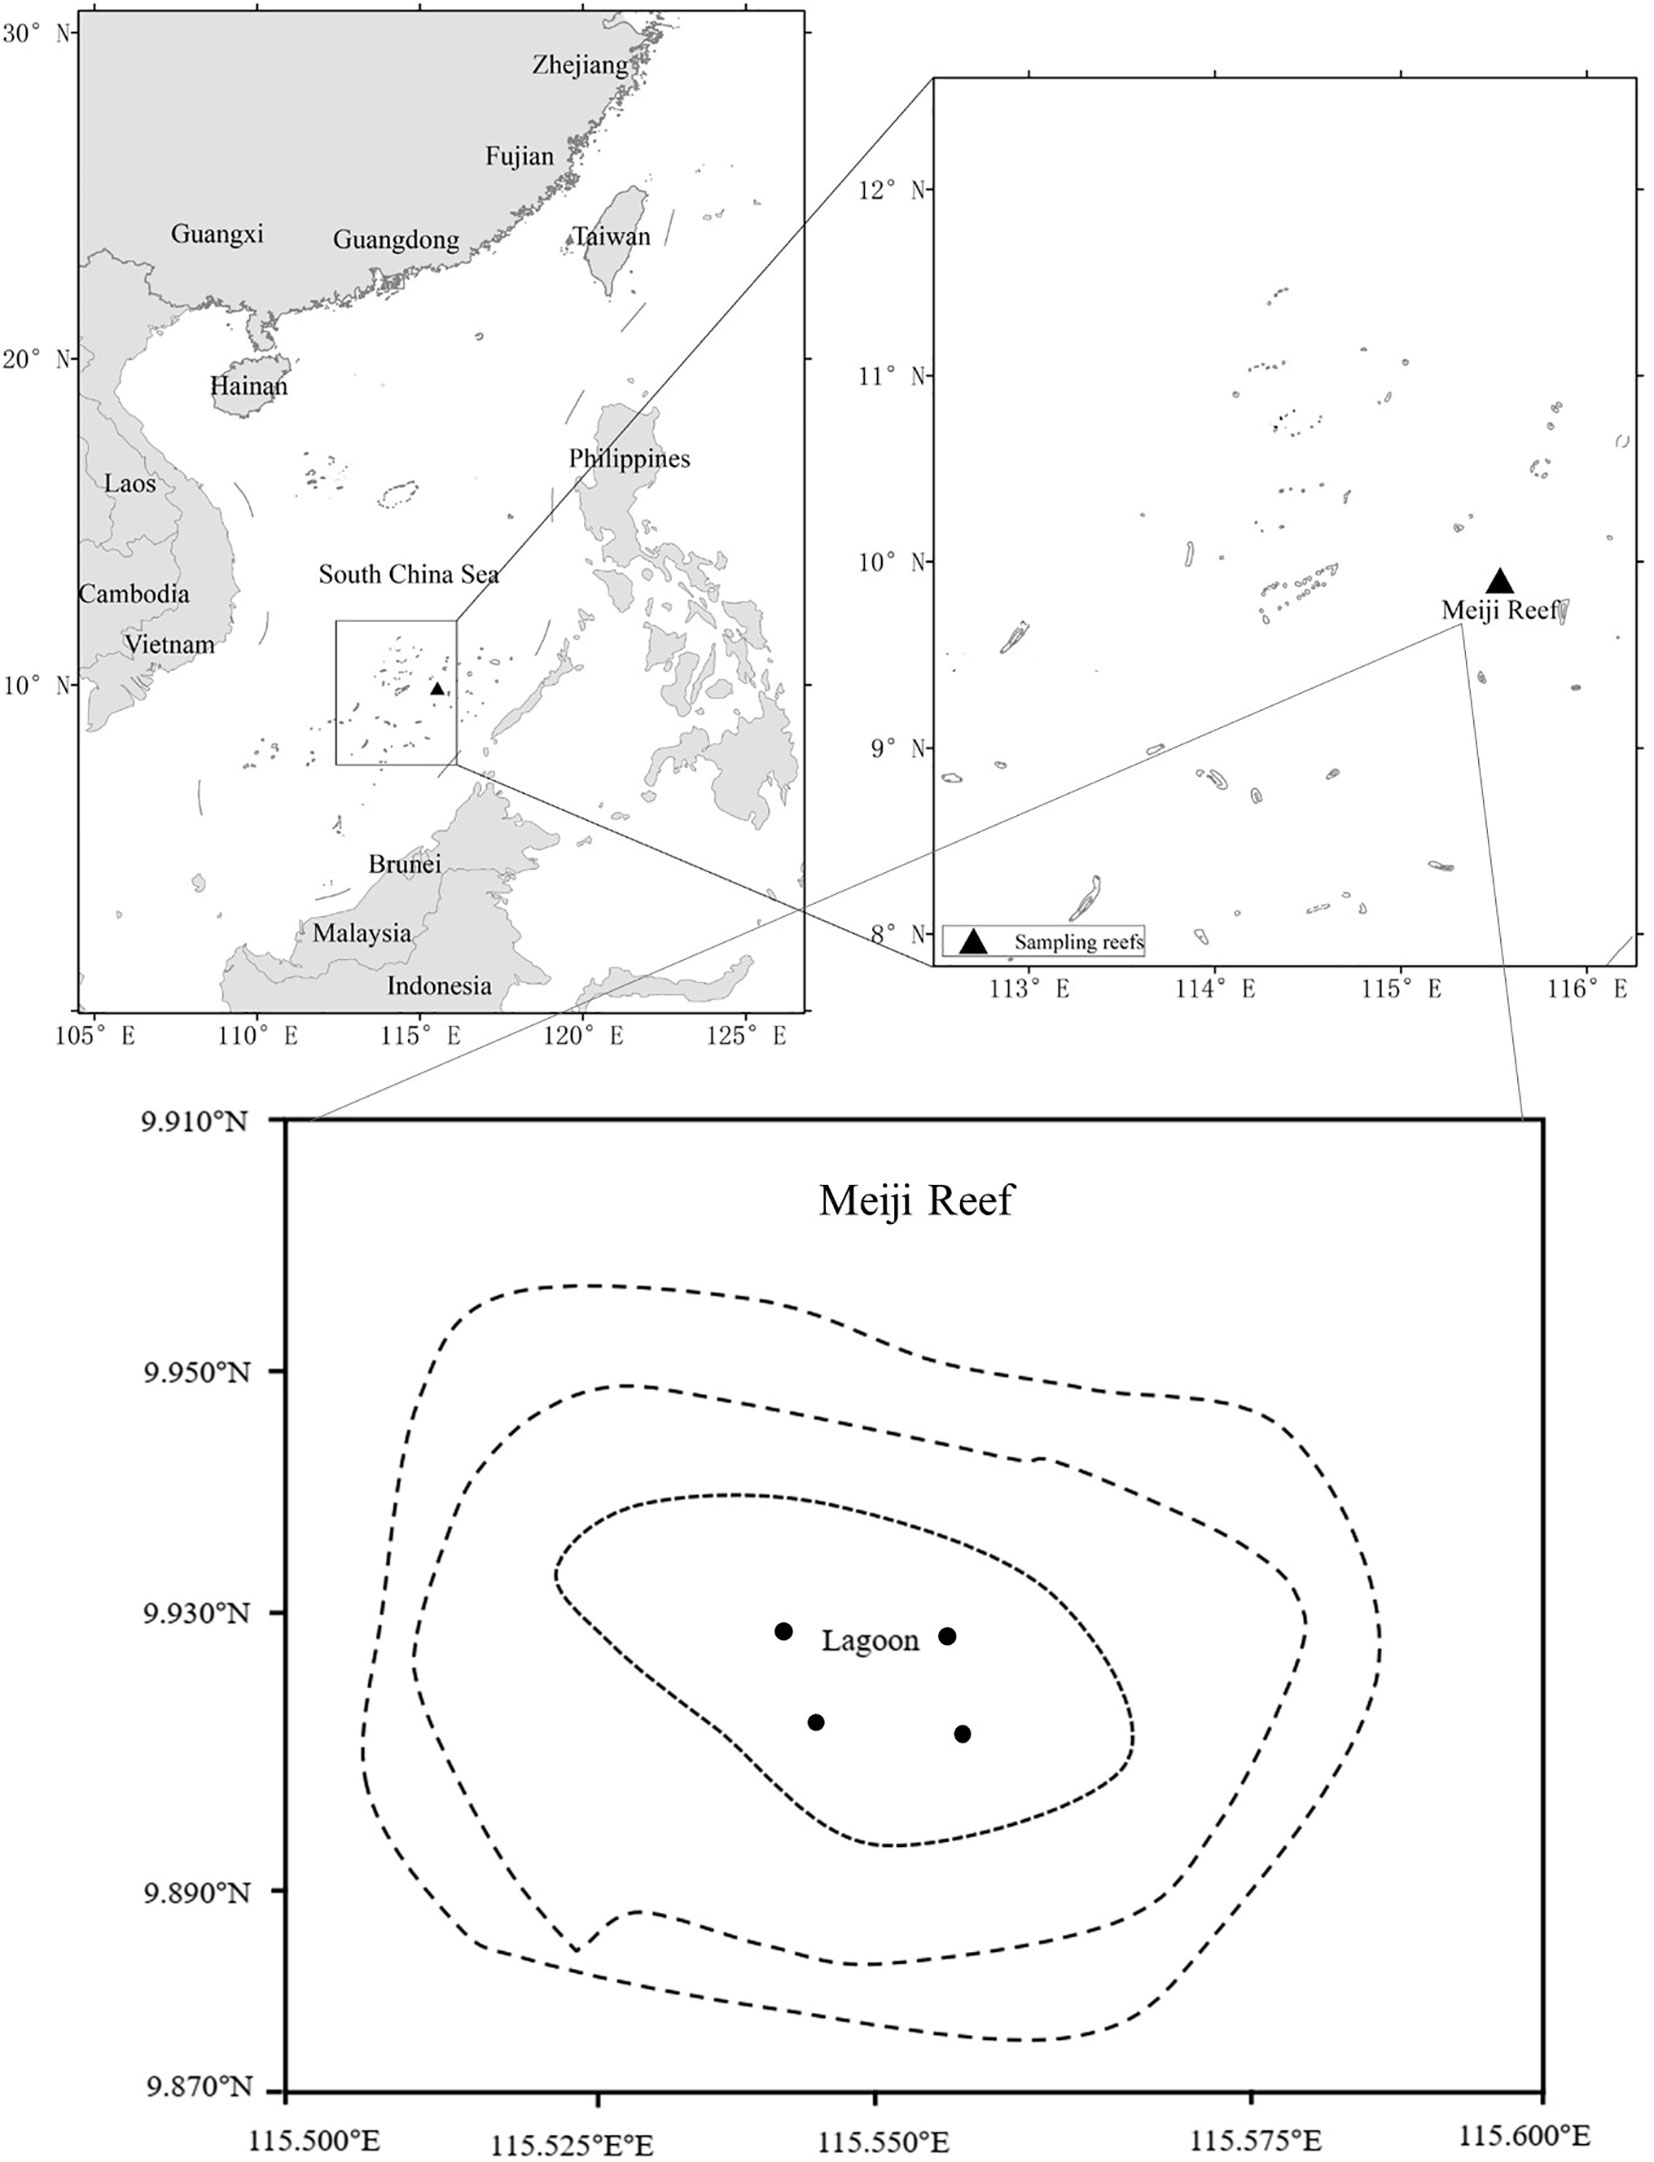
Figure 1 Study area (Meiji Reef lagoon) in the South China Sea. ●: approximate fishing sites.
To understand responces of coral reef fish communities under external disturbances in the SCS and provide some valuable information for their conservation, we studied variations in trophic groups of fishes in the lagoon of Meiji Reef based on fish specimens collected by hand-line and gillnet in 1998—2018, databases and literatures. Differences in species richness, abundance, weight and size of fishes in different trophic groups among years were analysed, especially herbivorous and high-economy fish. The relationships between fish disappearance and diet, resilience, vulnerability, and economic value were explored by contingency table analysis. The effects of fishing effort and coral cover on herbivorous and high-economy fish were tested by simple linear regression model.
Materials and methods
Study area and fish specimen collection
The study site was located at the lagoon of Meiji Reef in the SCS (Figure 1). Fish specimens were collected by hand-line in 1998—1999 and 2017—2018 and gillnet in 1999, 2012, 2016—2018 (Table 1). The working depth of hand-lines with barbed hooks was ~20 m, with fresh shrimp as bait and sampling was performed during the day (08:00—10:00 and 14:00—18:00). The working depth of gillnets was ~20 m, and sampling was usually performed during the day, although occasionally extended to the next morning (06:00). For each survey, four sites were established to cover the lagoon. GPS was used to ensure that the same sites are being sampled. The sampling sites were restricted to the lagoon. South China Sea Fisheries Research Institute conducted all surveys.
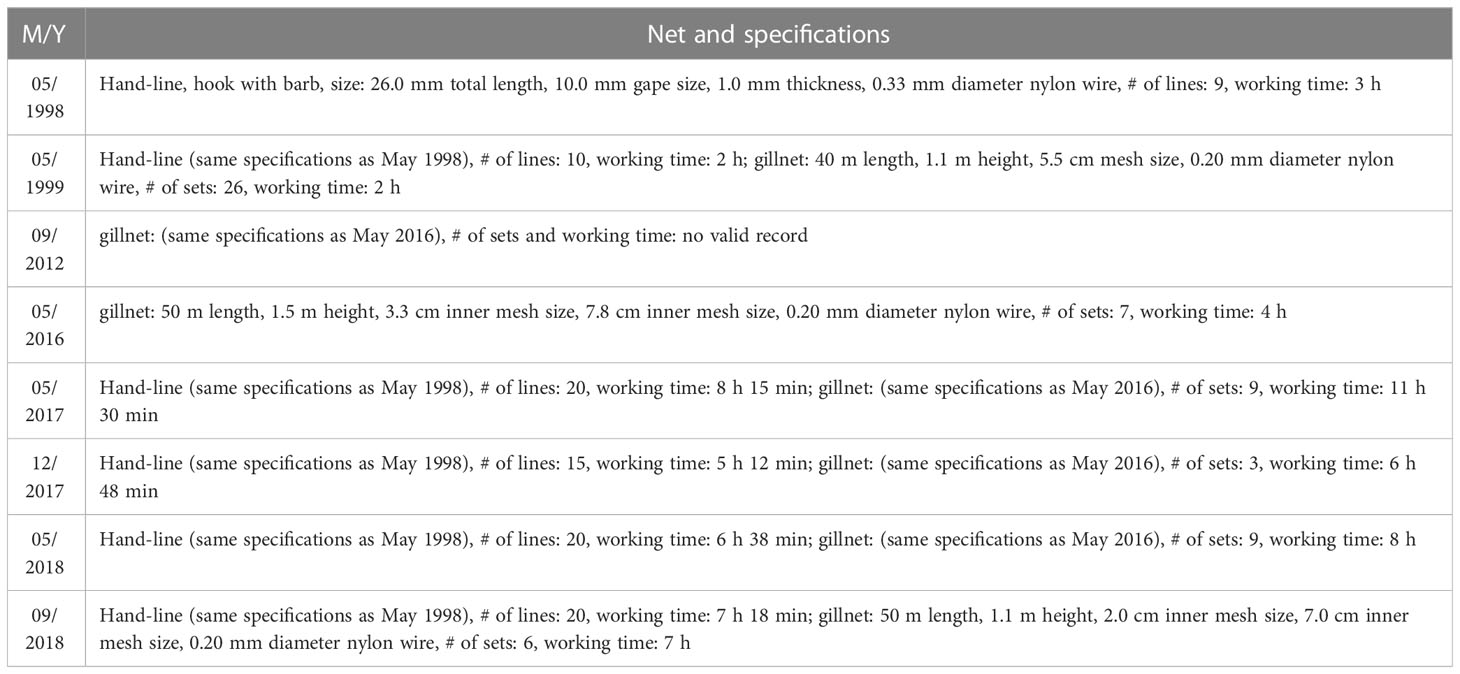
Table 1 Specifications of hand-line and gillnet used for fish collection in the lagoon of Meiji Reef in the South China Sea.
The time, site, and fish-catcher of each specimen were recorded. Each specimen was identified to the lowest taxonomic category based on morphological characteristics and Nelson’s classification system (Nelson, 2006). Live fish were euthanized using MS-222 before being processed. Specimens were immersed in seawater and frozen (−20°C) for shore-based analysis. Wet body weight was measured using electronic scales to the nearest 0.01 g.
In 1998 and 1999, surveys were undertaken onboard the vessel R/V Fisheries Administration (300 GT, 44.40 m long, and 8.00 m wide) and commercial fishing vessel F/V Yueyu 730 (98 GT, 26.50 m long, and 5.30 m wide). During 2012—2018, surveys were undertaken onboard the R/V Nanfeng (1537 t GT, 66.66 m long, and 12.40 m wide) equipped with a motorboat for samping (1 GT, 7.85 m long, 1.50 m wide, and compression-ignition internal combustion engine). The total species number, abundance, weight and sampling effort of fish specimens were presented in Table 2.
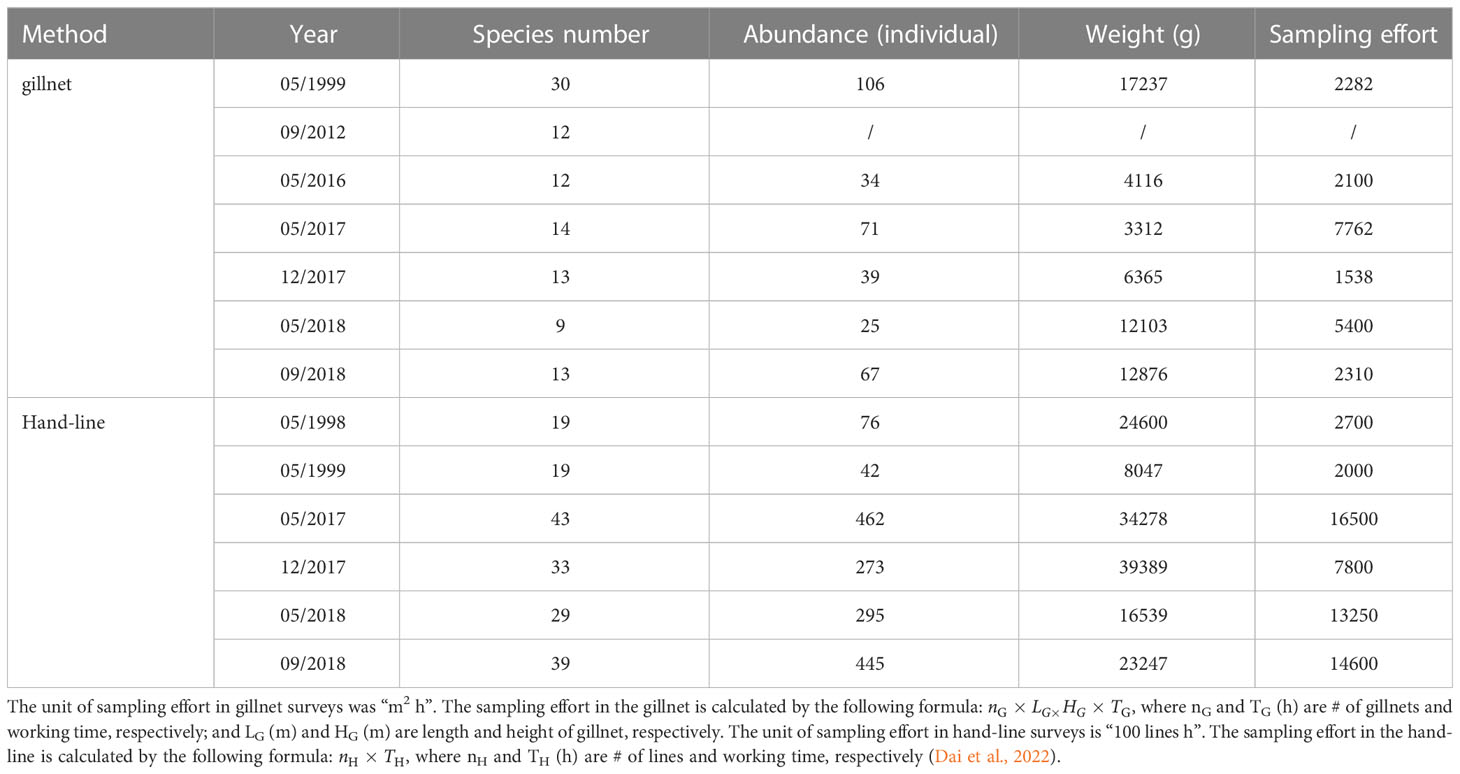
Table 2 Total species number, abundance, weight and sampling effort of fish specimens in the lagoon of Meiji Reef in the South China Sea during 1998—2018.
Trophic groups and fish size
Based on published literatures (Jennings et al., 1995; Gao et al., 2014), fishes were categorized into seven trophic groups: piscivores (pi), invertebrate feeder & piscivores (ip), invertebrate feeders (iv), omnivores (om), planktivores (pk), detritivores(dt), and herbivores (hb). The primary information on the trophic groups of fishes was from literatures and databases (Zhang et al., 2006; Gao et al., 2014; Shao, 2019; Froese and Pauly, 2020; Liveaquaria, 2022). Those fish whose diet could not be determined were analyzed separately by gastric contents. The species composition of fish specimen among years was analysed, including corresponding number and weight. Differences in fish species richness and weight of different trophic groups among years were analyzed using the Mann-Whitney (M−W) and Kolmogorov-Smirnov (K−S) tests. In this study, the species percentage and weight percentage of fish across trophic groups among different surveys were calculated as follows:
where species numberi,y and weighti,y are the species number and weigtht of fish in ith trophic group in the yth survey, respectively, and species numberj,y and weightj,y are the species number and weigtht of fish in the jth trophic group (pk、pi、om、iv、ip、hb or dt) in the yth survey, respectively.
Maximum total length of fish was obtained from FishBase (Froese and Pauly, 2020). According to the maximum total length, fishes were divided into three types, namely small-sized fish: maximum total length< 35 cm, medium-sized fish: 65 cm > maximum total length ≥ 35 cm, large-sized fish: maximum length ≥ 65 cm (Wang et al., 2022). We analyzed difference of fish size between 1998—1999 and 2016—2018. The species number and total weight of hb fish in gillnet surveys among years were analyzed in particular, as was the total weight and mean body weight of high-value fish among years.
Fish disappearance and contingency table analysis
Using Fishbase database (Froese and Pauly, 2020), we collected information on resilience, vulnerability, and economic value of fish. Resilience included four grades: i.e., very low (VL), low (L), moderate (M), and high (H). Vulnerability included six grades: i.e., low (L), low-moderate (L-M), moderate (M), moderate-high (M-H), high (H), and very high (VH). Economic value included four grades: i.e., low (L), moderate (M), high (H), and very high (VH). We used contingency table analysis to explore the relationships between fish disappearance and diet, resilience, vulnerability, and economic value (significance = 0.05). The size of fish that disappeared was also analysed.
Fishing effort and coral cover
The fishing effort of coral reef fish on Meiji Reef was from the Fishermen’s Association of Nansha Islands Taishan City, China. The association is a voluntary civil organization of fishermen. Fishermen in Taishan City are the main catchers of coral reef fish in the Nansha Islands. They have been catching coral reef fish on Meiji Reef and adjacent reefs since the early 1990s. The main methods of operation were hand-line, diving and gillnet. The fishing effort from 1998 to 2018 is indicated by the total horsepower of fishing boats.
Information on the coral cover of Meiji Reef in this paper came from published literatures and personal communication. Zhao et al. (2013) reported that the coral cover of Meiji Reef was 28.31% in 2007. According to literatures (Hughes et al., 2013; Zhao et al., 2013), we simply speculated that the coral cover of Meiji Reef was between 60% and 50% in 1998 and 1999. During 2016—2018, the coral cover of Meiji Reef ranged from 12%—15% with an average cover of 14% (personal communication).
Simple linear regression model (SLM) was used to test the effects of fishing effort and coral cover on the percentages of species number and weight of hb fish in gillnet surveys, and the weight percentage and mean body weight of very high & high-value fish in gillnet and hand-line surveys.
Results
Fish list
From 1998 to 2018, there were 166 fish species sampled in present study in the lagoon of Meiji Reef, belonging to 33 families. The composition of diet, trophic level, resilience, vulnerability and economic value of these fishes was present in the Figure 2 and Supplementary 1.
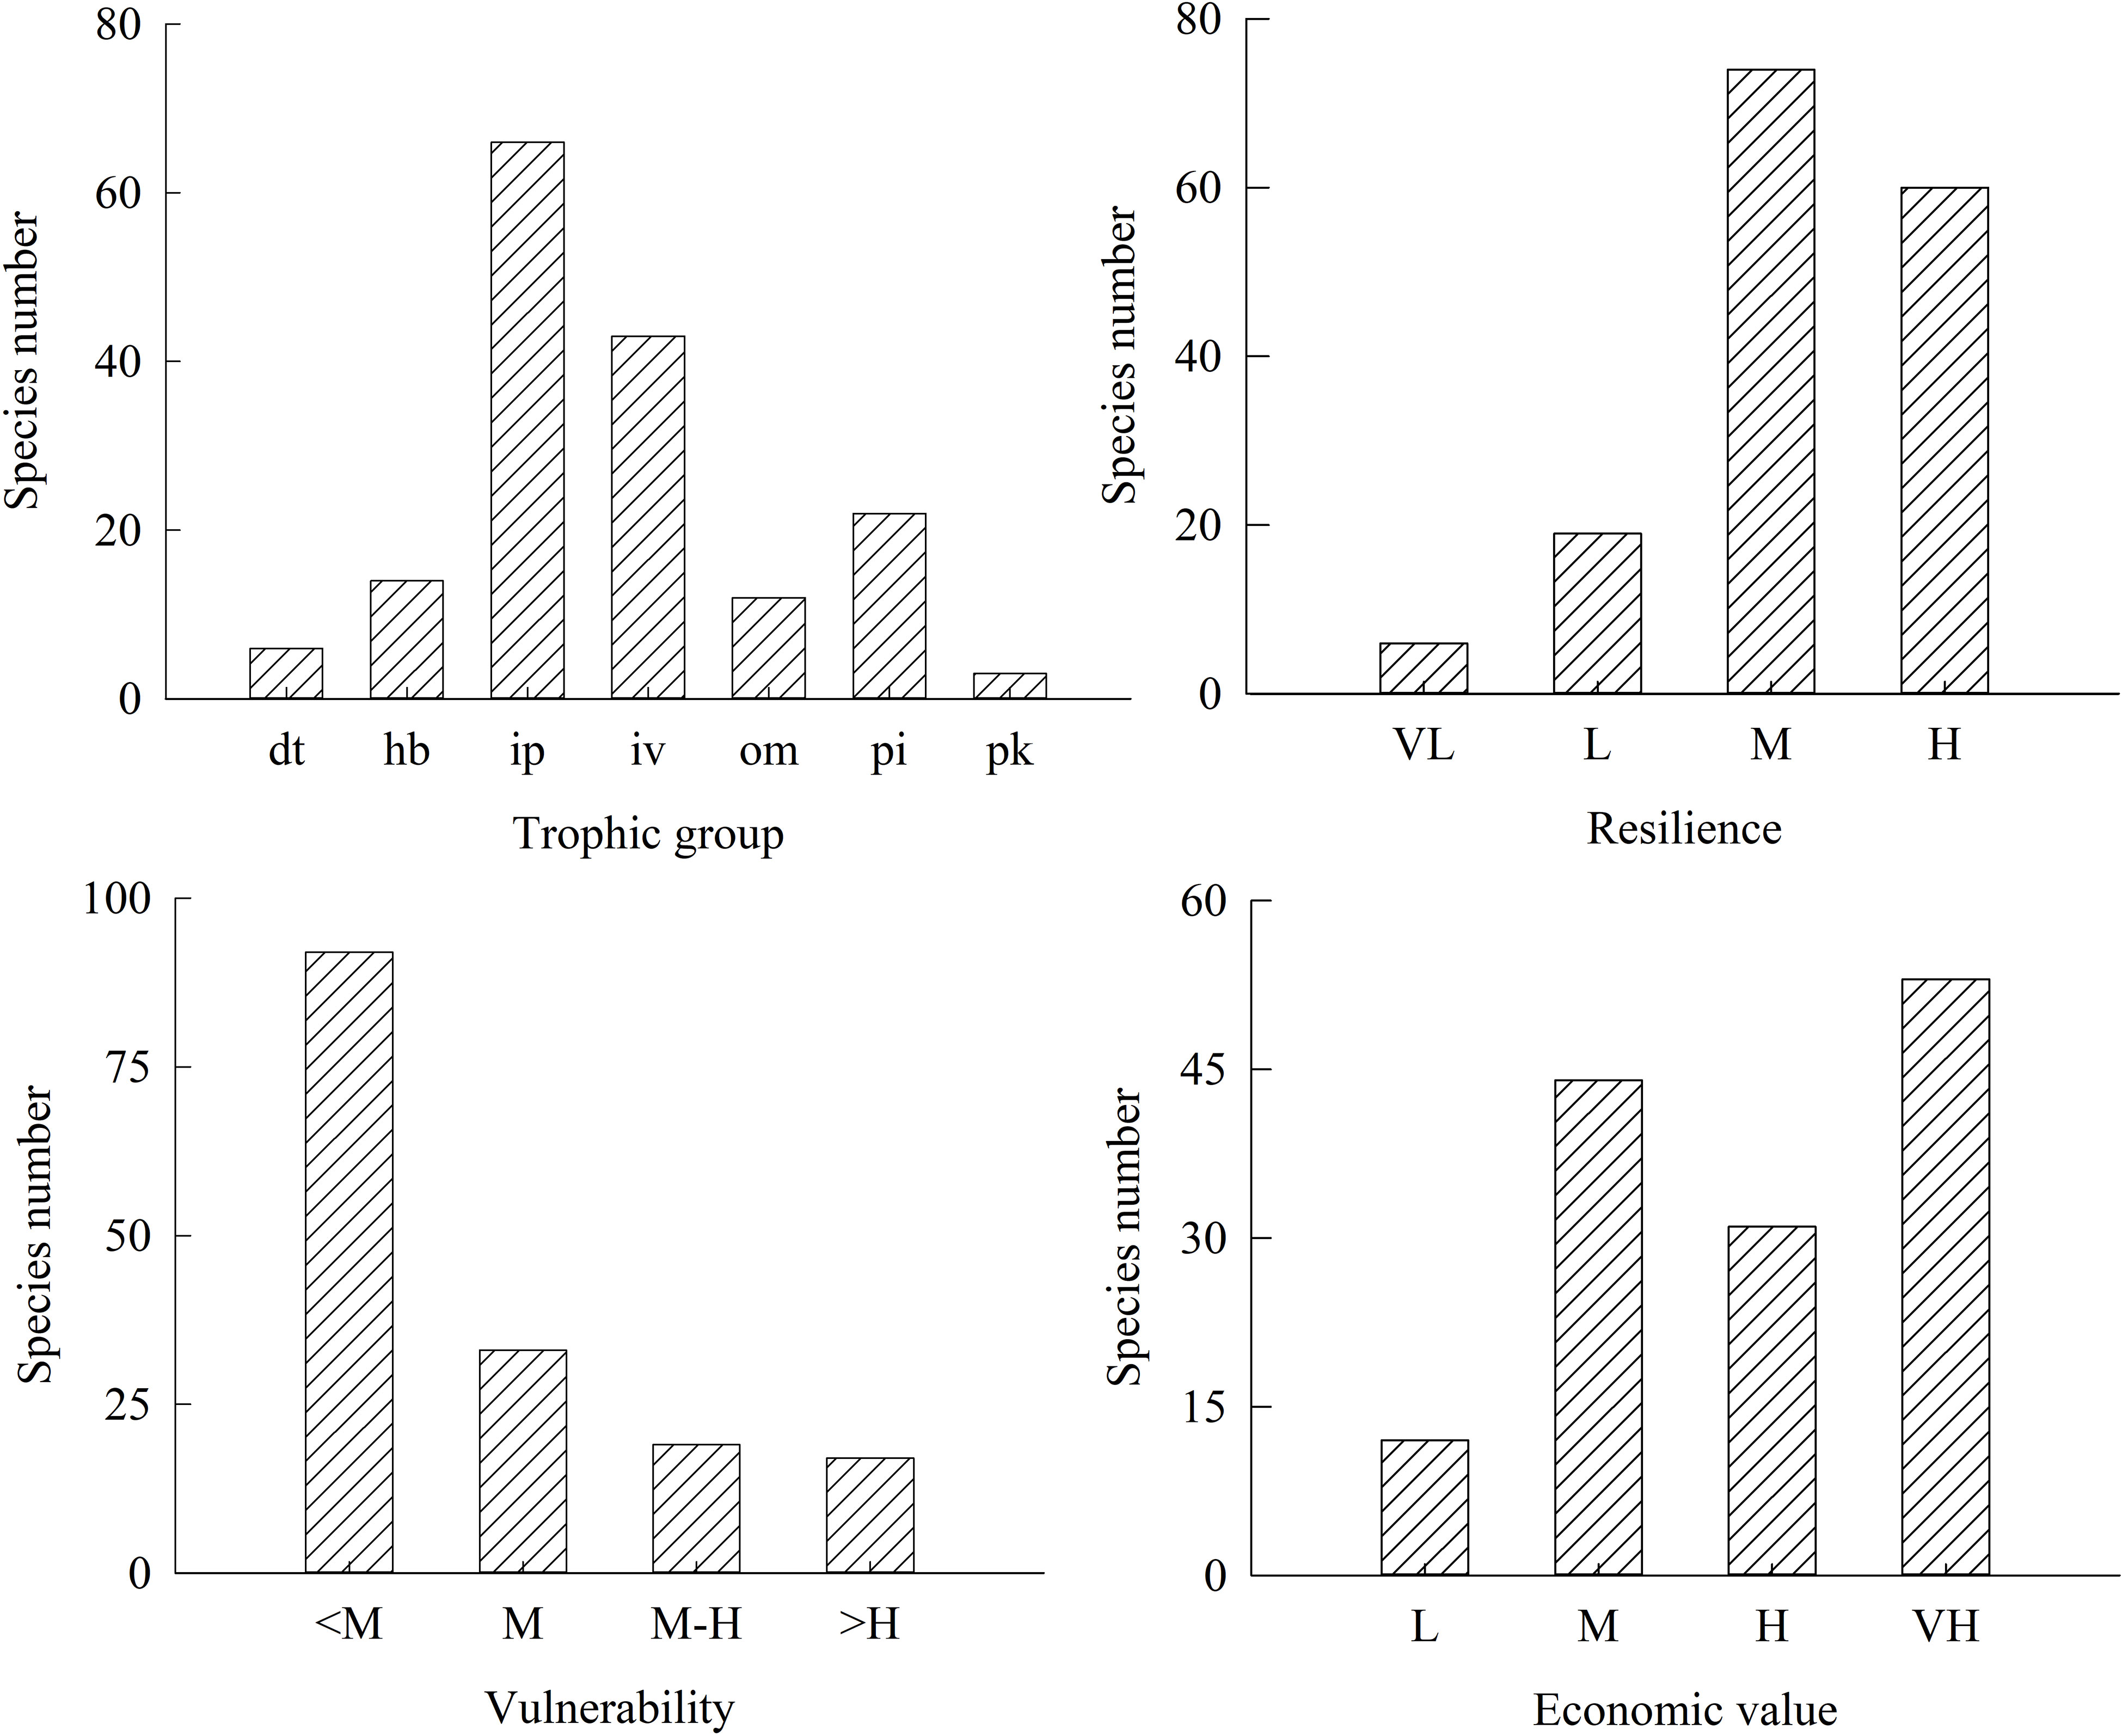
Figure 2 Number of fish species for different diet, vulnerability, resilience and economic value in the lagoon of Meiji Reef in the South China Sea. The dt, hb, ip, iv, om, pi and pk mean detritivores, herbivores, piscivores, invertebrate feeders, omnivores, invertebrate feeder & piscivores, and planktivores, respectively. The VL, L, M, M-H, H, and VH mean very low, low, moderate, moderate-high, high, and very high levels, respectively.
Among 166 species, there were fourteen hb fish species, including 10 parrotfishes, 3 rabbitfishes and 1 surgeonfish. The lowest trophic level of fish was 2.00, including twelve hb fish species and four dt fish species. The highest trophic level of fish was 4.50, including two ip fish species and two ip fish species. The vulnerability of most fishes was not high. The number of fish species with vulnerability ≥ H only accounted for 10.2% of total species. As viewed from resilience, the number of fish species with resilience = M and H accounted for 44.6% and 36.1% of total species, respectively. Six fish species had extremely low resilience, including Taeniurops meyeni, Maculabatis gerrardi, Neotrygon kuhlii, Acanthurus nigricans, Epinephelus bruneus and Gymnothorax undulatus. Regarding economic value, the number of fish species with economic value ≥ H accounted for 50.6% of total species. Among 31 high-value species, there were 15 parrotfishes. Among 53 very high-value species, there were 17 Serranidaes, 14 Lethrinidae, 11 Labridae and 6 Lutjanidae.
Variations in trophic group and size distribution
The species richness, abundance percentage and weight percentage of different trophic fish in 1998—1999 and 2016—2018 are presented in Figure 3 and Figure 4. The absolute abundance and weight of different trophic fish in the lagoon of Meiji Reef between 1998—1999 and 2016—2018 in a figure as support information (Supplementary 2). The species richness and weight composition of trophic groups in 2016—2018 were significantly different with 1998—1999 (M−W and K−S tests, p< 0.01). In 1999, the fish by gillnet was framed by six trophic groups, except there was no pk fish. In contrast, in 2016—2018, some trophic groups disappeared (e.g. hb and pi fish) and the structure of trophic groups became incomplete.
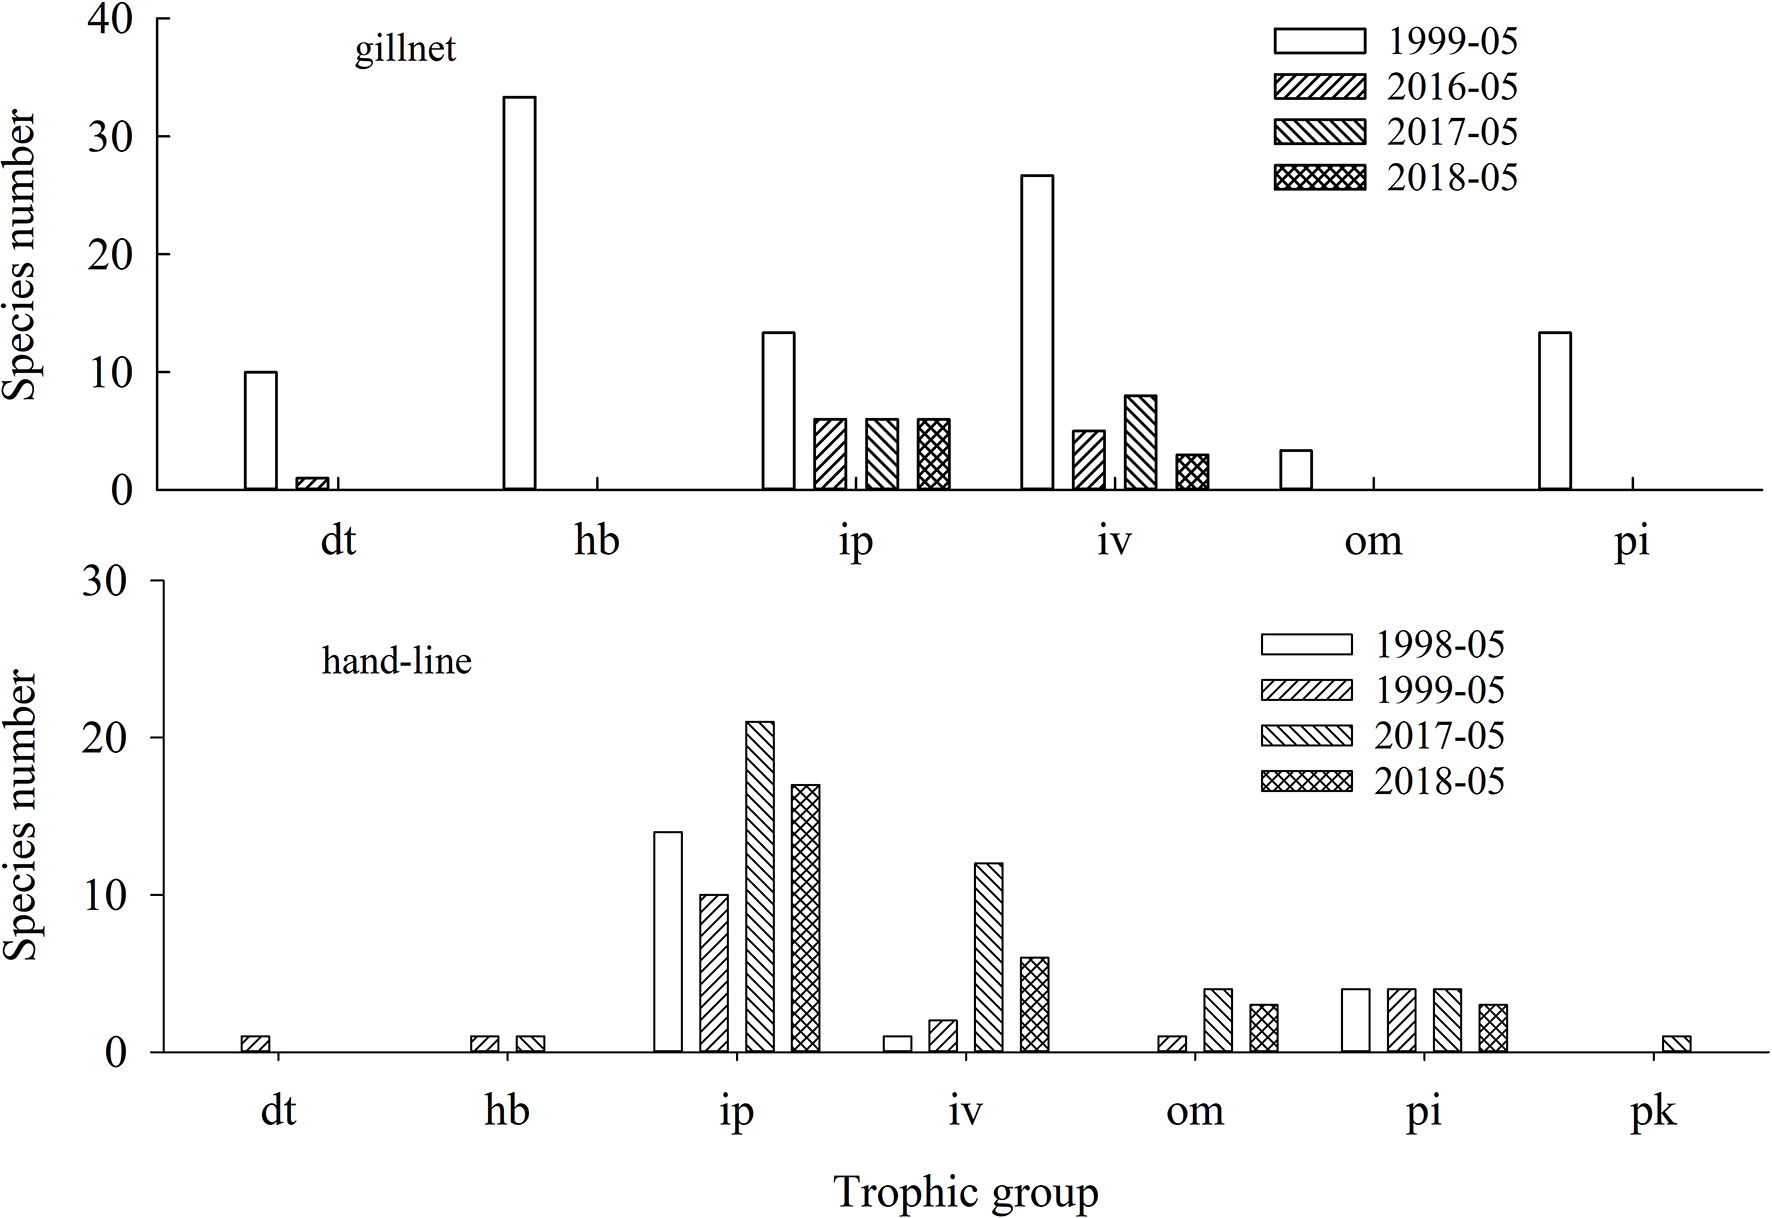
Figure 3 Species number of different trophic fish in the lagoon of Meiji Reef in the South China Sea between 1998—1999 and 2016—2018. The dt, hb, ip, iv, om, pi and pk mean detritivores, herbivores, piscivores, invertebrate feeders, omnivores, invertebrate feeder & piscivores, and planktivores, respectively.
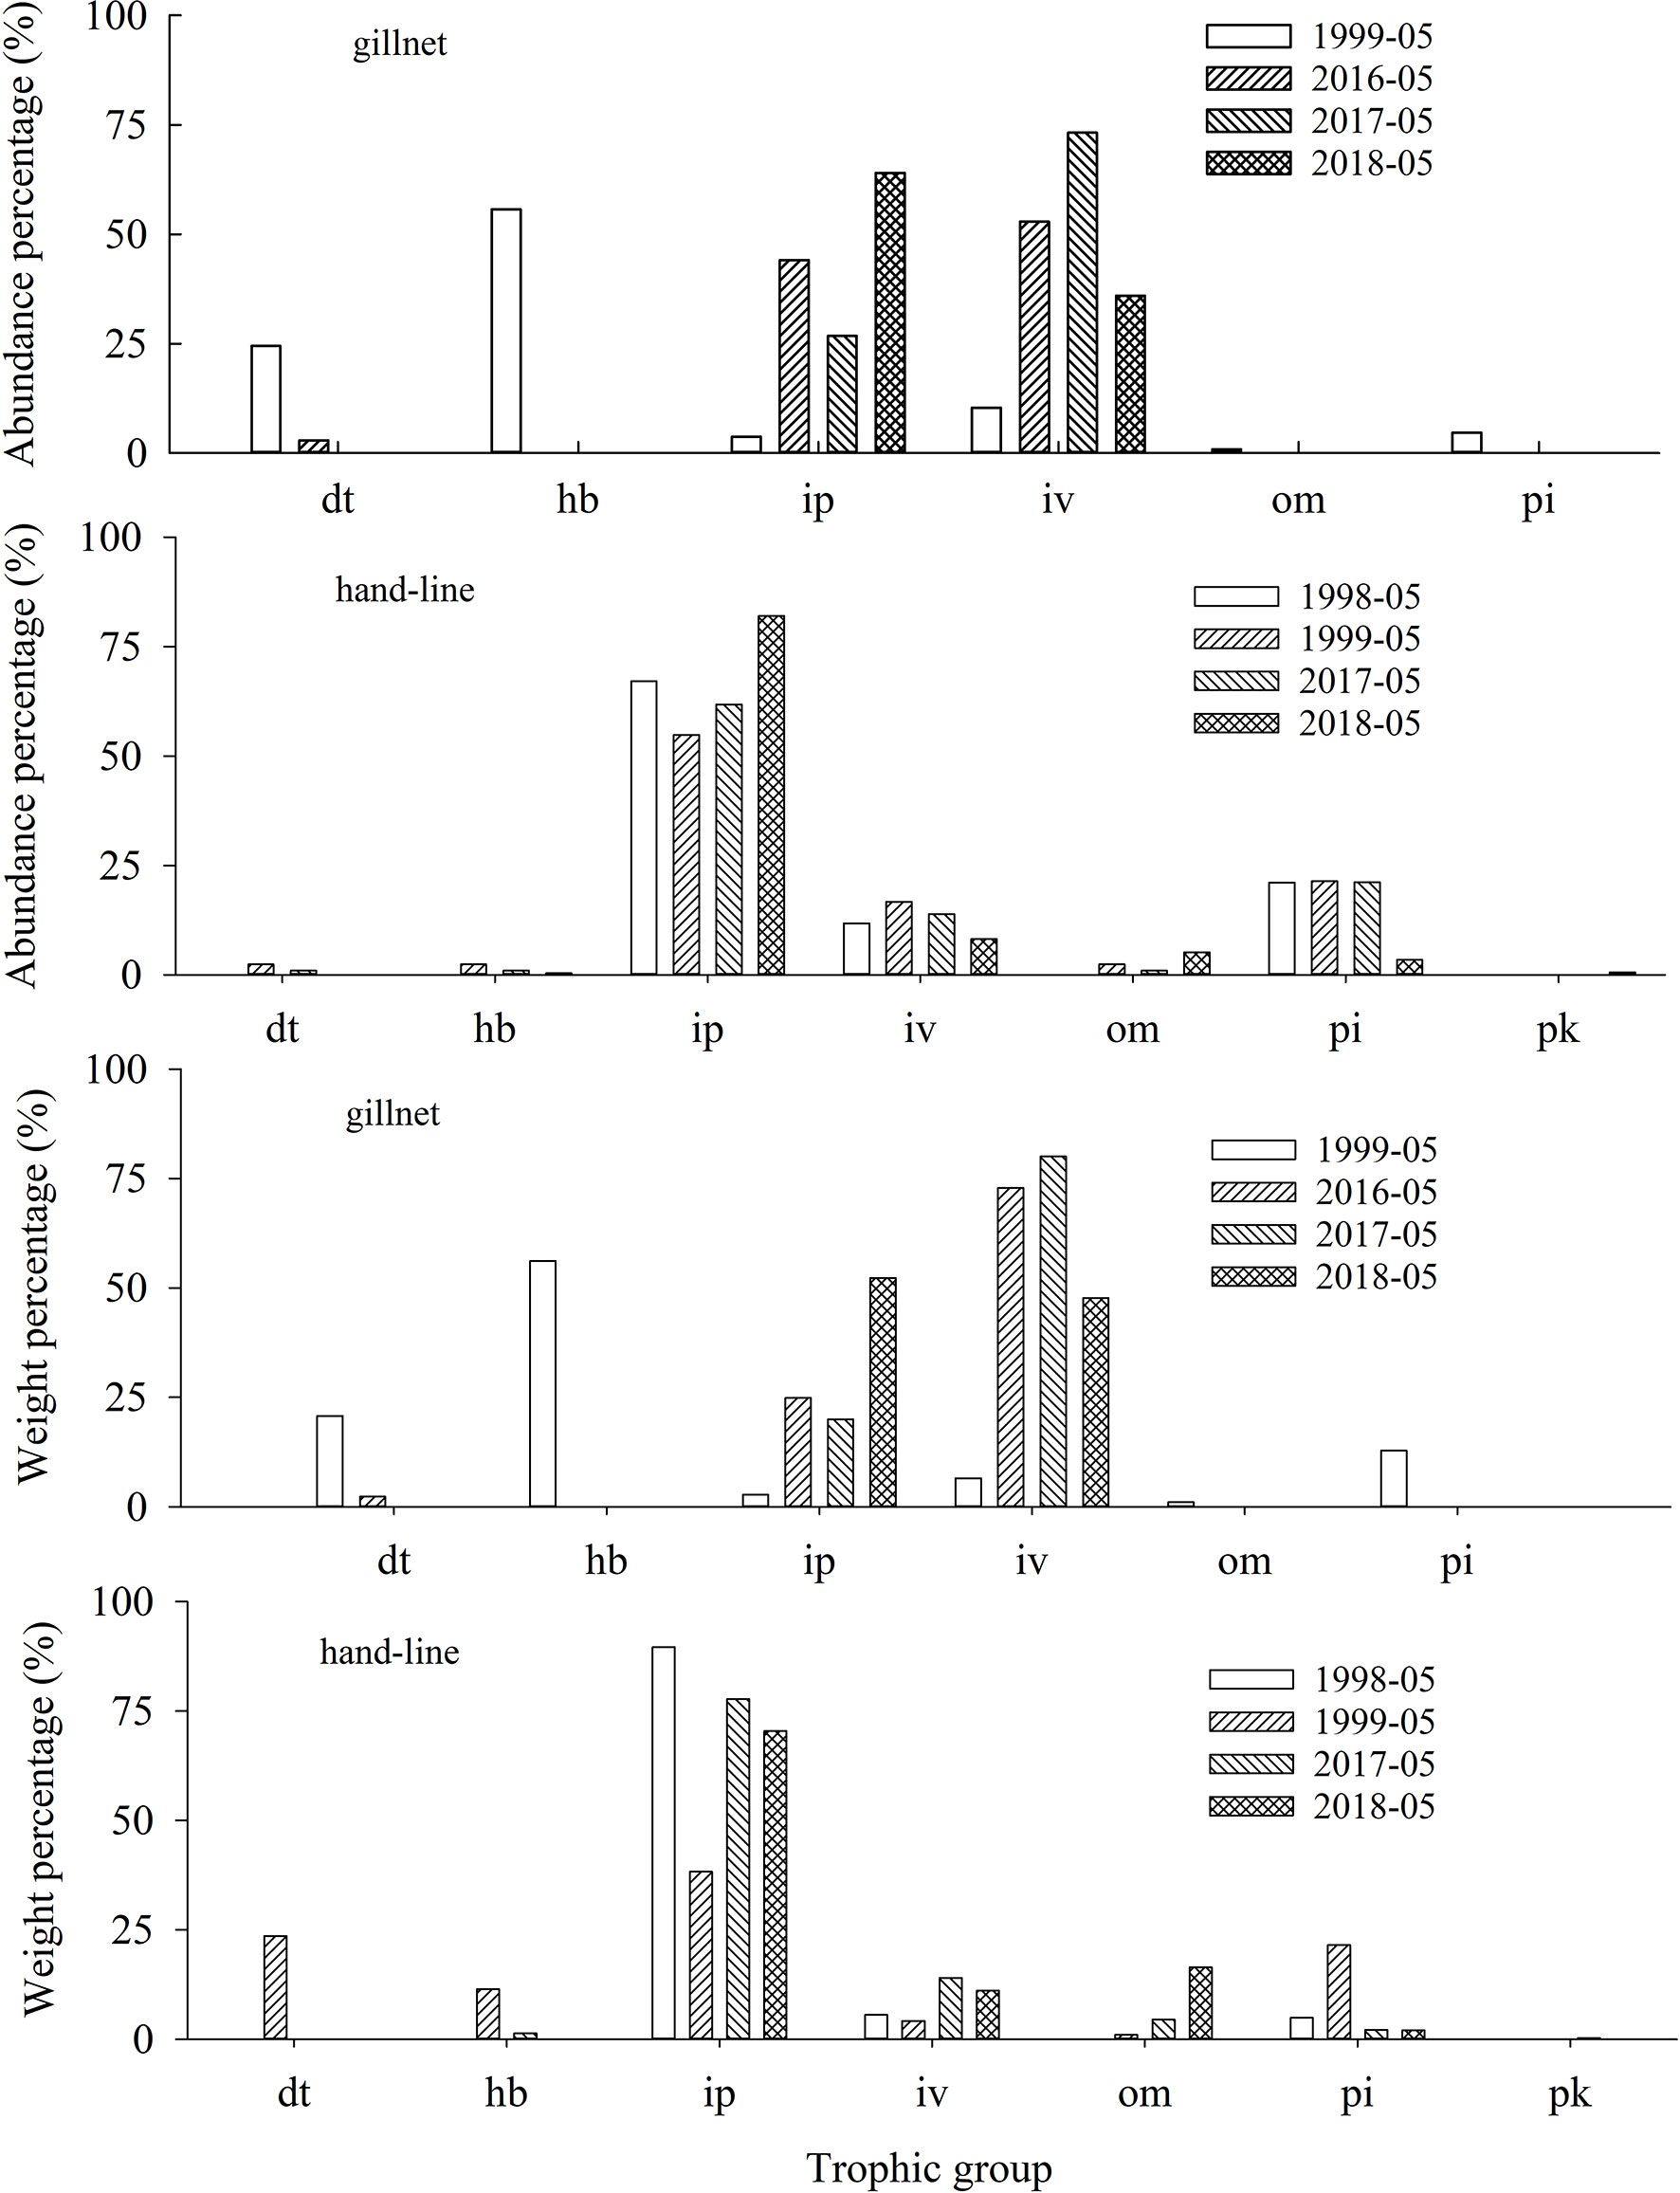
Figure 4 Abundance and weight percentage of different trophic fish in the lagoon of Meiji Reef in the South China Sea between 1998—1999 and 2016—2018. The dt, hb, ip, iv, om, pi and pk mean detritivores, herbivores, piscivores, invertebrate feeders, omnivores, invertebrate feeder & piscivores, and planktivores, respectively.
The species number and weight percentages of hb, pi and dt fish had a significantly decline from 1998—1999/2016—2018 (ANOVA, p< 0.01). The hb fish saw the biggest decline. However, there was a noticeable rise in the species number and weight percentages of om and iv fish from 1998—1999/2016—2018. For example, from 1999 to 2018, the species number percentages of om fish increased from 5.3% to 10.3%, and the corresponding weight percentages increased from 1.0% to 16.4%. Notably, the species richness, frequency and weight of pk fish was very low.
Regarding fish size, the species number percentages of large-sized fishes in 1998—1999 were significantly larger than that in 2016—2018 (ANOVA, p< 0.01) (Figure 5).
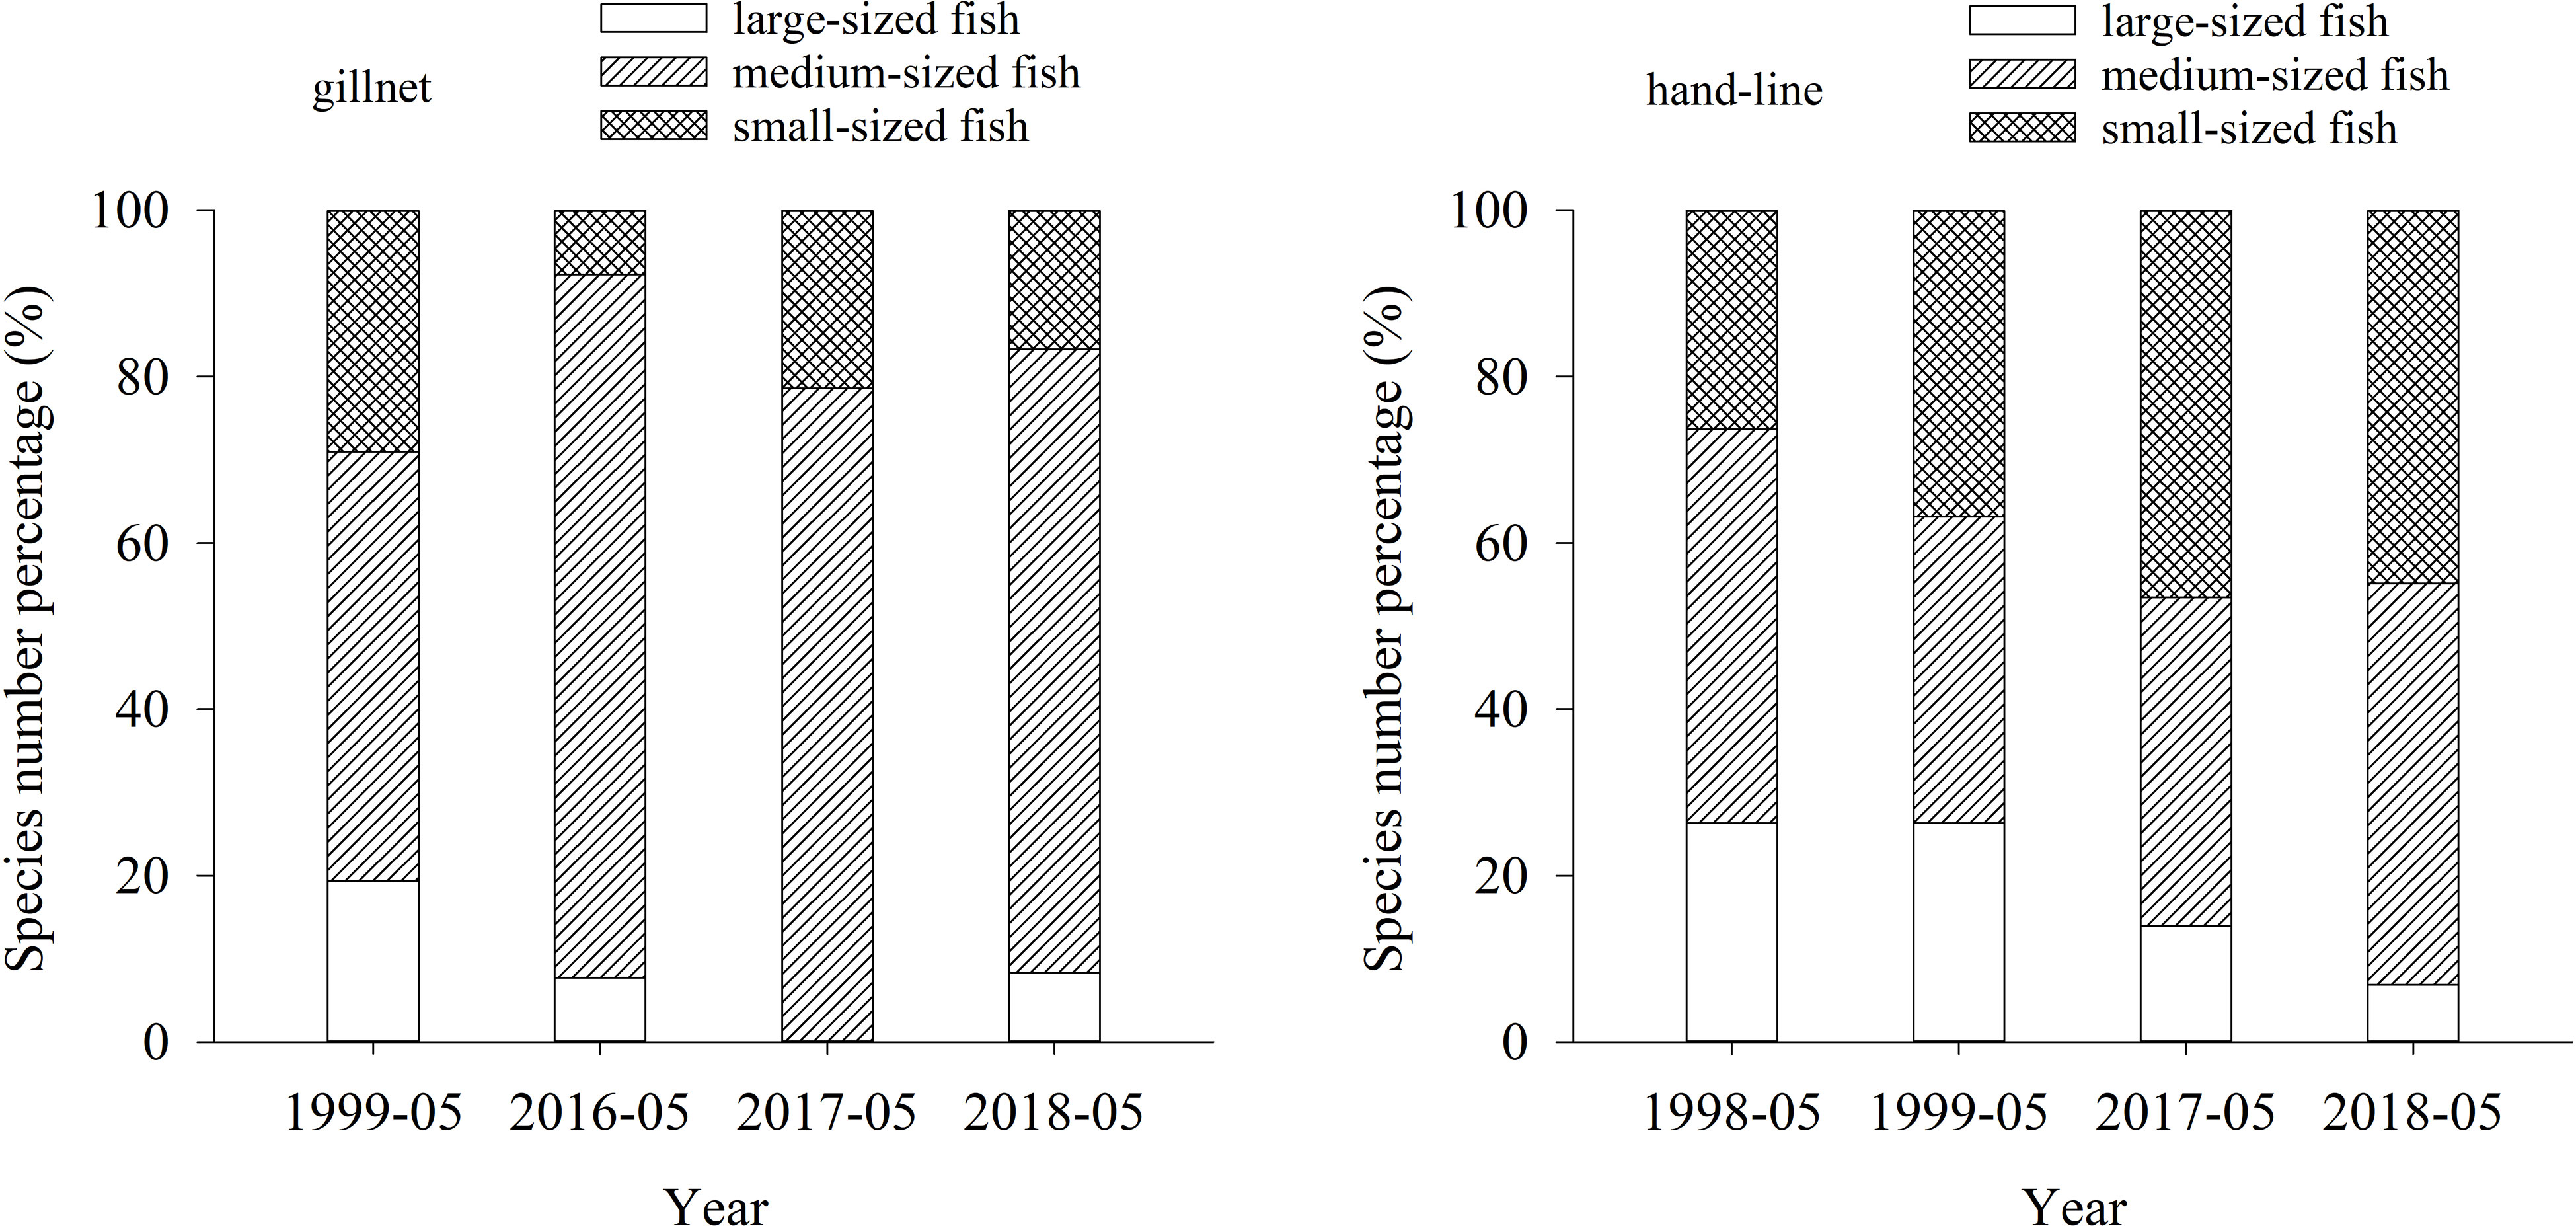
Figure 5 Distribution of fish size in the lagoon of Meiji Reef in the South China Sea between 1998—1999 and 2016—2018.
Disappeared fishes
According to survey period, we divided fish specimens into two groups (1998—1999 and 2012—2018) and found 64 fish species in 1998—1999, of which 32 were not present in 2012—2018 (Table 3). These disappeared fish included 14 families, with marked reductions in fish of Scaridae, Siganidae and Lethrinidae, and the composition of their diet, vulnerability, resilience and economic availability of these disappeared fish species was presented in the Figure 6.
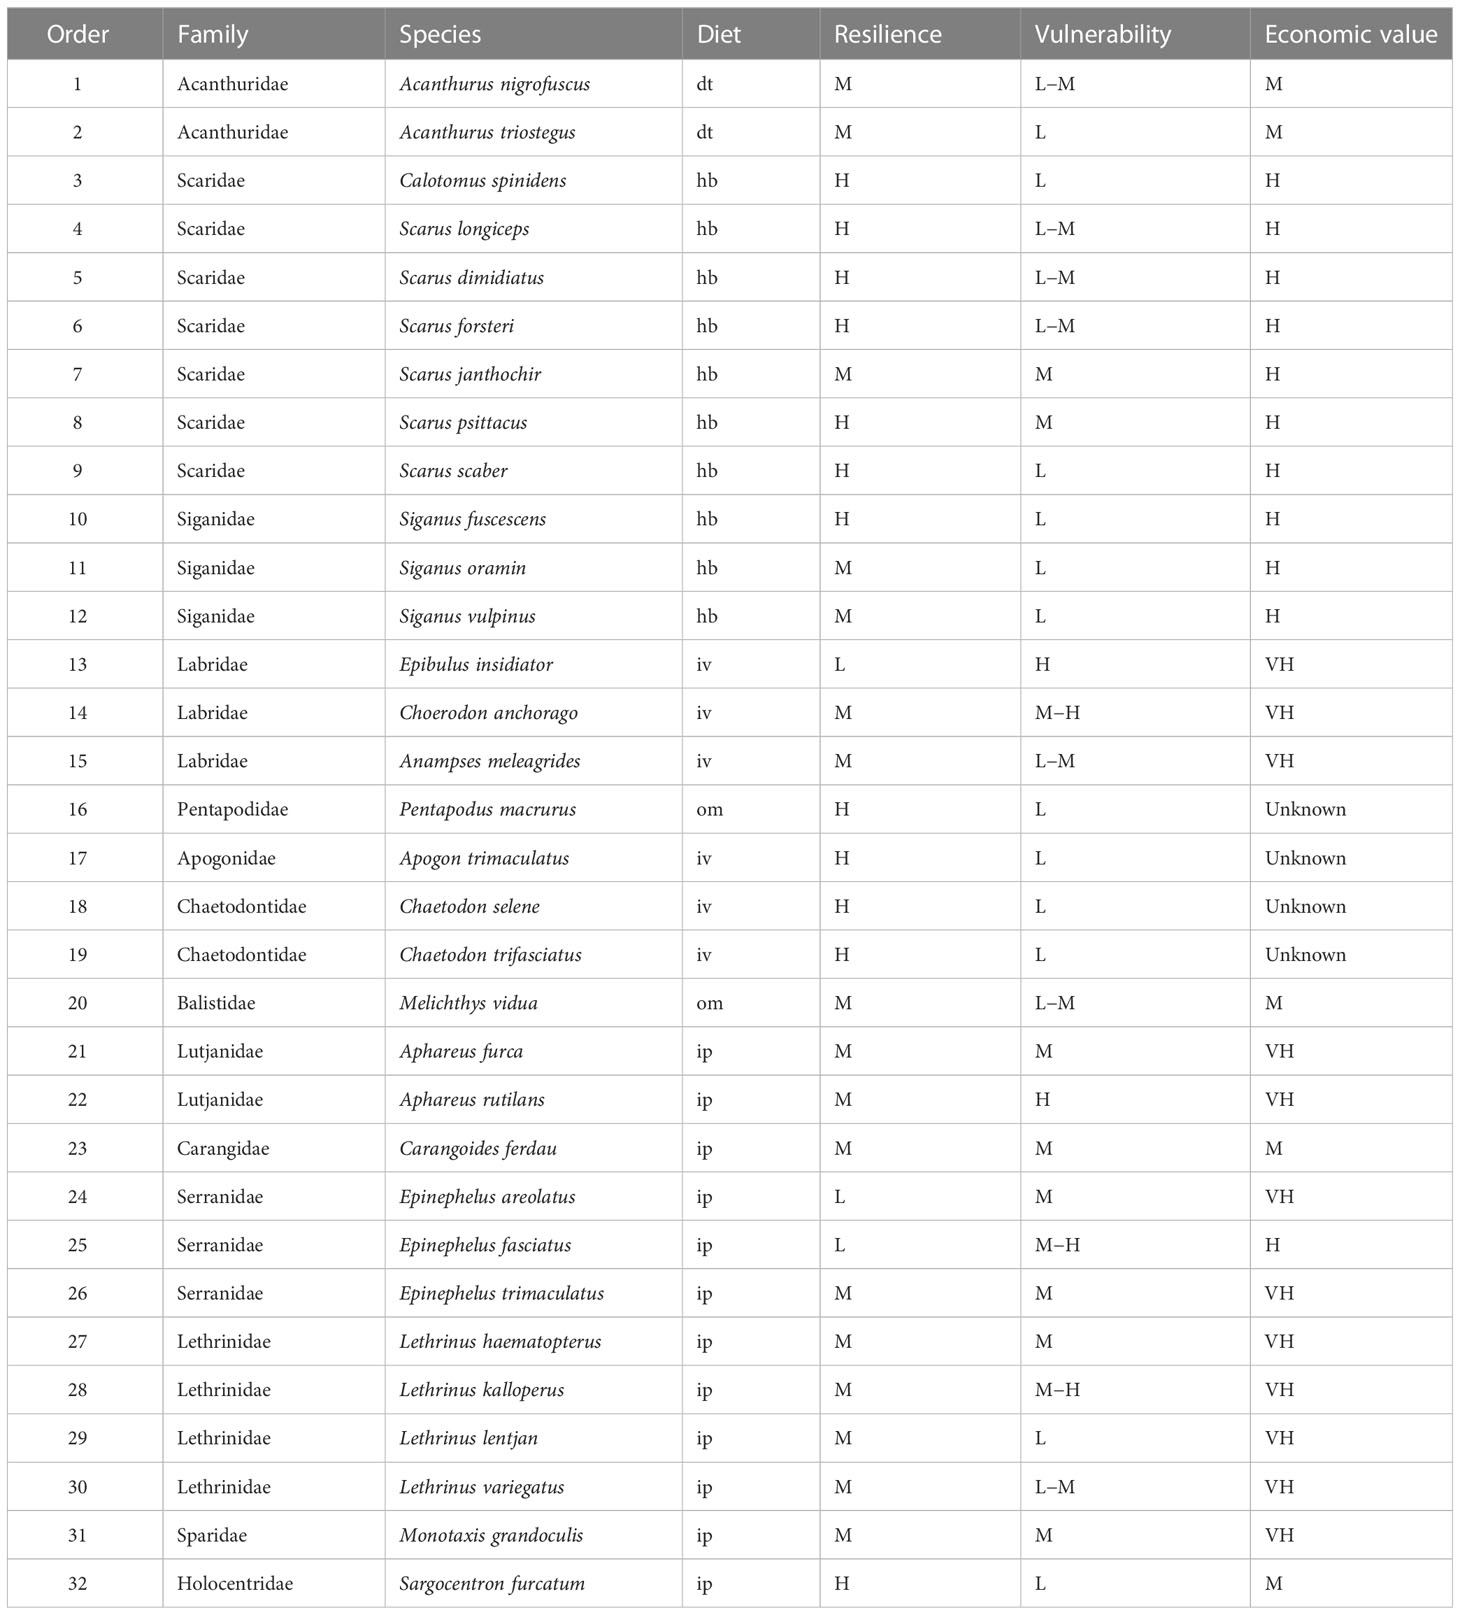
Table 3 32 fish sampled in 1998—1999 from the lagoon of Meiji Reef were not detected in 2012—2018.
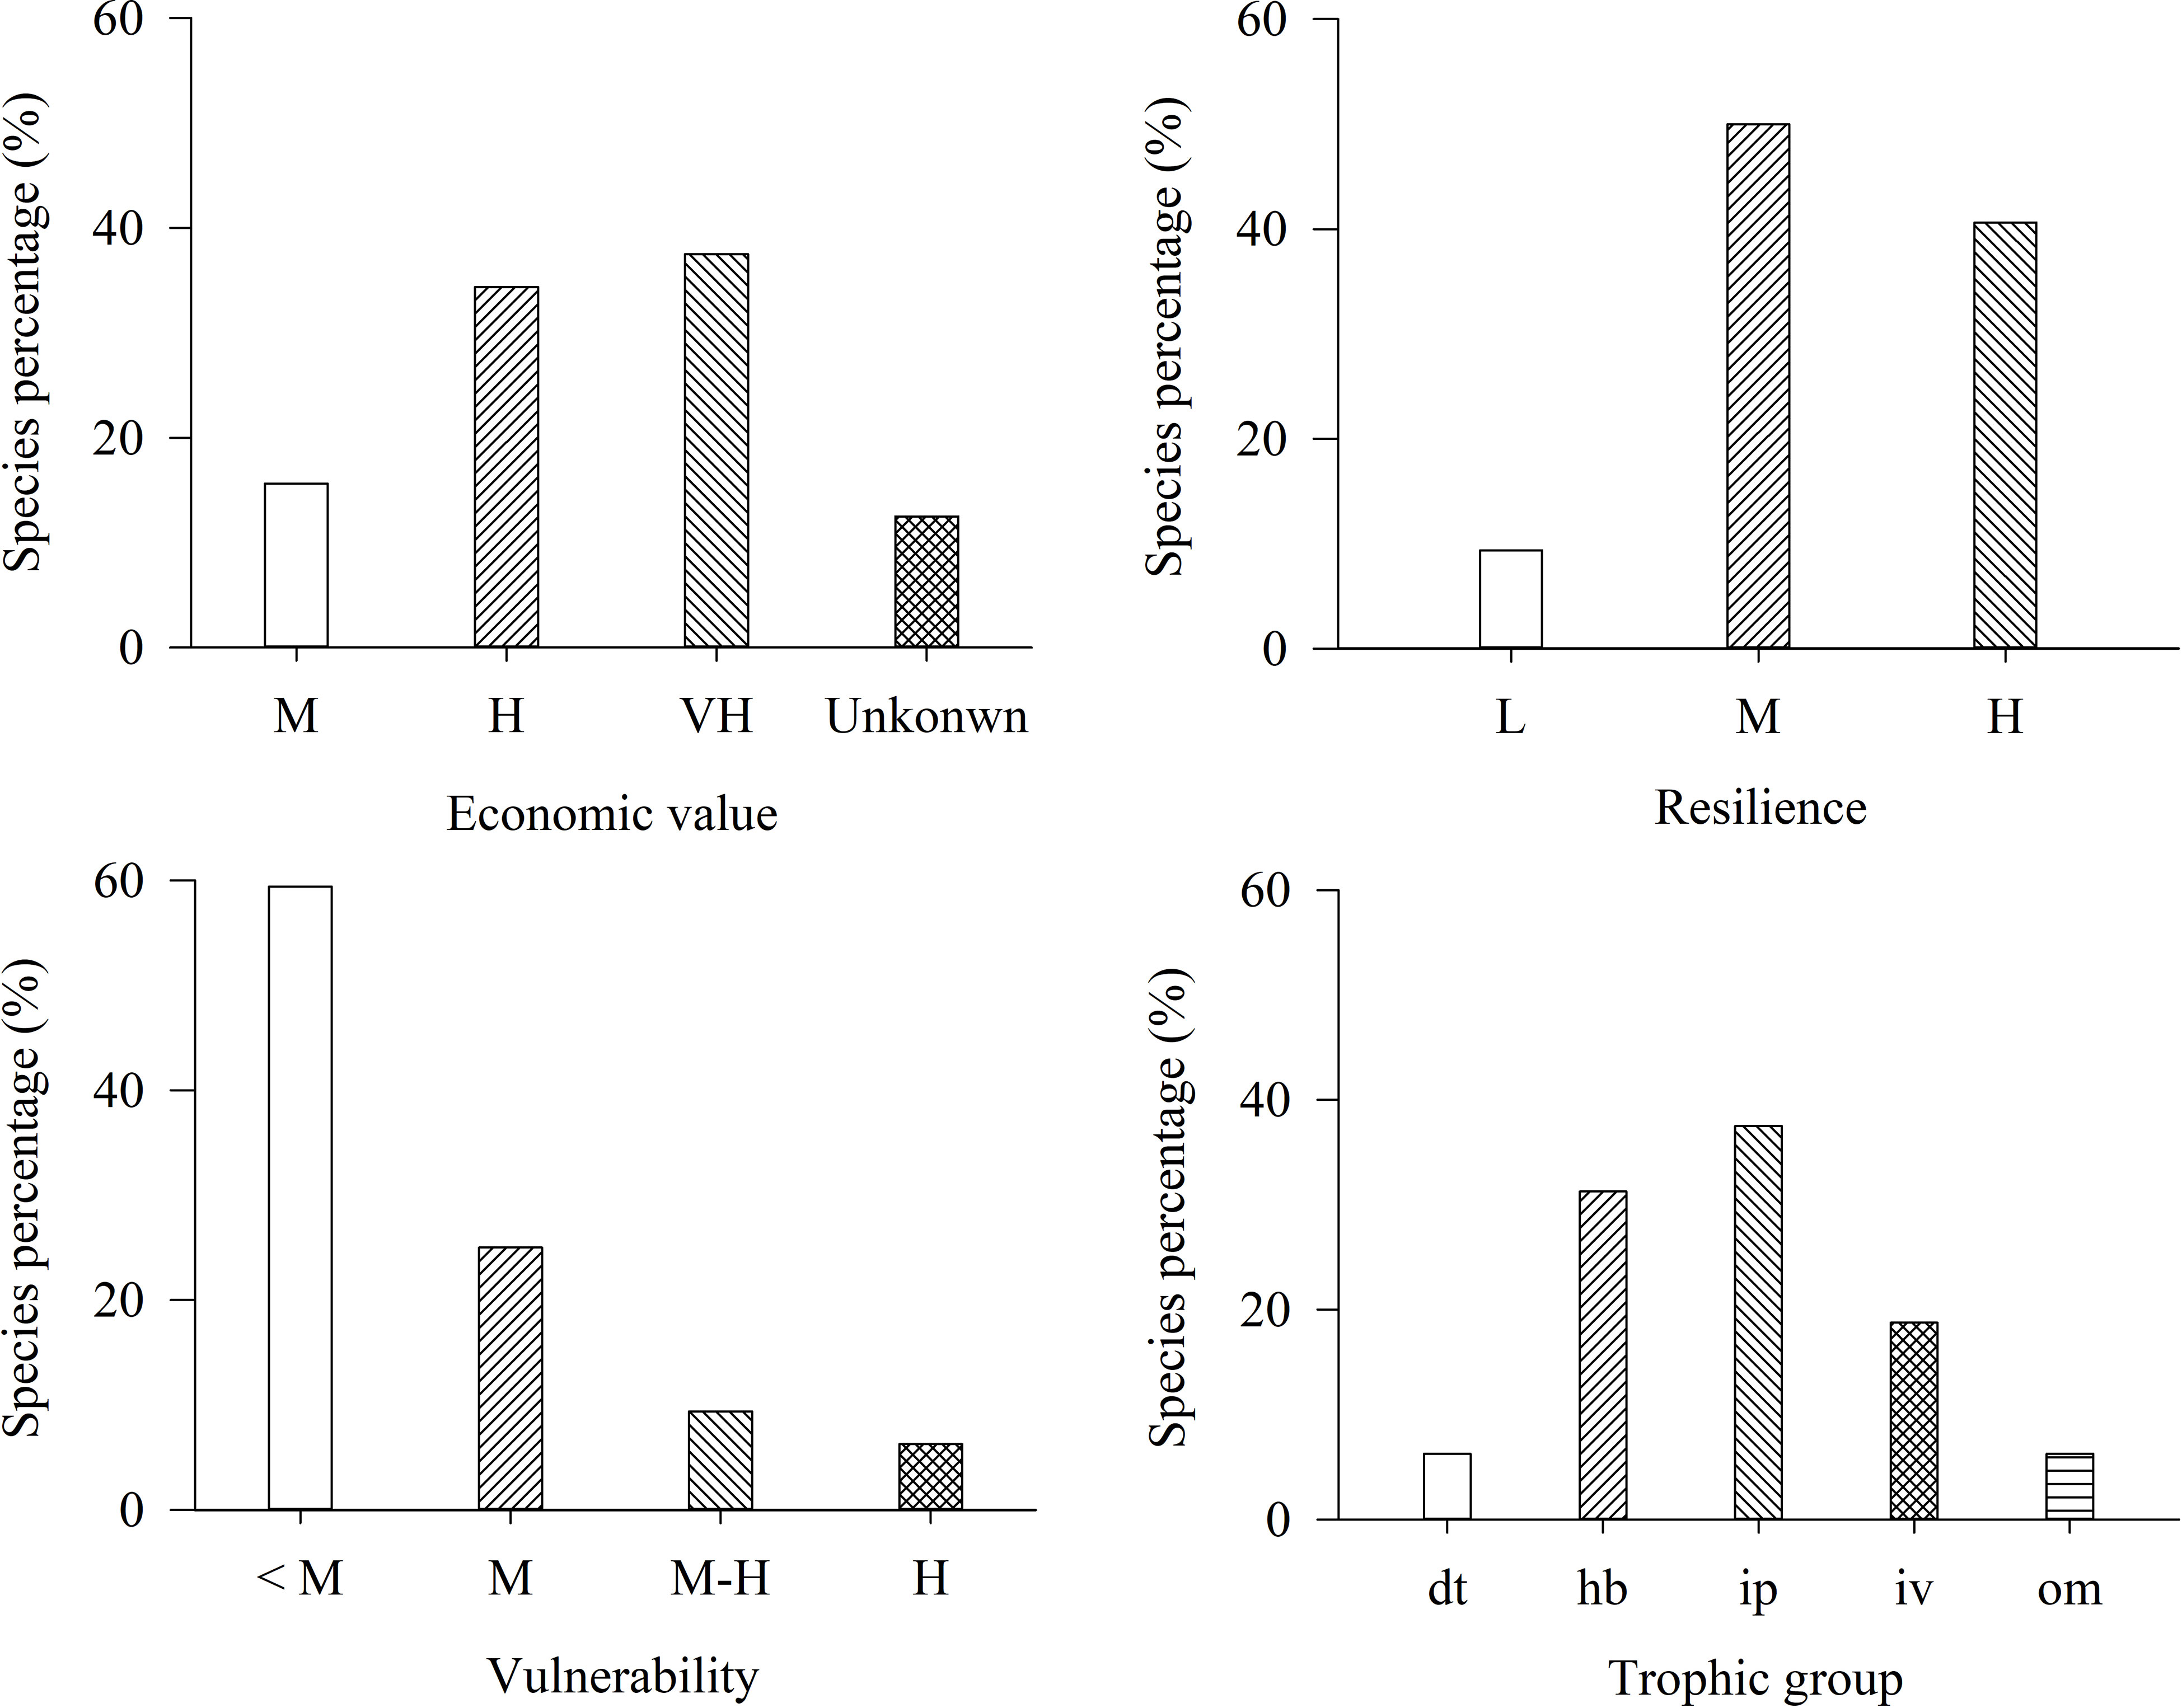
Figure 6 Composition of economic value, resilience, vulnerability and trophic group of 32 fish appearing in 1998—1999 but not in 2012—2018 in the lagoon of Meiji Reef. The dt, hb, ip, iv, and om mean detritivores, herbivores, piscivores, invertebrate feeders, and omnivores respectively. The L, M, M-H, H, and VH mean low, moderate, moderate-high, high, and very high levels, respectively.
Among disappeared fish, hb and ip fish accounted for the highest percentages. Species with high resilience and species with low vulnerability accounted for the highest percentages of disappeared fish, suggesting that high resilience and low vulnerability did not prevent disappearance. Very high and high-value species accounted for 34.37% and 37.50% of disappeared fish, respectively, indicating that the higher the economic value of fish, the higher the disappearance risk.
Contingency table analysis indicated that economic value was significantly associated with the disappearance of fish (p< 0.01). The disappearance of high economic hb and ip fish was the most noticeable. There were no significant correlations between disappearance of fish and resilience and vulnerability (p > 0.05).
Among disappeared fish, medium-sized fish was the most abundant, accounting for 53.13%, followed by small-sized fish with 31.25%, and large-sized fish with 15.63% (Figure 7).
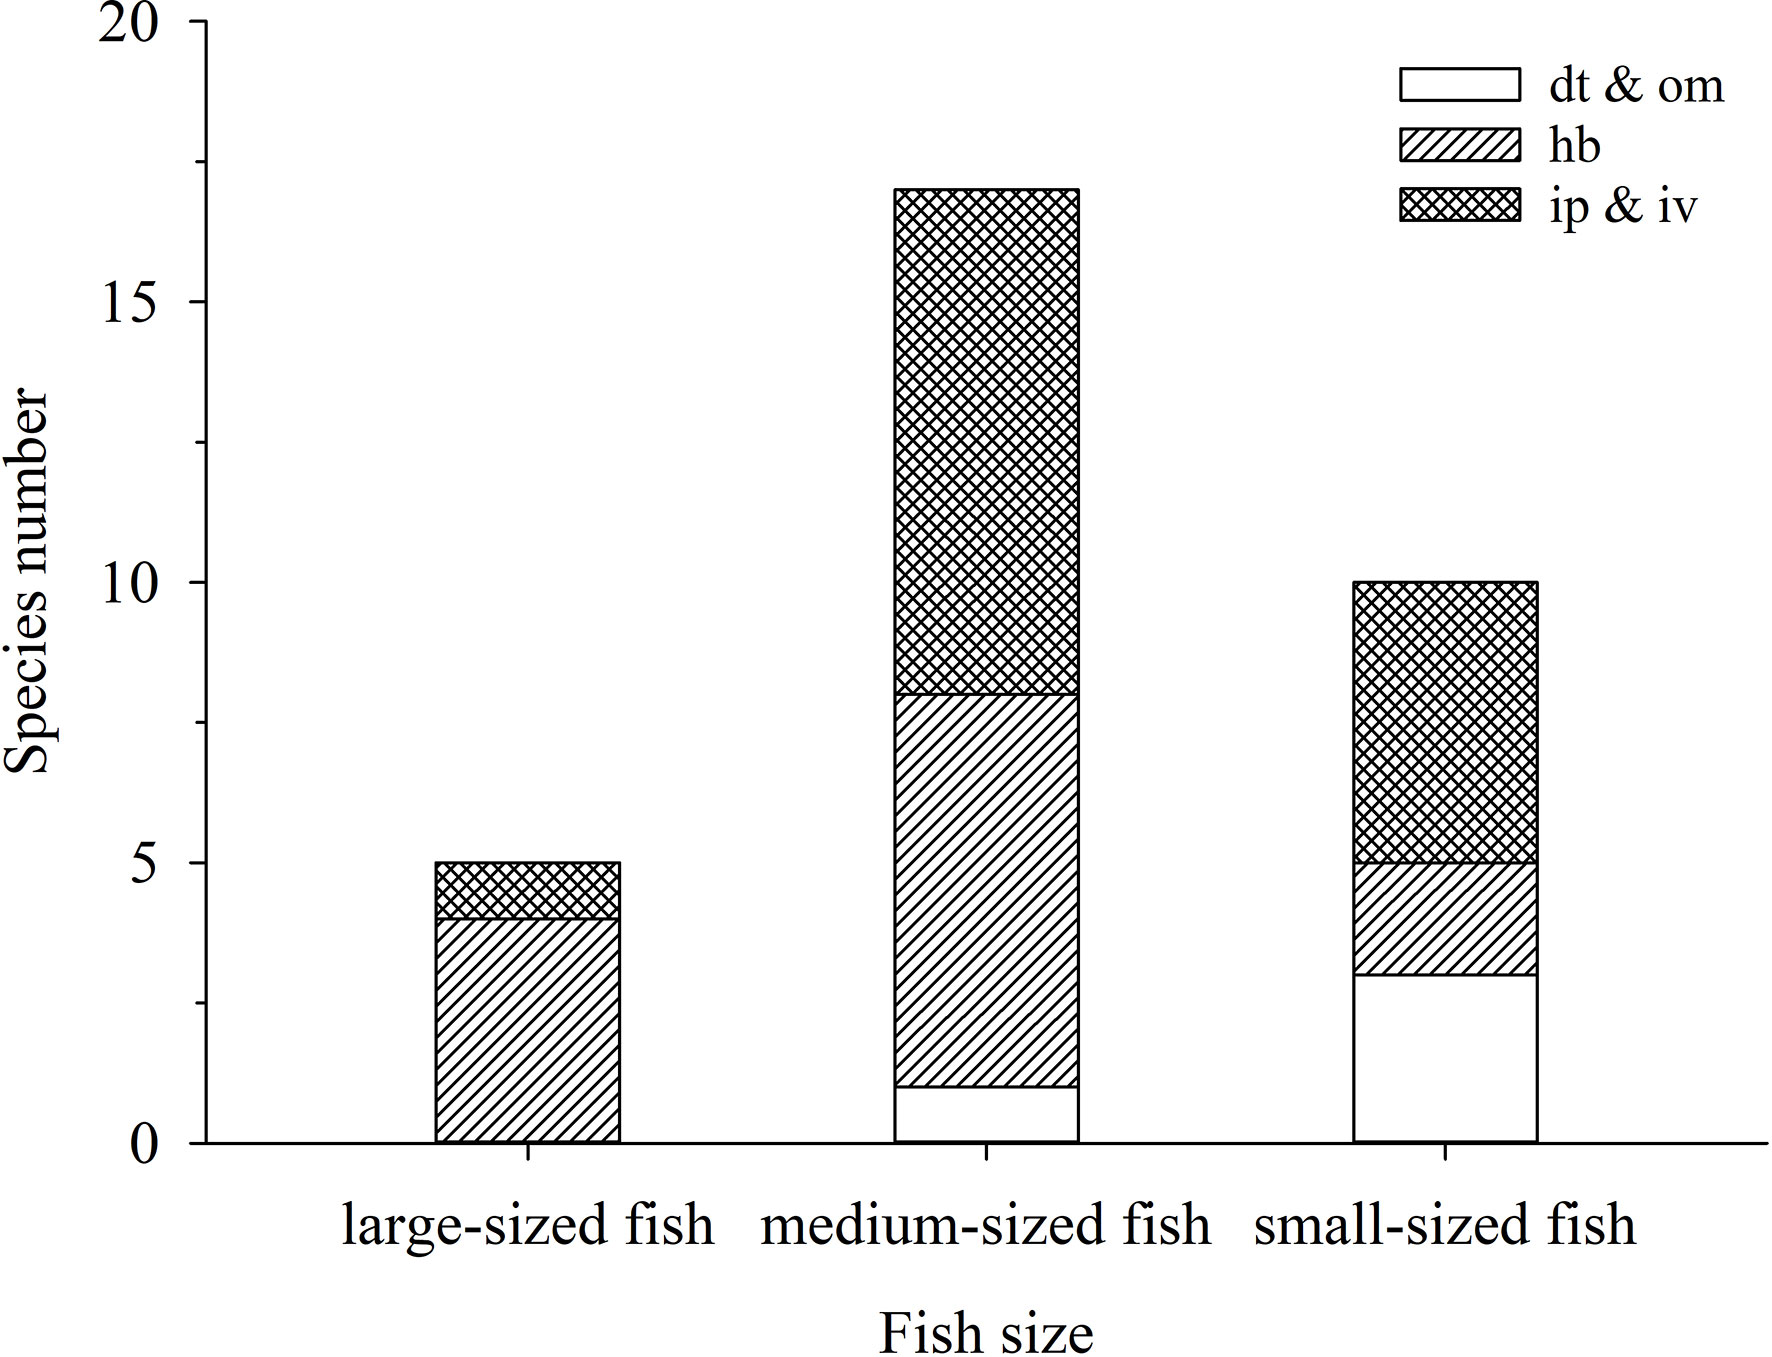
Figure 7 Composition of size and trophic group of 32 fish appearing in 1998—1999 but not in 2012—2018 in the lagoon of Meiji Reef. The dt, hb, ip, iv, and om mean detritivores, herbivores, piscivores, invertebrate feeders, and omnivores respectively.
Variations in weight and mean body weight of fish with high economic value
In gillnet and hand-line surveys, the mean body weight of very high & high-value fish in 1998—1999 was significantly larger than that in 2016—2018 (ANOVA, p< 0.01) (Figure 8). in gillnet surveys, the weight percentage of very high & high-value fish in 1999 was significantly larger than that in 2016—2018 (T-test, p< 0.01). In hand-line surveys, the weight percentage in 1999 has barely changed from the percentages in 2016—2018, which was attributed to the fact that hand-line has been selective in catching carnivorous high value fish (ANOVA, p > 0.01).
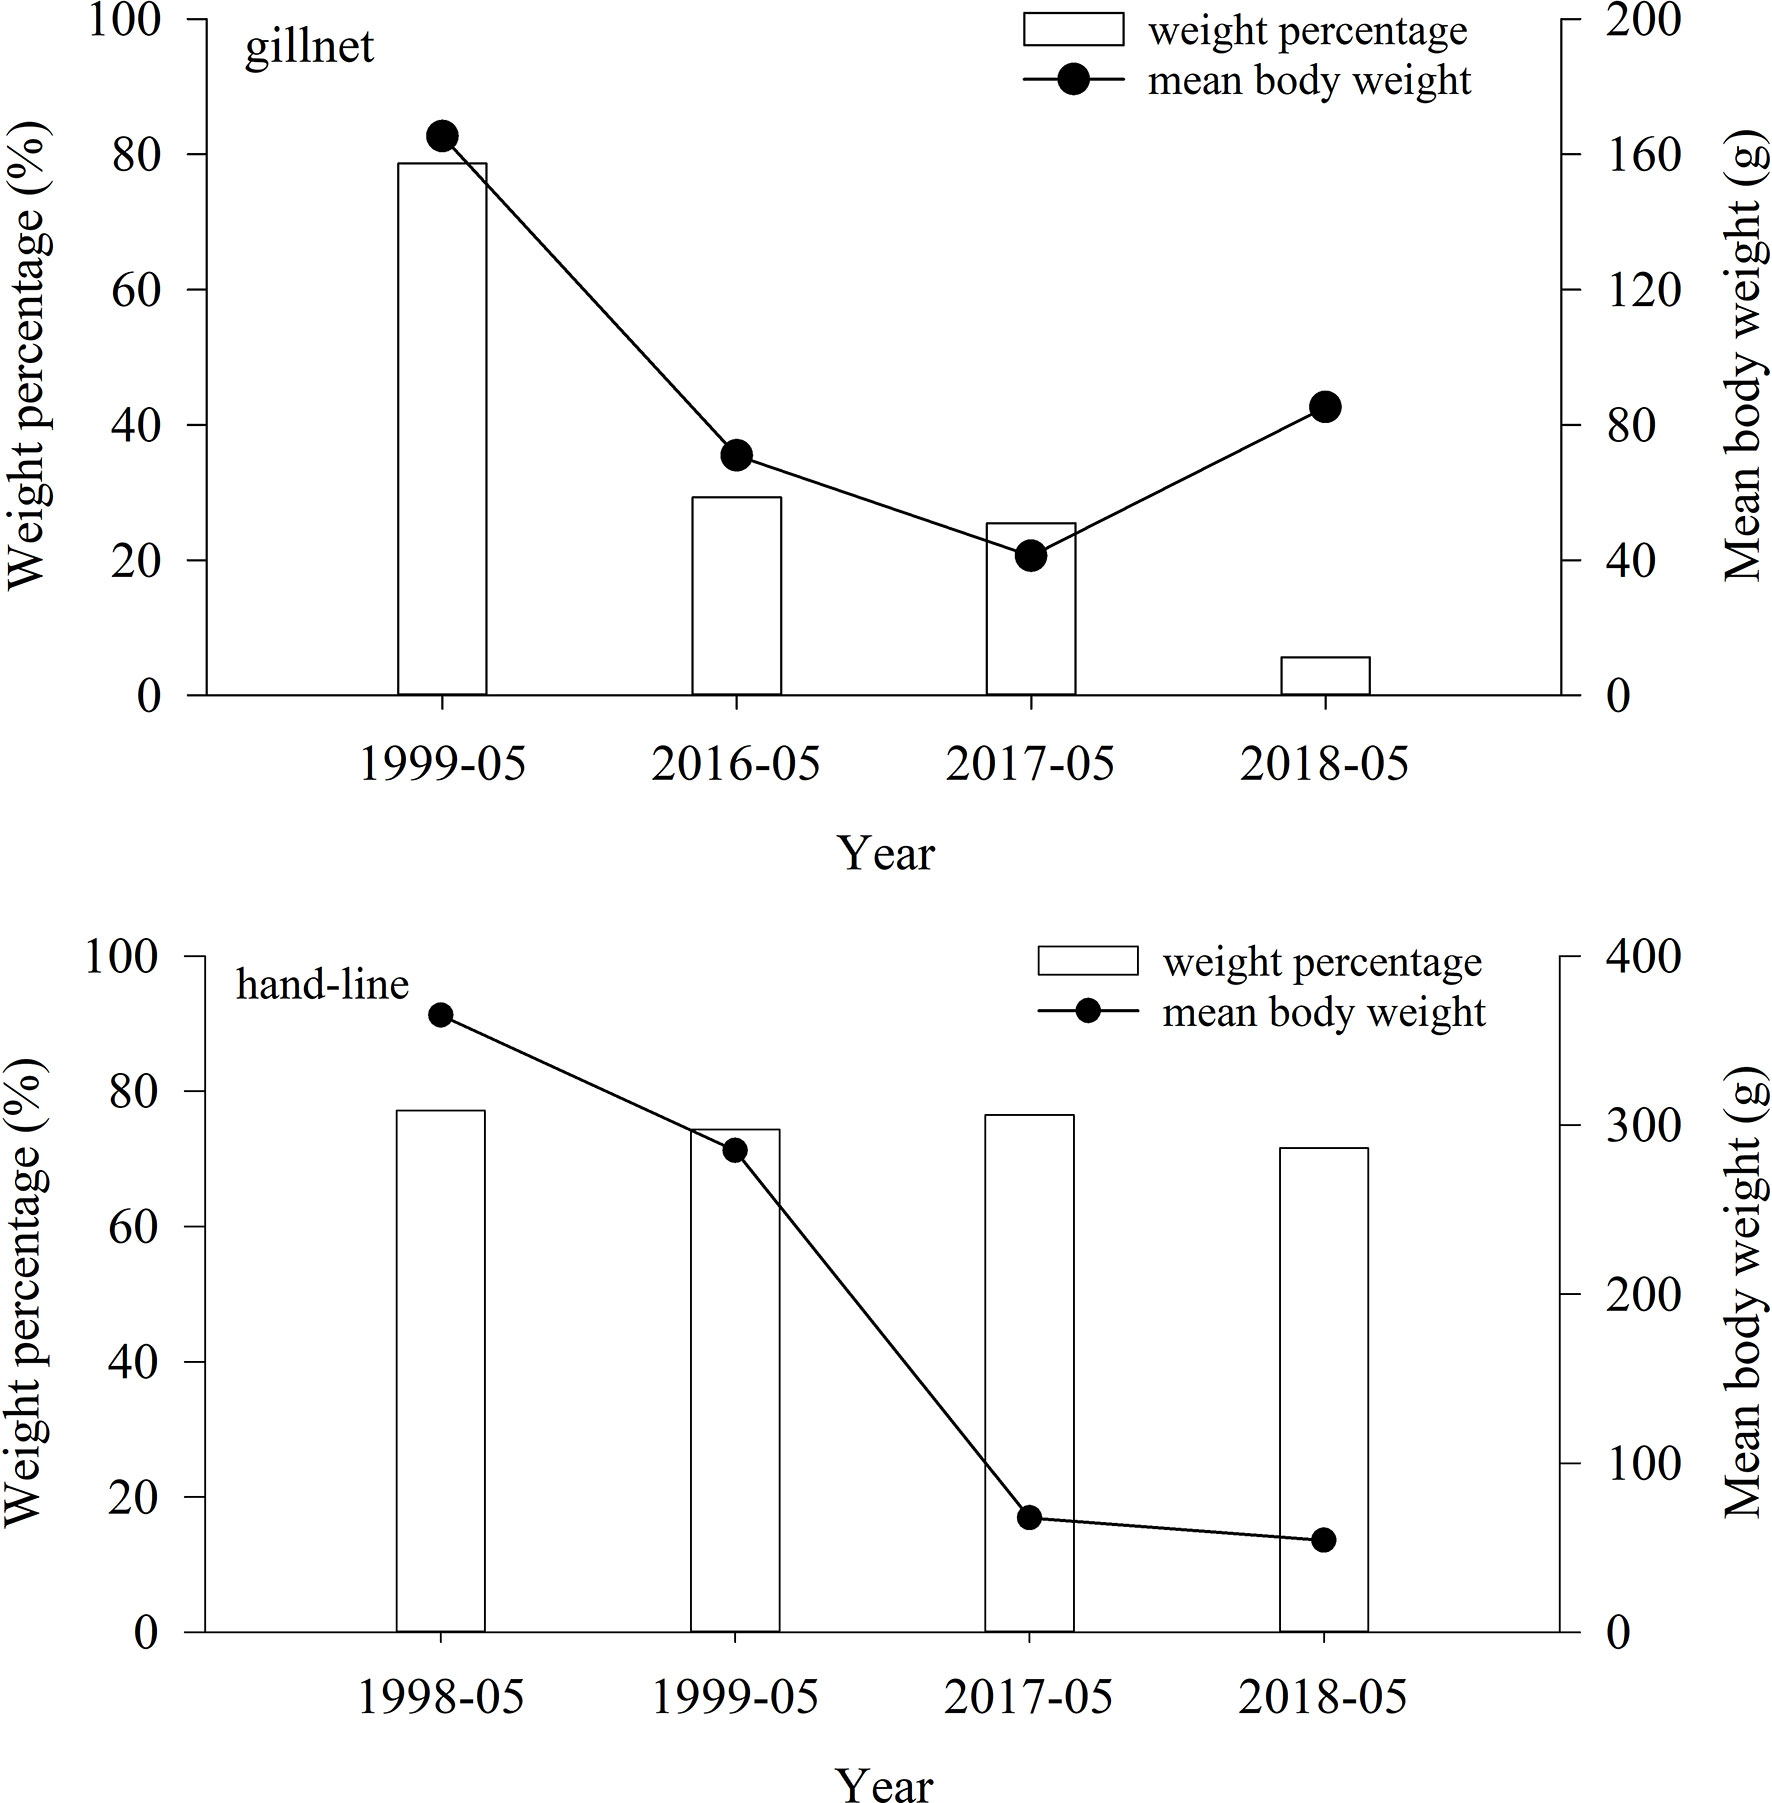
Figure 8 Variations in weight percentage and mean body weight of very high & high-value fish between 1998—1999 and 2016—2018 in the lagoon of Meiji Reef.
Effects of fishing effort and coral cover on fish
In the gillnet surveys, the percentages of species number and weight of hb fish in 1999 were 33.33% and 56.14%, respectively, while the percentages in 2016—2018 were all zero (Figure 9). Results of linear regression indicated that coral cover had the greater effect on the percentages of species number and weight of hb fish as compare to fishing power (Figure 9; Table 4).
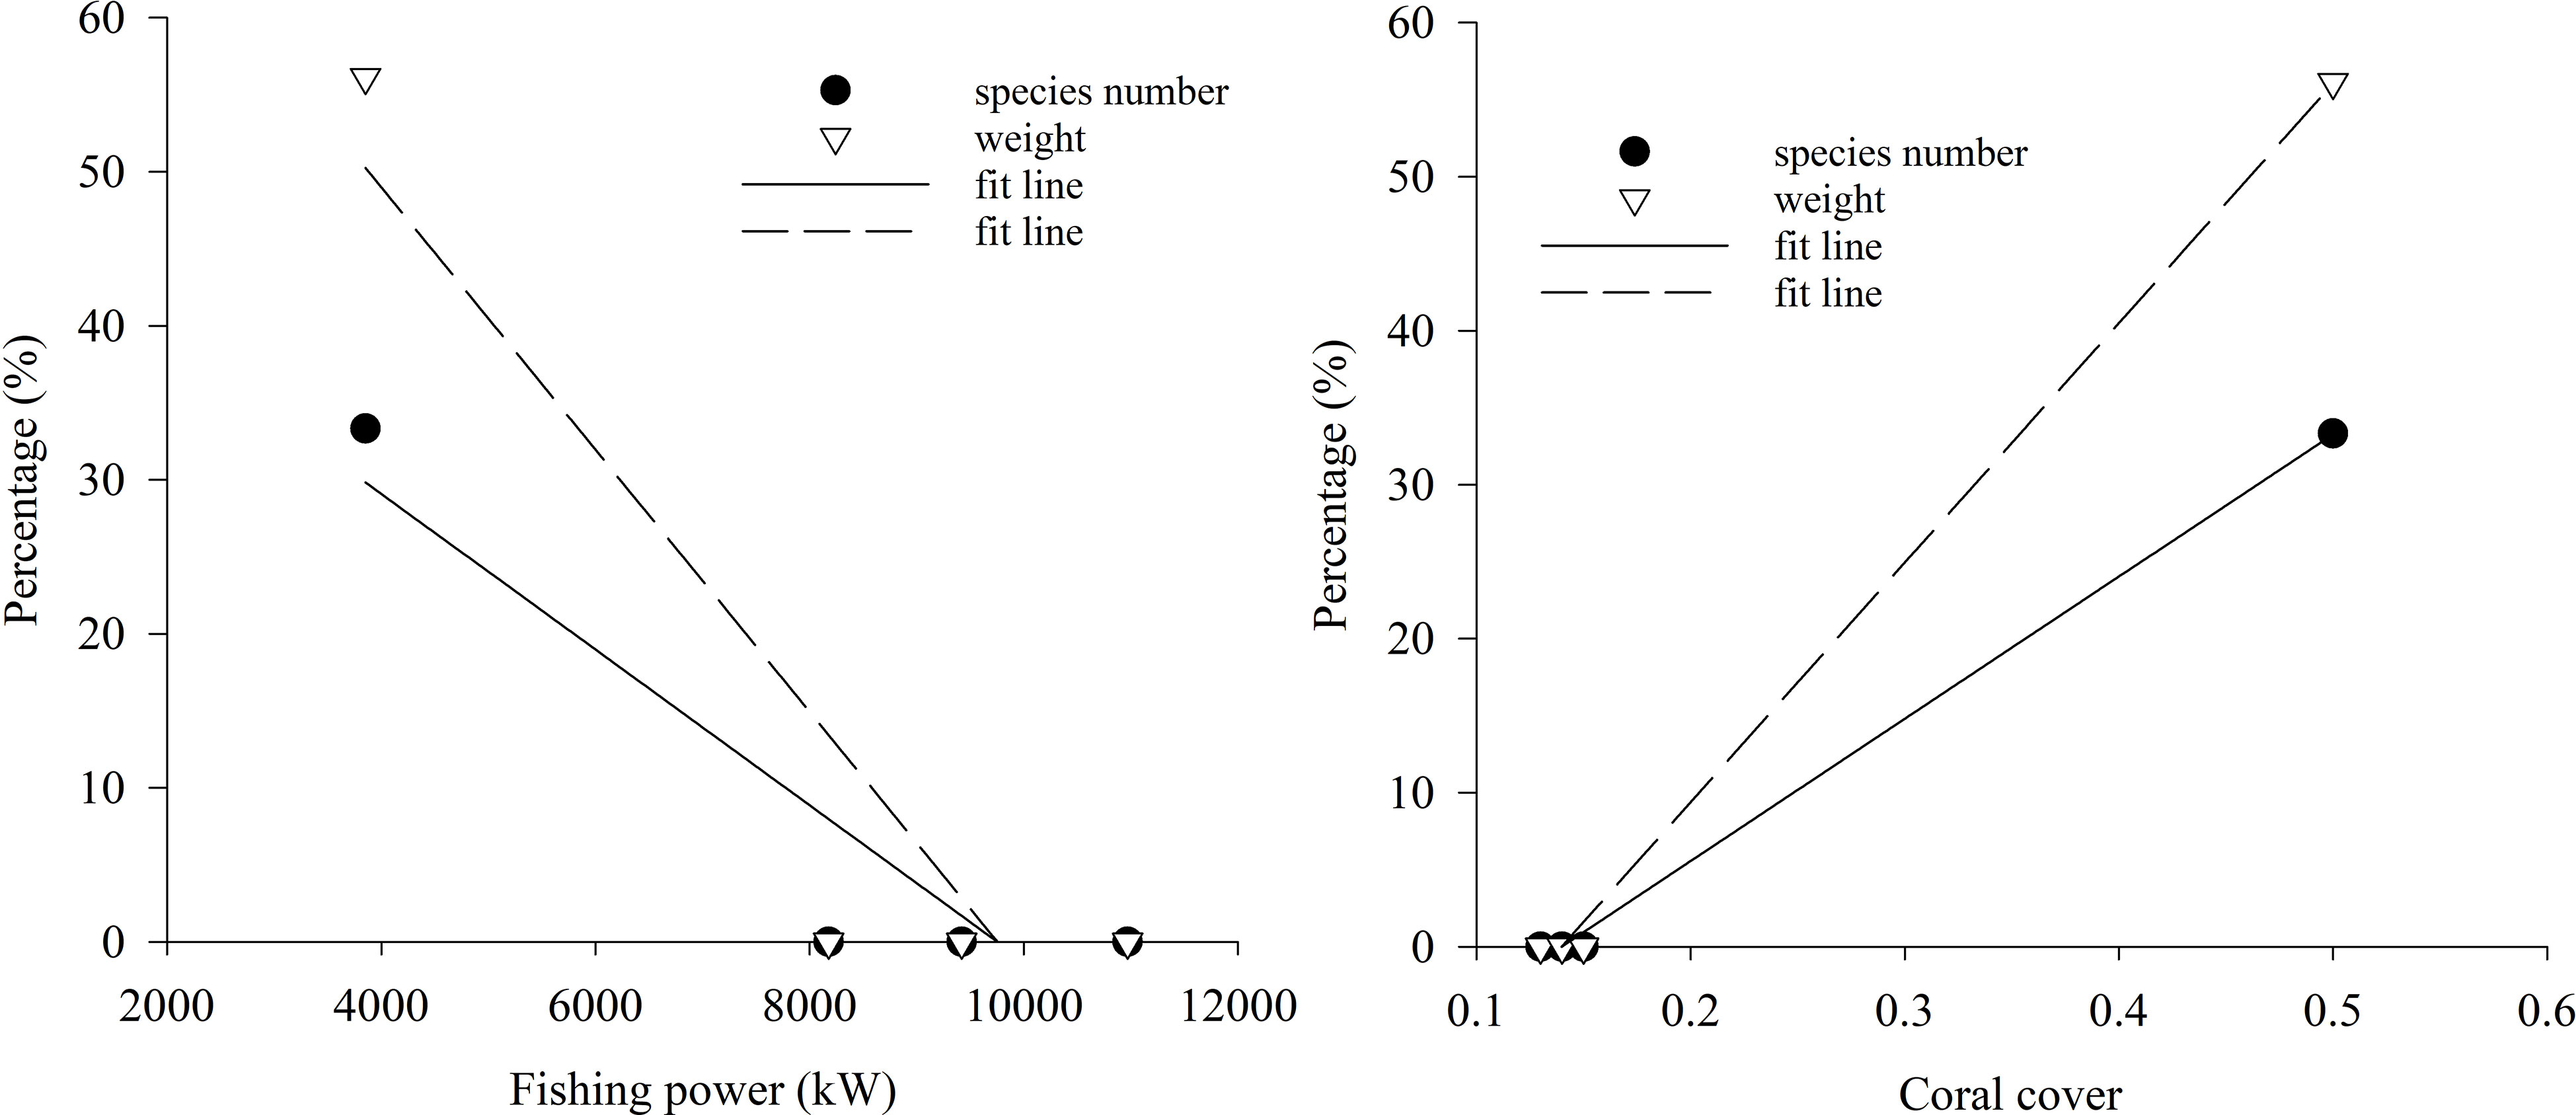
Figure 9 Scatter plot and linear fit between percentages of species number and weight of herbivorous fishes by gillnet in the lagoon of in Meiji Reef and fishing power and coral cover in 1999 and 2016—2018.
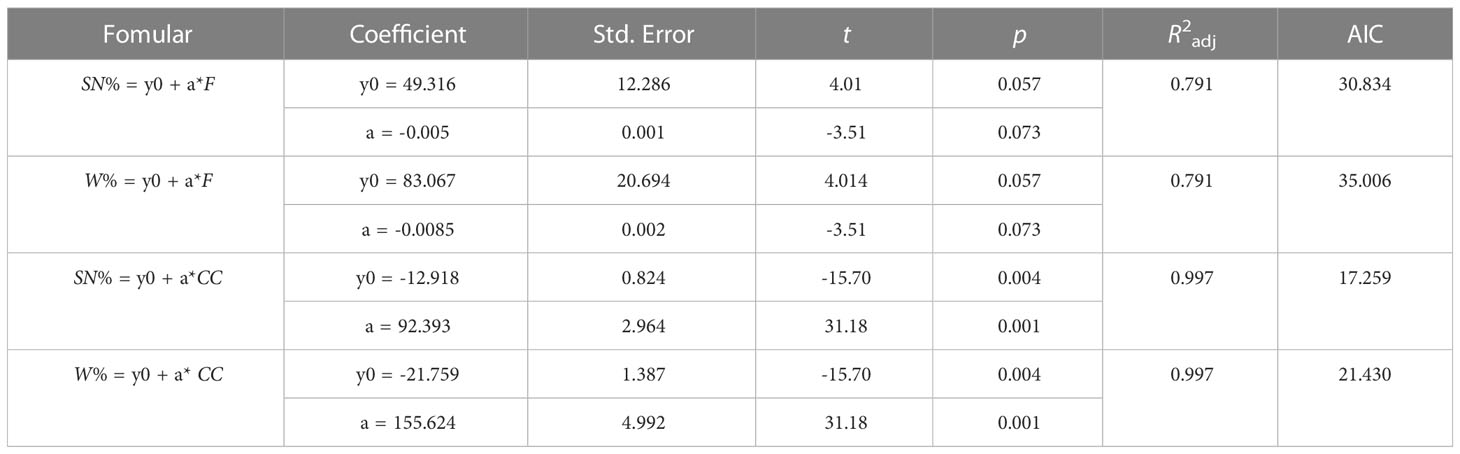
Table 4 Linear fit parameters between percentages of species number (SN) and weight (W) of herbivorous fishes by gillnet in the lagoon of in Meiji Reef and fishing power (F) and coral cover (CC).
In addition, results of linear regression indicated that coral cover had the greater effect on the weight percentage of very high & high-value fish as compare to fishing power in gillnet surveys (Figure 10; Table 5). The effect of coral cover on weight percentage of very high & high-value fish was more pronounced in gillnet surveys than in hand-line survey. Both fishing power and coral cover had significant effects on the mean body weight of high & high-value fish. Overall, coral cover had a larger impact than fishing power on the mean body weight (Table 5).
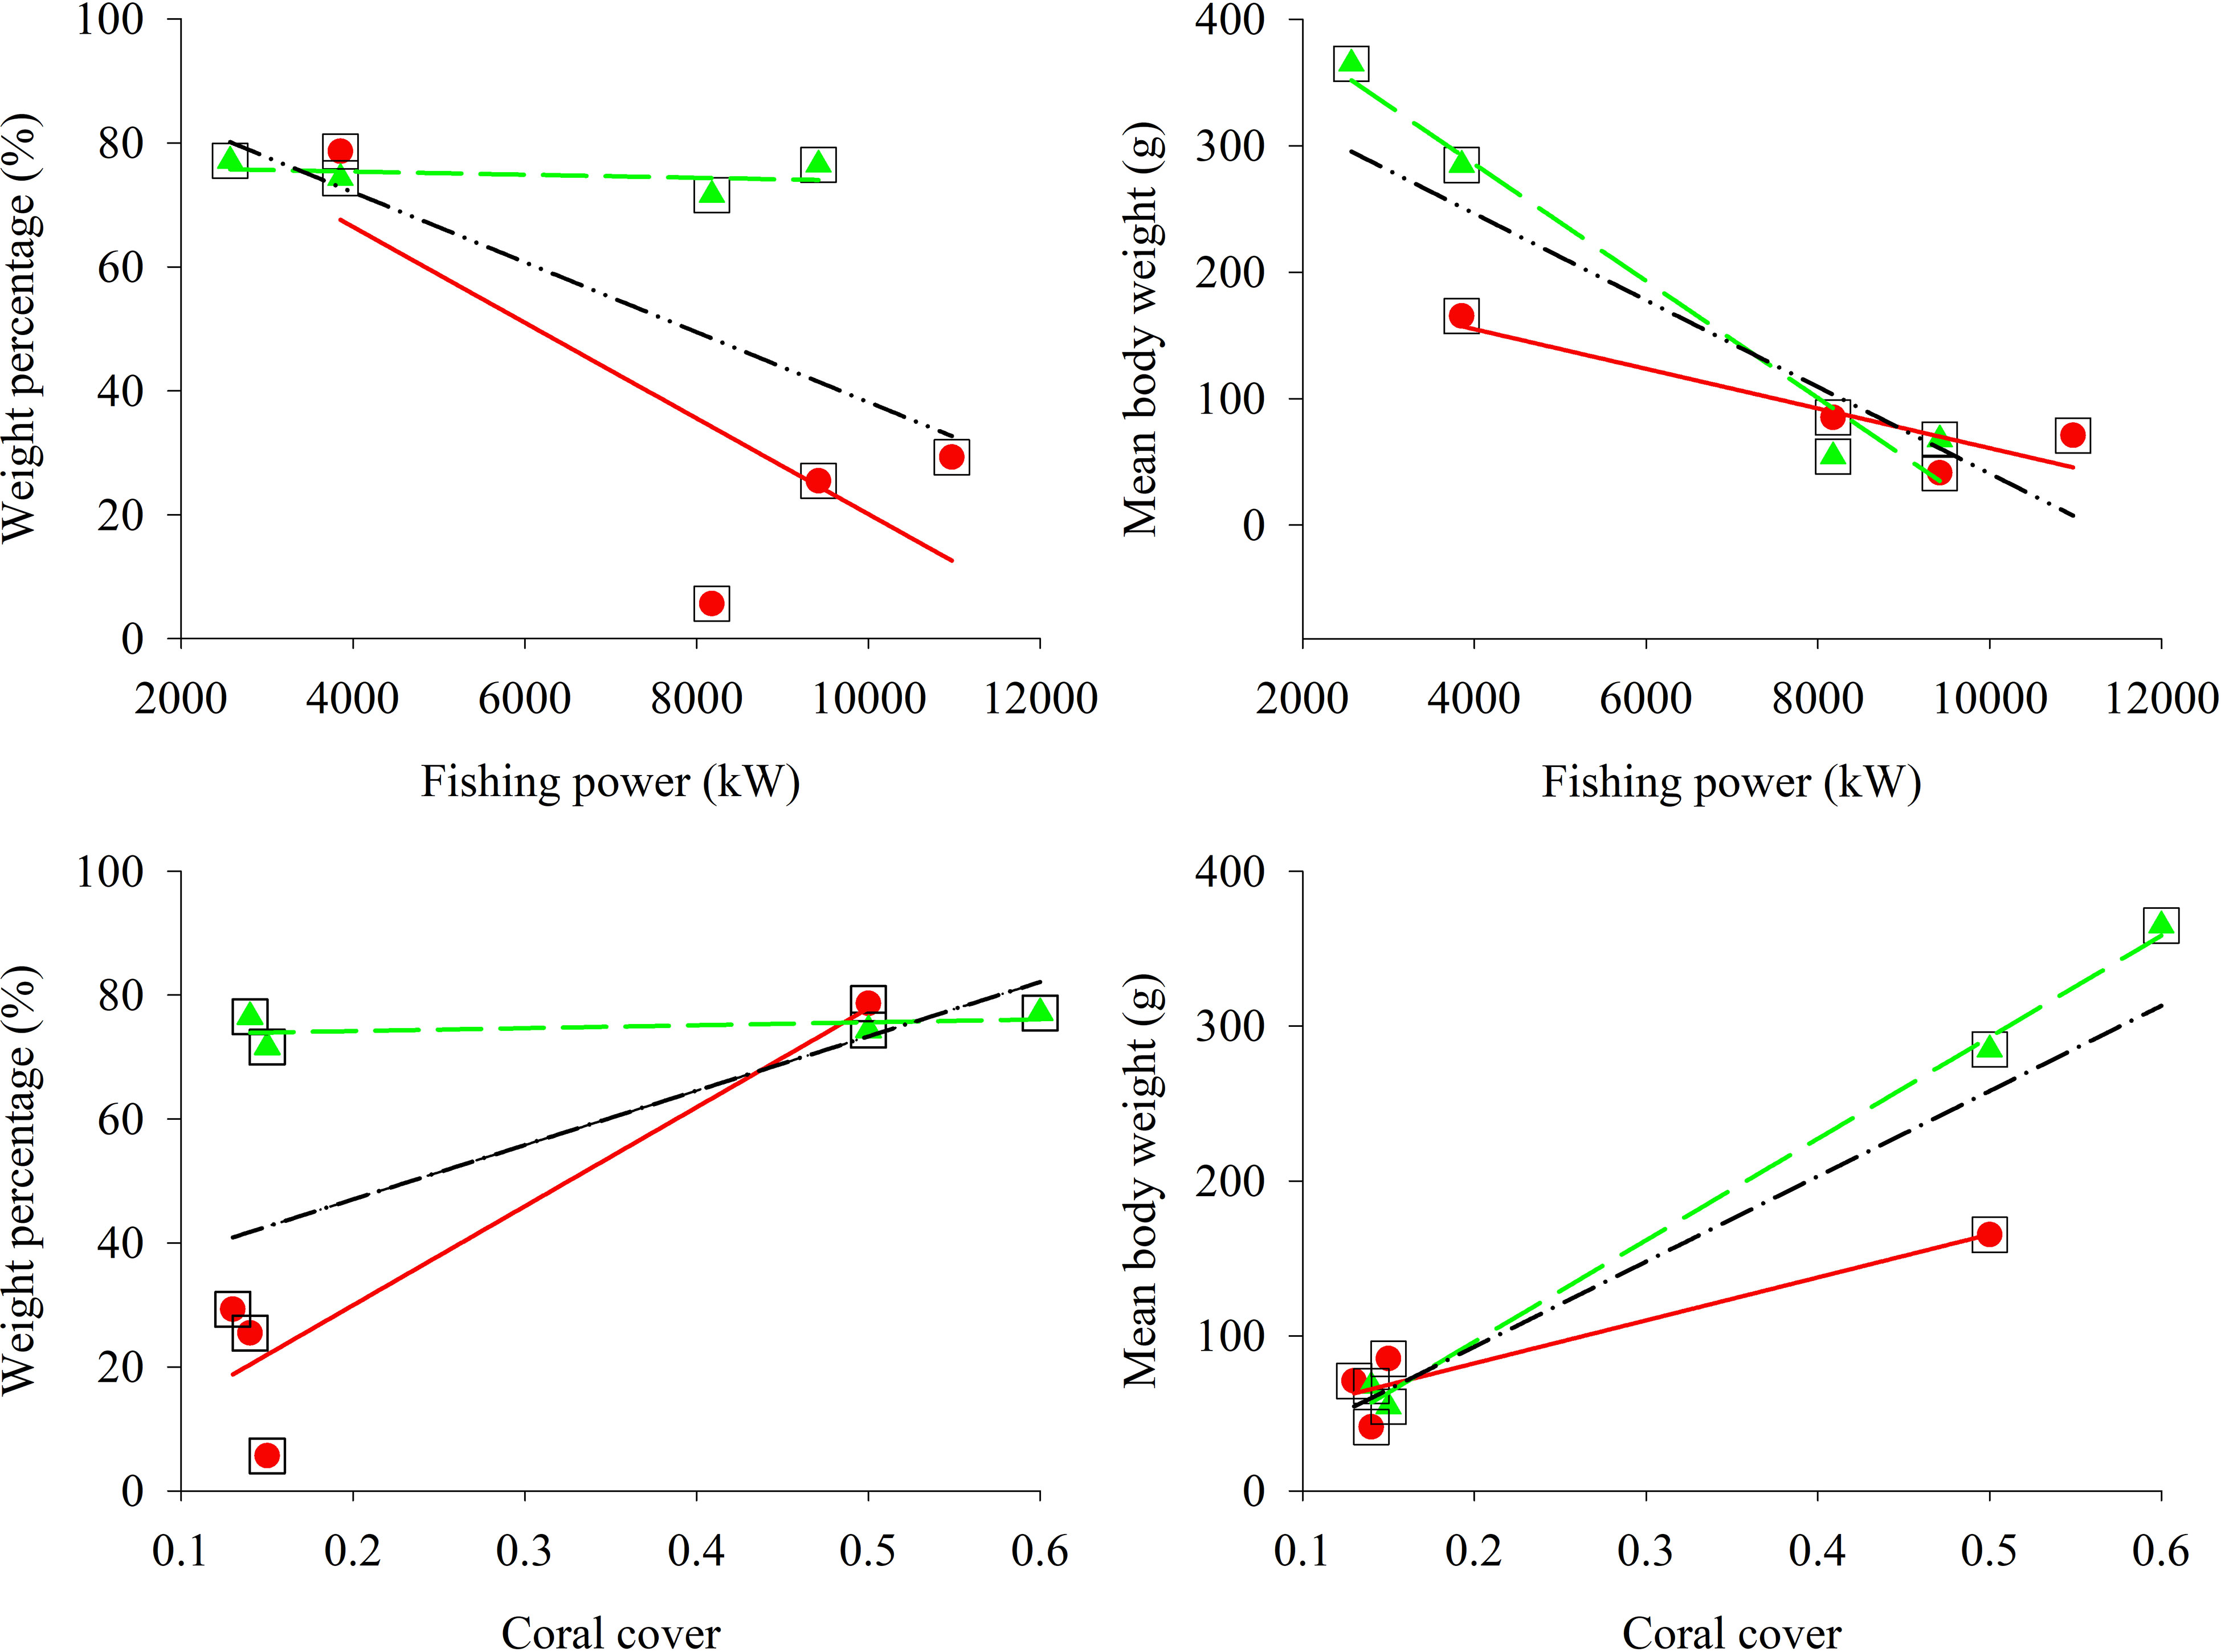
Figure 10 Scatter plot and linear fit between weight percentage and mean body weight of very high & high-value fish in the lagoon of in Meiji Reef and fishing power and coral cover in 1998—1999 and 2016—2018.  and
and  : gillnet,
  and
and  : hand-line,
  and
and  : gillnet & hand-line.
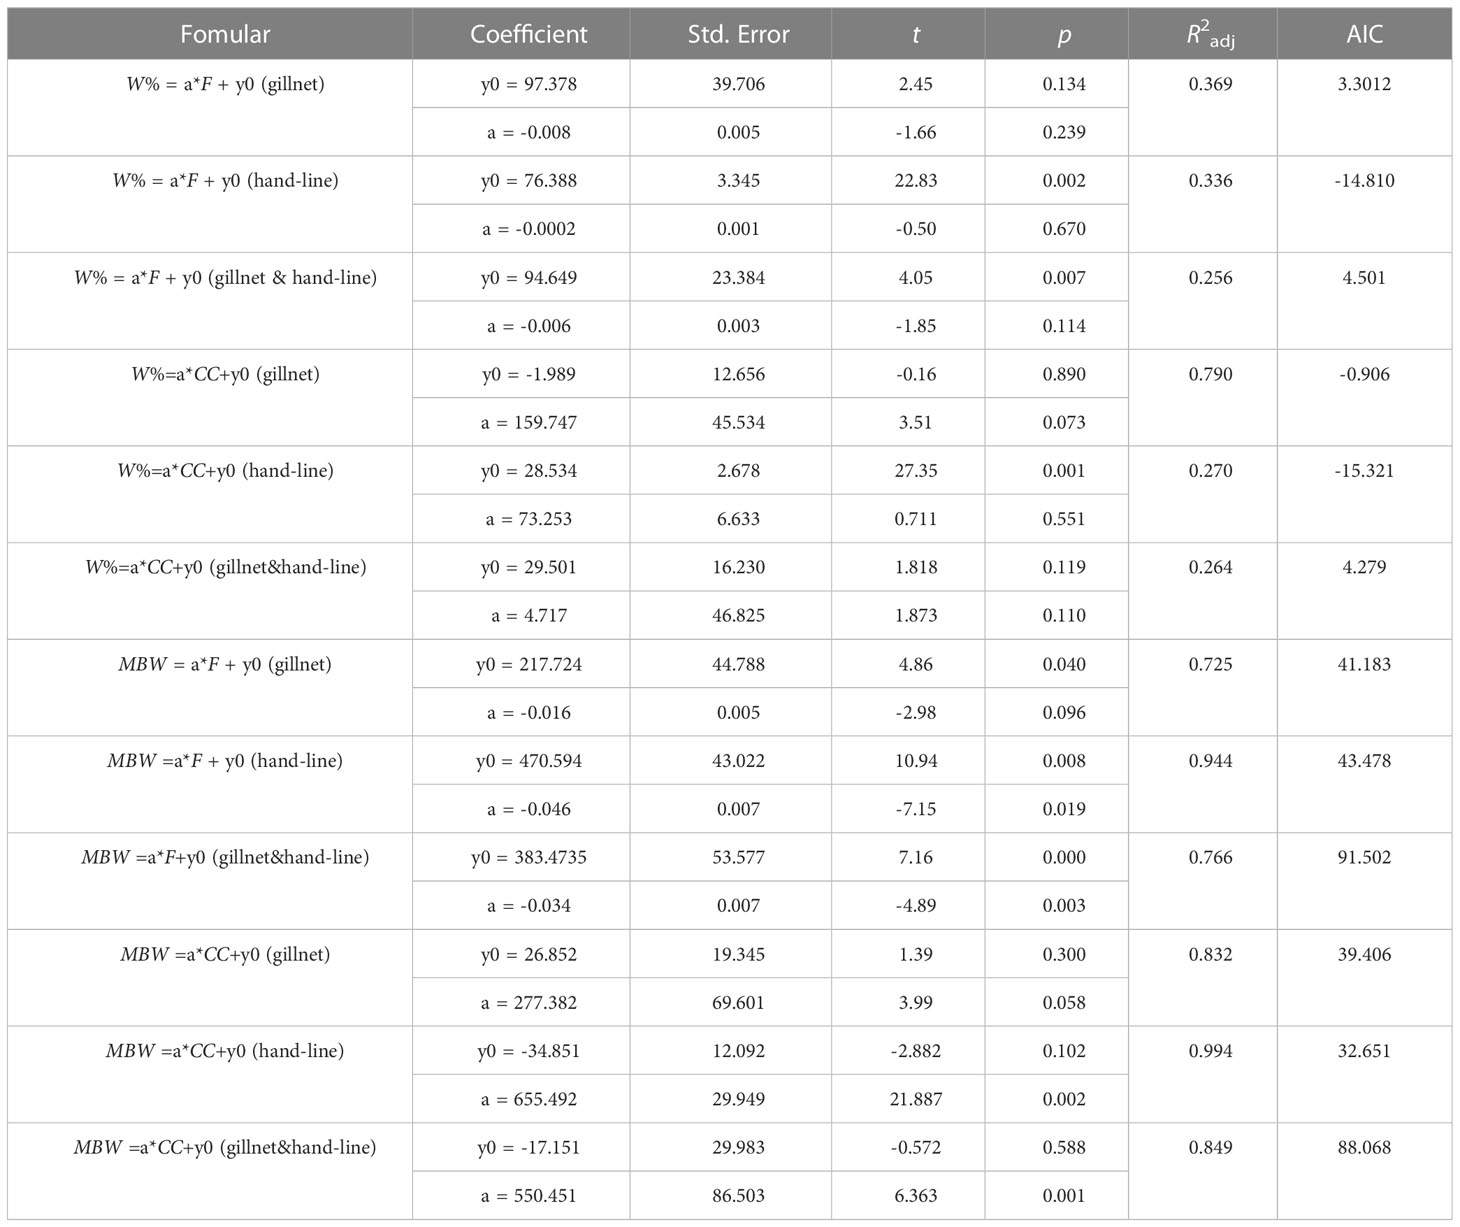
Table 5 Linear fit parameters between weight percentage (W) and mean body weight (MBW) of very high & high-value fish by gillnet and hand-line in the lagoon of in Meiji Reef and fishing power (F) and coral cover (CC).
Discussion
Gao et al. (2014) reported that the dominant coral reef fishes belonged to the iv and pk trophic groups in the Xisha Islands of SCS (six reefs: Yongxing Island, Dongdao Island, Lingyang Atoll, Jinyin Island, Huaguang Atoll, and Zhongjian Island), and the abundance and biomass of other trophic groups were both low (e.g. pi, om, and hb), and the proportion of same trophic group between reefs differed greatly. Our present analysis indicated that the species richness and biomass percentage of pk fish were the smallest among trophic groups in the lagoon of Meiji Reef, and the biomass percentage of pk fish in the lagoon of Meiji Reef was also much lower than the six reefs in the Xisha Islands mentioned above, and also lower than the lagoon of Zhubi Reef in the Nansha Islands. The studies of Du et al. (2015) and Yin et al. (2011) indicated that Zhubi Reef had higher densities of planktivores than Meiji Reef. Thus, the low density and biomass of zooplankton in the lagoon of Meiji Reef may be an important factor in shaping low species richness and biomass of pk fish. In coral reef ecosystems, there are generally multiple pathways for nutrient delivery (Thomas and Cahoon, 1993; Morillo-Velarde et al., 2018). Yamamuro et al. (1995) also mentioned that zooplankton was not the main source of nutrient for corals because the δ15C values of zooplankton were higher or close to the nitrogen isotopic composition of coral. Thus, zooplankton may be not the main hub in the nutrient transfer from primary producers to fishes in the lagoon of Meiji Reef. However, the low species and richness and biomass of pk fish may also be the result of sampling area and fishing tools. Planktivores are much more abundant on outer slope of reefs for the ideal hydrodynamic conditions. Hand-line and gillnet have their limitations on collecting different fish species. Many pk fish may not be easy to be caught in the lagoon by hand-line and gillnet.
In marine ecosystem, in addition to phytoplankton, organic detritus is also the source of nutrients in the food web (Vetter and Dayton, 1999; Anderson et al., 2016; Jensen et al., 2019). Guo et al. (2002) studied trophic relationships among various organisms from Zhubi Reef ecosystem in the Nansha Islands by stable carbon isotope technique, and the great variation in δ15C of zooplankton (-20.4%~-10.9%) in their results suggested that there might be two trophic sources: phytoplankton and detritus. Xu et al. (2010) reported that the Bohai Sea ecosystem could be simplified into three major food chains: phytoplankton→zooplankton→zooplanktivorous fish→nektivore fish (the first food chain), phytoplankton and detritus→benthos→benthivorous fish and cephalopod→nektivore fish (the second food chain), and detritus→detrivorous fish (the third food chain), and since late 1950s, the percentage of biomass made up by fisheries in the third food chain increased continuously and became the second primary fisheries in the Bohai Sea in recent years. Similarly, the study of Letourneur et al. (2013) in two contrasted bays in Moorea of Polynesia indicated that sedimented organic detritus was an important food for fishes Stegastes nigricans and Chaetodon citrinellus, and the main sources of organic detritus involved in the food webs ending with these species were algal turfs and surface sediments. Thus, the hb and dt fish may also represent two separate nutrient pathways in the lagoon of Meiji Reef.
Compared with that in 1998—1999, some apparent variations were found in the trophic groups of fishes in the lagoon of Meiji Reef in 2016—2018, such as dramatic decrease of hb fish, noticeable increase of om fish, disappearances of some fish, and decline of large-sized fishes. These variations may profoundly impact the structure and function of coral reef ecosystem. For example, the loss of herbivorous fish can hinder recovery of bleached coral and accelerate regime shifts from coral- to algae-dominated states (Rempel et al., 2020; Wilson et al., 2021). Large carnivorous fishes are the top predators in coral reef and control the structure of the ecosystem through predation, and their loss can lead to the explosion of bait species and destroy the balance of coral reef (Roberts, 1995; Bellwood et al., 2004).
In our study, the number of fish species sampled in 1998—1999 was lower than that in 2012—2018, mainly because the survey effort in 1998—1999 was much lower than that in 2012—2018. The total fishing efforts by gillnet and hand-line in 2012—2018 were at least 8 and 11 times that in 1998—1999. Despite this, 32 fish species that were present in 1998-1999 were not sampled in 2012—2018. These disappeared fish may have migrated from the lagoon of Meiji reef, or they have just been fished out and not migrated from the slope, or their abundance in the lagoon has dropped too low to be caught. And the mean body weight of fish in 1998—1999 was significantly larger than that in 2016—2018. Among 32 fish species, there was a significant association between fish loss and economic value, but no association between fish loss and vulnerability and resilience. Economic value was the dominant factor accounting for variations of fish communities in the lagoon of Meiji Reef. In general assumption, fish with high resilience or low vulnerability should be more stable or less likely to disappear when exposed to the same habitat. However, our findings did not support the assumption. We speculated that the true external stress far exceeded resilience limit of fish in the lagoon of Meiji Reef, and these fishes with different resilience responded similarly when subjected to high external stress.
Fishing and global climate change are the main drivers of the global loss of coral reef fish (Bellwood et al., 2004; Hughes et al., 2013; Allgeier et al., 2016; Hughes et al., 2017). In the northern South China Sea, the ecosystem response was induced by not only anthropogenic activities, but also climate change (Ning et al., 2009). Fishing pressure proved to be the main driver of sharp declines in demersal fish stocks, with high-value species being replaced by low-value ones over time, and fishing effort imposed the most important influence on piscivorous fish (Wang et al., 2019; Zhang et al., 2020; Liu et al., 2021). Our analysis indichated that fishing power and coral cover had greatly effects on variations of fish communities in the lagoon of Meiji Reef, and coral cover had the greater effect on decline of hb fish as compare to fishing power. Significant relationships between reduced mean body weight of high-economy fish in the lagoon of Merji Reef and coral cover and fishing power may reveal the decline and miniaturization of fishes driven by both fishing and coral degradation. To protect fish on Meiji Reef, conservation initiatives (e.g., creating protected areas, prohibiting fishing, and reconstructing habitat) are necessary.
Conclusion
From 1998 to 2018, there were 166 fish species sampled in present study in the lagoon of Meiji Reef, belonging to 33 families.
In 1999, the fish by gillnet was framed by six trophic groups, except there was no pk fish. In contrast, in 2016—2018, some trophic groups disappeared (e.g. hb and pi fish). The species number and weight percentages of hb, pi and dt fish declined significantly from 1998—1999/2016—2018. The hb fish saw the biggest decline. The species number percentages of large-sized fishes in 1998—1999 were significantly larger than that in 2016—2018.
Thirty-two fish species being found in the lagoon of Meiji Reef during 1998—1999 were not discovered during 2012—2018. There was a significant association between fish loss and economic value, but no association between fish loss and vulnerability and resilience. Economic value was the dominant factor accounting for variations of fish communities in the lagoon of Meiji Reef.
The mean body weight of very high & high-value fish in 1998—1999 was significantly larger than that in 2016—2018. For gillnet, the weight percentage of very high & high-value fish in 1999 was significantly larger than that in 2016—2018. In hand-line surveys, the weight percentage in 1999 has barely changed from the percentages in 2016—2018. Coral cover had the greater effect on percentages of species number and weight of hb fish as compare to fishing power. Both fishing power and coral cover had significant effects on the mean body weight of very high & high-value fish.
Data availability statement
The original contributions presented in the study are included in the article/Supplementary Materials, further inquiries can be directed to the corresponding author/s.
Ethics statement
The animal study was reviewed and approved by the South China Sea Fisheries Research Institute Animal welfare committee.
Author contributions
JZ wrote the first draft. JZ, YG, YC, YY and ZC collected fish specimens and performed data analyses. All authors contributed to the article and approved the submitted version.
Funding
This study was supported by funding from the National Natural Science Foundation of China (31902374), Guangdong Basic and Applied Basic Research Foundation (2021A1515011025), Fundamental and Applied Fundamental Research Major Program of Guangdong Province (2019B030302004), Central Public‐interest Scientific Institution Basal Research Fund, CAFS (2020TD05), Institution Basal Research Fund, South China Sea Fisheries Research Institute, CAFS (2021SD01), and Financial Fund of the Ministry of Agriculture (NFZX2021).
Acknowledgments
We thank the crew of the R/V NanFeng for their support.
Conflict of interest
The authors declare that the research was conducted in the absence of any commercial or financial relationships that could be construed as a potential conflict of interest.
Publisher’s note
All claims expressed in this article are solely those of the authors and do not necessarily represent those of their affiliated organizations, or those of the publisher, the editors and the reviewers. Any product that may be evaluated in this article, or claim that may be made by its manufacturer, is not guaranteed or endorsed by the publisher.
Supplementary material
The Supplementary Material for this article can be found online at: https://www.frontiersin.org/articles/10.3389/fcosc.2023.1122719/full#supplementary-material
References
Allgeier J. E., Valdivia A., Cox C., Layman C. A. (2016). Fishing down nutrients on coral reefs. Nat. Commun. 7, 12461. doi: 10.1038/ncomms12461
Anderson T. R., Pond D. W., Mayor D. J. (2016). The role of microbes in the nutrition of detritivorous invertebrates: A stoichiometric analysis. Front. Microbiol. 7. doi: 10.3389/fmicb.2016.02113
Arai T. (2015). Diversity and conservation of coral reef fishes in the Malaysian south China Sea. Rev. Fish Biol. Fisher 25, 85–101. doi: 10.1007/s11160-014-9371-9
Bellwood D., Hughes T., Folke C., Nyström M. (2004). Confronting the coral reef crisis. Nature 429, 827—833. doi: 10.1038/nature02691
Berumen M. L., Pratchett M. S., Mccormick M. I. (2005). Within-reef differences in diet and body condition of coral-feeding butterflyfishes (chaetodontidae). Mar. Ecol. Prog. 287, 217–227. doi: 10.3354/meps287217
Chen G., Li Y. (2005). Composition and distribution of serranidae in main coral reef waters of south China Sea. South China Fisheries Sci. 1 (3), 18–25. doi: CNKI:SUN:NFSC.0.2005-03-003
Cole A. J., Pratchett M. S., Jones G. P. (2010). Diversity and functional importance of coral-feeding fishes on tropical coral reefs. Fish Fisheries 9 (3), 286–307. doi: 10.1111/j.1467-2979.2008.00290.x
Cramer K. L., O’Dea A., Clark T. R., Zhao J., Norris R. D. (2017). Prehistorical and historical declines in Caribbean coral reef accretion rates driven by loss of parrotfish. Nat. Commun. 8, 14160. doi: 10.1038/ncomms14160
Dai X., Li Y., Cai Y., Gong Y., Zhang J., Chen Z. (2022). Variations in fish community structure at the lagoon of yongshu reef, south China Sea between 1999 and 2016–2019. Diversity 14, 763. doi: 10.3390/d14090763
Du F., Wang X., Lin Z. (2015). The characteristics of summer zooplankton community in the meiji coral reef, nansha islands, south China Sea. Acta ecologica Sin. 35 (4), 1014–1021. doi: 10.5846/stxb201305020892
Froese R., Pauly D. (2020) Fishbase. Available at: https://www.fishbase.org.
Gao Y., Huang H., Lian J., Yang J. (2014). The species diversity and trophic structure of reef fishes in the waters of the xisha archipelago. Biodiversity Sci. 22 (5), 618–623. doi: 10.3724/SP.J.1003.2014.14102
Grigg R. W., Polovina J. J., Atkinson M. J. (1984). Model of a coral reef ecosystem: resource limitation, community regulation, fisheries yield and resource management. coral reefs 3, 23–27. doi: 10.1007/BF00306137
Guo W., Yang Y., Wu L., Wang H., Hu M. (2002). Stable carbon isotope study on trophic relationships of zhubi reef ecosystem in nansha islands. J. Oceanography Taiwan Strait 21 (1), 94–101. doi: 10.3969/j.issn.1000-8160.2002.01.016
Hempson N., Graham N., Macneil M. A., Williamson D. H., Jones G. P., Almany G. R. (2017). Coral reef mesopredators switch prey, shortening food chains, in response to habitat degradation. Ecol. Evol. 7 (8), 2626–2635. doi: 10.1002/ece3.2805
Hughes T. P., Huang H., Young M. A. L. (2013). The wicked problem of china’s disappearing coral reefs. Conserv. Biol. 27 (2), 261–269. doi: 10.1111/j.1523-1739.2012.01957.x
Hughes T. P., Kerry J. T., Lvarez-Noriega M., Lvarez-Romero J. G., Wilson S. K. (2017). Global warming and recurrent mass bleaching of corals. Nature 543 (7645), 373–377. doi: 10.1038/nature21707
Jennings S., Grandcourt E. M., Polunin C. (1995). The effects of fishing on the diversity, biomass and trophic structure of seychelles’ reef fish communities. Coral Reefs 14 (4), 225–235. doi: 10.1007/BF00334346
Jensen H., Motti A., Garm L., Tonin H., Kroon J. (2019). Sources, distribution and fate of microfibres on the great barrier reef, australia. Sci. Rep. 9 (1), 9021. doi: 10.1038/s41598-019-45340-7
Letourneur Y., Lison de Loma T., Richard P., Harmelin-Vivien M. L., Cresson B., Fontaine M., et al. (2013). Identifying carbon sources and trophic position of coral reef fishes using diet and stable isotope (δ15N andδ13C) nalyses in two contrasted bays in moorea, French Polynesia. Coral Reefs 32 (4), 1091–1102. doi: 10.1007/s00338-013-1073-6
Li Y., Chen Z., Zhang J. (2022). Fish composition and diversity of four coral reefs in the south China Sea based on hand-line catch. J. Mar. Sci. Eng. 10, 38. doi: 10.3390/jmse10010038
Li Y., Chen Z., Zhang J., Jiang Y., Gong Y., Hong X., et al. (2021). Biological characteristics of Epinephelus merra of coral reef waters in south China Sea. South China Fisheries Sci. 17 (6), 22–30. doi: 10.12131/20210105
Li Y., Jia X., Chen G., Chen P., Shu L., Zeng X. (2007). The south China Sea coral reef fish resources (Beijing, China: China Ocean Press).
Liu D., Tian Y., Ma S., Li J., Sun P., Ye Z., et al. (2021). Long-term variability of piscivorous fish in China seas under climate change with implication for fisheries management. Front. Mar. Sci. 8. doi: 10.3389/fmars.2021.581952
Liveaquaria (2022) Liveaquaria. Available at: https://www.liveaquaria.com.
Lu Z., Li M., Zhang J., Zhang S., Li H., Jiang P., et al. (2021). Preliminary study on species composition of fish eggs of meiji reef lagoon in south China Sea based on DNA barcoding. South China Fisheries Sci. 17 (6), 12–21. doi: 10.12131/20210091
Moberg F., Folke C. (1999). Ecological goods and services of coral reef ecosystems. Ecol. Economics 29 (2), 215–233. doi: 10.1016/S0921-8009(99)00009-9
Morillo-Velarde P., Briones-Fourzan P., Alvarez-Filip L., Aguíñiga-García S., Sanchez A., Lozano-Álvarez E. (2018). Habitat degradation alters trophic pathways but not food chain length on shallow Caribbean coral reefs. Sci. Rep. 8 (1), 4109. doi: 10.1038/s41598-018-22463-x
Munday P. L., Jones G. P., Pratchett M. S., Williams A. J. (2008). Climate change and the future for coral reef fishes. Fish Fish 9 (3), 261–285. doi: 10.1111/j.1467-2979.2008.00281.x
Ning X., Lin C., Hao Q., Liu C., Shi J. (2009). Long term variations in the ecosystem in the northern south China Sea during 1976–2004. Biogeosciences 6 (10), 2227–2243. doi: 10.5194/bg-6-2227-2009
Rempel H. S., Bodwin K. N., Ruttenberg B. I. (2020). Impacts of parrotfish predation on a major reef-building coral: Quantifying healing rates and thresholds of coral recovery. Coral Reefs 39 (5), 1441–1452. doi: 10.1007/s00338-020-01977-9
Roberts C. M. (1995). Effects of fishing on the ecosystem structure of coral reefs. Conserv. Biol. 9, 988—995. doi: 10.1046/j.1523-1739.1995.9051332.x-i1
Shao G. (2019) Taiwan Fish database. Available at: http://fishdb.sinica.edu.tw.
Smith S. V. (1978). Coral-reef area and the contributions of reefs to processes and resources of the world's oceans. Nature 273 (5659), 225–226. doi: 10.1038/273225a0
Thomas C. J., Cahoon L. B. (1993). Stable isotope analyses differentiate between different trophic pathways supporting rocky-reef fishes. Mar. Ecol. Prog. 95 (1-2), 19–24. doi: 10.3354/meps095019
Vetter E. W., Dayton P. K. (1999). Organic enrichment by macrophyte detritus, and abundance patterns of megafaunal populations in submarine canyons. Mar. Ecol. Prog. Ser. 186, 137–148. doi: 10.3354/meps186137
Wang T., Liu Y., Quan Q., Xiao Y., Wu P., Li C. (2022). Species composition characteristics analysis of qilianyu reef fishes of xisha islands. J. Fishery Sci. China 29 (1), 102–117. doi: 10.12264/JFSC2021-0122
Wang X., Qiu Y., Du F., Liu W., Sun D., Chen X., et al. (2019). Roles of fishing and climate change in long-term fish species succession and population dynamics in the outer beibu gulf, south China Sea. Acta Oceanologica Sin. 38 (10), 1–8. doi: 10.1007/s13131-019-1484-5
Wilson M. W., Gaines S. D., Stier A. C., Halpern B. S. (2021). Variation in herbivore grazing behavior across Caribbean reef sites. Mar. Biol. 168 (4), 1–11. doi: 10.1007/s00227-021-03844-9
Xu S., Song J., Duan L. (2010). Structural variations of major fishery resources in the bohai Sea. Mar. Sci. 34 (6), 59–65. doi: 10.1631/jzus.A1000244
Yamamuro M., Kayanne H., Minagawa M. (1995). Carbon and nitrogen stable isotopes of primary producers in coral reef ecosystems. Limnology Oceanography 40 (3), 617—621. doi: 10.4319/lo.1995.40.3.0617
Yang G., Sun X., Hou X., Chen C. (2012). Measurement of the trophic level of fish in a coral reef ecosystem using stable isotopes. J. Fishery Sci. China 19 (1), 105–115. doi: 10.3724/SP.J.1118.2012.00105
Yin J., Huang L., Li K., Xiong L. (2011). Species diversity and community structure of zooplankton in the zhubi atoll, nansha islands, south China Sea. Biodiversity Sci. 19 (6), 685–695. doi: 10.3724/SP.J.1003.2011.11130
Zhang J., Chen Z., Cai Y., Li Y., Lin Z. (2021a). Long-term variation in dominant species and biodiversity of fish in the lagoon of the meiji reef in the south China Sea based on hand fishing and gill net. J. Fishery Sci. China 28 (11), 1466–1476. doi: 10.12264/JFSC2021-0004
Zhang Y., Chen P., Liang X. (2006). Relationship between food and food habits for main fish species in the transitional waters around coral reefs in the south china sea. Periodical Ocean Univ. China (Natural Sci. Edition) 36 (4), 635–638. doi: 10.16441/j.cnki.hdxb.2006.04.025
Zhang K., Guo J., Xu Y., Jiang Y., Chen Z. (2020). Long-term variations in fish community structure under multiple stressors in a semi-closed marine ecosystem in the south china sea. Sci. Total Environ. 745, 140892. doi: 10.1016/j.scitotenv.2020.140892
Zhang C., Hu S., Lin X., Zhou T., Huang H., Liu S. (2022). Diet and trophic level analysis of triggerfish (Balistapus undulatuse) in coral reefs of nansha. J. Trop. Oceanography 41 (1), 7–14. doi: 10.11978/2021008
Zhang K., Zhang J., Shi D., Chen Z. (2021b). Assessment of coral reef fish stocks from the nansha islands, south China Sea, using length-based Bayesian biomass estimation. Front. Mar. Sci. 7. doi: 10.3389/fmars.2020.610707
Zhao H., Wang L., Yuan J. (2016). Sustainable development of the coral reefs in the south China sea islands. Trop. Geogr. 36 (1), 55–65. doi: 10.13284/j.cnki.rddl.002800
Keywords: trophic group, herbivorous fishes, coral cover, fishing, contingency table analysis
Citation: Zhang J, Gong Y, Cai Y, Yang Y and Chen Z (2023) Long-term variations in trophic groups of coral reef fishes in the lagoon of Meiji Reef in the South China Sea. Front. Conserv. Sci. 4:1122719. doi: 10.3389/fcosc.2023.1122719
Received: 13 December 2022; Accepted: 21 March 2023;
Published: 31 March 2023.
Edited by:
Wenliang Zhou, Southern Marine Science and Engineering Guangdong Laboratory (Guangzhou), ChinaReviewed by:
Xianzhi Lin, South China Sea Institute of Oceanology, Chinese Academy of Sciences (CAS), ChinaTao Pan, Anhui Normal University, China
Copyright © 2023 Zhang, Gong, Cai, Yang and Chen. This is an open-access article distributed under the terms of the Creative Commons Attribution License (CC BY). The use, distribution or reproduction in other forums is permitted, provided the original author(s) and the copyright owner(s) are credited and that the original publication in this journal is cited, in accordance with accepted academic practice. No use, distribution or reproduction is permitted which does not comply with these terms.
*Correspondence: Jun Zhang, emhhbmdqdW5Ac2NzZnJpLmFjLmNu; Zuozhi Chen, Y2hlbnp1b3poaUBzY3NmcmkuYWMuY24=