
94% of researchers rate our articles as excellent or good
Learn more about the work of our research integrity team to safeguard the quality of each article we publish.
Find out more
ORIGINAL RESEARCH article
Front. Conserv. Sci., 13 October 2022
Sec. Conservation Genetics and Genomics
Volume 3 - 2022 | https://doi.org/10.3389/fcosc.2022.938040
 Susana Caballero1*†
 Jose Gregorio Martínez1,2†
 Monica A. Morales-Betancourt3
 Nacor Bolaños4Carlos A. Lasso3
The turtle genus Kinosternon is widespread with at least 25 species distributed from Mexico to northern Argentina. The taxonomy of this genus is controversial and requires a full revision using both morphological and molecular approaches. In this study, we did a genomic analysis on the species Kinosternon scorpioides distributed in insular and continental Colombia in order to define conservation units. Total DNA was extracted from 24 tissue samples and RADseq genotyping analysis was done. In addition, the intron R35 was amplified and sequenced for a subset of samples. A total of 35,507 SNPs combined with 1,047 bp of the intron were used for spatiotemporal colonization pattern reconstruction and phylogenetic analyses. In addition, SNPs were used for population structure inferences and allele frequency-based analyses. Reciprocal monophyly, significant differences in allele frequencies (Fst = 0.32 - 0.78), and evidence of reproductive isolation (no admixture/geneflow), indicate long-term divergence between groups (2-8 MYA), possibly due to geographical barriers. Four Evolutionarily Significant Units (ESUs) were defined within our samples. One ESU was represented by the insular subspecies K. scorpioides albogulare, found on San Andrés island, and three ESUs were defined for the subspecies K. s. scorpioides in continental Colombia: one trans-Andean, found in northwestern Colombia (Caribbean region) and two cis-Andean, found in eastern and southeastern Colombia in the Orinoco and Amazon regions, respectively. Colonization of this species occurred from an ancestral area on South of Central America region (~ 8.43 MYA), followed by an establishing of current populations on San Andrés Island and then, in the continent. First, in the Colombian Caribbean, next, in the Orinoco, and more recently, in the Amazon. We hypothesize that the emergence of the Panamá Isthmus, as well as the final uplift of the North Eastern Andes and Vaupes Arch, were key event leading to the differentiation of these ESUs. For management and conservation purposes, each of these ESUs should be considered as a separate management unit. A full revision of the taxonomy of the genus Kinosternon is warranted.
Turtles belonging to the genus Kinosternon are commonly known as mud turtles and inhabit fresh and brackish water habitats such as rivers, lakes and marshes from Mexico to northern Argentina. Twenty-five species have been described within the genus but its taxonomy remains controversial, with new species being described as recently as 2020. The species Kinosternon cora was described recently in The Pacific Coastal plain of northwestern Mexico (Loc-Barragán et al., 2020) and the species Kinosternon vogti was described in 2018 in Jalisco, Mexico (López-Luna et al., 2018).
Recent molecular phylogenetic analyses, using isozymes, mitochondrial DNA and nuclear exon and intron data, revealed what appears to be non-monophyly within the species Kinosternon scorpioides (Iverson et al., 2013; Spinks et al., 2014). These authors suggest the need to resolve species and subspecies boundaries in this genus and species, through more extensive geographic and genetic sampling.
Three Kinosternon species are distributed in Colombia. Kinosternon dunni is endemic to Colombia and found in the Pacific region and K. leocostomum is distributed in the Magdalena River and the Caribbean region. Kinosternon scorpioides is the most widely distributed species, with two subspecies identified in the Colombian territory. Kinosternon s. scorpioides is found in the Caribbean, Andean, Orinoco and Amazon regions and K. s. albogulare (locally known as Swanka) is found only in San Andrés island (Turtle Taxonomy Working Group et al., 2021). The Swanka and K. dunni have been categorized as vulnerable-VU D2 based on the last extinction risk evaluation conducted in the country (Morales-Betancourt et al., 2015, Resolución N° 1912 de septiembre de 2017 del Ministerio de Ambiente y Desarrollo Sostenible-MSDS). The reason why the Swanka was categorized in such a way was because it is only found in San Andrés Island, having a very restricted distribution and likely a small population size. Also, its main current threat (habitat destruction) is likely to continue in the near future, increasing its extinction risk (Forero-Medina et al., 2015).
The rapid increase in the availability of genomic data is quickly transforming how long-standing questions are addressed and answered in evolution and conservation (Kohn et al., 2006), specially, the delineation of functional units to conserve (Funk et al., 2012). The two most commonly discussed conservation units are evolutionarily significant units (ESUs) and management units (MUs). The first one is defined as a population or group of populations that warrant separate management or priority for conservation because of high genetic distinctiveness (reproductive isolation), including reciprocal monophyly (Crandall et al., 2000). The maintenance of different ESUs will maximize evolutionary potential in the face of environmental change. MUs are populations that are demographically independent (Moritz, 1994; Moritz, 1999). That is, their population dynamics (growth rate) depend on local birth and death rates rather than on immigration. However, they can still be connected by limited gene flow. Identifying conservation units is an essential first step so that managers and policy makers know the boundaries of the population units that they are trying to conserve.
Prezygotic barriers are fundamental to shape allopatric ESUs in reptiles (reviewed by Wollenberg et al., 2019), preventing reproduction acting sequentially and limiting gene flow until total reproductive isolation is achieved. Consequently, reciprocal monophyly is evidenced, and eventually, speciation occurs. In general, allopatric speciation has widely been considered the most common way of species generation in reptiles (Coyne and Orr, 2004). Several herpetological studies now show some support for this hypothesis. For example, the studies of the range overlap of species pairs in some groups support the prevalence of the allopatric mode [salamanders (Kozak and Wiens, 2006); frogs (Hua and Wiens, 2010); turtles (Stephens and Wiens, 2003)]. Among 242 sister species pairs of squamates (reviewed by Wollenberg et al., 2019), allopatric pairs are the most common (41.3%). Allopatric ESU formation or speciation has often been inferred across hard barriers to gene flow, which are thought to limit gene flow completely. However, soft barriers to gene flow limit dispersal but still allow for low levels of migration (Pyron and Burbrink, 2010).
The Vaupés Arch and the Northern Andes (Cordillera de Mérida, Eastern Cordillera de Colombia and Northern Central Cordillera) are considered sequentially emerging barriers with soft and hard features (depending on the species) driving allopatric diversification in the Neotropics. For instance, although the Vaupés Arch fragmented the transcontinental paleo-Amazonas-Orinoco River in the western emerging area (~ 11 - 13 Ma in the Andean piedmont; Hoorn et al., 1995), it allows today for connections of the Orinoco and Amazon basins through the Casiquiare Canal, localized in its eastern area (Winemiller et al., 2008). As a result, there is evidence of natural use of this portal by aquatic species that are permanently distributed along the Negro river (Amazon)-Casiquiare channel. This is the case for the river dolphin Inia geoffrensis and the river turtle Podocnemis expansa (reviewed by Lima and Ribeiro, 2011). Also, recent genetic studies demonstrated that fishes such as the cychlids Cichla temensis, C. monoculus and C. orinocensis (Willis et al., 2010) or the black arowana Osteoglossum ferreirai (Olivares et al., 2013), experienced some degree of connectivity and gene flow between both basins, using this channel as their connection route. Contrary, aquatic species such as the riverine turtle Podocnemis unifilis (Escalona et al., 2009) or the fish Piaractus brachypomus (Escobar et al., 2015), are unable to currently establish conection/gene flow between the Orinoco and Amazon, meaning the Vaupes Arch is acting as hard barrier for these species.
Likewise, studies testing the effect of the Andes on the diversification for several animal models such as butterflies, birds, arthropods, reptiles and amphibians, have found that the Andean mountains played an important role, where speciation with and without gene flow across it has occurred (Elias et al., 2009; Arias et al., 2014; Díaz et al., 2014; Guarnizo et al., 2015; Chazot et al., 2016; Teixeira et al., 2016; De-Silva et al., 2017; Salgado-Roa et al., 2018). The most recent and robust phylogenetic study evaluating this same hypothesis (Hazzi et al., 2018), found discordant divergence times for multiple avian lineages with cross-Northern Andean distribution; which ranged from the early Pliocene [~4.2 Ma; for the Las Cruces Pass (Northern Central Cordillera) or Táchira Depression (Cordillera de Mérida)] to the Pleistocene, about 0.2 Ma for the Las Cruces Pass.
Currently, it is unclear how these barriers may be shaping possible ESUs among Kinosternon scorpioides in Colombia. For this reason, it is important to understand the genetic population structure of the Swanka at different spatial scales (Lasso et al., 2018) as well as to investigate the patterns of genetic differentiation and divergence between K.s. albogulare and the K. s. scorpioides found in the continent (Forero-Medina and Castaño-Mora, 2011). This information is key to define ESUs and management units in order to improve the operative management and conservation of these turtle subspecies in Colombia.
The aim of this study was to investigate for the first time the phylogeography, population structure, and population differentiation among Kinosternon scorpioides groups found in continental and insular Colombia by means of anonymous RADseq-derived SNPs and one intronic region in order to establish conservation units to guide management applications in Colombia.
A total of 24 tissue samples were obtained from wild Kinosternon scorpioides turtles in six sampling locations in three Colombian regions: one in the Colombian Amazon Basin (Leticia), two in the Caribbean Coast or Caribe Basin (Cispatá Bay and Lorica swamp), three in the Orinoco basin (sierra de la Macarena-Guaviare Sub-basin, Puerto Carreño-Orinoco river floodplain and Tuparro National Park-Tomo Sub-basin) and one in San Andrés Island (Figure 1 and Table 1).
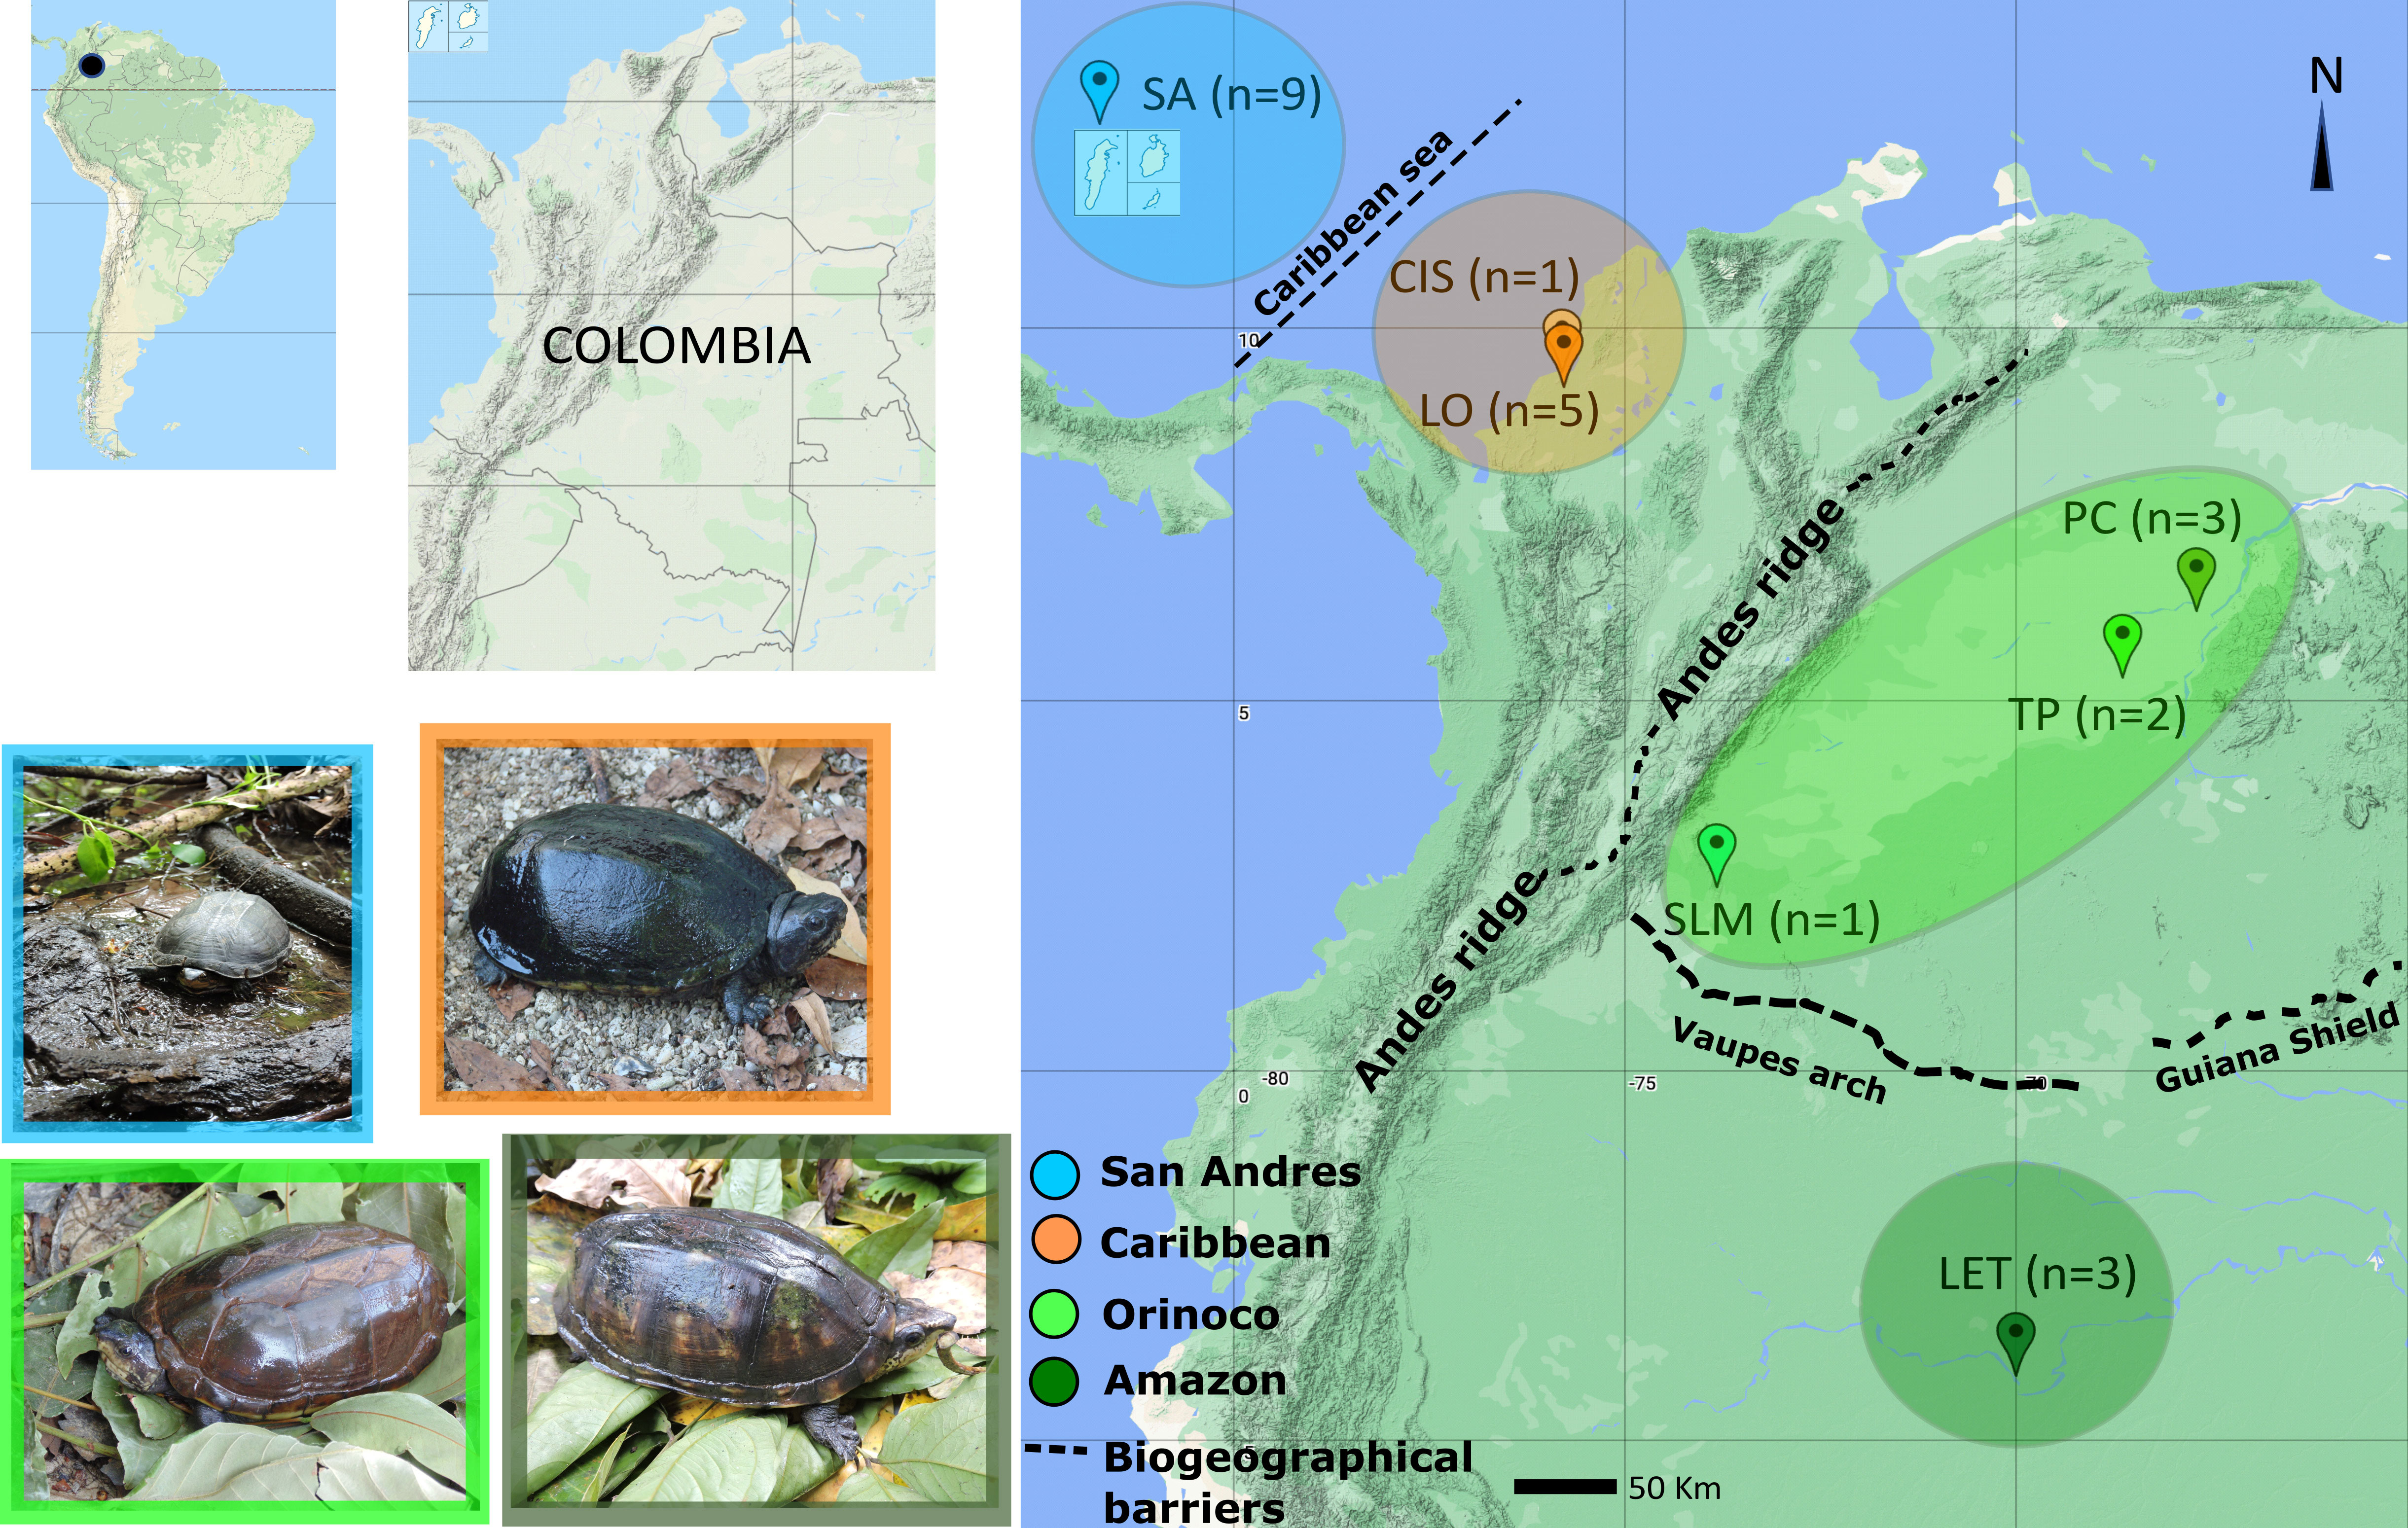
Figure 1 Map of Kinosternon scorpioides tissue sampling sites and sizes in insular and continental areas: SA (San Andrés Island, San Andrés and Providencia Archipelago), CIS (Cispatá Bay, Cordoba Province), LO (Lorica Swamp, Cordoba Province), PC (Puerto Carreño, Vichada Province), TP (Tuparro National Park, Vichada Province), SLM (Serranía la Macarena, Meta Province), and LET (Leticia, Amazonas Province). Pictures of sampled individuals from each area are shown.
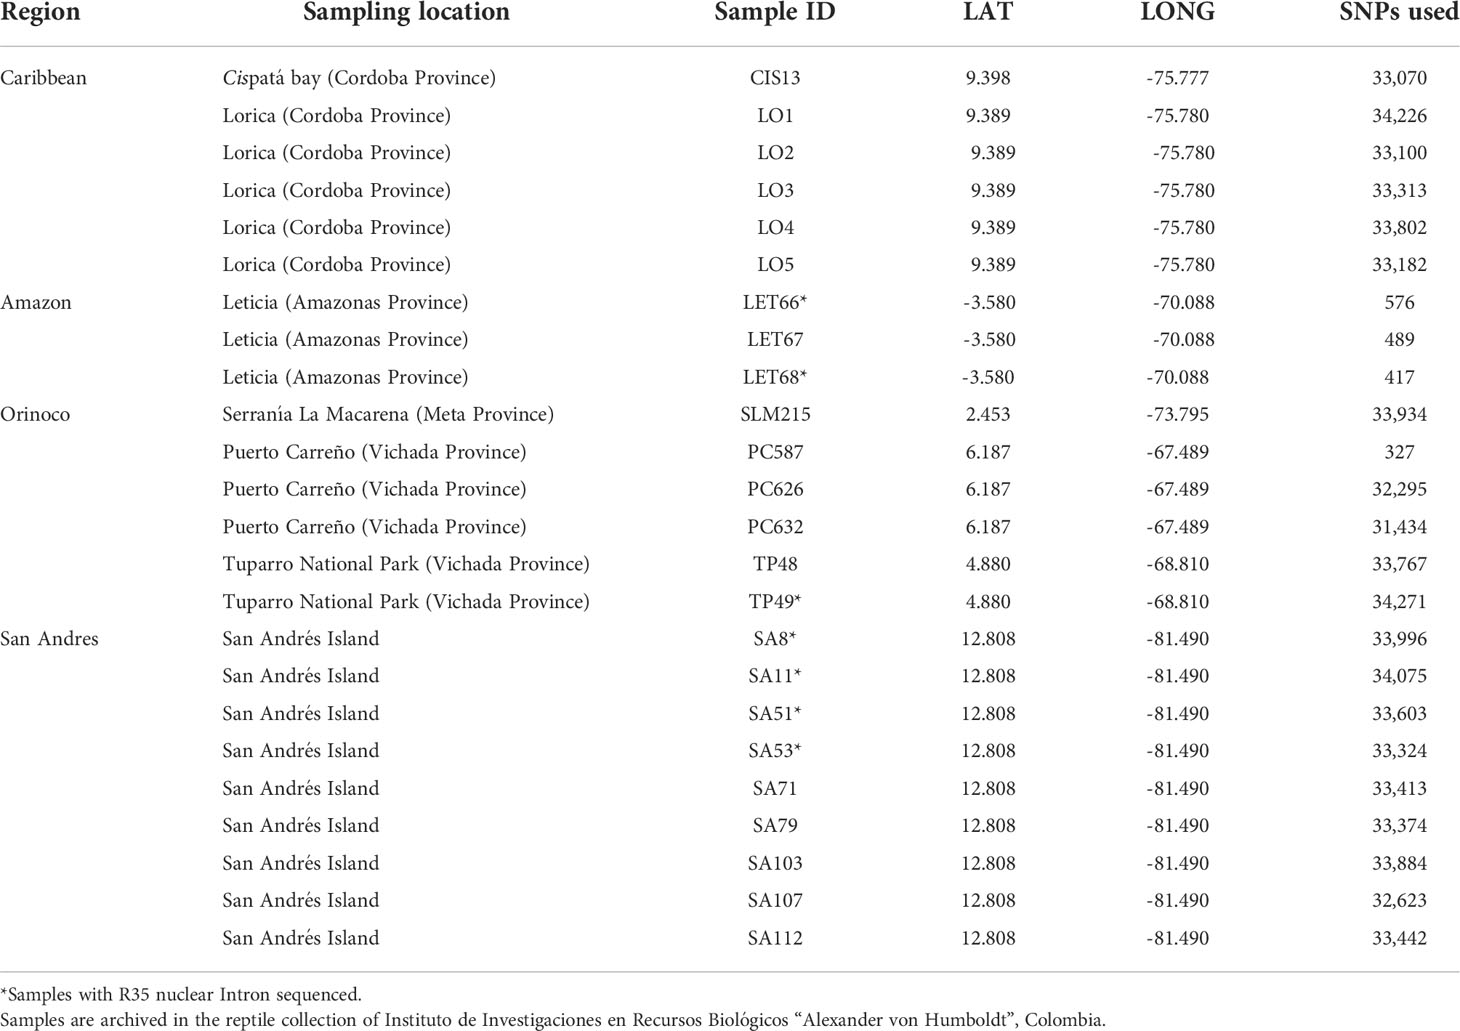
Table 1 Geographic region, location, sample ID, geographic coordinates and the total number of recovered SNPs for all samples included in this study.
Turtles were captured at night. Then, following the protocol designed by the Instituto de Investigación de Recursos Biológicos “Alexander von Humboldt” in Colombia (Vargas-Ramírez, 2017), approximately 0.3 cm3 of tissue was cut out from the back foot using a scalpel and stored in 90% ethanol. An iodine solution was applied after sampling to prevent infection. Sampling protocols were evaluated by the animal care committee (Cicual) from Universidad de los Andes.
Total DNA was extracted using the QIAamp DNA tissue mini kit (QIAGEN) and its quality was evaluated in 0.8% agarose gels. DNA was quantified using nanodrop 2000 spectrophotometer (Thermo Scientific) and diluted to a final concentration ranging from 30 to 50 ng/uL.
Genomic DNA was converted into nextRAD genotyping-by-sequencing libraries (SNPsaurus, LLC) as in Russello et al. (2015). DNA was first fragmented with Nextera DNA Flex reagent (Illumina, Inc), which also ligates short adapter sequences to the ends of the fragments. The Nextera reaction was scaled for fragmenting 50 ng of genomic DNA, although 75 ng of genomic DNA was used for input to compensate for the amount of degraded DNA in the samples and to increase fragment sizes. Fragmented DNA was then amplified for 27 cycles at 74°C with one of the primers matching the adapter and extending 10 nucleotides into the genomic DNA with the selective sequence GTGTAGAGCC. Thus, only fragments starting with a sequence that can be hybridized by the selective sequence of the primer were efficiently amplified. The nextRAD libraries were sequenced on an Illumina HiSeq 4000 sequencer with one lane of 150 bp reads (University of Oregon).
In order to improve the phylogenetic signal of some samples with an excessive amount of missing data for SNPs (>90%), a partial region of the intron R35 were amplified via PCR and sequenced following the protocols and using the primers from Fujita et al. (2004). Amplicons were purified using magnetic beads and sequenced in both forward and reverse direction on an ABI3500 at Universidad de los Andes (Colombia). We chose to work with this nuclear region (R35) because previous studies have shown them to be useful in resolving deep relationships in turtle phylogenetics (Fujita et al., 2004; Loc-Barragán et al., 2020).
The genotyping analysis used custom scripts (SNPsaurus, LLC) that trimmed the reads using bbduk (BBMap tools, http://sourceforge.net/projects/bbmap/):
bbmap/bbduk.sh in=reads/run_2780/2780_CAAGTGTC-GTAAGGAG_S25_L003_R1_001_subset.fastq.gz out=reads/run_2780/2780_CAAGTGTC-GTAAGGAG_S25_L003_R1_001_t.fastq.gz ktrim=r k=17 hdist=1 mink=8 ref=bbmap/resources/nextera.fa.gz minlen=100 ow=t qtrim=r trimq=10.
Next, a de novo reference was created by collecting 10 million reads in total, evenly from the samples, and excluding reads that had counts fewer than 7 or more than 700 (number standardized by SNPsaurus Company). The remaining loci were then aligned to each other to identify allelic loci and collapse allelic haplotypes to a single representative. All reads were mapped to the reference with an alignment identity threshold of 0.95 using bbmap (BBMap tools). Genotype calling was done using callvariants (BBMap tools) (callvariants.sh list=ref_turtle_rm.txt.align_samples out=turtle_total.vcf ref=ref_turtle.fasta ploidy=2 multisample=t rarity=0.05 minallelefraction=0.05 usebias=f ow=t nopassdot=f minedistmax=5 minedist=5 minavgmapq=15 minreadmapq=15 minstrandratio=0.0 strandedcov=t). The Variant Call Format (VCF) was filtered to remove alleles with a sample frequency of less than 3%. The final VCF was re-filtered and converted to other programs formats with the SNPfiltR (DeRaad, 2022) and PGDSpider software (Lischer and Excoffier, 2012), for subsequent coalescence-based (phylogeny) and allele frequency-based (genetic structure) analyses methods (see the VCF in the Dryad Digital Repository: https://doi.org/10.5061/dryad.h18931zp6). In all derived formats, we included variable and non-variable SNPs with the aim of improving the quantity and quality of the genetic information.
To obtain the database to be used in phylogenetic reconstruction analyses, the VCF was filtered in two ways to compare the statistical power of each generated dataset: (a) a first one allowing for the recovery of all the SNPs present throughout the samples, tolerating the maximum presence of missing data, and (b) a second one tolerating up to 10% of missing data among samples. However, in both datasets, the sample PC587 from Orinoco was removed by due to excessive missing data (~ 99%). Although the only three samples from the Amazon also had an excessive amount of missing data, these were retained in both datasets, since they had almost twice the information of sample PC587 after filtering, and they were also irreplaceable unique samples for that locality.
In addition, in order to reduce the samples with excess of missing data and redundant samples per population that could affect both the correct delimitation of evolutionary units in the phylogeny (based on multispecies coalescent) and also the computational performance, we selected between 3 and 4 representative samples per population following the recommendations of Leaché et al. (2014) for this type of approach. Except for the Amazon, the criterion for the selection of representative samples of each population for the phylogenetic analysis, was based on having the least amount of missing data in order to increase the accuracy and robustness of the inference.
On the other hand, for allele frequency-based (genetic structure) analyses, we only used dataset “b” (up to 10% missing data across samples), since it has been shown that the excessive presence of nonrandom missing data can bias Principal Component Analysis or associated metrics and inferences of population genetic structure (Yi and Latch, 2022).
Sequences were checked and edited manually with Geneious v10.0.9 (Kearse et al., 2012). Alignment to create consensus sequences was performed by using the integrated algorithm ClustalW (Thompson et al., 1994). Next, sequences were submitted to a BLAST search (Altschul et al., 1990) for verification and comparison with sequences available in GenBank, and then checked manually for insertions and deletions in Geneious v10.0.9.
We implemented a calibrated genealogy reconstruction analysis using the R35 Intron and the 35,507 SNPs matrix in a combined way, considering each dataset as one partition but with linked trees. For this purpose, we ran a Bayesian phylogenetic analysis in BEAST v1.8.2 (Drummond et al., 2012) using GTR+G as the best-fit evolutionary model inferred in jModelTest (Posada, 2008), an ‘log-normal relaxed clock model’ [substitution rate of 2.7x10⁻⁴ mutations per site per million year (Lourenço et al., 2013)] and a ‘Coalescent exponential growth’ as the tree prior. The remaining parameters were left as the default settings. We ran two independent runs of 50 million generations each with 10% burn-in, and convergence was checked in TRACER v1.7 (Rambaut et al., 2018). Next, log and tree files from each independent run were combined to produce a final dataset of 10,000 topologies by using LOGCOMBINER v2.5.0 (Bouckaert et al., 2019); this dataset was subsequently used to produce a maximum credibility tree in TREEANNOTATOR v2.5.0 (Bouckaert et al., 2019). Finally, the obtained ultrametric topology was visualized in FigTree v1.4.0 (Rambaut and Drummond, 2012).
Since the establishment/colonization age of a populations in a territory is directly related with their current levels of diversity and adaptive potential (Nei et al., 1975), consequently definning its priority for conservation, we implemented a spatiotemporal reconstruction of the ancestral area, dispersion routes (biogeographical portals) and colonization patterns of K. scorpioides between island and continent. A phylogeographic analysis using a Bayesian approach and the Relaxed Random Walk model, was run on BEAST v.1.8.2 (Drummond et al., 2012), in the CIPRES platform (Miller et al., 2010). We used the same dataset (intron + SNPs) for this approach, as described above. This method infers an evolutionary history in a continuum landscape based on the DNA sequences and the geographic coordinates (latitude and longitude of each sample), generating a genealogy and estimating the ancestral location of the internal nodes, considering uncertainties of the topology (Lemey et al., 2010). The substitution model selected was GTR+G, previously obtained from JModelTest (Posada, 2008). No ambiguities were used, since allele phasing has minimal impact on phylogenetic reconstruction from targeted nuclear genomic sequences (Kates et al., 2018). They were linked sites model and for the clock model, but not for the trees among loci. We used the uncorrelated log-normal relaxed clock model and coalescent exponential growth for the tree prior. For the temporal calibration of the phylogenetic tree, we used a substitution rate of 2.7x10⁻⁴ mutations per site per million year (Lourenço et al., 2013). Two independent runs where done, with a chain length of 50 million, sampled every 5,000 steps and a burn-in of 10%. Chain convergence, stationary behavior of the chains and Effective Sample Size (ESS) > 300, were examined in TRACER v.1.7.0 (Rambaut et al., 2018). Next, log and tree files from each independent run were combined to produce a final dataset of 10,000 topologies by using LOGCOMBINER v2.5.0 (Bouckaert et al., 2019); this dataset was subsequently used to produce a maximum credibility tree in TREEANNOTATOR v2.5.0 (Bouckaert et al., 2019). To generate spatiotemporal projections of the genealogies in keyhole markup language (kml), the software SpreaD3 v0.9.6 (Bielejec et al., 2016) was used, results that then were accessed and visualized on Google Maps (https://www.google.com/intl/es/earth/).
Considering that ESUs are defined as populations or groups of populations demonstrating significant divergence in allele frequencies (Dizon et al., 1992) or that are substantially reproductively isolated from other conspecific population units (Waples, 1991); several approaches were executed to test these principles using the SNPs dataset. First, we used STRUCTURE v.2.3.4 (Pritchard et al., 2000) to infer population genetic structure and admixture patterns among populations to test reproductive isolation, allowing us to examine the existence of biological groups within our sample. We conducted 20 independent runs for K = 1–6 by using 1,000,000 MCMC steps, a burn-in of 100,000 iterations and considering an admixture model and correlated frequencies. The α values and profile of posterior probabilities were examined to assess the convergence between independent runs. STRUCTURE Harvester (Earl and vonHoldt, 2012) was used to extract the Q values from each run for each K value, and then summarized in the program CLUMPP 1.1.2 (Jakobsson and Rosenberg, 2007). Finally, DISTRUCT v.1.1 (Rosenberg, 2004) was used to plot and visualize the obtained Q-matrix containing the ancestry probability of each individual in each predefined population. The ‘Evanno’ method (Evanno et al., 2005) and the Puechmille method (Puechmaille, 2016) were used to infer the most likely number of biological groups, using the web-based software StructureSelector (Li and Liu, 2018).
Patterns of genetic structure were further explored, performing a principal component analysis (PCA) and a discriminant analysis of principal component (DAPC) using the R- package ADEGENET (Jombart, 2008). These are dimensionality reduction methods used to transform and project data points onto fewer orthogonal axes that can explain the greatest amount of variance in the genetic data maximizing (DAPC) or not (PCA) the differences, helping with ESUs delimitation.
In addition, the genetic structure among geographical samples was calculated by the standardized pairwise FST (Meirmans, 2006 ), with 10,000 permutations and bootstraps, included in the Genepop v.1.1.7 R- package: “Population Genetic Data Analysis Using Genepop” (https://www.r-project.org, http://kimura.univ-montp2.fr/~rousset/Genepop.htm). When signals of genetic admixture between populations were observed through STRUCTURE or PCA/DAPC analyses, we quantified the gene flow in terms of the effective number of migrants per generation (Nm) between those populations (Muniz et al., 2018), using the program Migrate v3.6.11 (Beerli, 2006). For this purpose, we implemented the default model of free variation (*) for Theta and M parameters between populations, using exponential priors. The search strategy used static heating scheme with four chains at different temperatures (1.0, 1.5, 3.0, 1000000.0) and four replicates of one long chain with 50 million generations, discarding a burn-in of 5 million and sampling every 500 generations. To verify the convergence of parameter estimates, we examined the autocorrelation (<0.3), the effective sample size (ESS>500) and the correct distribution of the probability density plots for estimates of the parameters. To convert the scaled parameter “M” to biological data in terms of number of effective migrants (Nm), we assumed a conservative generation time of 28.2 years, estimated for Kinosternon members (Iverson et al., 2013); and a substitution rate for the SNPs of 2.7 × 10⁻⁴ mutations per site per million year (Lourenço et al., 2013).
In addition, to corroborate current gene flow among populations breaking the consistently congruent genealogical phylogenies (Avise, 1994), we analyzed the 10,000 genealogies from the above phylogenetic reconstruction, in DensiTree (Bouckaert et al., 2019), showing all variation over the Bayesian probability density of topologies among individuals from all populations.
The final VCF file was constructed from a total of 150,227,645 single-end reads (from 24 nextRAD libraries), with a read length average of 136.89 bp and a total quality average Phred Score of 39.5 for reads (Supplementary Material 1). After filtering and removing the PC587 sample, we recovered: (a) one dataset of 35,507 total SNPs (up to 98% missing data across samples), useful for inferences associated to phylogeographical reconstructions, and (b) one dataset of 383 SNPs (up to 10% of missing data across samples), useful for inferences associated to Bayesian population structure analysis, pairwise fixation index (FST), Principal Component Analysis (PCA), Discriminant Analysis of Principal Component (DAPC) and some demographic parameters as migration. In addition, we obtained 1,047 bp of the R35 gene Intron sequences for seven samples (two from the Amazon region, one from the Orinoco region and four from San Andrés), used to complement the robustness of the phylogeographical reconstruction analysis with the SNPs. These were submitted to Genbank as accession numbers ON738183 to ON738189.
The calibrated phylogenetic reconstruction analysis recovered a well-supported phylogeny of all K. scorpioides populations analyzed (Figure 2 and Supplementary Figure 1), showing a posterior probability for all nodes of the clade credibility tree >0.95. Each population represented independent monophyletic groups. The patterns of diversification showed San Andres Island as the more basal clade (7.9-8.76 Ma), followed by Amazon (2.38-3.22 Ma), and finally, a more recent Caribbean/Orinoco split (1.79-1.91 Ma).
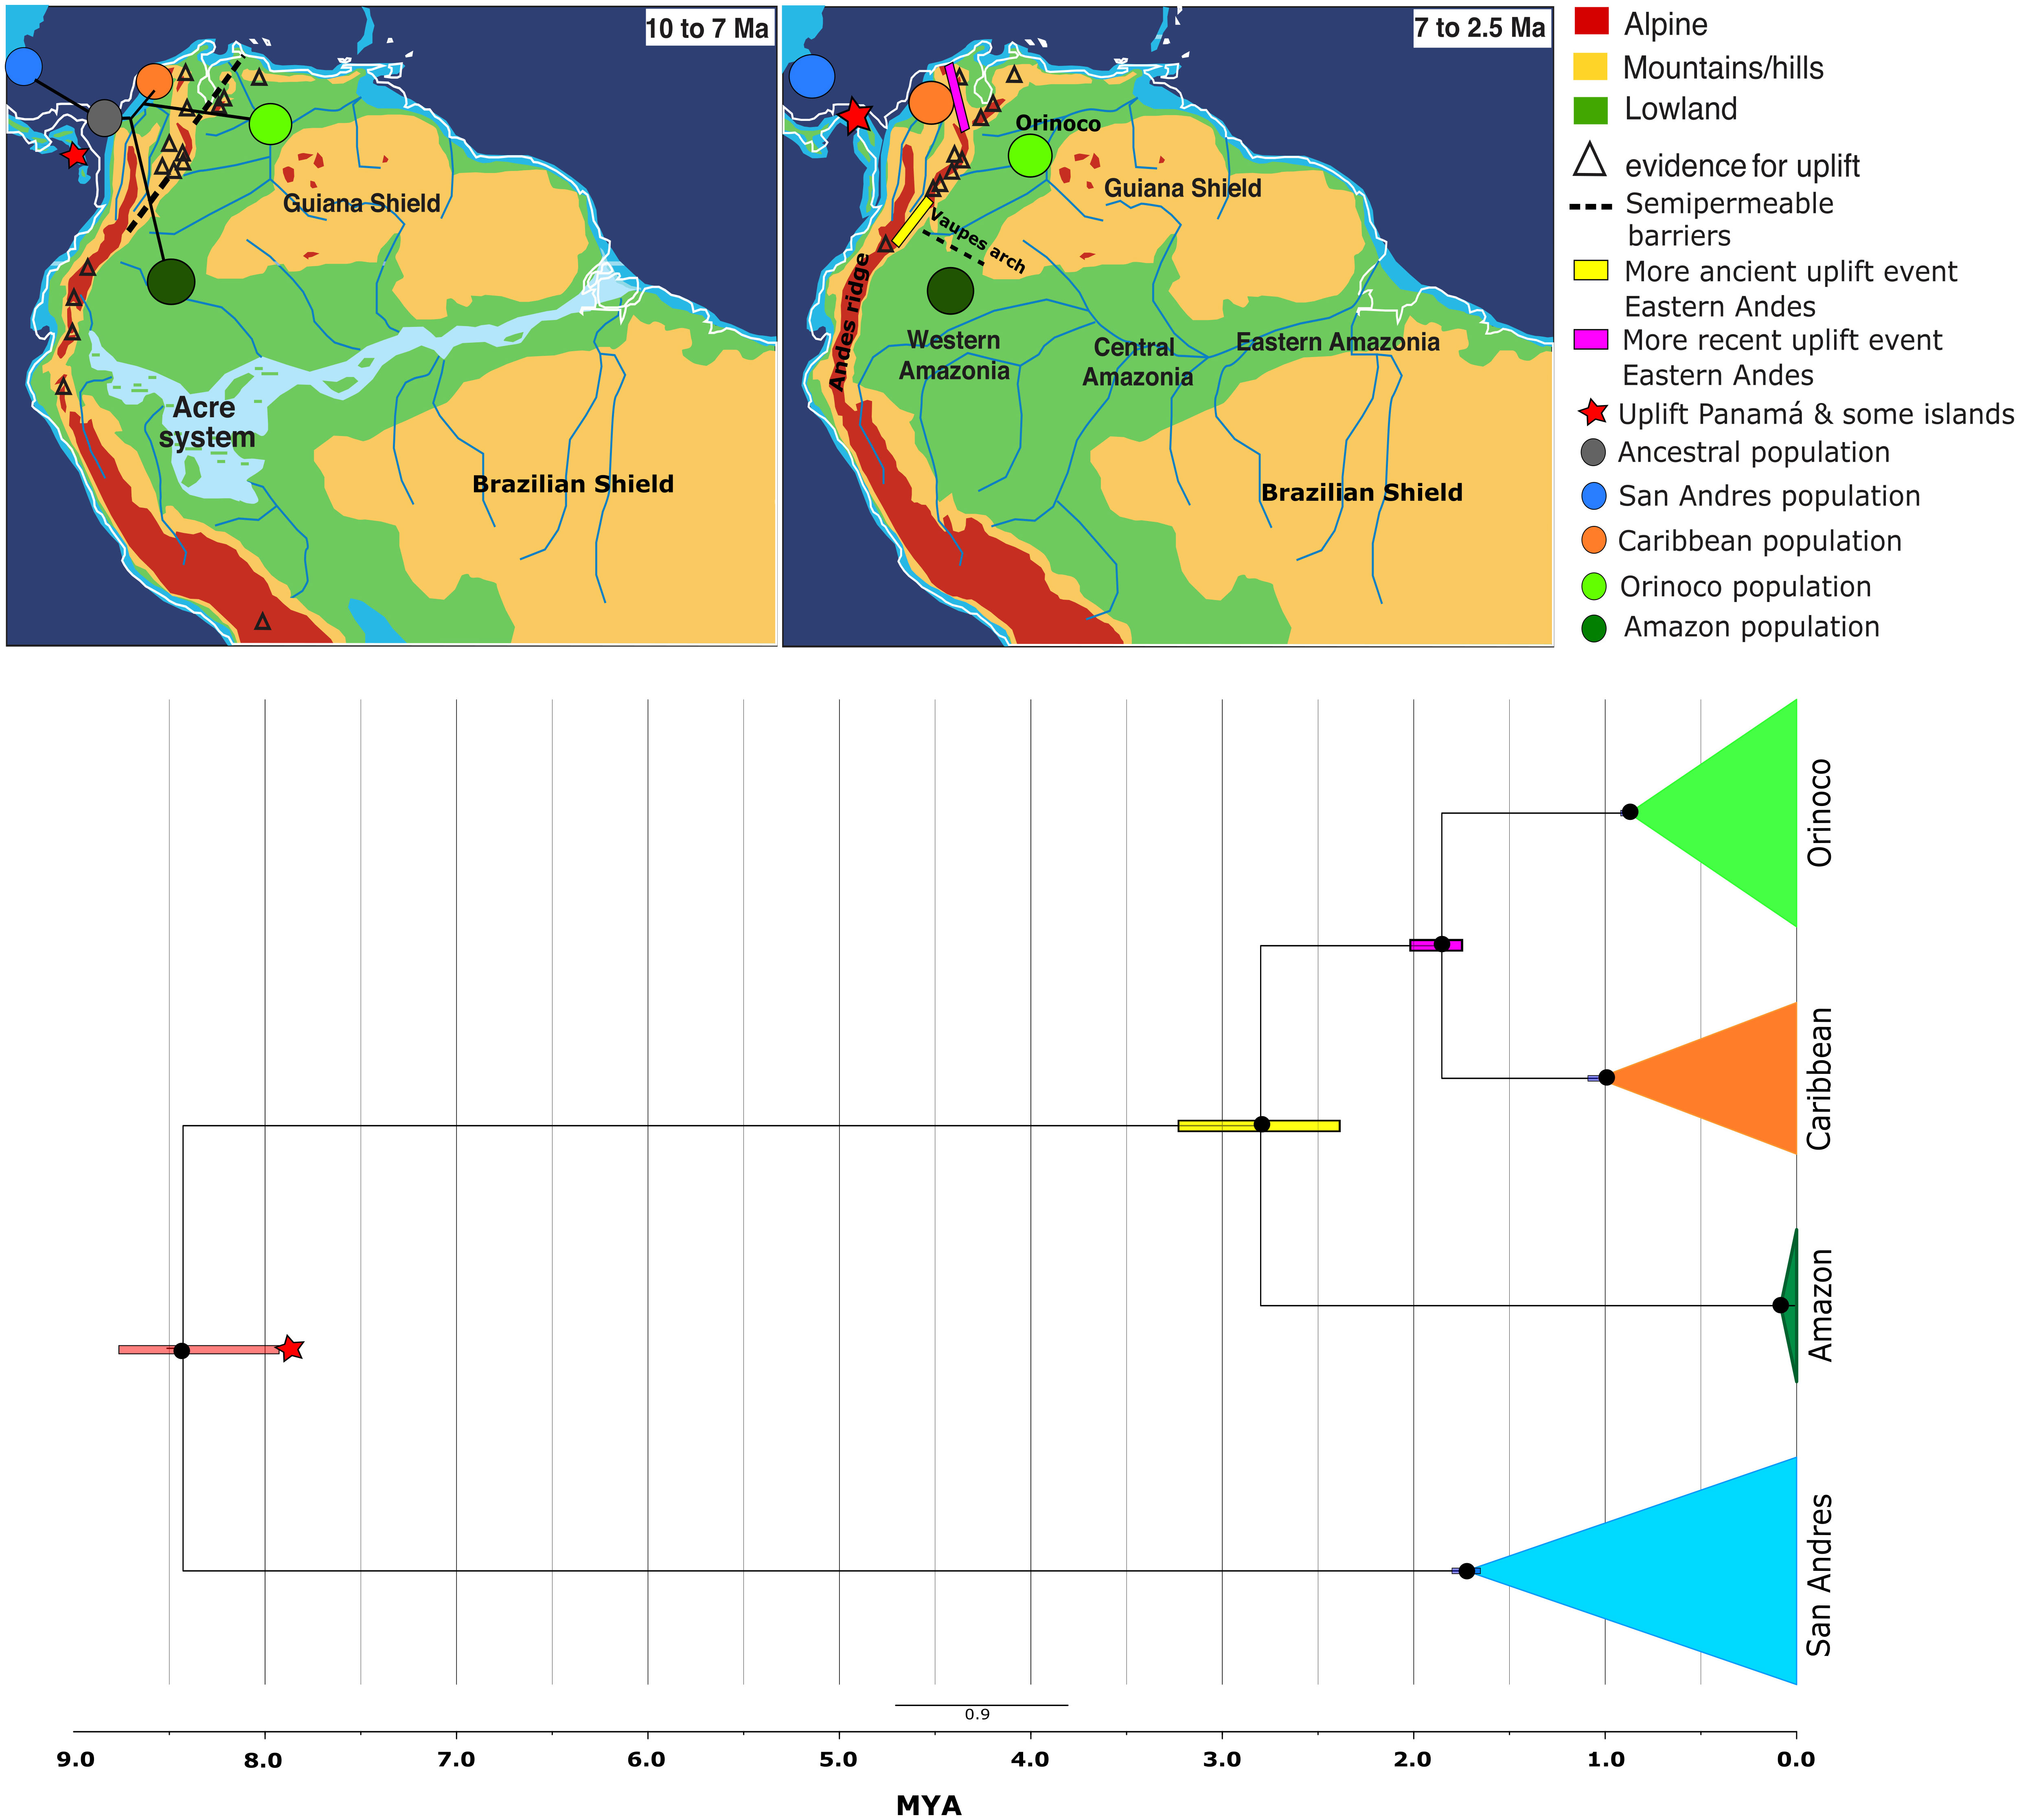
Figure 2 Bayesian time-calibrated Maximum Clade Credibility Tree inferred in BEAST v1.8.2, showing the phylogenetic reconstruction and ancestral relationship of Kinosternon scorpioides from insular (San Andrés) and continental (Caribbean, Orinoco and Amazon) Colombia, using RADseqs of 3-4 individuals per population with 35,507 SNPs containing <2% of missing data (except for Amazon, with >= 98% of missing data), combined with 1,047 bp of R35 Intron, estimated under a GTR+G model of molecular evolution. The observed times are median heights into 95% credibility intervals, calibrated from a nuclear DNA substitution rate of 2.7x10⁻⁴ mutations per site per million year (Lourenço et al., 2013). Black circles indicate nodes with supports ≥0.95 of posterior probability. Geographic map [modified from Hoorn et al. (2010)] showing all possible orogenic and biogeographical events occurring during 10 - 2.5 million years ago in the Neotropics, coinciding with the diversification of K. scorpioides in Colombia.
The Relaxed Random Walk (RRW) phylogenetic reconstruction (Figure 3) estimated that the most likely recent ancestral population for K. scorpioides was located in the continental region, between what is today Panamá and Caribbean coastal Colombia (Urabá) at ~ 8.43 Ma (Figure 3A). From there, this original population splits into two. One of these colonized San Andrés, at ~1.72 Ma (Figure 3B), and the second one, colonized an area in the trans-Andean piedmont, just southern of original ancestral population (Figure 3B). Subsequently, from this last place, a second split into two subpopulations occurred. The first one subpopulation began a long travel towards the Amazonian region, and while this was happening, the second one subpopulation reached the Caribbean area at ~1.04 Ma. From the Caribbean, a colonization began towards the Orinoco region, establishing there at ~0.87 Ma (Figure 3C). Once in Orinoco region, a rapid expansion occurred throughout this basin in a north-south direction of Colombia (Puerto Carreño  Tuparro National Park Sierra de La Macarena). Finally, K. scorpioides reached the Sierra de La Macarena at ~ 0.58 Ma (Figure 3D), a place that is known as the transition between the Andes mountains (Vaupés Arch, Andean Piedmont), Orinoco savannah and the Amazon rainforest ecosystems. Only much more recently did K. scorpioides finished its long journey from the trans-Andean region, and reached the Amazon region at ~0.1 Ma (Figure 3D).
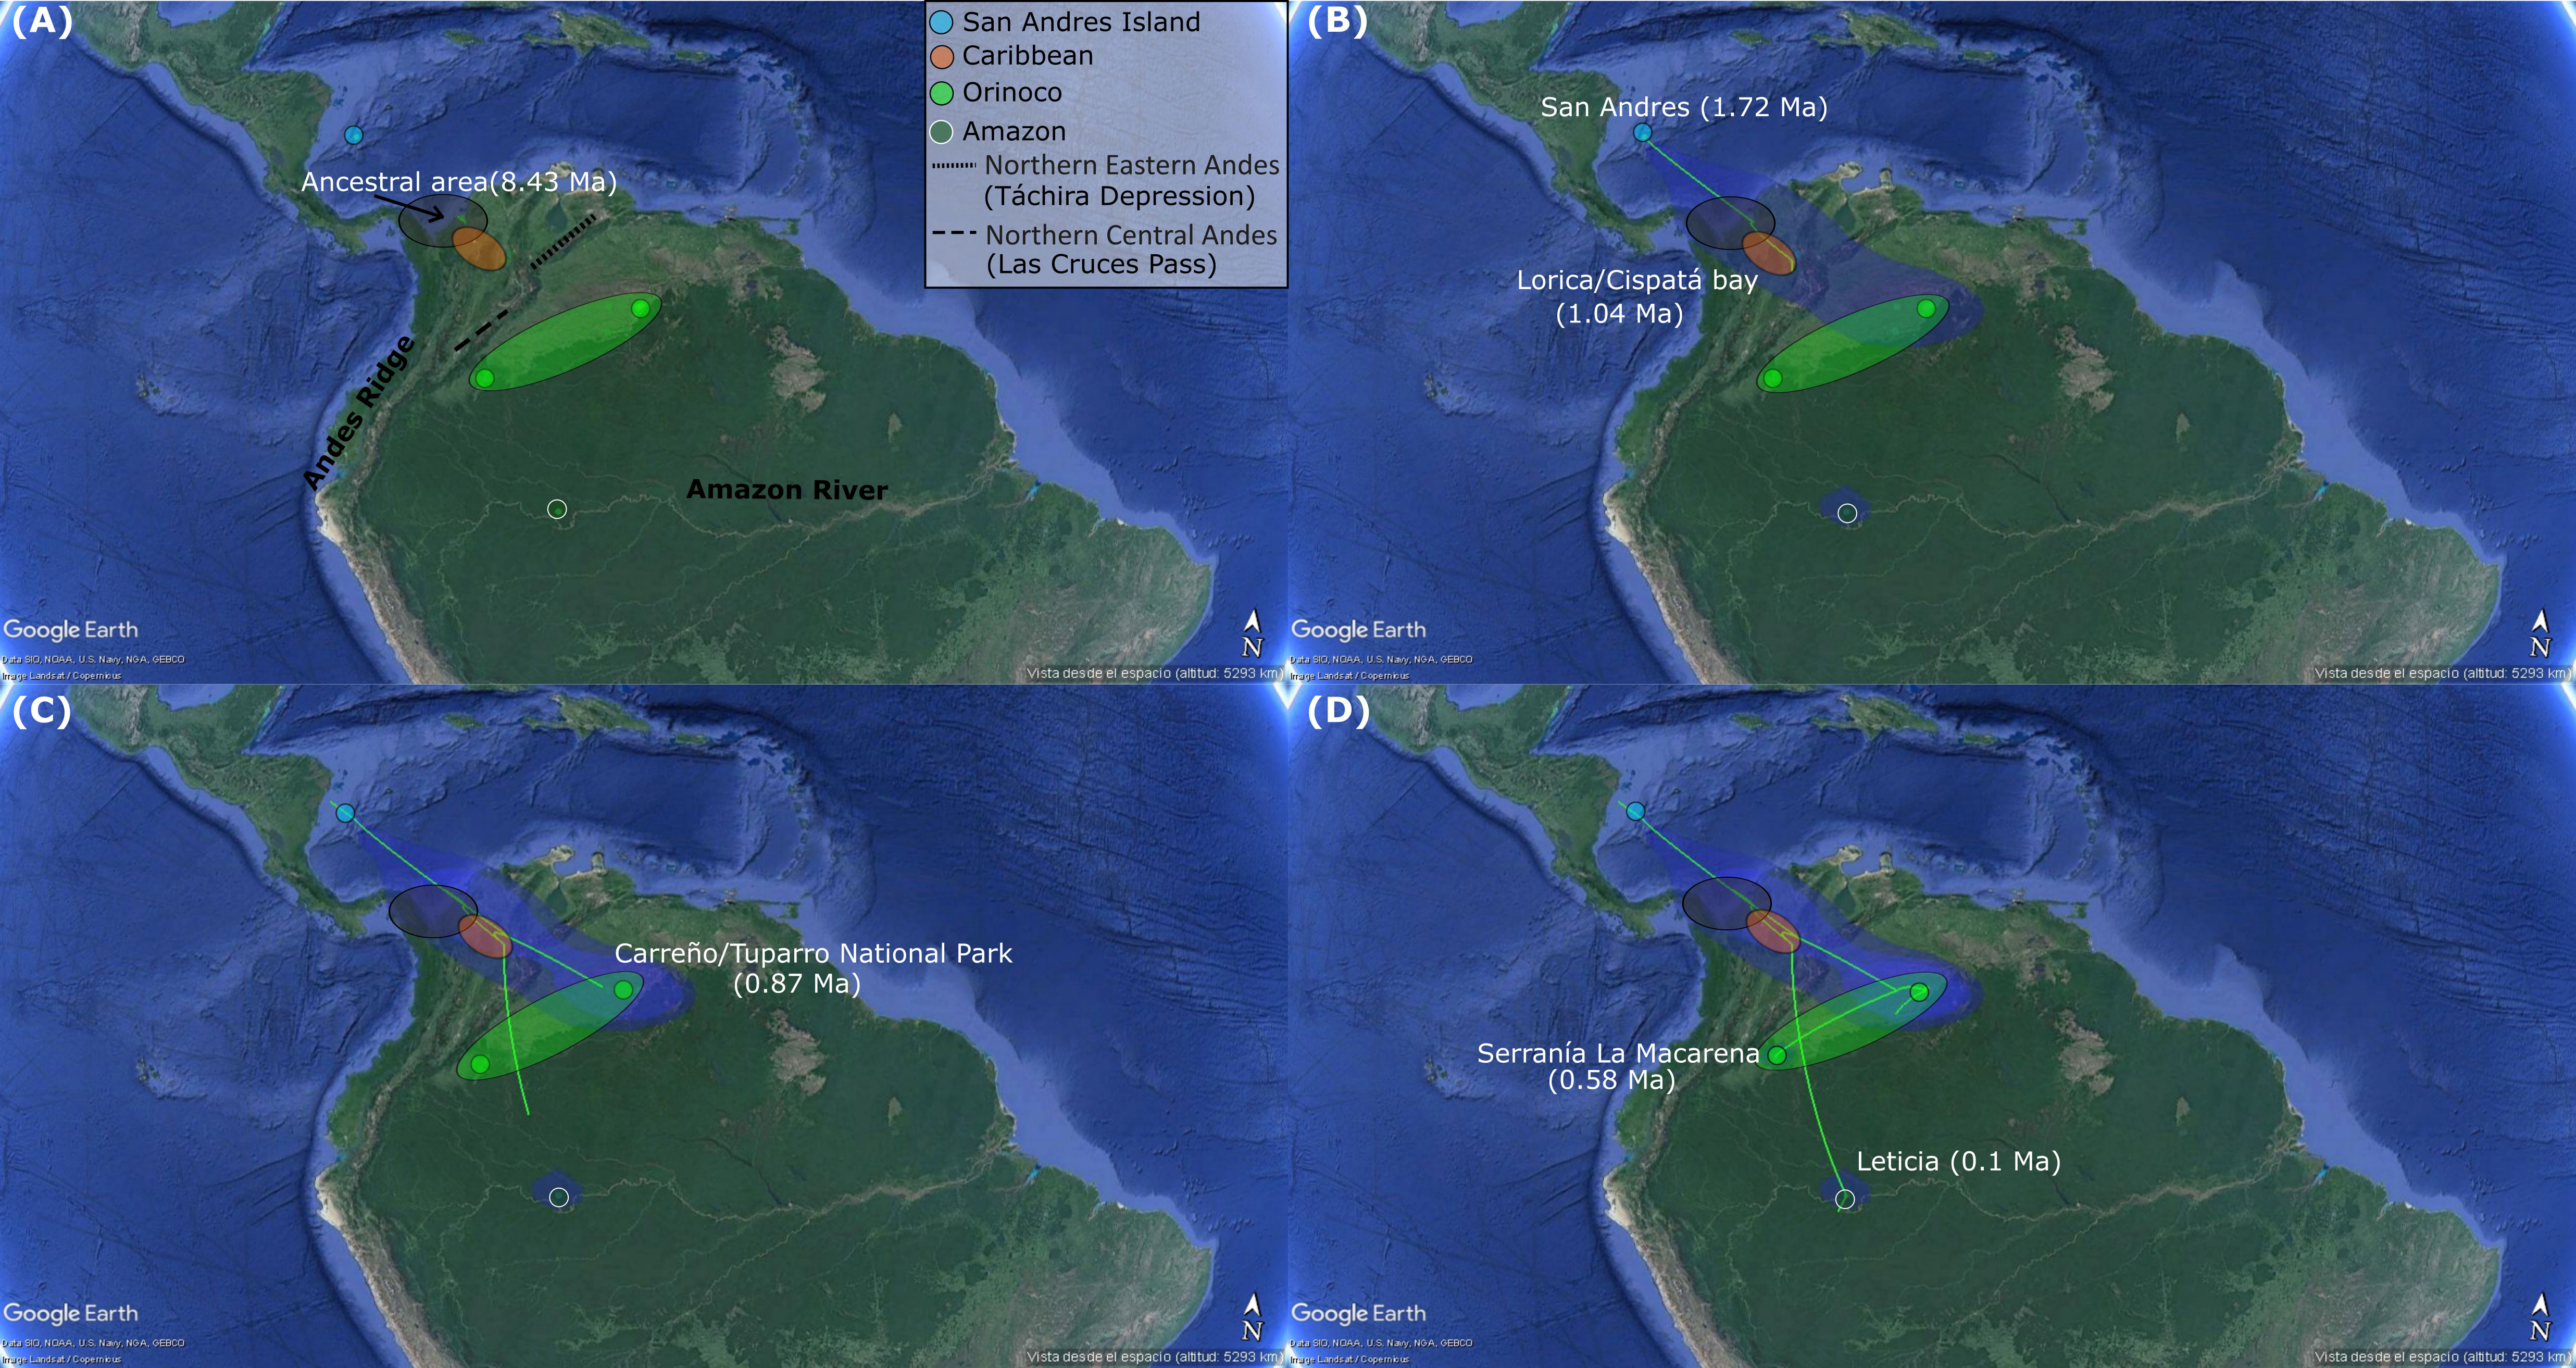
Figure 3 Spatiotemporal reconstruction analysis using nuclear RADseqs (35,507 SNPs) and 1,047 bp of R35 Intron, based on a Relaxed Random Walk analysis in continuous space and time for K. scorpioides populations from insular (San Andrés) and continental (Caribbean, Orinoco and Amazon) Colombia, inferred in BEAST v1.8.2 and SPREAD3, and visualized in GoogleMaps. Graph is showing the hypothetical ancestral area (gray circle) and the spatial patterns (green lines) of colonization/establishment and theirs ages, for K. scorpioides in each sampling region San Andrés (A), Caribbean (Lorica/Cispatá Bay) (B), Orinoco (Carreño-Tuparro National Park and Serranía La Macarena) (C), Amazon (Leticia) (D). All the observed colonization ages are median heights into 95% credibility intervals of the Bayesian Maximum Clade Credibility Tree topology used in the analysis.
Additional tests of phylogenetic reconstructions analyses using the dataset of 383 SNPs (<10% missing data across samples) were performed, but no well-supported genealogies were recovered for K. scorpioides populations, either using 3-4 representative samples per population (Supplementary Figure 2A) or all the 23 available samples (Supplementary Figure 2B).
For STRUCTURE analyses we reported all the possible genetic structure patterns from K=2 to K=6. Although K=6 obtained the best Mean LnP(K), it was identified K=2 as the most likely number of clusters according the Evanno method (ΔK) (Supplementary Figures 3A, B), grouping all samples from San Andrés (K. s. albogulare) in one cluster and all samples from the continent in a second one (Caribbean, Orinoco and Amazon regions) (see Figure 4A). When a hierarchical analysis was explored through K=3-6, we identified the Caribbean population as an independent cluster from Amazon and Orinoco (Figure 4A), showing four total clusters for the species, as corroborated by the Puechmille method estimators (Supplementary Figures 3C, D).
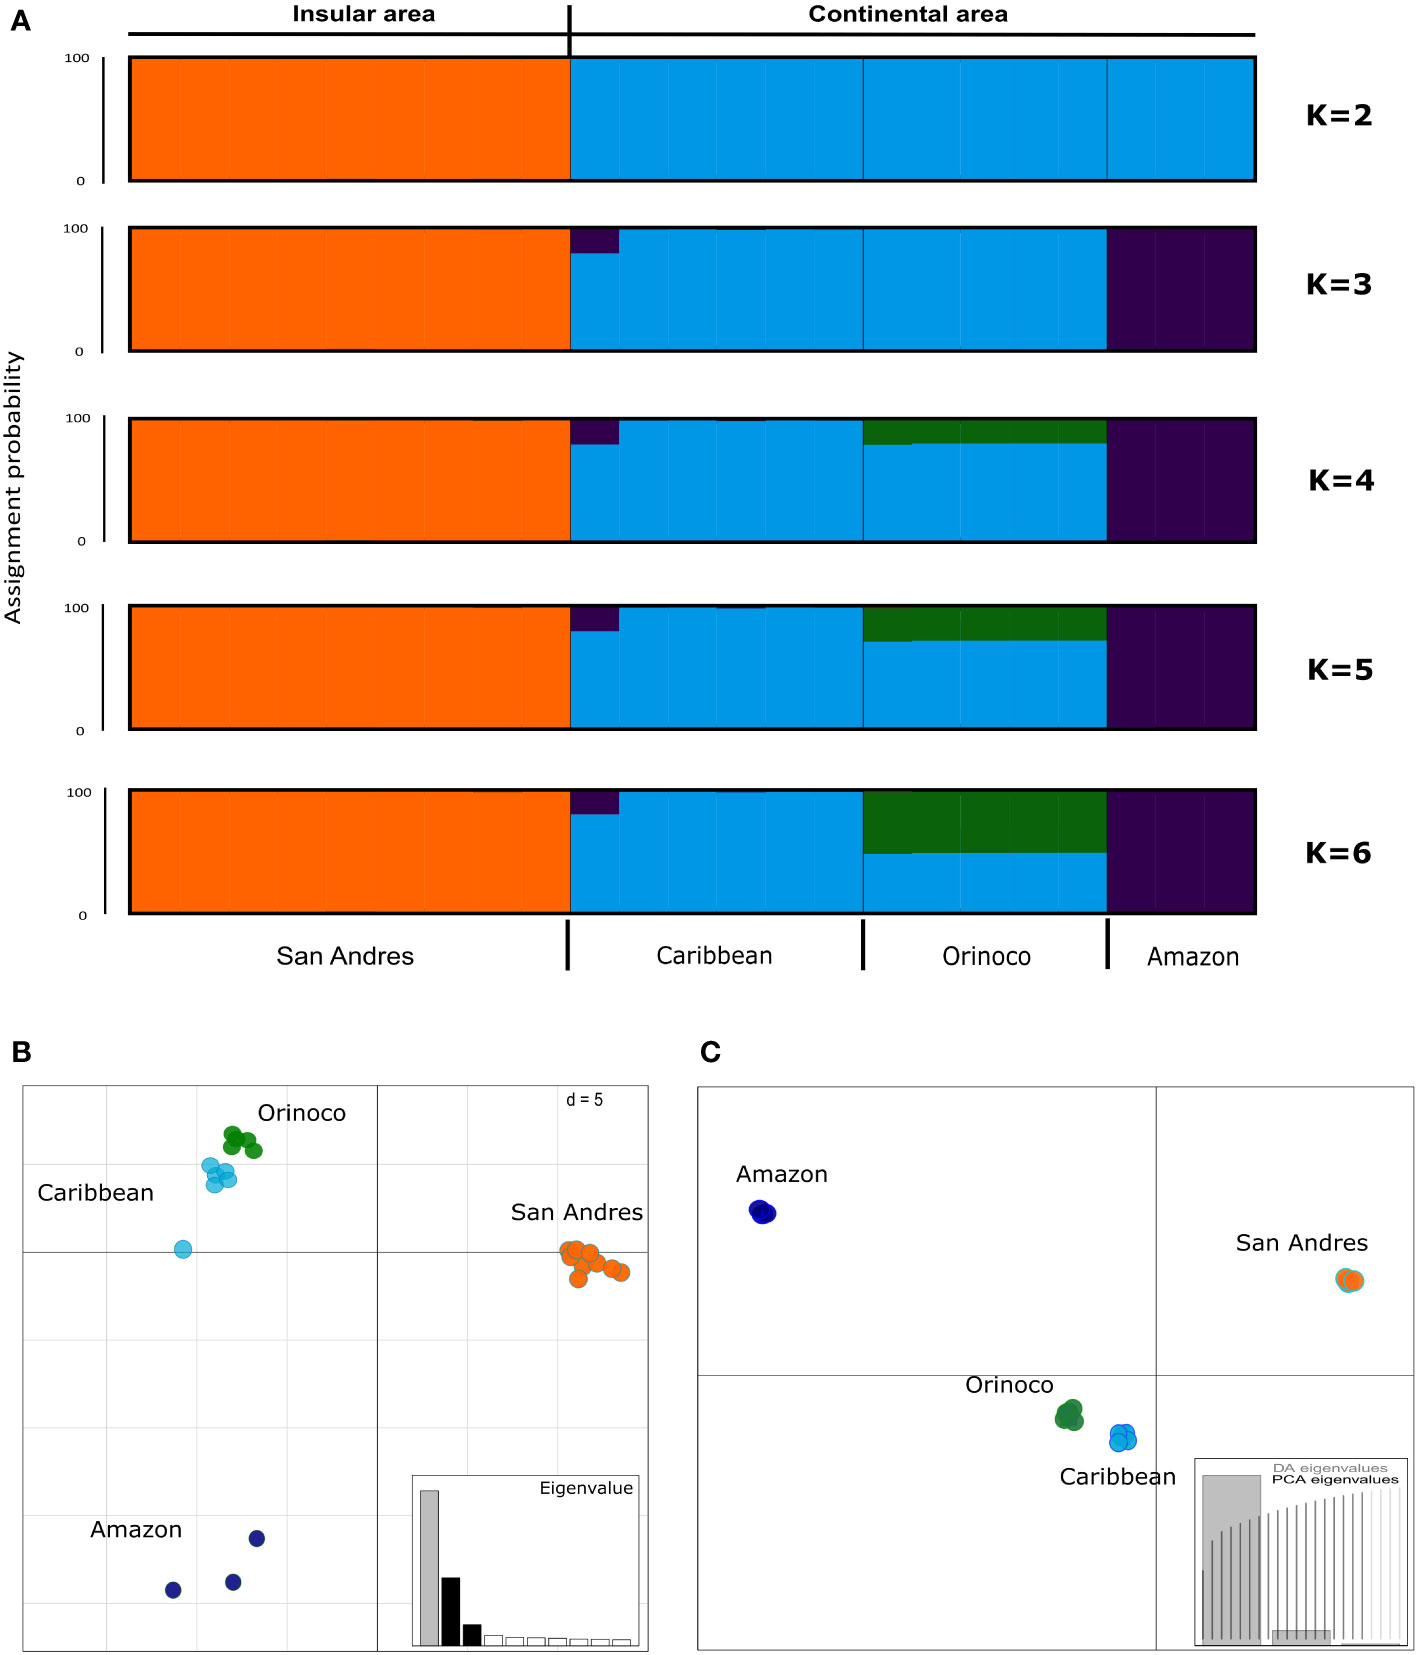
Figure 4 Population structure analysis in Kinosternon scorpioides from insular (San Andrés) and continental (Caribbean, Orinoco and Amazon) Colombia, inferred by (A) Bayesian (STRUCTURE), (B) Principal Component Analysis [PCA (ADEGENT)], and (C) Discriminant Analysis of Principal Component [DAPC (ADEGENET)] methods, using 383 SNPs for 23 samples with up to 10% of missing data. STRUCTURE plot is showing the probability of assignment of samples from two (K=2) to six (K=6) groups, being K=2 the more likely according Evanno, and K=4 according Puechmille. Each vertical bar represents one individual. The STRUCTURE (K=4), PCA and DAPC are showing four independent clusters (San Andrés, Caribbean, Orinoco and Amazon), however, with signals of co-ancestry or overlapping between Caribbean and Orinoco.
Further comparative analyses exploring the impact of the missing data and the sample number on the patterns of genetic structure, can be visualized in the Supplementary Figure 4.
Although a signal of co-ancestry was observed between Caribbean and Orinoco populations in STRUCTURE suggesting admixture, the PCA and DAPC confirmed the existence of four clusters (San Andres, Caribbean, Orinoco and Amazon), with two components, being the first of them explaining the highest amount of variance in the SNP data (see eigenvalues; Figures 4B, C, respectively). Similarly, after pairwise FST among geographical populations was calculated, these values were significant (p<0.05) for the differentiation between the Caribbean and Orinoco, and highly significant (p<0.001) for the remaining paired comparisons (Table 2).
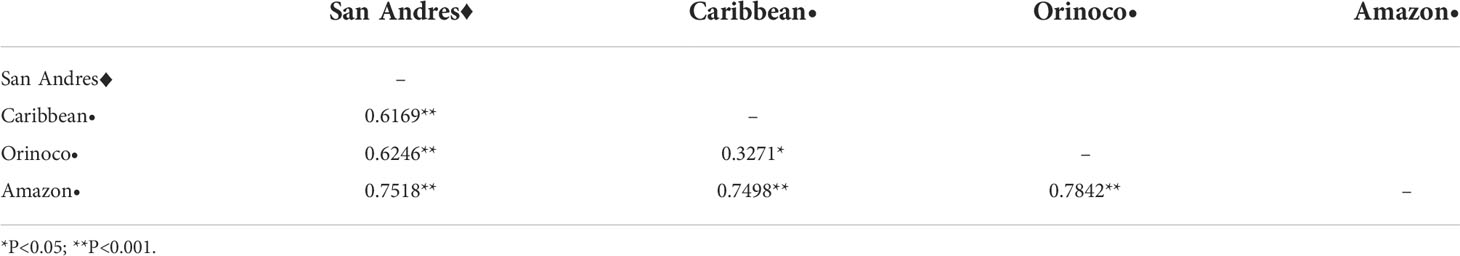
Table 2 Pairwise FST estimated among biogeographical populations of the mud turtle (Kinosternon scorpioides) dsitributed on the insular (•) and continental (♦) areas from Colombia, using 383 SNPs matrix with <10% of missing data across 23 samples.
The analysis in DensiTree did not show signals of any genealogy breaking the monophyly for individuals between populations or suggesting incomplete lineage sorting as a consequence of recent gene flow between Caribbean and Orinoco (Figure 5A). Likewise, Bayesian analysis in Migrate-n showed no current gene flow between Caribbean and Orinoco populations in either direction (Figures 5B, C), indicating less than 0.04 migrants per generation, or in other words, the existence of one migrant between them each ~33.3 generations (~940 years).
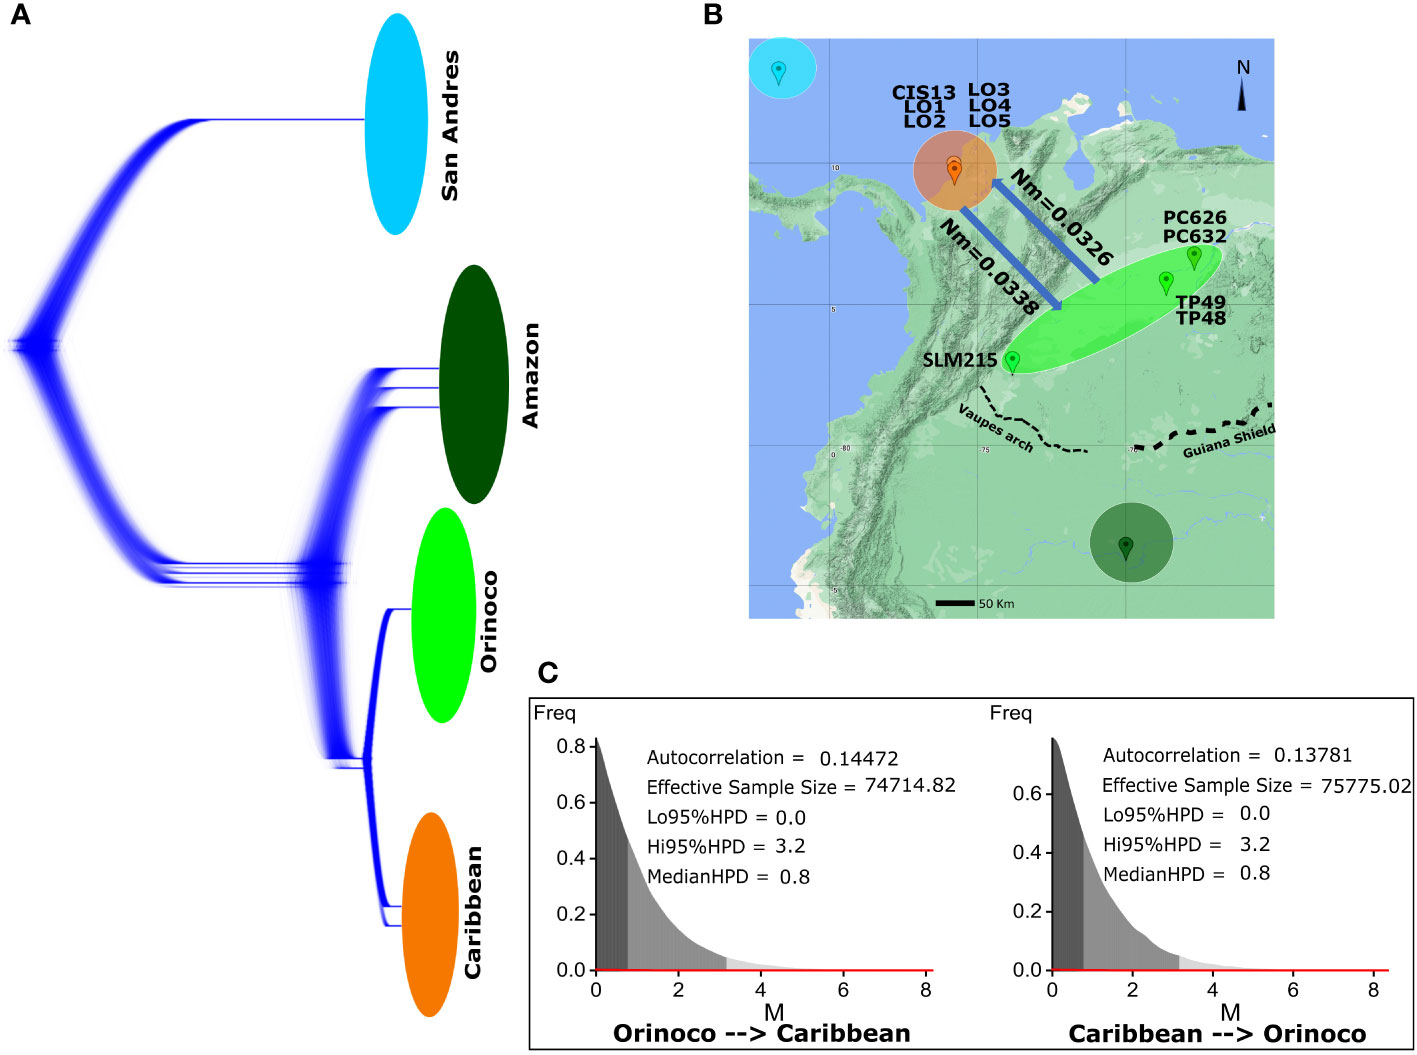
Figure 5 Gene flow analysis for K scorpioides populations that showed signals of admixture in STRUCTURE (Caribbean/Orinoco), using approaches based on analyses in DensiTree and Migrate. (A) DensiTree analysis of 10,000 genealogies reconstructed in BEAST v1.8.2 (derived from the calibrated phylogenetic tree analysis) showing all variation over the Bayesian probability density of topologies among individuals from all populations, looking for incomplete lineage sorting patterns generated by recent genetic interchange between individuals. (B) Biogeographical representation of the bidirectional gene flow in biological scale [number of migrants per generation (Nm)] between Caribbean and Orinoco populations. (C) Bayesian posterior distribution metrics for the migration “M” parameter (mutational scale) between populations, estimated under coalescent methods in the Migrate-n software.
This study presents the first information about the population structure and phylogeography of the freshwater turtle species Kinosternon scorpioides in Colombia, based on genomic analyses of more than 35,000 SNPs and 1,047 bp of the R35 Intron.
Our results support the presence of two currently accepted subspecies of K. scorpioides in Colombia, one (K. s. albogulare) on San Andrés island and a second one (K. s. scorpioides) on the continent (Morales-Betancourt et al., 2015). However, in the calibrated phylogenetic reconstruction, STRUCTURE, PCA, DAPC and FST analyses, three additional differentiated groups were detected within K. s. scorpioides. In this analysis, clear differentiation and substantial reproductive isolation was found among the Caribbean coast (northwest, trans-Andean), Amazon and Orinoco regions (east, cis-Andean).
Configuration and diversification age for K. scorpioides populations in this study, occurred from ~ 8 to 1.9 Ma (late Miocene-Pliocene-Pleistocene), coinciding with the greatest orogenic events described by Hoorn and Wesselingh (2011), Hoorn et al. (2010) and Albert et al. (2018) between ~10 - 2 Ma, shaping the diversity in the Neotropics: the uplift of the eastern Andes (10 – 2 Ma), the Panamá Isthmus/arch submergence and emergence (9 - 3 Ma) and Vaupés Arch final formation (8 - 5 Ma).
As expected, the temporal origin, distribution and establishment of those differentiated populations through Colombia, inferred in the Relaxed Random Walk reconstruction analysis, suggested the ancestral area of Kinosternon scorpioides in a trans-Andean region in the northern South American continent (>8 Ma), with later colonization of the insular region (San Andres) about 1.72 Ma. There are at least two hypotheses that try to explain the arrival of K. S. albogulare to the island of San Andrés. One hypothesis suggests a natural origin of the population, via colonization of the island from the Central American continent in times of low sea level during the Miocene (Iturralde-Vinent, 1999; Vargas-Cuervo, 2004; Kirby et al., 2008). This hypothesis is supported by our data. However, an alternative hypothesis exists, suggesting the introduction of these turtles from the Central American populations by indigenous communities and traders as recently as the 1600s (Dunn and Saxe, 1950in: Forero-Medina and Castaño-Mora, 2011).
According to O’Dea et al. (2016), between 9 and 6 Ma, rates of paleobathymetric change in sedimentary sequences reveal significant deepening across the Panama Arch, with posterior formation of the Isthmus of Panama sensu stricto around 2.8 Ma, allowing for faunal dispersion between South America and Central America (including its insular system). This was accompanied by a progressive and drastic decrease of eustatic sea-levels from 20 to 60 m (~2 – 1 Ma), coinciding with the establishing of K. scorpiodes in San Andres, and later in the Caribbean coast (1.04 Ma). Such results agree with the findings by Iverson et al. (2013), supporting a Mesoamerican origin of the family Kinosternidae, with the divergence of K. s. albogulare around ~ 8 - 4 Ma (in the late Miocene) and a later divergence of K. s. scorpioides around 6 – 2.5 Ma in the Pliocene.
However, an unexpected colonization pattern of cis-Andean populations was evidenced, mediated by more than one ancestor colonizing in independent events the north and south of cis-Andean populations (non-monophyletic pattern), through two different biogeographical portals. The first event occurred through Las Cruces Pass (Northern Central Andes) with later establishment in Amazon region; while the second one occurred through Mérida Cordillera at Táchira Depression (Northern Eastern Andes), with later expansion to the eastern lowlands of the Orinoco region. Both Las Cruces Pass and Táchira Depression, have been identified as biogeographical portals that, when closed, have generated allopatric speciation between trans- and cis-Andean ecoregions (Hazzi et al., 2018); as we are observing here for Kinosternon.
In fact, the differentiation of K. s. scorpioides in continental Colombia, giving origin to Orinoco cis-Andean population and Caribbean trans-Andean populations, could be related to vicariance events due to the uplift of the northern Andes and the Mérida Cordillera in the late Pliocene (5 - 3.4 Ma) (Diaz de Gamero, 1996; Audemard and Audemard, 2002). Most studies addressing this topic have identified the uplift of the northern Andes as a major driver for Neotropical diversification in a scenario consistent with allopatric speciation, wherein the complex topography of the Andes isolated populations on both sides of this barrier thus restricting gene flow (Brumfield and Capparella, 1996; Antonelli et al., 2009; Hoorn et al., 2010). Similar patterns of cis-Andean and trans-Andean population divergence resulting in speciation has been found in many vertebrates, including birds (Sedano and Burns, 2010; Arbeláez-Cortés, 2020), mammals (Patterson, 2020) and amphibians (Pirani et al., 2020).
However, we found divergence times shorter than 5-3.4 Ma for Caribbean Vs. Orinoco populations (1.9 Ma) and a very close genetic proximity (FST and variance in PCA/DAPC), suggesting that the northern eastern Andes uplift was not a definitive impermeable barrier at 3.4 Ma for K. scorpioides. Salgado-Roa et al. (2018) found similar divergences time between cis- and trans-Andean spider Gasteracantha cancriformis in Colombia [2.13 Ma], explained as a pattern of divergence in the presence of gene flow (because of its own dispersal ability), facilitated by remnants of low-elevation corridors along the Andes. In fact, they showed apparent evidence of admixture (STRUCTURE), suggesting no current reproductive isolation. However, Migrate-n analysis demonstrated that current gene flow does not actually exist between Caribbean and Orinoco populations. Therefore, one of the most plausible explanations for this admixture pattern is an isolation with retention of ancestral polymorphisms that can still be seen today, perhaps explained by the very slow generation time of the species preventing the rapid loss or fixation of new mutations by drift.
The Vaupés Arch fragmented the transcontinental paleo-Amazonas-Orinoco River about ~ 5 - 10 Ma (Hoorn et al., 1995), originating the final onset of the Amazon River during the Pleistocene (Reviewed in Albert et al., 2018), generating 61.2% exclusive Amazonian aquatic fauna and 16.6% exclusive Orinocan aquatic fauna. However, 22.2% are still shared between basins until the present, probably by the persistent connections between the Orinoco and Amazon basins via the Casiquiare Canal and other tributaries (Winemiller et al., 2008). However, these connections between Orinoco and Amazon are established through black water systems with extreme physical-chemical conditions, becoming a zoogeographic filter or barrier for many species that are not adapted to these conditions (Winemiller et al., 2008). This could be the case for K. scopioides, which inhabits whitewater bodies of the Amazon and Orinoco, so a Casiquiare-mediated connection would be unlikely for it at present, as reflected by the phylogeographical and genetic structure analyses.
All the characteristics that define an ESU are evidenced for each of the four sampled Colombian K. scorpioides populations. At present, we consider that our data provides support for the designation of what appear to be four Evolutionarily Significant Units (ESUs). Here, San Andres, Caribbean, Orinoco and Amazon populations show significant divergence of allele frequencies at nuclear loci (substantial reproductive isolation) and reciprocal monophyly (Moritz, 1994; Funk et al., 2012), that warrant separate management or priority for conservation because of high genetic distinctiveness and independent evolutionary trajectories (Funk et al., 2012).
The designation of four ESUs in Colombia, one for the population in San Andrés Island, and three in continental Colombia, one trans-Andean, in the Caribbean region, and two cis-Andean, in the Amazon and Orinoco regions, implies considering each of these as separate management units. Therefore, there is the need for separate management strategies for each of these units. For that reason, our recommendation to the environmental authorities in the country would be to work on independent population trend evaluations, as well as independent extinction risk analyses for each unit, aimed towards new risk categorization for these turtles in continental and insular Colombia.
Regarding the designation of the Amazon population as an ESU based on a small number of samples with a comparatively smaller number of SNPs and a high amount of missing data, we went deeper into the analyses of the 383 SNPs (and no missing data) dataset considered for this group and we found that 80 of these represented diagnostic sites, separating the Amazonian samples from all other samples from all other regions considered in our analyses. The presence of these diagnostic sites provides decisive support for this designation. Similar support for ESU or species designations for other reptile genus, for example geckos belonging in the genus Hemydactilus was based on a smaller dataset of 129 SNPs with no missing data (Leaché et al., 2014).
Population genetic theory predicts that recent colonization can result in reduced genetic diversity, known as founder effects; this in turn may lower the evolutionary potential and ultimately the ability of colonizing populations to establish and proliferate (Shirk et al., 2014). Therefore, special attention and additional studies to establish the population genetic diversity are needed for the cis-Andean ESUs, especially the one in the Amazon region, in terms of conservation priority, considering that it is the youngest population and recently established (accordingly Random Walk results).
According to the results, we believe that we present enough genomic information to support the designation of at least four new biological entities (species) within the genus, by upgrading K. s. albogulare to species level and designing the cis-Andean and trans-Andean K. s. scorpioides evidenced in our analyses as separate species. A species is a group of interbreeding natural populations that is reproductively isolated from other such groups [Biological Species Concept; (Mayr and Ashlock, 1991)], or, are defined as segments (subgroups) of population-level lineages [General Lineage Concept of Species (de Queiroz, 1998)]. Evidence supporting reproductive isolation and population-level lineages are presented here within the genus Kinosternon. Therefore, a full taxonomic revision of the genus is now recommended, as suggested by Spinks et al. (2014), including not only molecular data but also morphological information, as well as geographical range-wide taxon sampling, similar to the work done recently for the genus Chelus (Vargas-Ramírez et al., 2020).
The datasets presented in this study can be found in online repositories. The names of the repository/repositories and accession number(s) can be found below: DRYAD; https://doi.org/10.5061/dryad.h18931zp6.
Ethical review and approval was not required for the animal study because samples were obtained from environmental authorities directly, from their own population monitoring programs.
SC: designed study, laboratory work, statistical analyses, designed figures, wrote and edited manuscript. JM: Statistical analyses, designed figures, wrote and edited manuscript. MM-B: Field work, specimen collection, manuscript writing and editing. NB: Field work, specimen collection, manuscript edition. CL: designed study, field work, specimen collection, writing and manuscript editing.
The authors declare that this study received funding from a private donor (to Uniandes-LEMVA). The funder was not involved in the study design, collection, analysis, interpretation of data, the writing of this article, or the decision to submit it for publication
We thank D. Caicedo from Fundación Omacha for her help obtaining samples from Lorica, Córdoba Province. Other samples were obtained by Instituto Alexander von Humboldt through an MoU with Corporación para el Desarrollo Sostenible del Archipiélago de San Andrés, Providencia y Santa Catalina-Coralina (N° 005 de 2018; N° 18-125); Samples from the Caribbean, Amazon and Orinoco regions were obtained with the Ministerio de Ambiente y Desarrollo Sostenible (Resoluciones N° 0075 de 2015, 0081 de 2016, 013 de 2018); Samples from Serranía de la Macarena were obtained with Corporación para el Desarrollo Sostenible del Área de Manejo Especial la Macarena-Cormacarena (N° 18-096); Colciencias (FP44842-109-2016). Special thanks to the local community in San Andrés and Coralina personnel for their help with fieldwork (Thomas Downs, Ricardo Álvarez, Manuela Corrales) as well as Coralina Director (Dorsy Stephens) and subdirector (Thomas Hudson). We thank Fundación Omacha (Fernando Trujillo, Beyker Castañeda and Brayan Marín) for their help to conduct field work in RNBojonawi, Puerto Carreño, Orinoco region.
The authors declare that this study received funding from a private donor. The funder was not involved in the study design, collection, analysis, interpretation of data, the writing of this article, or the decision to submit it for publication.
The authors declare that the research was conducted in the absence of any commercial or financial relationships that could be construed as a potential conflict of interest.
All claims expressed in this article are solely those of the authors and do not necessarily represent those of their affiliated organizations, or those of the publisher, the editors and the reviewers. Any product that may be evaluated in this article, or claim that may be made by its manufacturer, is not guaranteed or endorsed by the publisher.
The Supplementary Material for this article can be found online at: https://www.frontiersin.org/articles/10.3389/fcosc.2022.938040/full#supplementary-material
Supplementary Figure 1 | Bayesian phylogenetic reconstruction of Kinosternon scorpioides from insular (San Andrés) and continental (Caribbean, Orinoco and Amazon) Colombia, using a matrix of 3-4 individuals per population with 35,507 SNPs containing <2% of missing data (except for Amazon individuals, with <= 98% of missing data), combined with 1,047 bp of R35 Intron, and estimated under a GTR+G model of molecular evolution. (A) DensiTree analysis across 10,000 genealogies. (B) Maximum Clade Credibility Tree with node supports based on the posterior probability.
Supplementary Figure 2 | Bayesian phylogenetic reconstruction of Kinosternon scorpioides from insular (San Andrés) and continental (Caribbean, Orinoco and Amazon) Colombia, using (A) a matrix of 3-4 individuals per population with 383 SNPs containing <10% of missing data, and (B) a matrix of 3-9 individuals per population with 383 SNPs containing <10% of missing data. Both trees were estimated under a GTR+G model of molecular evolution. Maximum Clade Credibility Trees are shown with node supports based on the posterior probability.
Supplementary Figure 3 | Visualization of the optimal number of clusters using multiple methods in the web-based software StructureSelector, after testing K=1-6 in STRUCTURE, for 23 samples of K. scorpioides from four Colombian populations (San Andres, Caribbean, Orinoco and Amazon). (A) Mean LnP(K), identifying K=6 as the most likely number of clusters. (B) Evanno method (ΔK), identifying K=2 as the most likely number of clusters. (C) Puechmille method estimators (MaxMed and MaxMean) showing K=4 as the most likely number of clusters.
Supplementary Figure 4 | Assessment about what impact the missing data is having on the population structure analysis in Kinosternon scorpioides from insular (San Andrés) and continental (Caribbean, Orinoco and Amazon) Colombia. (A) Bayesian analysis (STRUCTURE) and Principal Component Analysis using a matrix of 35,507 SNPs across 24 samples, tolerating up to 99% of missing data. (B) Bayesian analysis (STRUCTURE) and Principal Component Analysis using a matrix of 383 SNPs across 23 samples, tolerating up to 10% of missing data. (C) Cladogram reflecting the most likely phylogenetic hypothesis of Kinosternon scorpioides from insular (San Andrés) and continental (Caribbean, Orinoco and Amazon) Colombia, which serves as a predictive guide to the most likely coancestry patterns expected in STRUCTURE analyses for (A, B).
Albert J., Val P., Hoorn C. (2018). The changing course of the Amazon river in the neogene: center stage for Neotropical diversification. Neotrop. Ichthyol. 16, 1590. doi: 10.1590/1982-0224-20180033
Altschul S. F., Gish W., Miller W., Myers E. W., Lipman D. (1990). Basic local alignment search tool. J. Mol. Biol. 215, 403–410. doi: 10.1016/S0022-2836(05)80360-2
Antonelli A., Nylander J. A. A., Persson C., Sanmartín I. (2009). Tracing the impact of the Andean uplift on Neotropical plant evolution. Proc. Natl. Acad. Sci. U.S.A. 106, 9749–9754. doi: 10.1073/pnas.0811421106
Arbeláez-Cortés E. (2020). Defining the phylogeographic relationship between cis- and trans-Andean populations of Dendrocincla fuliginosa and Xenops minutus in Colombia. Rev. Mex. Biodiv. 91, e912984. doi: 10.22201/ib.20078706e.2020.91.2984
Arias C. F., Salazar C., Rosales C., Kronforst M. R., Linares M., Bermingham E., et al. (2014). Phylogeography of heliconius cydno and its closest relatives: Disentangling their origin and diversification. Mol. Ecol. 23 (16), 4137–4152. doi: 10.1111/mec.12844
Audemard F. E., Audemard F. A. (2002). Structure of the mérida Andes, Venezuela: relations with the south America-Caribbean geodynamics interaction. Tectonophysics 354, 299–327. doi; 10.1016/S0040-1951(01)00218-9
Avise J. C. (1994). Molecular markers, natural history and evolution (New York: Chapman and Hall). doi: 10.1007/978-1-4615-2381-9
Beerli P. (2006). Comparison of Bayesian and maximum-likelihood inference of population genetic parameters. Bioinformatics 22, 341–345. doi: 10.1093/bioinformatics/bti803
Bielejec F., Baele G., Vrancken B., Suchard M. A., Rambaut A., Lemey P. (2016). SpreaD3: Interactive visualization of spatiotemporal history and trait evolutionary processes. Mol. Biol. Evol. 33, 2167–2169. doi: 10.1093/molbev/msw082
Bouckaert R., Vaughan T. G., Barido-Sottani J., Duchêne S., Fourment M., Gavryushkina A., et al. (2019). BEAST 2.5: An advanced software platform for Bayesian evolutionary analysis. PloS Comput. Biol. 15, e1006650. doi: 10.1371/journal.pcbi.1006650
Brumfield R. T., Capparella A. P. (1996). Historical diversification of birds in northwestern south America: a molecular perspective on the role of vicariant events. Evolution 50, 1607–1624. doi: 10.1111/j.1558-5646.1996.tb03933.x
Chazot N., Willmott K. R., Condamine F. L., De-Silva D. L., Freitas A. V. L., Lamas G., et al. (2016). Into the Andes: Multiple independent colonizations drive montane diversity in the Neotropical clearwing butterflies godyridina. Mol. Ecol. 25 (22), 5765–5784. doi: 10.1111/mec.13773
Crandall K. A., Bininda-Emonds O. R. P., Mace G. M., Wayne R. K. (2000). Considering evolutionary process in conservation biology. Perspect. (Montclair). 15, 290–295. doi: 10.1016/S0169-5347(00)01876-0
de Queiroz K. (1998). The general lineage concept of species, species criteria, and the process of speciation. In (UK), 57–75.
DeRaad D. A. (2022). SNPfiltR: A r package for interactive and reproducible SNP filtering. Mol. Ecol. Res. 22 (6), 1–15. doi: 10.1111/1755-0998.13618
De-Silva D. L., Chazot N., Silva- K. L., Lamas G., Mallet J., Willmott K. R., et al. (2017). North Andean origin and diversification of the largest ithomiine butterfly genus. Sci. Rep. 7, 45966. doi: 10.1038/srep45966
Diaz de Gamero M. L. (1996). The changing course of the Orinoco river during the neogene: A review. Palaeoge. Palaeocl. Palaeoecol. 123, 385–402. doi: 10.1016/0031-0182(96)00115-0
Díaz S., Panzera F., Jaramillo-O N., Pérez R., Fernández R., Vallejo G., et al. (2014). Genetic, cytogenetic and morphological trends in the evolution of the rhodnius (Triatominae: Rhodniini) trans-Andean group. PloS One 9 (2), e87493. doi: 10.1371/journal.pone.0087493
Dizon A. E., Lockyer C., Perrin W. F., DeMaster D. P., Sisson J. (1992). Rethinking the stock concept: A phylogeographic approach. Cons. Biol. 6, 24–36. doi: 10.1046/j.1523-1739.1992.610024.x
Drummond A. J., Suchard M. A., Xie D., Rambaut A. (2012). Bayesian Phylogenetics with BEAUti and the BEAST 1.7. Mol. Biol. Evol. 29, 1969–1973. doi: 10.1093/molbev/mss075
Dunn E. R., Saxe L. H Jr. (1950). Results of the Catherwood-Chaplin West Indies Expedition, 1948. Part V. Amphibians and reptiles of San Andrés and Providencia. Proceedings of the Academy of Natural Sciences of Philadelphia, 141–65.
Earl D.A., vonHoldt B.M. (2012). STRUCTURE HARVESTER: A website and program for visualizing STRUCTURE output and implementing the Evanno method. Conserv. Genet. Res. 4, 359–61. doi: 10.1007/s12686-011-9548-7
Elias M., Joron M., Willmott K., Silva-BrandÃo K. L., Kaiser V., Arias C. F., et al. (2009). Out of the Andes: Patterns of diversification in clearwing butterflies. Mol. Ecol. 18 (8), 1716–1729. doi: 10.1111/j.1365-294X.2009.04149.x
Escalona T., Engstrom T. N., Hernandez O. E., Bock B. C., Vogt R. C., Valenzuela N. (2009). Population genetics of the endangered south American freshwater turtle, Podocnemis unifilis, inferred from microsatellite DNA data. Cons. Gen. 10, 1683–1696. doi: 10.1007/s10592-008-9746-3
Escobar M. D., Andrade-López J., Farias I. P., Hrbek T. (2015). Delimiting evolutionarily significant units of the fish, Piaractus brachypomus (Characiformes: Serrasalmidae), from the Orinoco and Amazon river basins with insight on routes of historical connectivity. J. Hered 106, 428–438. doi: 10.1093/jhered/esv047
Evanno G., Regnaut S., Goudet J. (2005). Detecting the number of clusters of individuals using the software STRUCTURE: A simulation study. Mol. Ecol. 14, 2611–2620. doi: 10.1111/j.1365-294X.2005.02553.x
Forero-Medina G., Castaño-Mora O. V. (2011). “Kinosternon scorpioides albogulare (Duméril and bocourt 1870) – white-throated mud turtle, swnaka turtle,” in Conservation biology of freshwater turtles and tortoises: A compilation project of the IUCN/SSC tortoise and freshwater turtle specialist group. chelonian research monographs no. 5. Eds. Rhodin A. G. J., Pritchard P. C. H., van Dijk P. P., Saumure R. A., Buhlmann K. A., Iverson J. B., Mittermeier R. A. (Chelonian Research Foundation), 064.1–064.5. Available at: http://www.iucn-tftsg.org/cbftt/. doi: 10.3854/crm.5.064.albogulare.v1.2011
Forero-Medina G., Castaño-Mora O. V., Pacheco A., Lasso C. A. (2015). Libro rojo de reptiles de colombi instituto de investigación de recursos biológicos Alexander von Humboldt (IAvH). Eds. Morales-Betancourt M. A., Lasso C. A., Páez V. P., Bock B. (Colombia., D. E: Universidad de Antioquia. Bogotá, D. C.), 176–179.
Fujita M. K., Engstrom T. N., Starkey D. E., Shaffer H. B. (2004). Turtle phylogeny: insights from a novel nuclear intron. Mol. Phyl. Evol. 31, 1031–1040. doi: 10.1016/j.ympev.2003.09.016
Funk W. C., McKay J. K., Hohenlohe P. A., Allendorf F. W. (2012). Harnessing genomics for delineating conservation units. Trends Ecol. Evol. 27, 489–496. doi: 10.1016/j.tree.2012.05.012
Guarnizo C. E., Paz A., Muñoz-Ortiz A., Flechas S. V., Méndez-Narváez J., Crawford A. J. (2015). DNA Barcoding survey of anurans across the eastern cordillera of Colombia and the impact of the andes on cryptic diversity. PloS One 10 (5), e0127312. doi: 10.1371/journal.pone.0127312
Hazzi N. A., Moreno J. B., Ortiz-Moviliav C., Palacio R. D. (2018). Biogeographic regions and events of isolation and diversification of the endemic biota of the tropical Andes. Proc. Natl. Acad. Sci. 115, 7985–7990. doi: 10.1073/pnas.1803908115
Hoorn C., Guerrero J., Sarmiento G. A., Lorente M. A. (1995). Andean Tectonics as a cause for changing drainage patterns in Miocene northern south America. Geology 23, 237–240. doi: 10.1130/0091-7613(1995)023<0237:ATAACF>2.3.CO;2
Hoorn C., Wesselingh F. (2011). Amazonia, Landscape and species evolution: A look into the past (Oxford, UK: Wiley-Blackwell, John Wiley & Sons).
Hoorn C., Wesselingh F. P., Steegem H., Bermudez M. A., Mora A., Sevink J., et al. (2010). Amazonia Through time: Andean uplift, climate change, landscape evolution and biodiversity. Science 330, 927–931. doi: 10.1126/science.1194585
Hua X., Wiens J. J. (2010). Latitudinal variation in speciation mechanisms in frogs. Evolution 64, 429–443. doi: 10.1111/j.1558-5646.2009.00836.x
Iturralde-Vinent M. A. (1999). Paleogeography of the Caribbean region: implications for Cenozoic biogeography. Bull. Am. Mus. Nat. His. 258, 95.
Iverson J. B., Le M., Ingram C. (2013). Molecular phylogenetics of the mud turtle and musk turtle family kinosternidae. Mol. Phyl. Evol. 69, 929–939. doi: 10.1016/j.ympev.2013.06.011
Jakobsson M., Rosenberg N. A. (2007). CLUMPP: A cluster matching and permutation program for dealing with label switching and multimodality in analysis of population structure. Bioinformatics 23, 1801–1806. doi: 10.1093/bioinformatics/btm233
Jombart T. 2008. ADEGENET: A R package for the multivariate analysis of genetic markers. Bioinformatics 24, 1403–5. doi: 10.1093/bioinformatics/btn129.
Kates H. R., Johnson M. G., Gardner E. M., Zerega N. J. C., Wickett N. J. (2018). Allele phasing has minimal impact on phylogenetic reconstruction from targeted nuclear gene sequences in a case study of Artocarpus. Am. J. Bot. 105, 404–416. doi: 10.1002/ajb2.1068
Kearse M., Moir R., Wilson A., Stones-Havas S., Cheung M., Sturrock S., et al. (2012). Geneious basic: an integrated and extendable desktop software platform for the organization and analysis of sequence data. Bioinformatics 28, 1647–1649. doi: 10.1093/bioinformatics/bts199
Kirby M. X., Jones D. S., MacFadden B. J. (2008). Lower Miocene stratigraphy along the Panama canal and its bearings on the central American peninsula. PLosOne 3, e2791. doi: 10.1371/journal.pone.0002791
Kohn M. H., Murphy W. J., Ostrander E. A., Wayne R. K. (2006). Genomics and conservation genetics. Trends Ecol. Evol. 21, 629–637. doi: 10.1016/j.tree.2006.08.001
Kozak K. H., Wiens J. J. (2006). Does niche conservatism promote speciation? a case study in north American salamanders. Evolution 60, 2604–2621. doi: 10.1111/j.0014-3820.2006.tb01893.x
Lasso C. A., Morales-Betancourt M A., Caballero S., Álvarez M., Downs T. (2018) (Bogotá, D. C., Colombia), 33. Estudio biológico de la tortuga Swanka, Kinosternon scorpioides albogulare (Duméril & Bocourt 1870), como especie bioindicadora de humedales en la isla de San Andrés, Archipiélago de San Andrés, Providencia y Santa Catalina. Informe interno, Convenio Corporación para el Desarrollo Sostenible del Archipiélago de San Andrés, Providencia y Santa Catalina-CORALINA (N° 005 de 2018) y el Instituto de Investigación de Recursos Biológicos Alexander von Humboldt (N° 18-125).
Leaché A. D., Fujita M. K., Minin V. N., Bouckaert R. R. (2014). Species delimitation using genome-wide SNP data. Syst. Biol. 63, 534–542. doi: 10.1093/sysbio/syu018
Lemey P., Rambaut A., Welch J. J., Suchard M. A. (2010). Phylogeography takes a relaxed random walk in continuous space and time. Mol. Biol. Evol. 27, 1877–1885. doi: 10.1093/molbev/msq067
Li Y. L., Liu J. X. (2018). StructureSelector: A web based software to select and visualize the optimal number of clusters using multiple methods. Mol. Ecol. Res. 18, 176–177. doi: 10.1111/1755-0998.12719
Lima F., Ribeiro C. (2011). “Continental-scale tectonic controls of biogeography and ecology,” in Historical biogeography of Neotropical freshwater fishes. Eds. Albert J. S., Reis R. (Berkeley, CA, USA: University of California Press), 145–164.
Lischer H. E. L., Excoffier L. (2012). PGDSpider: An automated data conversion tool for connecting population genetics and genomics programs. Bioinformatics 28, 298–299. doi: 10.1093/bioinformatics/btr642
Loc-Barragán J. A., Reyes-Velasco J., Woolrich-Piña G. A., Grünwald C. I., Venegas de Anaya M., Rangel-Mendoza J. A., et al. (2020). A new species of mud turtle of genus Kinosternon (Testudines: Kinosternidae) from the pacific coastal plain of northwestern Mexico. Zootaxa 4885, 509–529. doi: 10.11646/zootaxa.4885.4.3
López-Luna M. A., Cupul-Magaña F. G., Escobedo-Galván A. H., González-Hernández A. J., Centenero-Alcalá E., Rangel-Mendoza J. A., et al. (2018). A distinctive new species of mud turtle from western Mexico. Chel. Cons. Biol. 17 (1), 2–13. doi: 10.2744/CCB-1292.1
Lourenço J. M., Glémin S., Chiari Y., Galtier N. (2013). The determinants of the molecular substitution process in turtles. J. Evol. Biol. 26, 38–50. doi: 10.1111/jeb.12031
Mayr E., Ashlock P. K. (1991). Principles of systematic zoology McGraw-hill, inc (New York, USA: McGraw-Hill), 475.
Meirmans P. G. (2006). Using the AMOVA framework to estimate a standardized genetic differentiation measure. Evolution, 60 (11), 2399–402.
Miller M. A., Pfeiffer W., Schwartz T. (2011). The CIPRES science gateway: A community resource for phylogenetic analyses In Proceedings of the 2011 TeraGrid Conference: extreme digital discovery (Salt Lake City, Utah, USA: TeraGrid), 1–8
Morales-Betancourt M. A., Lasso C. A., Páez V. P., Bock B. (2015). Libro rojo de reptiles de colombi (Universidad de Antioquia. Bogotá, D. C., Colombia: Instituto de Investigación de Recursos Biológicos Alexander von Humboldt (IAvH).
Moritz C. (1994). Defining evolutionarily significant units for conservation. Trends Ecol. Evol. 9, 373–375. doi: 10.1016/0169-5347(94)90057-4
Moritz C. (1999). Conservation units and translocations: Strategies for conserving evolutionary processes. Hereditas 130, 217–228. doi: 10.1111/j.1605223.1999.00217
Muniz F. L., Campos Z., Hernández Rangel S. M., Martínez J. G., Souza B. C., De Thoisy R., et al. (2018). Delimitation of evolutionary units in cuvier’s dwarf caiman, Paleosuchus palpebrosus (Cuvie): insights from conservation of a broadly distributed species. Cons. Genet. 19, 599–610. doi: 10.1007/s10592-017-1035-6
Nei M., Maruyama T., Chakraborty R. (1975). Bottleneck effect and genetic variability in populations. Evolution 29, 1–10. doi: 10.1111/j.1558-5646.1975.tb00807.x
O’Dea A., Lessios H. A., Coates A. G., Eytan R., Restrepo-Moreno S. A., Cione A. L., et al. (2016). Formation of the isthmus of Panama. Sci. Adv. 2, 1126. doi: 10.1126/sciadv.1600883
Olivares A. M., Hrbek T., Escobar M. D., Caballero S. (2013). Population structure of the black arowana (Osteoglossum ferreirai) in Brazil and Colombia: Implications for its management. Cons. Genet. 14, 695–703. doi: 10.1007/s10592-013-0463-1
Patterson B. D. (2020). On drivers of Neotropical mammal diversification. Mastozoología Trop. 27, 15–26. doi: 10.31687/saremMN_SI.20.27.1.03
Pirani R. M., Peloso P. L. V., Prado J. R., Polo E. M., Knowles L. L., Rodriguez M. T., et al. (2020). Diversification history of clown tree frogs in Neotropical rainforest (Anura, hylidae, Dendropsophus leucophyllatus group). Mol. Phyl. Evol. 150, e106877. doi: 10.1016/j.ympev.2020.106877
Posada D. (2008). jModelTest: phylogenetic model averaging. Mol. Biol. Evol. 25, 1253–1256. doi: 10.1093/molbev/msn083
Pritchard J. K., Stephens M., Donnelly P. (2000). Inference of population structure using multilocus genotype data. Genetics 155, 945–959. doi: 10.1093/genetics/155.2.945
Puechmaille S. J. (2016). The program structure does not reliably recover the correct population structure when sampling is uneven: subsampling and new estimators alleviate the problem. Mol. Ecol. Resour. 16, 608–627. doi: 10.1111/1755-0998.12512
Pyron R. A., Burbrink F. T. (2010). Hard and soft allopatry: Physically and ecologically mediated modes of geographic speciation. J. Biogeogr. 37, 2005–2015. doi: 10.1111/j.1365-2699.2010.02336.x
Rambaut A., Drummond A. J., Xie D., Baele G., Suchard M. A. (2018). Posterior summarization in Bayesian phylogenetics using tracer 1.7. Syst. Biol. 67, 901–904. doi: 10.1093/sysbio/syy032
Rosenberg N. A. (2004). Distruct: A program for the graphical display of population structure. Mol. Ecol. Notes 4, 137–138. doi: 10.1046/j.1471-8286.2003.00566.x
Russello M. A., Waterhouse M. D., Etter P. D., Johnson E. A. (2015). From promise to practice: pairing non-invasive sampling with genomics in conservation. PeerJ 3, e1106. doi: 10.7717/peerj.1106
Salgado-Roa F. C., Pardo-Diaz C., Lasso E., Arias C. F., Nisaka-Solferini V., Salazar C. (2018). Gene flow and Andean uplift shape the diversification of Gasteracantha cancriformis (Araneae: Araneidae) in northern south America. Ecol. Evol. 8, 713–7142. doi: 10.1002/ece3.4237
Sedano R. E., Burns K. J. (2010). Are the northern Andes a species pump for Neotropical birds? phylogenetics and biogeography of a clade of Neotropical tanagers (Aves: Thraupini). J. Biogeogr. 37, 325–343. doi: 10.1111/j.1365-2699.2009.02200.x
Shirk R. Y., Hamrick J. L., Zhang C., Qiang S. (2014). Patterns of genetic diversity reveal multiple introductions and recurrent founder effects during range expansion in invasive populations of Geranium carolinianum (Geraniaceae). Heredity 112, 497–507. doi: 10.1038/hdy.2013.132
Spinks P. Q., Thomson R. C., Gidis M., Shaffer H. B. (2014). Multilocus phylogeny of the new-world mud turtles (Kinosternidae) supports the traditional classification of the group. Mol. Ecol. Evol. 76, 254–260. doi: 10.1016/j.ympev.2014.03.025
Stephens P. R., Wiens J. J. (2003). Explaining species richness from continents to communities: The time-for-speciation effect in emydid turtles. Am. Nat. 161, 112–128. doi: 10.1086/345091
Teixeira M., Prates I., Nisa C., Silva-Martins N. S. C., Strüssmann C., Rodrigues M. T. (2016). Molecular data reveal spatial and temporal patterns of diversification and a cryptic new species of lowland stenocercus duméril & bibro (Squamata: Tropiduridae). Mol. Phyl. Evol. 94 (Part A), 410–423. doi: 10.1016/j.ympev.2015.09.010
Thompson J. D., Higgins D. G., Gibson T. J. (1994). CLUSTAL W: Improving the sensitivity of progressive multiple sequence alignment through sequence weighting, position-specific gap penalties and weight matrix choice. Nuc. Ac. Res. 22, 4673–4680. doi: 10.1093/nar/22.22.4673
Turtle Taxonomy Working Group, Rhodin A. G. J., Iverson J. B., Bour R., Fritz U., Georges A., et al. (2021). “Turtles of the world: annotated checklist and atlas of taxonomy, synonymy, distribution, and conservation status, ninth edition,” in Chelonian Research Monographs, vol. 8, Eds. Rhodin A. G. J., Iverson J. B., van Dijk P. P., Saumure R. A., Buhlmann K. A., Pritchard P. C. H., Mittermeier R. A. (Chelonian Research Monographs), 1–472. doi: 10.3854/crm.8.checklist.atlas.v9.2021
Vargas-Cuervo G. (2004). Geología y aspectos geográficos de la isla de San Andrés, Colombia. Geol. Col. 29, 71–87.
Vargas-Ramírez M. (2017). “Reptiles,” in Recolección de tejidos biológicos para análisis genéticos. Eds. González M. A., Arenas-Castro H. (Bogota, Colombia: Instituto de Investigación de Recursos Biológicos Alexander von Humboldt, Bogotá), 25, 106823.
Vargas-Ramírez M., Caballero S., Morales-Betancourt M. A., Lasso C. A., Amaya L., Martínez J. G., et al. (2020). Genomic analyses reveal two species of the matamata (testudines: Chelidae: Chelus spp.) and clarify their phylogeography. Mol. Phyl. Evol. 148, 106823. doi: 10.1016/j.ympev.2020.106823
Waples R. S. (1991). Pacific salmon, oncorhynchus spp., and the definition of species under the endangered species act. Mar. Fish. Rev. 53, 11.
Willis S. C., Nunes M., Montaña C. G., Farias I. P., Ortí G., Lovejoy N. R. (2010). The casiquiare river acts as a corridor between the Amazonas and Orinoco river basins: biogeographic analysis of the genus Cichla. Mol. Ecol. 19, 1014–1030. doi: 10.1111/j.1365-294X.2010.04540.x
Winemiller K. O., López-Fernández H., Taphorn D. C., Nico L. G., Duque A. B. (2008). Fish assemblages of the casiquiare river, a corridor and zoogeographical filter for dispersal between the Orinoco and Amazon basins. J. Biogeo. 35, 1551–1563. doi: 10.1111/j.1365-2699.2008.01917.x
Wollenberg K., Marshall J., Bastiaans E., Caccone A., Camargo Betaberry A., Morando M., et al. (2019). Patterns, mechanisms and genetics of speciation in reptiles and amphibians. Genes 10, 646. doi: 10.3390/genes10090646
Keywords: Kinosternon scorpioides, RADseq, genomic analyses, Colombia, evolutionarily significant unit (ESU)
Citation: Caballero S, Martínez JG, Morales-Betancourt MA, Bolaños N and Lasso CA (2022) Genomic analyses of the scorpion mud turtle (Kinosternon scorpioides) (Linnaeus, 1766) in insular and continental Colombia: Evidence for multiple conservation and taxonomic units. Front. Conserv. Sci. 3:938040. doi: 10.3389/fcosc.2022.938040
Received: 06 May 2022; Accepted: 22 September 2022;
Published: 13 October 2022.
Edited by:
Arne Ludwig, Leibniz Institute for Zoo and Wildlife Research (LG), GermanyReviewed by:
Li Yu, Yunnan University, ChinaCopyright © 2022 Caballero, Martínez, Morales-Betancourt, Bolaños and Lasso. This is an open-access article distributed under the terms of the Creative Commons Attribution License (CC BY). The use, distribution or reproduction in other forums is permitted, provided the original author(s) and the copyright owner(s) are credited and that the original publication in this journal is cited, in accordance with accepted academic practice. No use, distribution or reproduction is permitted which does not comply with these terms.
*Correspondence: Susana Caballero, c2ouY2FiYWxsZXJvMjZAdW5pYW5kZXMuZWR1LmNv
†These authors share first authorship
Disclaimer: All claims expressed in this article are solely those of the authors and do not necessarily represent those of their affiliated organizations, or those of the publisher, the editors and the reviewers. Any product that may be evaluated in this article or claim that may be made by its manufacturer is not guaranteed or endorsed by the publisher.
Research integrity at Frontiers
Learn more about the work of our research integrity team to safeguard the quality of each article we publish.